
Proc. Natl. Acad. Sci. USA
Vol. 95, pp. 59–66, January 1998
Colloquium Paper
This paper was presented at a colloquium entitled ‘‘The Age of the Universe, Dark Matter, and Structure Formation,’’
organized by David N. Schramm, held March 21–23, 1997, sponsored by the National Academy of Sciences at the
Beckman Center in Irvine, CA.
Direct searches for dark matter: Recent results
L
ESLIE
J. R
OSENBERG
Department of Physics and Laboratory for Nuclear Science, Massachusetts Institute of Technology, Cambridge, MA 02139
ABSTRACT
There is abundant evidence for large
amounts of unseen matter in the universe. This dark matter,
by its very nature, couples feebly to ordinary matter and is
correspondingly difficult to detect. Nonetheless, several ex-
periments are now underway with the sensitivity required to
detect directly galactic halo dark matter through their inter-
actions with matter and radiation. These experiments divide
into two broad classes: searches for weakly interacting massive
particles (WIMPs) and searches for axions. There exists a very
strong theoretical bias for supposing that supersymmetry
(SUSY) is a correct description of nature. WIMPs are pre-
dicted by this SUSY theory and have the required properties
to be dark matter. These WIMPs are detected from the
byproducts of their occasional recoil against nucleons. There
are efforts around the world to detect these rare recoils. The
WIMP part of this overview focuses on the cryogenic dark
matter search (CDMS) underway in California. Axions, an-
other favored dark matter candidate, are predicted to arise
from a minimal extension of the standard model that explains
the absence of the expected large CP violating effects in strong
interactions. Axions can, in the presence of a large magnetic
field, turn into microwave photons. It is the slight excess of
photons above noise that signals the axion. Axion searches are
underway in California and Japan. The axion part of this
overview focuses on the California effort. Brevity does not
allow me to discuss other WIMP and axion searches, likewise
for accelerator and satellite based searches; I apologize for
their omission.
Most matter in the universe is invisible. The matter we can
easily identify—stars, dust, and gas—accounts for perhaps
10% of the mass density of the universe. That this missing
mass, dubbed dark matter, exists is well founded. Everywhere
this dark matter is expected to manifest itself, it does so. The
evidence for the existence of dark matter includes the flat
rotation curves of galaxies (even well beyond the clustered
luminous stars), flow maps of matter over huge distance scales,
and the gravitational shearing of starlight by this missing mass.
Today, only a curmudgeon would doubt the existence of dark
matter. However, the question of the nature of this dark matter
is still open. Thus, a major question in science today is as
follows: What is the nature of 90% of matter? The study of a
question this profound has many twists and turns and nuances.
A good starting point is the wonderful book by Kolb and
Turner (1).
The simplest answer, that this dark matter is dark normal
matter, runs against the very successful theory of primordial
nucleosynthesis. This theory describes the production of light
elements during the Big Bang and is in good agreement with
observed abundances. In particular, deuterium is weakly
bound. Most deuterium is produced in the Big Bang, and later
processing in stars mostly depletes the deuterium abundance.
Should dark matter be normal matter (that is, made up of
baryons), these extra baryons would have broken up deuterium
during the Big Bang and this would be reflected in a lesser-
then-observed present day deuterium abundance. This same
argument applies, though somewhat less strongly, to other light
isotopes. Although these nucleosynthesis constraints on the
amount of nonbaryonic matter have evolved and been refined
over the years, the conclusion seems robust: the missing mass
completely in the form of baryons is in conflict with our
understanding of the Big Bang. This argues that most of the
missing mass is some new exotic form of matter.
A hint as to the kind of exotic form of matter comes from
looking at structure in the universe, that is, the pattern of mass
scales we see. The structures we see evolved from seeds in the
early universe. Should the dark matter have been moving
relativistically during the epoch of structure formation (this
flavor of dark matter is dubbed HDM, hot dark matter), then
structures on relatively small scales would have been hard to
sustain. The dark matter would have eroded this high-spatial
frequency structure. On the other hand, should dark matter
have been moving slowly (dubbed CDM, cold dark matter),
then structure could form on small spatial scales. When we
look around the galaxy and evaluate how matter is formed into
structure, we see that the amount of matter clustered on small
spatial scales does not allow for the missing mass to be
substantially HDM. The majority of the missing mass must be
CDM to not wash out structure. Now, the exact mixture of
HDM, CDM, and perhaps a cosmological constant that best
fits the data is contentious. However, the need for substantial
amounts of CDM seems ubiquitous. The amount of dark
matter in our own halo is likewise contentious. There is some
irony that the fairly recent discovery of massive compact halo
objects (MACHOs) in our halo may cause us to rethink the
structure of our galaxy, with result the local density of non-
baryonic matter may actually increase. A recent paper, taking
into account the MACHO observations and other constraints,
allows for a broad range of densities near Earth, with the most
likely nonbaryonic density of 7.5
3 10
225
g
ycm
3
(2).
Among the candidates for CDM, the number one favorite
among theorists is WIMPs, and the number two is axions. The
other CDM candidates for whatever reason are met with less
favor. Both these CDM candidates are hard to detect; by its
very nature, CDM couples extraordinarily feebly to ordinary
matter and radiation. I should emphasize that the focus on
WIMPs and axions is a theoretical bias. There is no compelling
experimental validation for either theory. To the experi-
menter, the veracity of the theory that gives rise to WIMPs or
axions is untested.
© 1998 by The National Academy of Sciences 0027-8424
y98y9559-8$2.00y0
PNAS is available online at http:
yywww.pnas.org.
Abbreviations: WIMPs, weakly interacting massive particles; SUSY,
supersymmetry; CDMS, cryogenic dark matter search; CDM, cold
dark matter; BLIP, Berkeley large ionization and phonon detector;
FLIP, fast large ionization and phonon detector.
59
Despite the feeble couplings and the lack of evidence for the
underlying theories, several experiments are now underway
with the sensitivity required to detect directly galactic halo
dark matter through its interactions with matter and radiation.
These experiments divide into two broad classes: searches for
weakly interacting massive particles (WIMPs) and searches for
axions. There is a very strong theoretical bias for supposing
that supersymmetry (SUSY) is a correct description of nature.
WIMPs are predicted by this SUSY theory and have the
required properties to be dark matter (3). These WIMPs are
detected from the signals of an occasional recoil against
nucleons. There are efforts around the world to detect these
rare recoils. The WIMP part of this overview focuses on the
cryogenic dark matter search (CDMS) underway in California.
Axions are predicted to arise from a minimal extension of the
standard model that explains the absence of the expected large
CP violating effects in strong interactions (4). Axions can turn
into microwave photons in the presence of a large magnetic
field. It is the slight excess of photons above noise that signals
the axion. Axion searches are underway in California and
Japan. The axion part of this overview focuses on the Cali-
fornia effort. Brevity does not allow me to discuss other WIMP
and axion searches, likewise there is not space for accelerator
and satellite-based searches; these are important topics and I
apologize for their omission.
Searching for WIMPs
SUSY, the theory that predicts WIMPs, is really more a class
of theories than a specific theory (4). The theory does not do
a very good job of constraining what exactly the WIMP is, nor
does it do a very good job of constraining the WIMP mass, nor
does it do a very good job of constraining the WIMP couplings.
This makes the task of detection more difficult. However,
WIMPs too light would have been seen in accelerator exper-
iments. WIMPs too heavy are theoretically disfavored. WIMP
masses from perhaps 50 to 10,000 TeV are then reasonable
masses to suppose. Also, by positing the WIMPs density to
account for the missing mass, one can work backwards to the
early universe and roughly infer the strength of the WIMP
interactions. Experimenters look for by-products of the occa-
sional recoil of a WIMP against a nucleus. These by-products
include charge, light, heat, or some or all of the three. The
expected signal levels and signal rates are small. The back-
grounds of radioactive decays and cosmic rays are serious.
Several new high-sensitivity detectors are beginning to take
data around the world. These include CRESST (cryogenic rare
F
IG
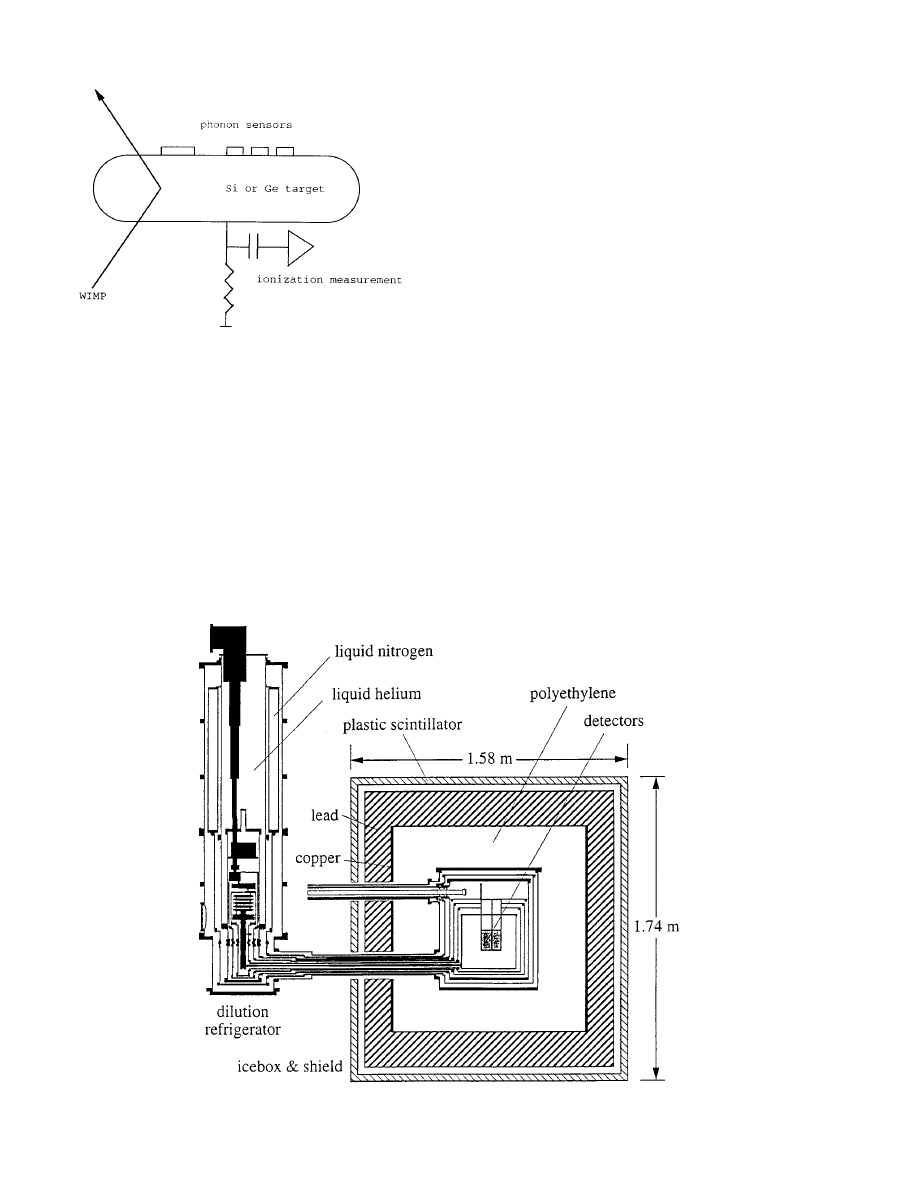
. 1. Principle of the CDMS detector. A Ge or Si crystal is
cooled to 20 mK and instrumented with charge and bolometric
detectors. A WIMP recoils off a nucleus, releasing phonons (heat) and
charge.
F
IG
. 2. Sketch of the ‘‘icebox’’ housing the CDMS detectors. The dilution refrigerator is shown to the left. The cold stage temperature is carried
within multiple heat shields to the box shown on the right. Removing the refrigerator from the experiment area reduces backgrounds from materials
in the refrigerator. The icebox is surrounded by plastic scintillation veto counters, as well as polyethylene neutron absorber.
60
Colloquium Paper: Rosenberg
Proc. Natl. Acad. Sci. USA 95 (1998)
event search with superconducting thermometers) in the Gran
Sasso tunnel, Italy; EDELWEISS in the Frejus tunnel, France;
CDMS in California; and a University of Tokyo group at
Nokogiriyama, Japan. The nuclear targets differ: CRESST has
sapphire; EDELWEISS has Ge; CDMS has either Ge or Si;
Tokyo has LiF. These operate at deep cryogenic temperatures
and require
3
He cooling. All are instrumented to look for the
heating associated with the nuclear recoil. The EDELWEISS
and CDMS efforts in addition are instrumented to look for the
associated ionization.
Example WIMP Search
Details of all the current experiments is well beyond the scope
of this paper. Instead, I’ll describe in some detail one state-
of-the-art WIMP search, the CDMS effort. This collaboration
is a group of scientists from Berkeley, Stanford, Santa Barbara,
Santa Clara, San Francisco State, Case Western, and else-
where. The principal of their detector is shown in Fig. 1. A
160-g Si [CDMS calls this FLIP (fast large ionization and
phonon detector)] or 60-g Ge [called BLIP (Berkeley large
ionization and phonon detector)] crystal is cooled to 20 mK
and instrumented with charge and bolometric detectors. A
WIMP recoils off a nucleus, releasing phonons (heat) and
charge. The charge is collected on electrodes, and the slight
heat rise is detected with superconducting sensors. CDMS has
two competing internal designs for these sensors: one uses a
more conventional neutron transmutation doped (NTD) sen-
sor. Another uses a transition edge sensor (TES) with SQUID
(superconducting quantum interference device) readout. The
SQUID readout allows the TES to be self-biased at the
operating point. They designs differ, also, in their response
time and position segmentation.
Assuming the electronics is sensitive to 5 keV or more
nuclear recoil, and assuming WIMPs saturate the local non-
baryonic dark matter density, the approximate WIMP recoil
rate is expected to be less than one detected recoil per target
kilogram per day. Hence the great advantage in simultaneously
measuring heat and charge; this allows for discrimination of
the rare WIMP recoils from
g and b backgrounds. Going lower
in recoil energy threshold increases the detected recoil rate but
increases the background rate. Going deeper underground
reduces cosmic ray induced backgrounds.
These detectors are mounted in the ‘‘icebox’’, sketched in
Fig. 2. The dilution refrigerator is shown to the left. The cold
stage temperature is carried within multiple heat shields to the
box shown on the right. Separating the refrigerator from the
experiment area reduces backgrounds from materials in the
refrigerator. The icebox is surrounded by plastic scintillation
veto counters, as well as polyethylene neutron absorber.
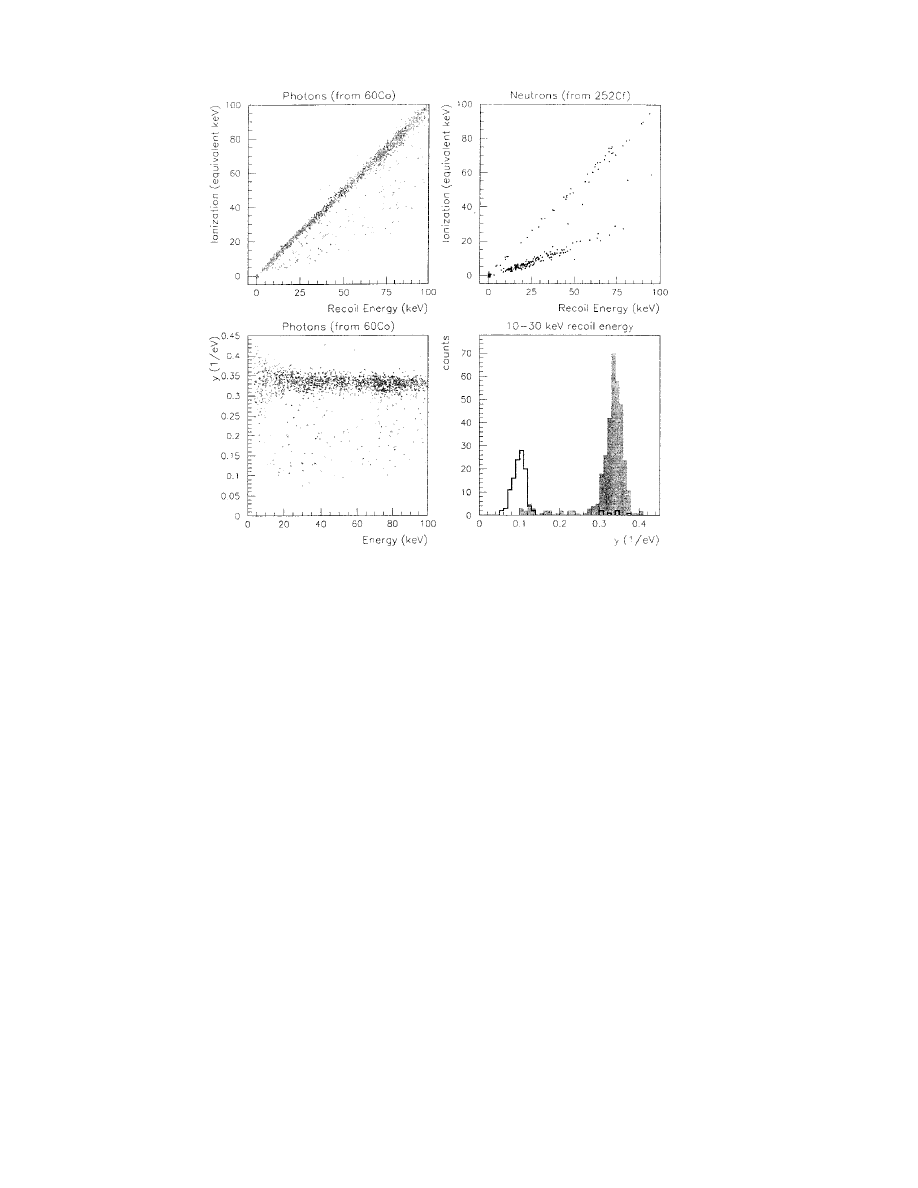
This background rejection, by way of the response to gamma
and neutron sources (in this case for the 60-g Ge BLIP
detector) is shown in the four frames of Fig. 3. Fig. 3 Upper Left
shows the detector response (vertical axis the ionization,
horizontal axis the bolometric recoil energy) to a
60
Co source
of photons. Fig. 3 Upper Right shows the response to a
252
Ca
neutron source. Notice that neutrons (meant to mimic nuclear
recoils) are less efficient ionizers than photons. Fig. 3 Lower
Left shows the
60
Co photon-induced charge normalized to the
bolometric recoil energy; this is the charge yield per keV of
recoil energy. Fig. 3 Lower Right shows this charge yield
distribution from the neutron and gamma source. Notice, at
least for these relatively large recoil energies, the separation of
neutron (signal-like) and gamma (background-type) recoils.
Also notice the distributions are non-Gaussian. At some point,
the CDMS group will consider background subtraction from
F
IG
. 3. The response of the 60-g Ge BLIP detector to gamma and neutron sources. (Upper Left) Detector response (vertical axis the ionization,
horizontal axis the bolometric recoil energy) to a
60
Co source of photons. (Upper Right) Response to a
252
Ca neutron source. Notice that neutrons
(meant to mimic nuclear recoils) are less efficient ionizers than photons. The lower left shows the
60
Co photon-induced charge normalized to the
bolometric recoil energy; this is the charge yield per keV of recoil energy. (Lower Right) The charge yield distribution from the neutron and gamma
source.
Colloquium Paper: Rosenberg
Proc. Natl. Acad. Sci. USA 95 (1998)
61
their signal region; the non-Gaussian nature of the background
is what makes this subtraction challenging.
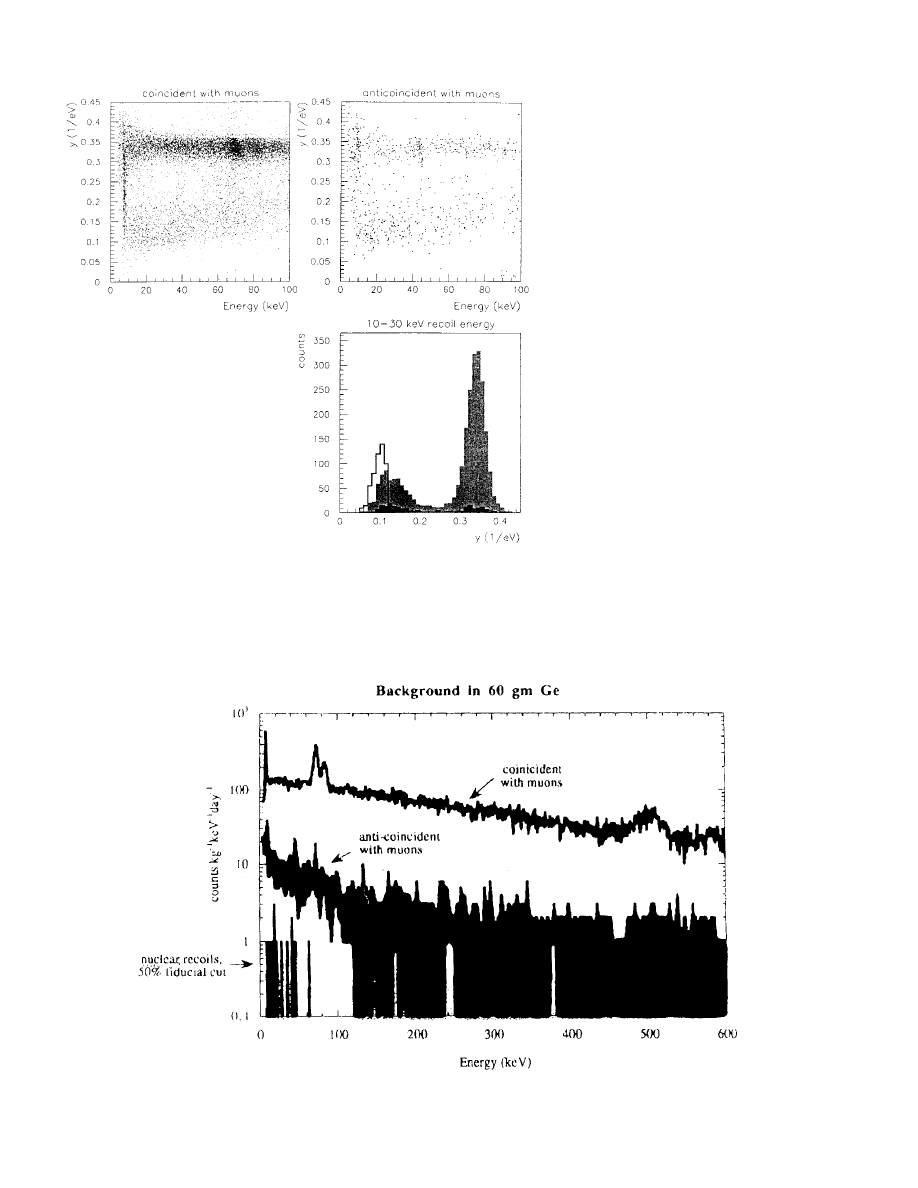
The in situ response of this same 60-g Ge BLIP detector
while in the low-background environment of the ice-box is
shown in Fig. 4. Fig. 4 Upper Left shows the charge yield vs.
recoil energy in coincidence with a muon signal. The dense
horizontal band represents photons and electrons associated
with the muons’ traversal. The lighter, broader, band just
below are likely muon-associated
b’s depositing their energy in
inefficient regions of the detector. Fig. 4 Upper Right shows the
same response, except in anti-coincidence with a muon signal.
Also shown in the band of charge yield where nuclear recoils
are expected to be. Notice that low background in the region
expected for WIMP nuclear recoils. Fig. 4 Lower Right shows
F
IG
. 4. The in situ response of the 60-g Ge BLIP
detector while in the low-background environment of
the ice-box. (Upper Left) The charge yield vs. recoil
energy in coincidence with a muon signal. The dense
horizontal band are photons and electrons associated
with the muons traversal. The lighter, broader, band
just below are likely muon-associated
b’s depositing
energy in inefficient regions of the detector. (Upper
Right) The same response, except in anti-coincidence
with a muon signal. Also shown in the band of charge
yield where nuclear recoils are expected to be. (Lower
Right) The distribution of charge yield in the recoil
energy region between 10 and 30 keV. Three distri-
butions are overlaid: (i) the highest number or counts
is from the muon-coincident data, (ii) the filled
distribution is the anti-coincident data, and (iii) the
neutron calibration is shown at the left.
F
IG
. 5. The background spectrum in the 60-g Ge BLIP detector. The horizontal axis is recoil energy, and the vertical axis is the count rate.
The upper distribution is the signal in coincidence with muons; lead fluorescence lines are seen to the left and the 511-keV line is seen at the right.
The middle distribution is the signal anti-coincident with muons. The lower distribution to the left is the remaining signal after demanding a charge
yield of less than 0.1
yeV and removing data from inefficient detector areas.
62
Colloquium Paper: Rosenberg
Proc. Natl. Acad. Sci. USA 95 (1998)
the distribution of charge yield in the recoil energy region
between 10 and 30 keV. Three distributions are overlaid: (i)
the highest number of counts is from the muon-coincident
data, (ii) the filled distribution is the anti-coincident data, and
(iii) the neutron calibration is shown at the left.
The background spectrum in the 60-g Ge BLIP detector is
shown in Fig. 5. The horizontal axis is recoil energy, and the
vertical axis is the count rate. The upper distribution is the
signal in coincidence with muons; lead fluorescence lines are
seen to the left and the 511-keV line is seen at the right. The
middle distribution is the signal anti-coincident with muons.
The lower distribution to the left is the remaining signal after
demanding a charge yield of less than 0.1
yeV and removing
data from inefficient detector areas.
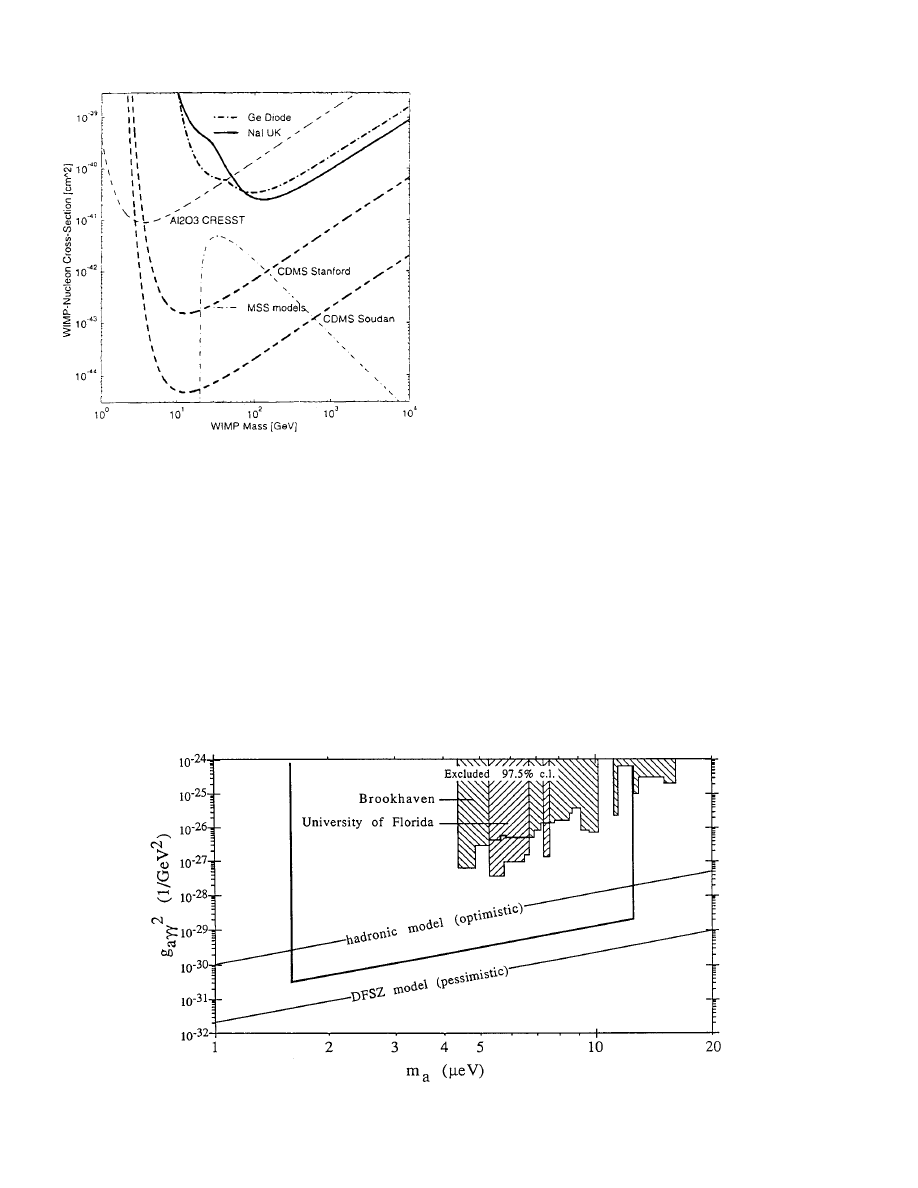
These data, in context with other experiments and the
expected WIMP recoil signal, are shown in Fig. 6. The
horizontal axis is WIMP mass, and the vertical axis is the
WIMP cross section. The two curves at the top are existing
limits. Although not released by the CDMS collaboration, I
estimate their present sensitivity at about or slightly better than
the two existing limits. This is impressive, considering the
CDMS data is 30 fiducial g with 21-day exposure, and the ‘‘Ge
Diode’’ (data from the Oroville detector) result is from 0.9
fiducial kg with 146-day exposure. The small sample of CDMS
data is even now competitive with the long ‘‘Ge Diode’’
production run. Somewhat lower down is ‘‘CDMS Stanford,’’
the anticipated ultimate sensitivity of the CDMS detector in
the Stanford shallow site. And somewhat lower is the ‘‘CDMS
Soudan’’ ultimate projected sensitivity at a deep Soudan mine
site. Also notice the curve ‘‘CRESST,’’ the projected sensitiv-
ity of the European sapphire detector. The curve labeled ‘‘MSS
models’’ gives an estimate for the expected cross sections of
SUSY-motivated WIMPs. Notice that current experiments are
beginning to push into the region of plausible WIMP cou-
plings.
Searching for Axions
The other broad class of CDM searches look for axions. Axions
arise as part of a simple extension of the standard model that
explains the lack of expected CP violating effects in strong
interactions. The axion would be a pseudoscalar, similar in
properties to the neutral pion. Originally, the scale attached to
axion physics was taken as the weak scale. This predicted
relatively heavy axions (several hundred keV) with couplings
to normal matter and radiation that would permit them to be
seen in conventional nuclear and particle physics experiments.
This weak scale axion was not seen. Theorists then built models
attached to much greater energy scales, with correspondingly
smaller masses and couplings to matter and radiation. At these
F
IG
. 6. Preliminary CDMS data in context with other experiments
and the expected WIMP signal. The horizontal axis is WIMP mass, the
vertical axis is the WIMP cross section. The two curves at the top are
existing limits. I estimate their present sensitivity at about or slightly
better than the two existing limits; the small sample of CDMS data is
already competitive with the long ‘‘Ge Diode’’ production run. Some-
what lower down is ‘‘CDMS Stanford’’ the anticipated ultimate
sensitivity of the CDMS detector in the Stanford shallow site. And
somewhat lower yet is the ‘‘CDMS Soudan’’ ultimate projected
sensitivity at a deep Soudan mine site. The curve ‘‘CRESST’’ is the
projected sensitivity of the European sapphire detector. The curve
labeled ‘‘MSS models’’ gives an estimate of the expected cross sections
for SUSY-motivated WIMPs.
F
IG
. 7. Regions in the axion mass vs. two photon coupling constant plane excluded by the pilot cavity experiments. Also shown are coupling
constants expected in a range (dubbed DFSZ and hadronic) of axion models. The area extending into the hadronic axion region is the expected
sensitivity of the U.S. experiment.
Colloquium Paper: Rosenberg
Proc. Natl. Acad. Sci. USA 95 (1998)
63
large scales, the axion couplings to matter and radiation are
incredibly feeble. They are ‘‘invisible axions’’.
However, axions cannot be too light. Axions acquired their
mass at the Quantum Chromodynamics (QCD) scale during
the Big Bang. One particular production mechanism—
misalignment production—has the total mass density of axions
increasing with the axion scale. A sufficiently light axion (say,
1–10
meV) would dominate the mass density of the universe yet
possess couplings so weak as to render them virtually invisible.
With the axionic component of the Universe increasing with
the axion scale, and the observation that we do not live in an
over-closed universe, we get a rough lower bound on the mass
of the axion of a few
meV. An upper bound to the axion mass,
around 1 meV, comes from observing 20 neutrinos from
SN1987a over tens of seconds in terrestrial experiments. The
arrival time distribution does not allow for meV scale axions—
these would have efficiently channeled energy out of the
supernova and foreshortened the burst. This leaves a window
1–1,000
meV of plausible axion masses.
In 1983, Pierre Sikivie proposed a technique to detect
these invisible axions (5). His technique called for three basic
components: a high Q microwave cavity, permeated by a
strong static magnetic field, whose rf power is measured by
low-noise amplifiers. In the magnetic field, axions can con-
vert into microwave photons, each photon carrying the
energy of the axions. The axion signal on the power spectrum
is expected to be narrow, with frequency the axion mass, the
line width broadened slightly by the virial velocity of axions
in the galactic halo. As axions are moving at virial velocities
of
b ' 10
23
, the axion peak should have a line width about
10
26
. The power in the axion line will be small, perhaps 10
222
W or less. Two small experiments based on this technique
reported results in the 1980’s (6, 7), but with inadequate
sensitivity to detect axions.
There are two new experiments underway based on Sikivie’s
technique. One, a Kyoto University group, is commissioning
an experiment having relatively small cavities, but with exotic
and potentially extremely low noise microwave amplifiers.
Another group from the Massachusetts Institute of Technol-
ogy, Lawrence Livermore Laboratory, University of Florida,
Berkeley, and Fermilab is now taking data on a large volume
cavity.
Example Axion Search.
This second axion search, operated
at the Lawrence Livermore National Laboratory in the United
States, is now taking data. The capability of this experiment to
either detect axions (with signal-to-noise ratio of 4) or exclude
them (at the 97.7% confidence limit) is shown as the region
extending into hadronic axion couplings in Fig. 7. The key
goals of the experiment are (i) to attain a power sensitivity
which is conservatively a factor of nearly 100 improvement
over the pilot experiments—achieved by having a big magnet
volume and incorporating advances in low noise microwave
amplification, and (ii) the potential to search the entire mass
range 1.5–12.6
meV, achieved through filling the magnet
volume with multiple higher frequency cavities.
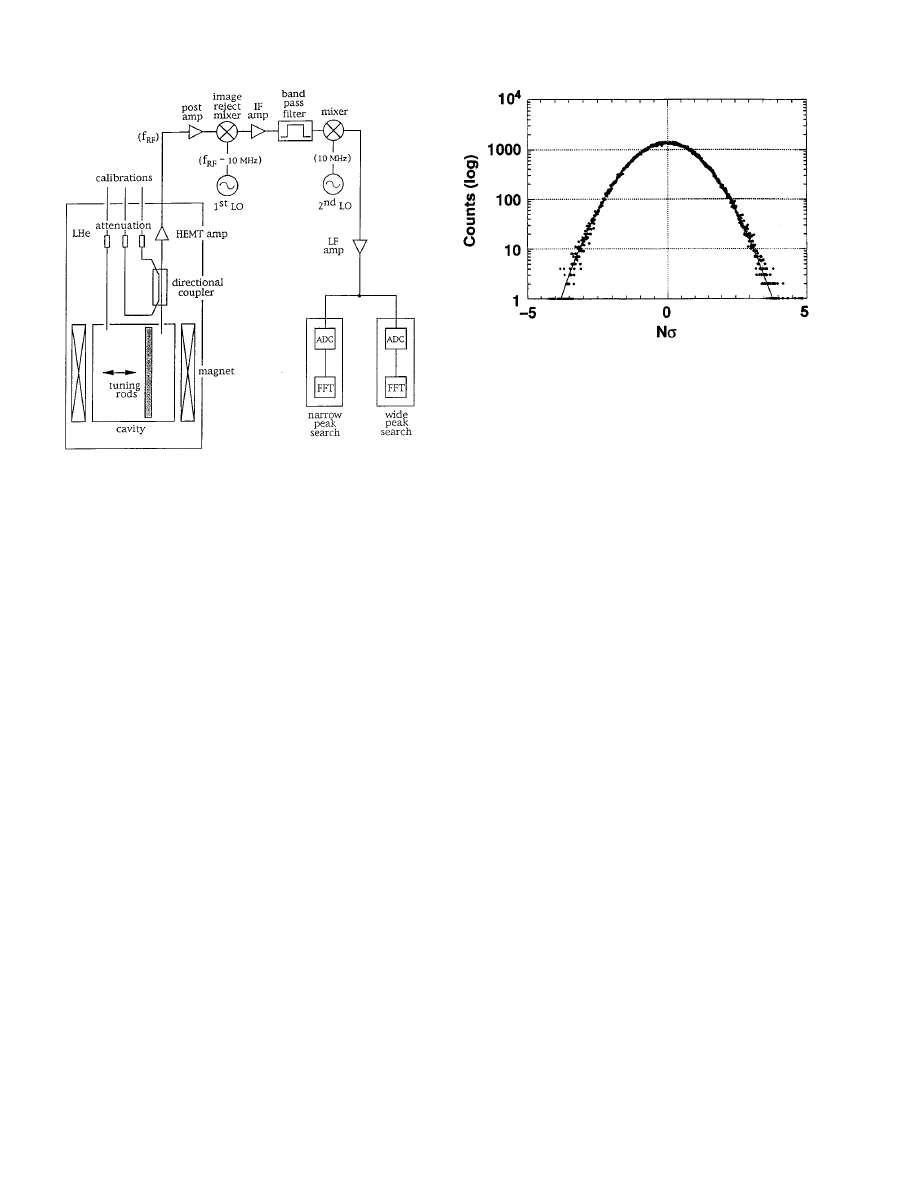
The key parts of the U.S. experiment are sketched in Fig. 8.
The experiment features a superconducting magnet with a
central field near 8.0T. The experimental volume has inner
diameter 50 cm and length 100 cm. Hence, the magnet
figure-of-merit B
2
V is about a factor of 25 better than the pilot
experiments from the 1980s. The experimental volume is
separated from the magnet cryostat by a cold-vacuum wall.
The vacuum wall allows exchanging cavity arrays and elec-
tronics while the magnet is energized and for cooling the cavity
arrays to below the magnet temperature of 4.2K. The cavity is
operated at about 1.3K, a physical temperature somewhat
lower than the noise temperatures of the best amplifiers
available today in the UHF through S-bands (0.5–3 GHz). The
total noise temperature near 4K (physical plus electronic)
yields another factor 1.6 in improved sensitivity over the pilot
experiments.
The U.S. experiment features arrays of multiple cavities to
extend the mass search range. Each cavity is separately tuned
by moving dielectric or metallic rods within the cavity, and in
this way the experiment will search the range 1.5–12.6
meV.
Additionally, the U.S. experiment looks for possible narrow
peaks in the halo axion velocity spectrum. This has the
potential to greatly increase sensitivity as the signal to noise
power ratio improves with decreasing bandwidth. In the U.S.
experiment, there are separate processing paths for the iso-
thermal and narrow peak searches. Data taking started after
a shake-down run in January 1995 and has been in continuous
operation with
.90% duty factor.
For the most part, this experiment records noise. Fig. 9
shows the distribution of power, in units of standard devi-
ation, about the mean power. The data is Gaussian distrib-
uted beyond 4
s. Occasionally, one detects non-Gaussian
deviations. Fig. 10 shows such a deviation. The vertical axis
is power in an arbitrary linear scale. The horizontal axis is
frequency. Each frequency bin is 125 Hz. The series of
spectra arrayed from top to bottom are individual power
F
IG
. 8. Sketch of the major components of the U.S. axion search
experiment.
F
IG
. 9. The distribution of power, in units of standard deviation,
about the mean power.
64
Colloquium Paper: Rosenberg
Proc. Natl. Acad. Sci. USA 95 (1998)
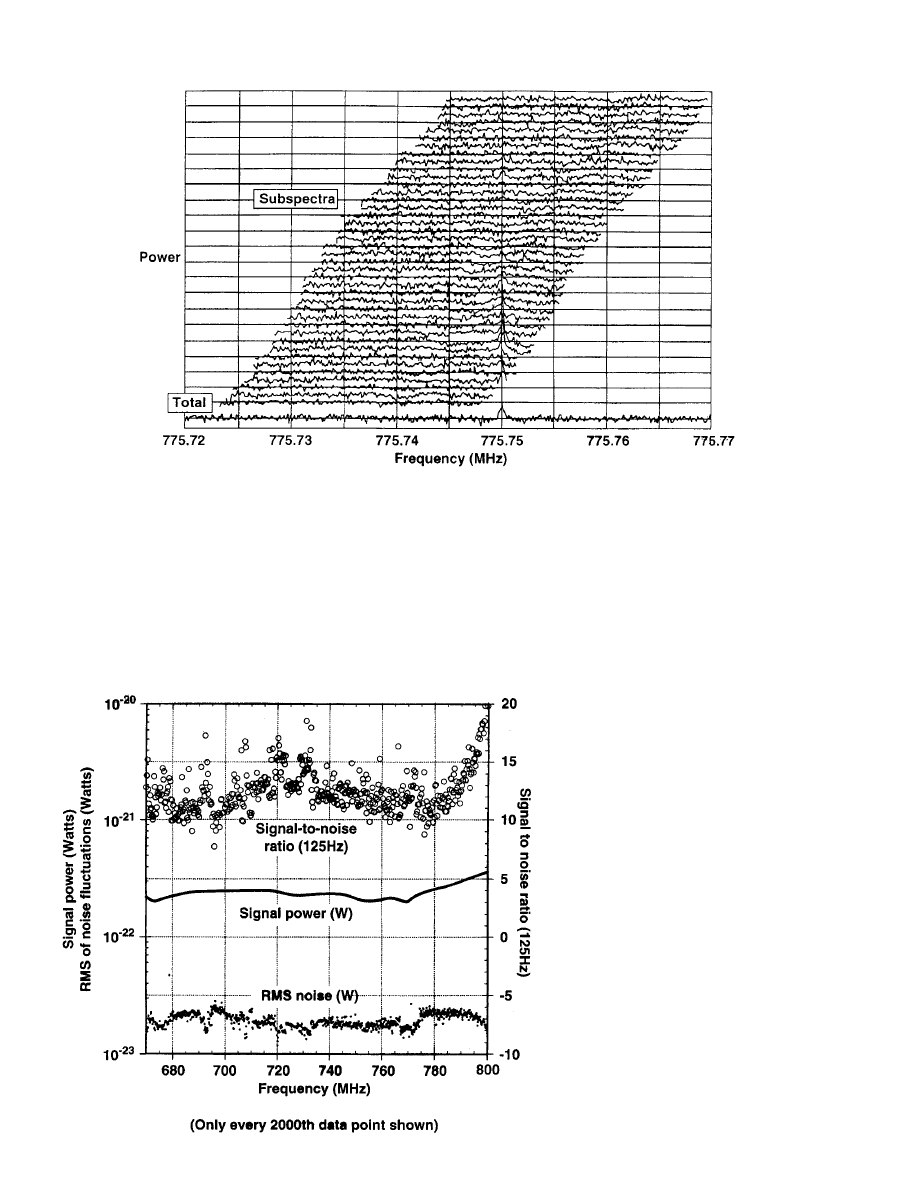
spectra accumulated as the frequency of the cavity was
changing. The center of each individual spectrum is at the
resonant frequency of the cavity. The spectrum at the very
bottom is the weighted sum of these individual power
spectra. Notice the peak at 775.75 MHz. By going back and
examining the individual spectra, one can see this peak
developed off-resonance in each individual spectrum. This
10
s peak is therefore unlikely to be an axion, it is probably
radio interference entering calibration ports and reflecting
off the cavity into the amplifier.
Fig. 11 illustrates the sensitivity of the detector. The
horizontal axis is frequency (also, axion mass). The vertical
axis to the left is power in watts. The points are the sensitivity
of the experiment in a particular frequency bin. The line is
F
IG
. 10. An obvious spurious peak. The vertical axis is power in an arbitrary linear scale. The horizontal axis is frequency. Each frequency bin
is 125 Hz. The series of spectra arrayed from top to bottom are individual power spectra accumulated as the frequency of the cavity was changing.
The center of each individual spectrum is the resonant frequency of the cavity. At the very bottom is the weighted sum of these individual power
spectra. Notice the peak at 775.75 MHz. By going back and examining the individual spectra, one can see this peak developed off-resonance in
each individual spectrum. This 10
s peak is therefore unlikely to be an axion; it is probably radio interference entering calibration ports and reflecting
off the cavity into the amplifier.
F
IG
. 11. The sensitivity of the detector. The
horizontal axis is frequency (also axion mass). The
vertical axis to the left is power in W. The points are
the sensitivity of the experiment in a particular
frequency bin. The line is the expected power
deposited by a ‘‘KSVZ’’ axion should the axion have
the corresponding mass. Notice the experiment
sensitivity is approaching 10
223
W, well below the
line.
Colloquium Paper: Rosenberg
Proc. Natl. Acad. Sci. USA 95 (1998)
65

the expected power deposited by a ‘‘KSVZ’’ axion should
the axion have the corresponding mass. Notice the experi-
ment sensitivity is approaching 10
223
W, well below the
line.
Conclusions
Over the last year, WIMP and axion searches became sensitive
enough to detect plausible dark matter candidates. The WIMP
part of this overview focused on the CDMS effort. The axion
part of this overview focused on the California effort. There
are numerous other experiments, but brevity did not allow me
to discuss them in any detail. This is an exciting time for the
dark matter community: should copious amounts of dark
matter exist as WIMPs or axions, they could be discovered
soon.
I wish to thank Tom Shutt of the Center for Particle Astrophysics,
Berkeley, for helpful discussions and for material relating to the
CDMS effort.
1. Kolb, E. & Turner, M. (1990) The Early Universe (Addison–
Wesley, Reading, PA).
2. Gates, E., Gyuk, G. & Turner, M. (1995) Astrophys. J. 449, 123.
3. Jungman, G. & Kamionkowski, M. (1996) Phys. Rep. 267, 195–373.
4. Turner, M. (1990) Phys. Rep. 197, 67–97.
5. Sikivie, P. (1983) Phys. Rev. D 32, 2988–2991.
6. Wuensch, W. U., DePanfilis-Wuensch, S., Semertzidis, Y. K.,
Rogers, J. T., Melissinos, A. C., Halama, H. J., Moskowitz, B. E.,
Prodell, A. G., Fowler, W. B. & Nezrick, F. A. (1989) Phys. Rev.
D 40, 3153–3167.
7. Hagmann, C., Sikivie, P., Sullivan, D. B. & Tanner, D. B. (1990)
Phys. Rev. D 42, 1297–1300.
66
Colloquium Paper: Rosenberg
Proc. Natl. Acad. Sci. USA 95 (1998)
Wyszukiwarka
Podobne podstrony:
1998 A gravitational diffusion model without dark matter Britten
GAO Results of a Search for Records Concerning the 1947 Crash Near Roswell, New Mexico
Alternity Dark Matter The Voice
CL 024 Searching for Stowaways
My search for a meaningful existence
How?n We Help the Homeless and Should We Searching for a
Cadiot Searching for Nationality
czytanie - koło II, 7, The Search for
How To Build an Acid Alkaline Water Charger health healing search for [!B!]
The search for artificial intelligence, nkjo.leg.pobrane materiały, Czytanie
Searching for the Neuropathology of Schizophrenia Neuroimaging Strategies and Findings
Searching for Bobby Fischer Fred Waitzkin, 1988
Are you searching for a job busuu
The Search For Happiness
0813124468 University Press of Kentucky Peace Out of Reach Middle Eastern Travels and the Search for
FISC BR 14 01 NSA Search for FBI 14 0205 Amend
FISC BR 14 01 NSA Search for FBI 14 0103 Primary
więcej podobnych podstron