Cyclotron resonance study of the electron and hole velocity in graphene monolayers
R. S. Deacon,
1
K.-C. Chuang,
1
R. J. Nicholas,
K. S. Novoselov,
2
and A. K. Geim
2
1
Clarendon Laboratory, Physics Department, Oxford University, Parks Road, Oxford OX1 3PU, United Kingdom
2
Manchester Centre for Mesoscience and Nanotechnology, University of Manchester, Manchester M19 9PL, United Kingdom
共Received 11 July 2007; published 28 August 2007
兲
We report studies of cyclotron resonance in monolayer graphene. Cyclotron resonance is detected using the
photoconductive response of the sample for several different Landau level occupancies. The experiments
measure an electron velocity at the K
共Dirac兲 point of c
K
*
= 1.093
⫻10
6
m s
−1
, which is substantially larger than
in thicker graphitic systems. In addition we observe a significant asymmetry between the electron and hole
bands, leading to a difference in the electron and hole velocities of 5% by energies of 125 meV away from the
Dirac point.
DOI:
PACS number
共s兲: 73.61.Cw, 78.20.Ls, 78.30.Am, 78.66.Db
The observation of two-dimensional electronic systems in
monolayer graphene,
where the electrons behave as Dirac
fermions and show a variety of novel quantum Hall
effects,
has led to an explosion of interest in this system.
As well as new basic science, the exceptionally high electron
velocities also mean that graphene has considerable potential
for applications in high-speed electronics.
The basis for this
behavior is the nearly linear dispersion of the energy bands
close to the K point, where the dispersion relations cross with
the form E = ± c
*
បk, where c
*
is the electron velocity. This
has been predicted for over 50 years,
but has been measured
only recently for bulk graphite
and ultrathin graphite
while the first direct absorption measurements for
monolayer graphene have just been reported.
We describe
here a photoconductance study of cyclotron resonance in a
monolayer of graphene in which the application of a mag-
netic field leads to the formation of Landau levels given by
E
N
= sgn
共N兲 ⫻ c
*
冑
2e
បB兩N兩,
共1兲
where
兩N兩 is the Landau quantum index and B is the magnetic
field. This allows us to make a precise measurement of the
electron velocity and to examine deviations from exact linear
behavior, which show that the electron- and holelike parts of
the band structure have significantly different masses and
that the velocity is significantly larger than for thicker gra-
phitic material.
The experiment studies the photoconductive response
from a multiply contacted single-monolayer sample of
graphene, which was prepared using the techniques that have
been described earlier.
The graphene films were deposited
by micromechanical cleavage of graphite with multiterminal
devices produced by conventional microfabrication, with a
typical sample displayed in Fig.
. Shubnikov–de Haas
oscillations were first studied at 1.5 K to establish the carrier
densities as a function of gate voltage and to ensure that the
film studied was a single monolayer of graphene, since bi-
layers and thicker films are known to have a completely dif-
ferent dispersion relation.
Cyclotron resonance was measured by detecting the
modulation of the conductivity of the samples produced by
chopped infrared radiation from a CO
2
laser operating be-
tween 9.2 and 10.8
m. The sample was illuminated nor-
mally with unpolarized light parallel to the magnetic field in
the Faraday geometry. Typical power densities were
⬃3
⫻10
4
W m
−2
, corresponding to a total power incident on the
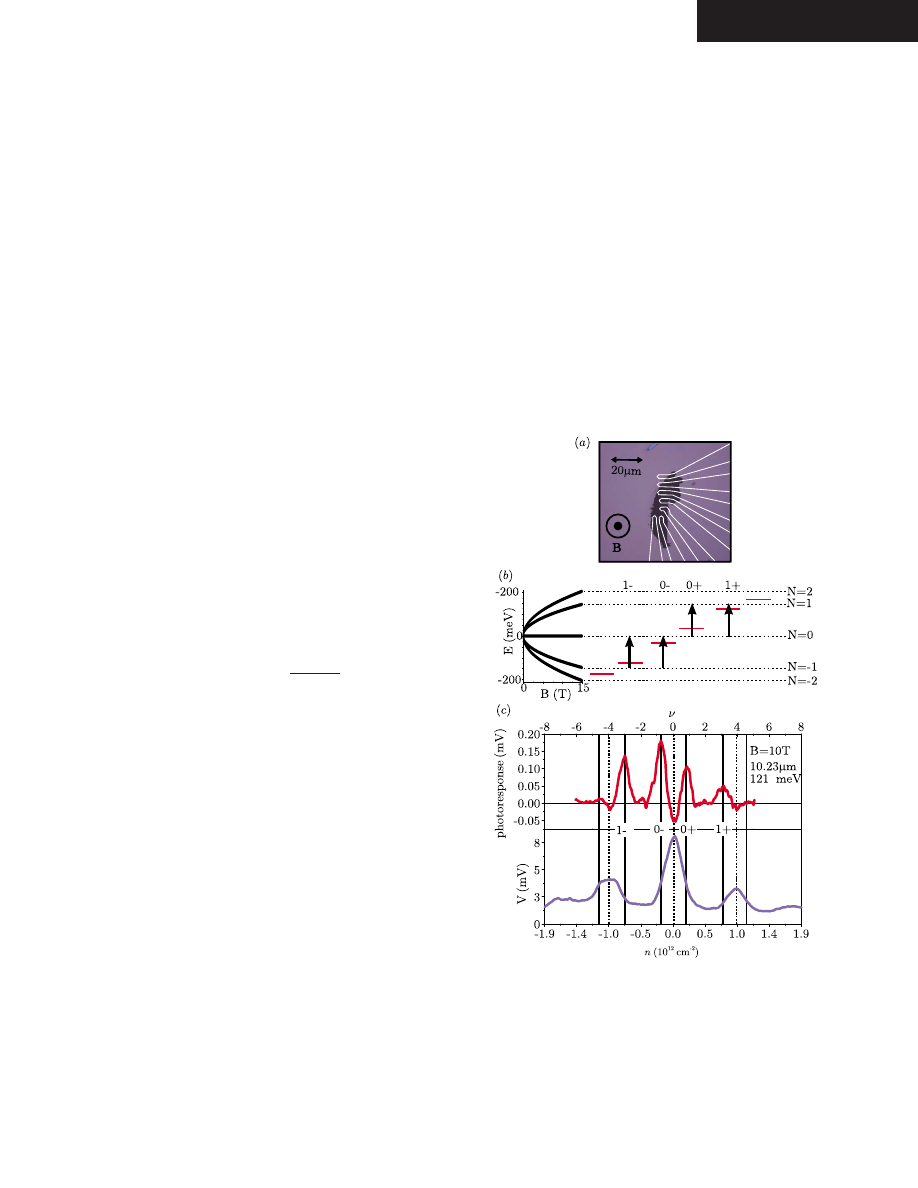
FIG. 1.
共Color online兲 共a兲 Sample image with outline of the
contacts used in the measurements.
共b兲 Plot of the Landau energies
as a function of magnetic field for Landau index N = −2 , . . . , 2. Ar-
rows indicate the resonant transitions probed in the energy range of
the CO
2
laser.
共c兲 Density dependence of the two-contact resistive
voltage and photoconductive response of a typical graphene sample
for infrared radiation of 10.23
m at 10 T measured with a current
of 100 nA.
PHYSICAL REVIEW B 76, 081406
共R兲 共2007兲
RAPID COMMUNICATIONS
1098-0121/2007/76
共8兲/081406共4兲
©2007 The American Physical Society
081406-1
samples studied of order 5
W. The majority of experiments
were performed in two-contact mode with a current of I
= 100 nA, since this gave the best signal-to-noise ratio, al-
though similar spectra were also observed in a four-contact
configuration. Figure
shows the photoconductive signal
and the two-contact resistance of a graphene layer as a func-
tion of carrier density n, with the sample immersed in liquid
helium at 1.5 K. This demonstrates that large positive pho-
toconductive signals are observed at the edges of the conduc-
tance peaks, at the points where the resistivity is changing
most rapidly with temperature and chemical potential. The
response is proportional to the energy absorbed and thus pro-
vides an accurate relative measurement of the absorption co-
efficient. At resonance we observe voltage modulations as
high as 3%. The peak response is detected when the Landau
level occupancy
= nh / eB is −3.0
共1−兲, −0.76 共0−兲, 0.88
共0+兲 and 3.1 共1+兲, where 0 corresponds to the Dirac point.
A small negative response is also observed when the Landau
levels are exactly half filled at occupancies of
= −4 , 0 , + 4.
The two response peaks labeled
共1−兲 and 共1+兲 correspond
to hole- and electronlike transitions from the Dirac point
共N=0兲 to the N= ±1 Landau levels, respectively. The 共0−兲
and
共0+兲 peaks both correspond to mixtures of the two tran-
sitions as the N = 0 level is partially filled with either holes or
electrons, but with either the hole or electron transition, re-
spectively, predominant as indicated in Fig.
. When
兩
兩
⬎4 no resonant absorption can occur in this field range, and
we observe only some much weaker additional features
caused by nonresonant bolometric response from the sample.
This is greater at higher magnetic fields where localization of
the carriers is increased.
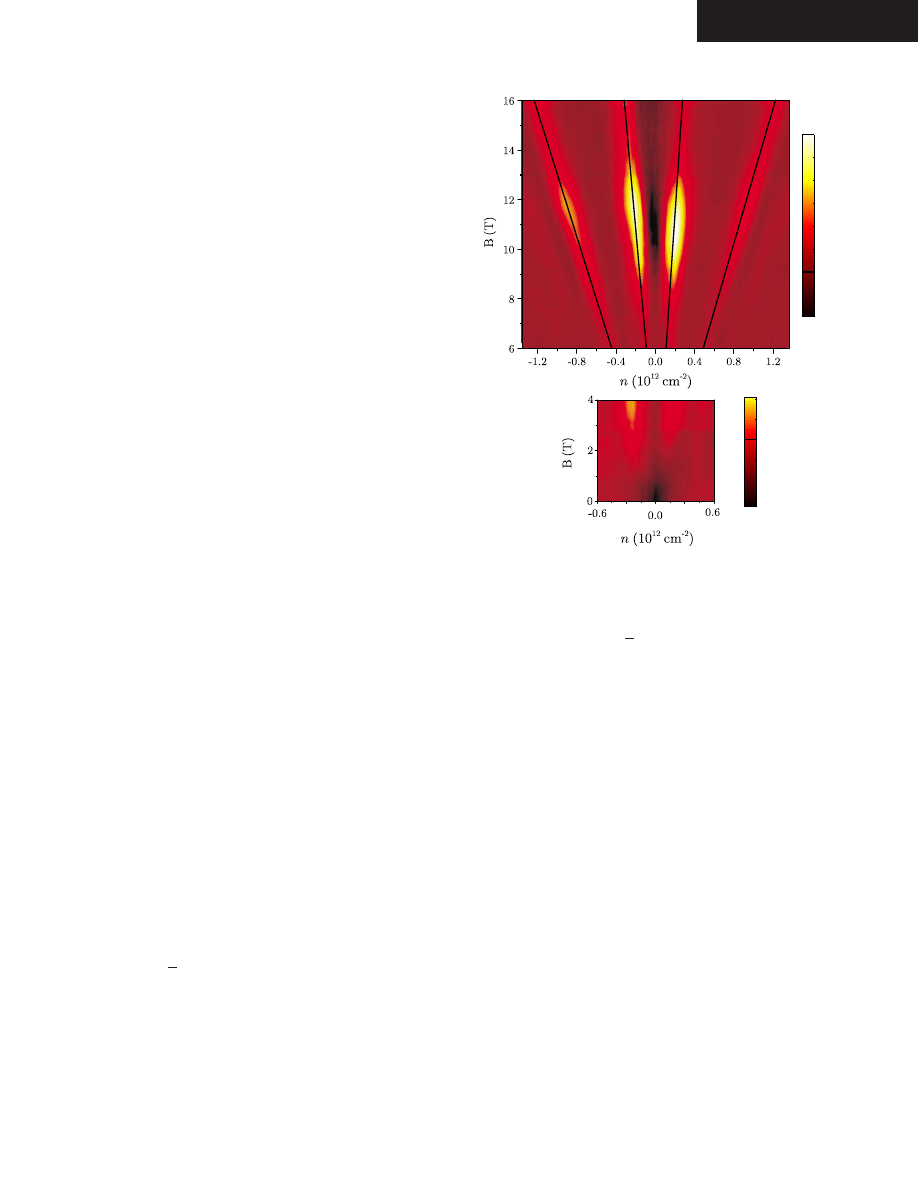
In order to detect the resonances, we measure carrier den-
sity sweeps at each value of magnetic field, and compile a
full map of the photoresponse as shown in Fig.
for a wave-
length of 9.25
m. This demonstrates that clear resonances
can be detected for all four occupancies where strong photo-
response is seen. The immediate conclusion from this plot is
that the resonances all occur in the region of 10 T, but that
there is a significant asymmetry between the electron- and
holelike transitions. A further negative photoresponse is ob-
served at low magnetic fields
共⬍2 T兲, which we attribute to
interband photon absorption processes such as −
共N+1兲→N
and −N
→共N+1兲. In order to demonstrate the high-field reso-
nances more clearly and to investigate the magnetic field
dependence of the transition energies, we show traces in
which the Landau level occupancy is held constant, by the
simultaneous scanning of the gate voltage and magnetic field
in order to follow the constant occupancy lines as shown in
Fig.
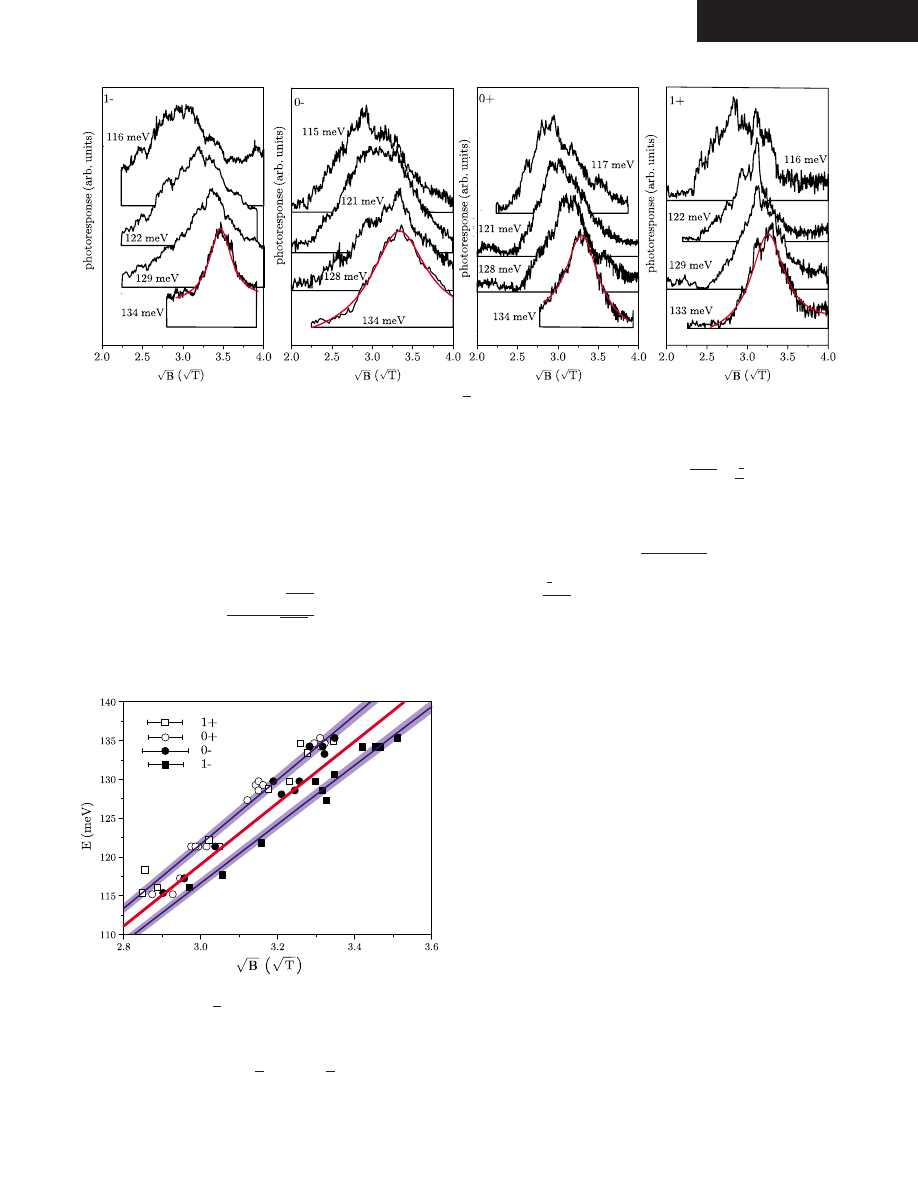
Sequences of resonances for the electronlike and holelike
transitions are shown in Fig.
. The resonances are plotted as
a function of
冑
B and fitted with conventional Lorenzian line
shapes with the addition of a linear correction to account for
the increasing bolometric response at high fields. Some reso-
nances show significant anisotropy, and we therefore quote
an error for individual points of ±20% of the half width at
half maximum. A typical fit is shown for each of the four
resonances. The 0− resonances are particularly broad and
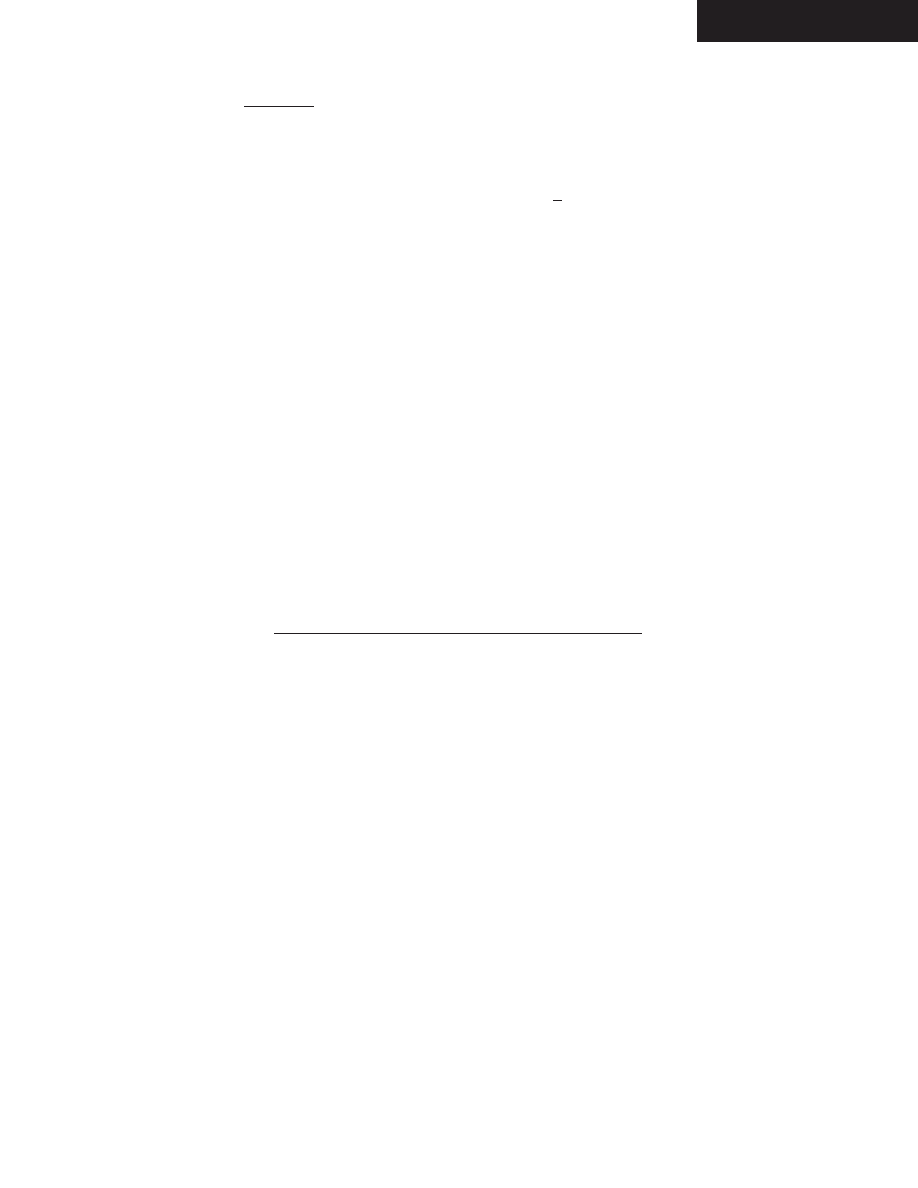
therefore give higher errors. The resonance positions are
plotted as a function of
冑
B in Fig.
. The resonance energies
are expected to be given by Eq.
兲, with a single value of the
electron velocity c
*
. Our results show clearly that this is
not the case. Fitting velocities to each of the resonances
separately gives values of c
*
=
共1.117,1.118,1.105, and
1.069± 0.004
兲⫻10
6
m s
−1
for the 1+, 0+, 0−, and 1− reso-
nances, respectively. The resonances measured for the 1−
and 1+ occupancies show the lowest and highest values for
c
*
, as would be expected if the electron and hole masses are
different, since these correspond to pure holelike and elec-
tronlike transitions, while the values for
共0−兲 and 共0+兲 are
intermediate between the two extremes. Defining a single
Fermi velocity averaged over the extremal values for elec-
trons and holes in the region of the Dirac point gives c
*
=
共1.093±0.004兲⫻10
6
m s
−1
. Interpreting the resonance po-
sitions in terms of the conventional cyclotron effective mass
gives m
*
= 0.009m
e
.
Values reported previously for the Fermi velocity suggest
that it is quite strongly dependent on the number of graphene
sheets in metallic systems. Angle-resolved photoemission on
bulk graphite
gives 0.91
⫻10
6
m s
−1
, while the cylotron
resonance measurements of Sadowski et al.
on thin
共3–5兲
layers of epitaxial graphite give 1.03
⫻10
6
m s
−1
. A recent
report on tunneling measurements in bilayer graphene
has
found 1.07
⫻10
6
m s
−1
, while the results above and the cy-
clotron absorption by Jiang et al.
on monolayer graphene
give values of
⯝1.1⫻10
6
m s
−1
. By contrast, estimates
1-
0-
0+
1+
-5
0
5
10
15
20
25
V
-15
-10
-5
0
5
10
V
V
FIG. 2.
共Color online兲 Photoconductive response as a function
of gate voltage and magnetic field for 9.25
m 共134 meV兲. The
low-field section of the map has an enhanced sensitivity to display
the sharp negative resonance at zero field.
DEACON et al.
PHYSICAL REVIEW B 76, 081406
共R兲 共2007兲
RAPID COMMUNICATIONS
081406-2
based on the electronic properties of semiconducting carbon
nanotubes deduce c
K
*
= 0.94
⫻10
6
m s
−1
, corresponding to
values of
␥
0
, the transfer integral, of order 2.9 eV.
Theoretically, nearest-neighbor tight binding theory
pre-
dicts electron energies in terms of
␥
0
and s
0
, the nearest-
neighbor overlap integral, of
E =
⑀
2p
⫿
␥
0
冑
共k兲
1
⫿ s
0
冑
共k兲
.
共2兲
Setting
⑀
2p
= 0 to give a correct description of the bands
close to the K point, and with
冑
共k兲=
共
冑
3
2
兲
ka
0
, where a
0
= 0.246 nm is the graphene lattice parameter, gives the elec-
tron velocity as
c
±
*
= c
K
*
1
1
⫿ s
0
E/
␥
0
,
共3兲
where c
K
*
=
冑
3
␥
0
a
0
2
ប
. Typical values for the parameters of
␥
0
= 3.03 eV and s
0
= 0.129, which have been derived from first-
principles calculations
and found to give good agreement
with experiment,
give values for c
K
*
= 0.98
⫻10
6
m s
−1
but
predict only a very small asymmetry of the velocity of
±0.5%. More complex calculations such as those including
up to third-nearest neighbors
give values that lead to even
lower values of
␥
0
共2.7 eV兲 and hence c
*
. This suggests,
therefore, that the currently accepted values of the transfer
integral are consistent with the graphite results, but there is a
progressive increase in the electron velocity as the graphite is
thinned down to the single-monolayer graphene result. The
changes in the transfer integral are probably related to the
screening or changes in the details of the
bonds perpen-
dicular to the graphene surface, which are also responsible
for the band structure at the K point. These bonds are directly
linked to the interlayer coupling of the graphene sheets and
to their coupling to the SiO
2
insulator, suggesting that this
coupling leads to an enhancement of the electron velocity, as
has been suggested recently for carbon nanotubes,
where
filling of the nanotubes with crystalline material leads to
changes in the transfer integral. Using a value of c
K
*
= 1.093
⫻10
6
m s
−1
leads to the deduction of a value of
␥
0
= 3.38 eV.
The second conclusion from Fig.
is that the asymmetry
between electron and hole is considerably larger than that
predicted by the simple tight binding theory. We model this
by replacing the overlap integral s
0
with an empirical factor

0
in Eq.
兲 and refitting the data shown in Fig.
with the
modified equation
FIG. 3.
共Color online兲 Photoconductive response as a function of
冑
B with the carrier densities scanned to keep the occupancies constant
at
=−3.0 共1−兲, −0.76 共0−兲, 0.88 共0+兲, and 3.1 共1+兲 for wavelengths from 9.2 to 10.7
m. The red 共gray兲 lines show fits using Lorenzian
line shapes combined with a linear background response.
0
K
=0.6 0.1
c =(1.093
10 ms
±
6
-1
±
)
0.004 x
c
+
c
-
c
K
*
*
*
*
FIG. 4.
共Color online兲 Resonance positions for the four reso-
nances as a function of
冑
B, together with a single fitted value of the
electron velocity c
K
*
关red 共gray兲 line兴. The outer lines show fits to
Eq.
兲, with the shaded bands covering the error limits from c
K
and

0
. The individual resonance positions have errors as shown of
⬃±2%, corresponding to 0.2⌬
冑
B, where
⌬
冑
B is the half width at
half maximum absorption.
CYCLOTRON RESONANCE STUDY OF THE ELECTRON AND
…
PHYSICAL REVIEW B 76, 081406
共R兲 共2007兲
RAPID COMMUNICATIONS
081406-3
c
±
*
= c
K
*
1
1
⫿

0
E/
␥
0
.
共4兲
The best fits to the data are shown in Fig.
with values of
c
K
*
=
共1.093±0.004兲⫻10
6
m s
−1
and

0
= 0.6± 0.1. These val-
ues give velocities for the electrons and holes of c
±
*
1.118
⫻10
6
and 1.069
⫻10
6
m s
−1
in the energy range close to
±125 meV. We therefore have clear evidence for the break-
ing of particle-antiparticle symmetry in the graphene system
at the level of ±2.5%, approximately five times larger than
expected for simple tight binding theory.
This may be
linked to the intrinsic single-particle band structure, with
some indications of this in the comparison of ab initio and
tight binding dispersions,
although these calculations sug-
gest values of c
K
*
as low as 0.87
⫻10
6
m s
−1
. By contrast, the
magnitude of the asymmetry is comparable, but of the oppo-
site sign to that predicted
共⬃⫿3%兲 using random phase
approximation methods, which take account of dynamical
screening,
and which also predict an overall
⬃13% en-
hancement of the velocity. It is also possible that the gating
process itself will lead to some changes in the
bonding,
due to the changes in surface field, and that this is linked to
the velocity enhancement in thinner layers.
In addition to conventional single-particle effects, it may
also be possible that many-body corrections could influence
the value and asymmetry of the electron velocity. Kohn’s
theorem
has long been known to exclude the influence of
electron-electron interactions on long-wavelength excitations
for
conventional
parabolic
systems.
Calculations
for
suggest, however, that, although there are several
similarities with the normal electron case, the linear disper-
sion may lead to finite Coulomb contributions to the cyclo-
tron resonance transition energies, and that these will be
strongly dependent on the level occupancy, although these
are based on perfect particle-hole symmetry.
The resonance linewidths
共half width at half maximum兲
deduced from fitting the data in Fig.
are all in the region of
共0.27–0.37兲
冑
T
共1.5–2.5 T兲. Using our measured value of c
K
*
gives an energy broadening
ប/
⯝12 meV, corresponding to
a simple momentum relaxation time of
⬃5.5⫻10
−14
s, a
mean free path
=c
*
⬃0.06
m, and a mobility
⬃1.1 m
2
V s
−1
. The linewidths are significantly smaller than
those observed by Jiang et al.
, which may explain why these
authors did not observe the electron-hole asymmetry.
In conclusion, therefore, we have measured cyclotron
resonance in a monolayer graphene system, which demon-
strates that the electron velocity is significantly enhanced
relative to the value expected from previous calculations and
measurements for thicker graphitic systems. In addition, we
have demonstrated a considerable asymmetry in the carrier
velocity for the electron- and holelike parts of the dispersion
relation close to the K point of the Brillouin zone. These
measurements suggest that there are still considerable uncer-
tainties in understanding the band structure of monolayer
graphene, which may lead to significant changes in any
theories
based on perfect particle-antiparticle symmetry.
Part of this work has been supported by EuroMagNET
under the EU Contract No. RII3-CT-2004-506239 of the 6th
Framework “Structuring the European Research Area, Re-
search Infrastructures Action.”
*
r.nicholas1@physics.ox.ac.uk
1
K. S. Novoselov, A. K. Geim, S. V. Morozov, D. Jiang, Y. Zhang,
S. V. Dubonos, I. V. Grigorieva, and A. A. Firsov, Science 306,
666
共2004兲.
2
K. S. Novoselov, A. K. Geim, S. V. Morozov, D. Jiang, M. I.
Katsnelson, I. V. Grigorieva, S. V. Dubonos, and A. A. Firsov,
Nature
共London兲 438, 197 共2005兲.
3
Y. Zhang, Y. W. Tan, H. L. Stormer, and P. Kim, Nature
共London兲
438, 201204
共2005兲.
4
Y. Zhang, Z. Jiang, J. P. Small, M. S. Purewal, Y. W. Tan, M.
Fazlollahi, J. D. Chudow, J. A. Jaszczak, H. L. Stormer, and P.
Kim, Phys. Rev. Lett. 96, 136806
共2006兲.
5
K. S. Novoselov and A. K. Geim, Nat. Mater. 6, 183
共2007兲.
6
P. R. Wallace, Phys. Rev. 71, 622
共1947兲.
7
S. Y. Zhou, G.-H. Gweon, J. Graf, A. V. Fedorov, C. D. Spataru,
R. D. Diehl, Y. Kopelevich, D. H. Lee, S. G. Louie, and A.
Lanzara, Nat. Phys. 2, 595
共2006兲.
8
M. L. Sadowski, G. Martinez, M. Potemski, C. Berger, and W. A.
deHeer, Phys. Rev. Lett. 97, 266405
共2006兲.
9
Z. Jiang, E. A. Henriksen, L. C. Tung, Y. J. Wang, M. E.
Schwartz, M. Y. Han, P. P. Kim, and H. L. Stormer, Phys. Rev.
Lett. 98, 197403
共2007兲.
10
J. W. McClure, Phys. Rev. 104, 666
共1956兲.
11
K. S. Novoselov, E. McCann, S. V. Morozov, V. I. Fal’ko, M. I.
Katsnelson, U. Zeitler, D. Jiang, F. Schedin, and A. Geim, Nat.
Phys. 2, 177
共2006兲.
12
E. McCann and V. I. Fal’ko, Phys. Rev. Lett. 96, 086805
共2006兲.
13
F. Guinea, A. H. Castro Neto, and N. M. R. Peres, Phys. Rev. B
73, 245426
共2006兲.
14
G. Li and E. Y. Andrei, arXiv:0705.1185
共unpublished兲.
15
M. Milnera, J. Kurti, M. Hulman, and H. Kuzmany, Phys. Rev.
Lett. 84, 1324
共2000兲.
16
A. G. Souza Filho, S. G. Chou, G. G. Samsonidze, G. Dressel-
haus, M. S. Dresselhaus, L. An, J. Liu, A. K. Swan, M. S. Ünlü,
B. B. Goldberg, A. Jorio, A. Grüneis, and R. Saito, Phys. Rev. B
69, 115428
共2004兲.
17
R. Saito, G. Dresselhaus, and M. S. Dresselhaus, Physical Prop-
erties of Carbon Nanotubes
共Imperial College Press, London,
1998
兲.
18
R. Saito, M. Fujita, G. Dresselhaus, and M. S. Dresselhaus, Appl.
Phys. Lett. 60, 2204
共1992兲.
19
S. Reich, J. Maultzsch, C. Thomsen, and P. Ordejon, Phys. Rev. B
66, 035412
共2002兲.
20
L.-J. Li, T.-W. Lin, J. Doig, I. B. Mortimer, J. G. Wiltshire, R. A.
Taylor, J. Sloan, M. L. H. Green, and R. J. Nicholas, Phys. Rev.
B 74, 245418
共2006兲.
21
T. Miyake and S. Saito, Phys. Rev. B 68, 155424
共2003兲.
22
W. Kohn, Phys. Rev. 123, 1242
共1961兲.
23
A. Iyengar, J. H. Wang, H. A. Fertig, and L. Brey, arXiv:cond-
mat/0608364.
24
V. V. Cheianov, V. Fal’ko, and B. L. Altshuler, Science 315, 1252
共2007兲.
DEACON et al.
PHYSICAL REVIEW B 76, 081406
共R兲 共2007兲
RAPID COMMUNICATIONS
081406-4
Wyszukiwarka
Podobne podstrony:
24 Phys Rev Lett 99 216802 2007
32 Phys Rev Lett 98 196806 2007
57 Phys Rev B 67 054506 2003
27 wykład tlenowce (16 gr)[F]2007
11 Phys Rev B 78 085432 2008id Nieznany (2)
39 Phys Rev B 74 064403 2006
48 Phys Rev B 72 024537 2005
37 Phys Rev Lett 97 187401 2006
14 Phys Rev B 77 233406 2008
46 Phys Rev B 72 Rapid Commun 201401 2005
51 Phys Rev Lett 92 237001 2004
41 Phys Rev Lett 97 016801 2006
20 Phys Rev Lett 100 016602 2008
5 Phys Rev B 79 115441 2009
27 29 307cc pol ed02 2007
2007 12 27 19 35 warminsko mazurskie A4
więcej podobnych podstron