
Long-Range Nonlocal Flow of Vortices in Narrow Superconducting Channels
I.V. Grigorieva, A. K. Geim, S.V. Dubonos, and K. S. Novoselov
Department of Physics and Astronomy, University of Manchester, Oxford Road, Manchester M13 9PL, United Kingdom
D. Y. Vodolazov and F. M. Peeters
Departement Natuurkunde, Universiteit Antwerpen, Universiteitsplein 1, B-2610 Antwerpen, Belgium
P. H. Kes and M. Hesselberth
Kamerlingh Onnes Laboratorium, Leiden University, P.O. Box 9504, 2300 RA Leiden, The Netherlands
(Received 1 December 2003; published 8 June 2004)
We report a new nonlocal effect in vortex matter, where an electric current confined to a small region
of a long and sufficiently narrow superconducting wire causes vortex flow at distances hundreds of
intervortex separations away. The observed remote traffic of vortices is attributed to a very efficient
transfer of a local strain through the one-dimensional vortex lattice (VL), even in the presence of
disorder. We also observe mesoscopic fluctuations in the nonlocal vortex flow, which arise due to ‘‘traffic
jams’’ when vortex arrangements do not match a local geometry of a superconducting channel.
DOI: 10.1103/PhysRevLett.92.237001
PACS numbers: 74.25.Qt, 73.23.–b, 74.20.– z, 74.78.–w
Phenomena associated with vortex motion in super-
conductors have been subject to intense interest for
many decades, as they are important both for applications
and in terms of interesting, complex physics involved.
Vortices start moving when the Lorentz force f
L
acting
on them exceeds pinning forces arising from always-
present defects. The force is determined by the local
current density j and, hence, the resulting vortex motion
is confined essentially to the region where the applied
current flows [1,2]. There are only a few cases known
where vortex flow becomes nonlocal (i.e., not limited to
the current region), most notably in Giaever’s flux trans-
former [3] and in layered superconductors [4]. In the
former case, f
L
is applied to vortices in one of the super-
conducting films comprising the transformer, while the
voltage is generated in the second film, due to electro-
magnetic coupling between vortices in the two films [3,5].
In layered superconductors, a drag effect (somewhat simi-
lar to that in Giaever’s transformer) is observed due to
coupling between pancake vortices in different layers.
Both nonlocal effects occur along vortices and are basi-
cally due to their finite rigidity. A high viscosity of a
vortex matter can also lead to a nonlocal response in the
direction perpendicular to vortices [6 – 9]. In this case,
local vortex displacements induced by j create secondary
forces on their neighbors pushing them along. Such
nonlocal correlations were observed in the vicinity of
the melting transition in high-temperature superconduc-
tors [8,9]. This is a dynamic effect where VL’s regions —
generally moving at different speeds due to different
above-critical currents — suddenly become locked in a
long-range collective motion. In the absence of a driving
current, such viscosity-induced nonlocality is expected to
die off at a few vortex separations [6,7].
In this Letter, we report a nonlocal effect of a different
kind, which arises in the absence of a driving current due
to a long-range collective response of a rigid one-dimen-
sional (1D) VL and survives at strikingly long distances,
corresponding to several hundred vortex spacings.
Nonlocal vortex flow in our experiments is observed at
distances up to 5 m, provided a superconducting
channel contains only one or two vortex rows. To the
best of our knowledge, such nonlocality has neither
been observed nor considered theoretically.
Our starting samples were thin films of amorphous
superconductor MoGe ( 60) with various thicknesses
d
from 50 to 200 nm. We have chosen amorphous films
because they are known for their quality and very low
pinning and have been extensively studied in the past in
terms of pinning and vortex flow (see, e.g., [10,11]). The
sharp superconducting transitions ( < 0:1 K) measured
on mm-sized samples of our films indicate their high
quality and homogeneity. The critical current j
C
in inter-
mediate fields b H=H
c2
0:3–0:6 was measured to be
10
2
A=cm
2
(at 5 K), where H is the applied field and
H
c2
the upper critical field.j
C
increased several times at
lower temperatures. The MoGe films were patterned into
multiterminal submicron wires of various widths w (be-
tween 70 nm and 2 m) and lengths L (between 0.5 and
12 m) using e-beam lithography and dry etching (see
Fig. 1). Electrical measurements were carried out using
the standard low-frequency (3 to 300 Hz) lock-in tech-
nique at temperatures T down to 0.3 K. The results were
independent of frequency, which proves that the measured
ac signals are just the same as if one were using a dc
measurement technique, provided the latter could allow
the same sensitivity ( < 1 nV). The external field H was
applied perpendicular to the structured films. For brevity,
we focus below on the results obtained in the nonlocal
geometry and omit discussions of the complementary
measurements carried out in the standard (local) four-
probe geometry.
P H Y S I C A L
R E V I E W
L E T T E R S
week ending
11 JUNE 2004
V
OLUME
92, N
UMBER
23
237001-1
0031-9007= 04=92(23)=237001(4)$22.50
2004 The American Physical Society
237001-1
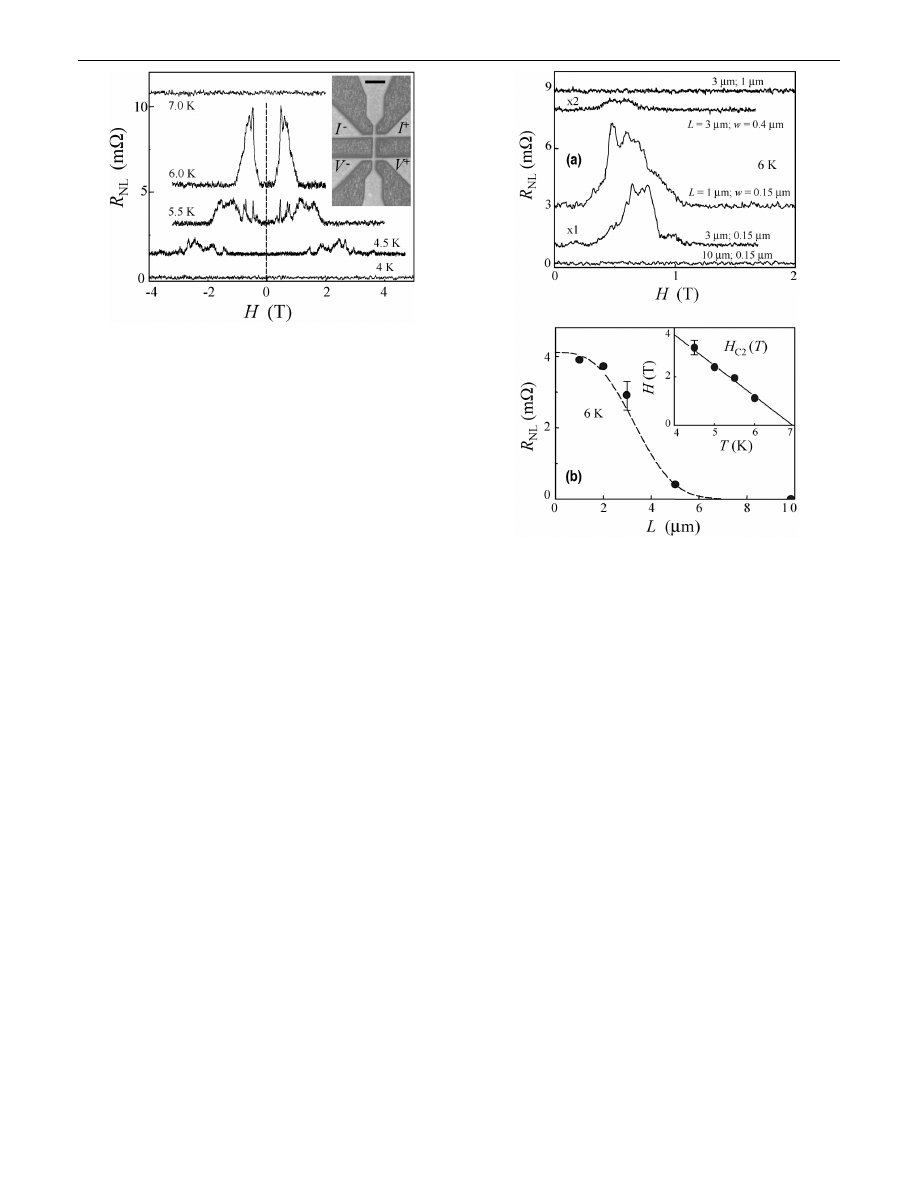
The nonlocal geometry is explained in Fig. 1. Here, the
electric current is passed through leads marked I
and
I
and voltage is measured at terminals V
and V
. In
this geometry, the portion of applied current I that
goes sideways along the central wire (see Fig. 1) and
reaches the area between the voltage probes is negligibly
small. Indeed, in both normal and superconducting states
[12], the current along the central wire decays as / I
expx=w, which means that the current density re-
duces by a factor of 10 already at distances x w and,
typically, by 10
10
in the nonlocal region (x L) in our
experiments. This also means that all vortices in the
central wire, except for one or two nearest to the cur-
rent-carrying wire, experience the current density many
orders of magnitude below the critical value. Therefore,
no voltage can be expected to be observable in the non-
local geometry. In stark contrast, our measurements
revealed a pronounced nonlocal voltage V
NL
, which
emerged just below [13] the critical temperature T
C
and
persisted deep into the superconducting state (Fig. 1).
The signal appeared above a certain value of H
0:2H
c2
, reached its maximum at 0:5–0:7 H
c2
and
then gradually disappeared as H approached H
c2
. V
NL
was found to depend linearly on I that was varied
between 0.2 and 5 A. At lower I, V
NL
became so small
( < 100 pV) that it disappeared under noise, while higher
currents led to heating effects. The linear dependence
allows us to present the results in terms of resistance
R
NL
V
NL
=I
. With increasing L, R
NL
was found to
decay relatively slowly (for L 4 m) and quickly dis-
appeared for longer wires as well as for the wide ones
(w 0:5 m) (Fig. 2). The general shape of R
NL
H
curves was identical for all samples but fluctuations
(sharp peaks) seen in Fig. 1 varied from sample to
sample. A closer inspection of the fluctuations for differ-
ent samples shows that they have the same characteristic
interval of magnetic field over which R
NL
changes rapidly.
This correlation field B
C
corresponds to the entry of one
flux quantum
0
into the area L w between the current
and voltage leads, so that B
C
0
=L w
.
To understand the nonlocal signal, we note that within
the accessible range of I, its density inside the current-
carrying wire was in the range of 10
3
to 10
5
A=cm
2
(i.e., j
C
) and, accordingly, caused a vortex flow
through this wire. Indeed, whenever V
NL
was observed,
measurements in the local geometry showed the behavior
typical for the flux flow regime. This indicates that the
nonlocal resistance is related to the vortex flow in the
current-carrying part of the structures, which then some-
how propagates along the central wire to the region
between V
and V
terminals, where no electric current
is applied. The mechanism of the propagation can be
understood as follows. The Lorentz force — acting on
FIG. 2.
Dependence of R
NL
on length L and width w of the
central wire. (a) Nonlocal resistance at T 6:0 K for different
wires (their L and w values are shown on the graph). Curves are
shifted vertically for clarity. (b) Nonlocal resistance at its
maximum value as a function of L (w 150 nm). The signal
at 6.0 K is also representative of the behavior observed at lower
T. The dashed line is a guide to the eye. The inset shows
temperature dependence of the field corresponding to the dis-
appearance of R
NL
(solid circles). The solid line is H
c2
T
measured on macroscopic films.
FIG. 1.
Nonlocal resistance R
NL
as a function of applied field
H measured on a 150 nm wide wire at a distance of 1 m
between the current and voltage leads. Different curves are
shifted vertically for clarity (R
NL
is always zero in the normal
state). The inset shows an AFM image of the studied sample.
The vertical wire in this image is referred to as central wire.
Scale bar, 1 m.
P H Y S I C A L
R E V I E W
L E T T E R S
week ending
11 JUNE 2004
V
OLUME
92, N
UMBER
23
237001-2
237001-2
vortices located at the intersection between current-
carrying and central wires —pushes/pulls them along
the central wire. In the absence of edge defects along
this wire, the surface barrier prevents these vortices from
leaving a superconductor [14] and, hence, the local dis-
tortion of the VL can be expected to propagate along the
central wire, away from the current-carrying region. If
the vortex motion reaches the remote intersection be-
tween the central and voltage wires, a voltage is generated
by vortices passing through this region. For an infinitely
rigid VL, such a local distortion would propagate any
distance. However, for a soft VL and in the presence of
disorder, the lattice can be compressed and vortices be-
come jammed at pinning sites. The softer the lattice, the
shorter the distance over which the distortion is damp-
ened. Note that, as we discuss a dc phenomenon, there
should exist a constant flow of vortices through the
sample. We believe that this is ensured by large contact
regions that act as vortex reservoirs.
The interplay between pinning and VL’s elasticity is
important in many vortex phenomena, and the spatial
scale, over which a VL behaves as almost rigid (responds
collectively), is usually determined by the correlation
length R
C
[15,16]. This concept had been successfully
used in the past to explain the behavior of j
C
in macro-
scopic thin films, where the only relevant elastic modulus
defining R
C
is the shear modulus C
66
[17,18]. For our
particular films, the maximum value of R
C
can be esti-
mated as 20a
0
(reached at 0:3H
c2
) and then R
C
gradually reduces to a
0
as H approaches H
c2
(here,
a
0
0
=B
1=2
is the VL period and B the magnetic
induction) [10,19]. This length scale is in agreement
with predictions [6,7] and clearly too short to explain
the observed R
NL
. For example, at 4.5 K, R
NL
was de-
tected at distances up to 5 m and in fields up to 3.5 T.
This means that the entire vortex ensemble between the
current and voltage wires, which is over 200 vortices
long, is set in motion by a localized current.
To explain these unexpectedly long-range correlations,
we argue that the VL in mesoscopic wires is much more
rigid than in macroscopic films due to its 1D character
and the presence of the edge confinement that prevents
transverse vortex displacements. Indeed, if there are only
a few vortex rows in a narrow channel, the only possible
deformation of the lattice is via uniaxial compression.
This deformation is described by compressional modulus
C
11
C
66
. In this case, the characteristic length, over
which one should expect collective response, is much
longer and given by another correlation length
C
C
11
=
L
1=2
, where
L
F
p
=r
p
is a characteristic of
the pinning strength, F
p
j
C
B the bulk pinning force,
and r
p
the pinning range (r
p
a
0
=2 for b > 0:2)
[2,20,21].
To calculate
C
H we used the expression C
11
0
B=2
0
2
a
0
k expected for a 1D channel [22].
Here, is the field- and temperature-dependent penetra-
tion depth [22,23] and k the wave vector of VL deforma-
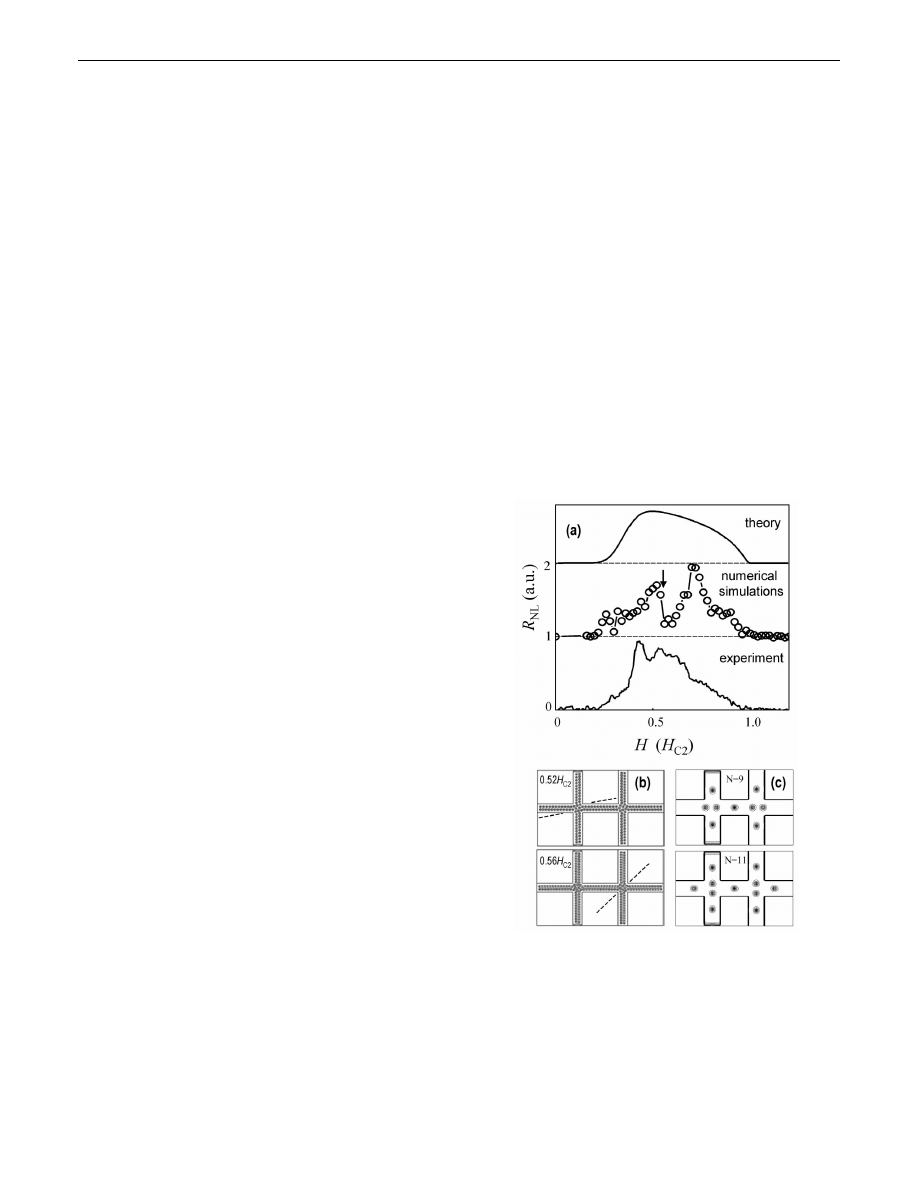
tion. Our numerical simulations show that the most
relevant k is given by VL’s distortion in the cross-shaped
regions [see Fig. 3(b)] and, accordingly, we assume k
1=w. The estimated
C
in intermediate fields at T 6 K
is 3–10 m, in agreement with our experiment. The
above model also describes well the observed field de-
pendences of R
NL
. The theory curve in Fig. 3(a) takes into
account that the nonlocal signal should decay as R
NL
/
expL=
C
where
C
0
:w
1=2
=2
0
:j
C
1=2
and
that, for narrow wires, it is thermodynamically unfavor-
able for vortices to penetrate the narrow wires until H
reaches a critical value H
S
0
=!w
. The latter effect
is modeled by pinning at the surface barrier, which re-
sults in an additional part in j
C
/ expH=H
S
. The
disappearance of R
NL
below 4 K is attributed to higher
j
C
at lower T. Note that the exponential dependence
implies that changes in j
C
by a factor of 4, which occur
below 5 K, result in a rapid suppression of R
NL
.
It is clear that the above description applies only to
wires that accommodate just a few vortex rows. As the
number of rows increases, the VL gains an additional
FIG. 3.
(a) Comparison of R
NL
H observed experimentally
(lower curve; data of Fig. 1 at 6 K) with the nonlocal signal
expected in the proposed 1D model (upper curve) and with
results of our numerical analysis (middle curve). (b),(c)
Snapshots of vortex configurations corresponding to pro-
nounced changes in mobility of 1D vortex matter. Dashed
lines indicate the average orientation of vortex rows in the
cross areas.
P H Y S I C A L
R E V I E W
L E T T E R S
week ending
11 JUNE 2004
V
OLUME
92, N
UMBER
23
237001-3
237001-3
(lateral) degree of freedom and a local compression be-
comes dampened by both longitudinal and lateral defor-
mations. One eventually expects a transition to the 2D
case described by the shear modulus C
66
and a much
shorter correlation length R
C
. In addition, as more vortex
rows are added, elastic correlations are expected to be-
come less relevant, as vortex dynamics becomes domi-
nated by VL’s plastic deformation [22]. The latter is
forbidden in a 1D case but in wider channels it can
become a dominant mechanism for dampening of collec-
tive flow. This qualitatively explains the disappearance of
R
NL
in wider wires.
To support the discussed model further, we carried out
direct numerical simulations of nonlocal vortex traffic,
using time-dependent GL equations. The middle curve in
Fig. 3(a) plots a typical example of the obtained field
dependence of R
NL
for the geometry shown in Fig. 3(b).
One can see that the GL simulations reproduce the overall
shape of R
NL
H observed experimentally. Furthermore,
the numerical analysis allowed us to clarify the origin of
fluctuations in R
NL
H: they appear due to sudden changes
in vortex configurations. Figure 3(b) shows such changes
for the field marked by the arrow in Fig. 3(a), where a
sharp fall in R
NL
is observed. Here, approximately two
additional vortices enter the central wire, which results
in a transition from an easy-flow vortex configuration
(H 0:52H
c2
) to a blocked one (0:56 H
c2
). In the latter
case, vortices in the cross-shaped regions are distributed
rather randomly and break down the continuity of the
vortex rows formed in the central wire. This leads to
blockage of collective vortex motion. For H 0:52 H
c2
,
vortices in the cross’ areas are more equally spaced, and
the corresponding vortex rows make a shallower angle
with rows in the central wire [Fig. 3(b)]. In this case, there
is less impediment to vortex motion through the cross
regions which leads to a larger nonlocal voltage.
The mechanism of the sudden blocking/unblocking of
vortex flow at different H becomes even clearer if one
considers an imaginary configuration containing just a
few vortices — see Fig. 3(c). Here, we find a sharp fall in
R
NL
when the number of vortices changes from 9 to 11
(N 10 is a thermodynamically unstable state for this
geometry). For N 9, the vortex row passes continu-
ously through the whole central wire, allowing its motion
as a whole when pushed or pulled along by a localized
current. In contrast, for N 11, there is a vortex pair in
each of the crosses which prevents such vortex motion.
In conclusion, we have observed pronounced flux flow
at distances corresponding to hundreds of VL periods
from the region where applied current flows. We attribute
the observed behavior to an enhanced rigidity of the
vortex lattice confined in narrow channels and provide
a theoretical model for this.
We thank M. Blamire, M. Moore, and V. Falko for
helpful discussions.
[1] G. Blatter et al., Rev. Mod. Phys. 66, 1125 (1994).
[2] E. H. Brandt, Rep. Prog. Phys. 58, 1465 (1995).
[3] I. Giaever, Phys. Rev. Lett. 15, 825 (1965).
[4] R. Busch et al., Phys. Rev. Lett. 69, 522 (1992); H. Safar
et al., Phys. Rev. B 46, 14 238 (1992).
[5] J.W. Ekin, B. Serin, and J. R. Clem, Phys. Rev. B 9, 912
(1974).
[6] M. C. Marchetti and D. R. Nelson, Phys. Rev. B 42, 9938
(1990).
[7] R. Wortis and D. A. Huse, Phys. Rev. B 54, 12 413 (1996);
S. J. Phillipson, M. A. Moore, and T. Blum, Phys. Rev. B
57, 5512 (1998).
[8] D. Lo´pez et al., Phys. Rev. Lett. 82, 1277 (1999).
[9] Yu. Eltsev et al., Physica (Amsterdam) 341C – 348C, 1107
(2000); J. H. S. Torres et al., Solid State Commun. 125, 11
(2003).
[10] P. H. Kes and C. C. Tsuei, Phys. Rev. B 28, 5126 (1983);
R. Wo¨rdenweber and P. H. Kes, ibid. 34, 494 (1986).
[11] A. Pruymboom et al., Phys. Rev. Lett. 60, 1430 (1988);
N. Kokubo et al., Phys. Rev. Lett. 88, 247004 (2002).
[12] The dependence expx=w follows directly from the
formalism introduced by L. J. van der Pauw, Philips Tech.
Rev. 20, 220 (1958). We have also validated this formula
for the zero resistance state through numerical simula-
tions using GL equations.
[13] Very close to T
C
, we observed a nonlocal effect of
another origin. This signal exhibits a different shape
and different L and w dependences (e.g., it could be
detected for any w but only for L 2 m). We attribute
the near-T
C
signal to quantum interference corrections to
conductivity [L. I. Glazman et al., Phys. Rev. B 46, 9074
(1992)].
[14] L. Burlachkov, Phys. Rev. B 47, 8056 (1993).
[15] A. I. Larkin and Yu. N. Ovchinnikov, J. Low Temp. Phys.
34, 409 (1979).
[16] H. R. Kerchner, J. Low Temp. Phys. 50, 337 (1983).
[17] P. H. Kes and C. C. Tsuei, Phys. Rev. Lett. 47, 1930 (1981).
[18] E. H. Brandt, Phys. Rev. Lett. 50, 1599 (1983); J. Low
Temp. Phys. 53, 71 (1983).
[19] N. Toyota et al., J. Low Temp. Phys. 55, 393 (1984);
J. Osquiguil, V. L. P. Frank, and F. de La Cruz, Solid State
Commun. 55, 222 (1985).
[20] A. M. Campbell, J. Phys. C 2, 1492 (1969); 4, 3186 (1971).
[21] E. H. Brandt, Phys. Rev. Lett. 67, 2219 (1991).
[22] R. Besseling et al., Europhys. Lett. 62, 419 (2003).
[23] E. H. Brandt, J. Low Temp. Phys. 26, 709 (1977); 26, 735
(1977).
P H Y S I C A L
R E V I E W
L E T T E R S
week ending
11 JUNE 2004
V
OLUME
92, N
UMBER
23
237001-4
237001-4
Wyszukiwarka
Podobne podstrony:
24 Phys Rev Lett 99 216802 2007
32 Phys Rev Lett 98 196806 2007
37 Phys Rev Lett 97 187401 2006
41 Phys Rev Lett 97 016801 2006
20 Phys Rev Lett 100 016602 2008
57 Phys Rev B 67 054506 2003
25 Appl Rev Lett 91 233108 2007 Nieznany (2)
11 Phys Rev B 78 085432 2008id Nieznany (2)
39 Phys Rev B 74 064403 2006
48 Phys Rev B 72 024537 2005
27 Phys Rev B 76 081406R 2007
14 Phys Rev B 77 233406 2008
46 Phys Rev B 72 Rapid Commun 201401 2005
5 Phys Rev B 79 115441 2009
43 Appl Phys Lett 88 013901 200 Nieznany (2)
29 12 10 02 12 51 am2 2004 popr
więcej podobnych podstron