
1
Learn to day-trade the E-mini S&P 500
Simple-as-123
Marshall J. Jones

2
I’ll Show You How to Day Trade
The E-Mini S&P in 60-90 Days…
Regardless of Market Direction!
Simple-as-123
#1 Knowledge:
You need to know what determines momentum.
#2 Information:
You need timely, crucial information to help you determine when that
momentum is the best time to make the trade, and when to get out in order to minimize your risk
and maximize your profits.
#3 Belief:
You must have a belief in yourself that you can do it. It’s that belief in yourself
that gets you to take action. You have to act on the first two ingredients (knowledge and
information) in order to make this method work for you.
Notes: Don't Ask Questions Now…Wait Till You Read This Manual First --
I’ll explain what it all means as we go along in the manual!
New to the game?
If you are not an experienced day-trader, and don’t know the basics…please go to page 55
Know it all?
You might want to review the basics anyway…you just may learn something new!
Predicting the future is easy. It’s trying to figure out
what’s going on now that’s hard
Fritz R. S. Dressler
President FRS Dressler Associates

3
Table of Contents
Preface 4
Acknowledgements
5
Bio…Thought you’d never ask!
6
Introduction
How does it work
8
Knowledge
9
Information
10
Belief -- Discipline
11
Your Charts
13
Logging on to RealTime Charts
14
Loosen Up – US Stock Market Window
15
Keep a Diary if You Really Want to Learn
17
Short Hand
17
The Concept
19
Momentum
21
This is How I Do It
22
Trade Log with Time Zones
23

4
Preface
I had been trading for about five years, and had very little success with short or long term
trading. I became fascinated with the idea of day trading. I was always looking for the Holy Grail
and as we traders know, there is no such thing. We all spend way too much money for the hype
that's out there, and with all the talk on the street about the money being made day-trading I
started to look for a system or method to trade the S&P, but when I looked into the amount of
margin you needed I quickly became disillusioned. I’m not in that league as it takes over
$25,000.00 to trade one contract! I had heard of mini contracts and found you could trade the
Emini S&P; it’s one-fifth the size of the big S&P; and is traded electronically on Globex with no
need to talk over the phone to a broker. Well, it fit right into my style of trading. I guess I like the
action, and I don't like all that research for trading long-term positions.
I started looking at charts and watching the news on CNBC everyday. I read everything on day
trading that I could get my hands on. I think, because of all the stuff I had read about, such as
fundamentals, technical analysis, and all those crazy indicators like RSI, Fibonacci numbers,
Gann lines, Elliot waves, Stochastics, it would be just too difficult. Then I read an article written
by one of my favorite teachers, Larry Williams and a co-author Miles Dunbar, they wrote an
article for Futures Magazine, “Trading Strategies For the Future… The E-Mini Nasdaq 100” and
in the article, he used an indices as an indicator, and in the same magazine article another writer
used a different indices as an indicator. I said to myself…Self, why don’t you use both, as an
indicator … the rest is history.
I did not have a losing trade for over a year when I first started, I was very conservative, and only
went by what I perceived to be the perfect scenario to trade the E-mini. The method worked well
during the big Bull Run in the late 90’s. You could not make a bad trade with this method if you
tried! I kept trying to tweak it and find more days to trade it. I had quite a few friends and fellow
traders wanting to try it so I began to teach the method during the most volatile time of the
market. The method worked, but it took patience and discipline and a bigger drawdown.
I could write a whole chapter about trying all those crazy indicators. Man, all that stuff gave me
brain cloud. I tried to put too much into it. I know now, after teaching students who knew
nothing about trading, that they do much better than the experienced trader who has too much
emotion and indicators to look at. This method is simple, and I will attempt to show you how
simple it is in this manual. I will teach you just what you need to know, no more, and no less.
Jake Bernstein said it takes ten years to develop a system or method ... we will see! As I write
this we are in a bear market and it could be a whole new ballgame.
Remember the acronym "Kiss" ... Keep It Simple Stupid
Happy trading ... Simple-as-123
Marshall J. Jones
Day trader

5
Acknowledgments
To my wife Helen, the computer widow, who brought me my coffee each and every morning,
and made sure I got the latest business news from the newspaper. For her patience, and love, I
owe her a debt of gratitude. We could have been traveling all over the States, having a great
time, but she never complained. Wow! … What a wife!
My daughter Renee, who took the time out of her busy day to help me proofread this manual,
She holds down three jobs and has Ryan, her three-year-old son…who also tries to help me on
the computer. When I’m trading, he likes to cheer me on. (I have to be very careful what I
say…if you know what I mean.)
My soon to be son in law, Frank Giganti, who prods me on with his marketing insights and
Sharon my second daughter, for all of her e-mail letters of encouragement and suggestions. She
makes me laugh, and see the sunny side of life.
And to the rest of my family, Darlene my youngest daughter, her husband Greg and their two
sons Joey, and Frankie, for their words of encouragement. And last but not least, my two sons
Marshall and Michael who asked everyday, “What in the world are you doing up there dad?”
I am so thankful for all of the traders who have touched my life with their opinion, suggestions,
systems, methods, testimonials, and those who took the time to trade with me live, using the live
charts on quote.com, and Yahoo! Messenger. It was a blast, guys! I really learned a lot about this
method and myself with you on line.
A special thanks to Thom Huntington, who helped edit part of this manual.
Let’s not forget Lycos, Quote.com’s Live Charts, Yahoo, and paltalk for their great Messenger,
and chat room software.
It's only when we truly know and understand that we don't know ... and had no way of knowing,
that we know we have to find out what we don't know.
Marshall J. Jones
Day-Trader, writer, poet, teacher, printer, pilot, marketing guru
Father, grandfather, and all around good guy
But only in my own mind!

6
Thought you'd never ask!
Well it's been one hell of a ride! An adventure like a Tom Sawyer and Huckleberry Finn novel,
and it's not over yet.
I was born in El Centro, California, about 100 miles east of San Diego, where my family moved
when I was about seven years old. My dad had bought Acme Printing Co., one of the oldest
printing firms here in San Diego, dating back to around 1905 or earlier.
After graduating from high school and volunteering for the draft, I was offered a chance to take
my choice of any school the Army had to offer, so looking for the big bucks ($55.00 extra per
month), I chose the Army Airborne. By the way, I don't recommend jumping out of a perfectly
good airplane.
I went through jump school at Fort Campbell Kentucky, and was also given a chance to attend
the Ranger School at Fort Benning, Georgia. That's what I get for being gung-ho, and
fortunately for me, an armistice had been declared in the Korean War.
With my Honorable discharge from the Army in 1956, and the offer to pay me to go back to
school, I was able to get my commercial pilot's license, and look for a job with the airlines here
in San Diego. But no luck here; all of the pilots coming home from Korea got the jobs.
Joining my Father, I managed the family printing business. I met my lovely wife, got married,
and had five children. I attended San Diego Junior College, and San Diego State College (it was
not even a University in those days), taking classes in business and marketing. After my father's
death, I owned Acme Printing Co. and other various business enterprises for over twenty years.
I was very active in San Diego, joining various Civic organizations; San Diego Junior Chamber
of Commerce, past chairman of the Aviation Committee, formed the San Diego Jaycee Flying
Club, Past President of Harbor Lions, Flotilla 11, U.S. Coast Guard Power Squadron, Air Search
and Rescue, Antique Air Craft Association, San Diego Aerospace Museum, and was a member
of the San Diego Elks Lodge. Busy, busy, busy!
I started many various companies in the twenty years I was active in the printing business. Some
of these businesses included American Traders Manufactures and Buyers (ATMAB - Anything
To Make A Buck), Presto Prints of California, The Sand Box, Tattoos by Joyce, Joyce
Enterprises Inc., M & J Marketing, Marshall Air, San Diego Sky Hawks Inc., and Typro
Graphics.
I retired from the printing business in 1976, and formed Joyce Enterprises Inc., a corporation
involved in marketing and business consulting. I was a major shareholder and served on the
Board of Directors as Vice President, in charge of marketing, and product development. I also
became a business consultant, specializing in product development for other start up companies.

7
I came out of retirement in 1986 after some bad investment decisions, and went to work as a
manager of Paper Plus, a division of Unisource World Wide. I retired again after fourteen years
in September 2000.
My many hobbies over the years include, backpacking, rebuilding antique aircraft, flying,
boating, fishing, writing poetry, reading and watching Biography and the History channel, and
last but not least, teaching day-trading.
Looking for additional income, I happened to receive a familiar mail order pamphlet in 1994.
You know the one... how to get rich quick in the commodities and futures business.
I jumped right on in. Needless to say, I didn't get it. I kept looking for the Holy Grail! I read
everything I could get my hands on, attending seminars and lectures on how to get rich. I spent a
small fortune on books, systems, and methods by the likes of Ken Roberts, Jake Bernstein, Nick
Van Nice, and our old favorite Larry Williams.
Nothing worked for me, except an education in the commodities and futures business. Still
thinking that this is a possible way to make money at home, I read an article on day trading in
Futures magazine. I tried paper trading some of the ideas presented in the article on the S&P; it
just gave me brain cloud - way too much stuff to think about. In another article in Futures, Larry
Williams and Miles Dunbar wrote about trading the Nasdaq 100 and looking at a divergence in
the Dow. Another article in the same magazine written by Michael A. Mermer talked about
using the Nasdaq 100 as a leading indicator for the S&P 500 futures and said it was a great day-
trading vehicle. At first it did not really sink in until I started watching CNBC on television.
They have those little arrows in a box showing the change in the Dow, Nasdaq, and S&P 500. A
light went on for some reason and I started watching every morning, keeping my eye on the Dow
and the Nasdaq. At first I was looking for the divergence, then I noticed that when both the Dow
and Nasdaq were in sync, the S&P 500 followed.
Hey the rest is history!
Simple but not easy… fear and greed are your enemies; patience and discipline are your tools,
practice is the only way to achieving your potential
Marshall J. Jones
Day trader

8
Introduction
How does it work?
… Simple-as-123
There are three indices that we look at after the market opens…and
through out the day, they tell me which way the E-mini S&P is
going. They are not indicators in the true sense of the word, but
that’s what I call them.
#1 The Dow #2 The Nasdaq #3 The S&P 500
Nuance: We don’t make a trade during the first half hour. (We let the market settle down and
wait for the first reversal or momentum to build.) You will learn this by watching for the first
thirty days or so; when to trade at the open or wait for an hour or two.
Please note the word commodity is used herein for the most part
interchangeably with the word futures. Futures contracts are now
traded on many goods and services that are not strictly commodities in
the traditional sense. The concepts, ideas, and descriptions in this
manual are applicable to futures whether the underlying “commodity”
is agricultural, financial, indices, industrial, foreign or domestic.
There is no scarcity of opportunity to make a living at what you love; there's only a scarcity of
resolve to make it happen.
Wayne Dyer
Psychotherapist and writer

9
Knowledge
c.) Books on the subject of trading futures:
Ken Roberts, Jake Bernstein, Larry Williams and Nick Van Nice (these were the guys who
taught me the basics…and much more).
d.) Commodity Exchanges:
You may contact each exchange for a vast array of free publications regarding commodity
trading, history, facts, and data…Most of the information for this manual was from their
publications.
You should be familiar with trading futures. I have written the basic fundamentals of day trading
here. Read it if you are not knowledgeable.
You can get all the knowledge you will ever need from the Commodity Exchanges, and your
brokerage firm.
Things you must know:
•
The Dow, Nasdaq, and the S&P (how it relates to this method.).
•
How to place your order. (We use Market orders.)
•
Stop loss. (We use a mental stop loss.)
•
The long and the short of it. (Buying and Selling.)
•
Risks. (Leverage, margin, too high, or too low.)
•
Futures contract. (The calendar... The ES is every 4 quarters.)
•
Trading hours for the day session (Open, 9:30 – Close, 4:15 ET)
•
Open, high, low, and last. (Or price at the close.)
•
Technical analysis. (You need to learn just a little bit.)
•
Price bar. (I prefer a 5-minute price bar.)
The way to get started is to quit talking and begin doing.
Walt Disney (1901-1966)
Film and theme park entrepreneur
10
Information
How to get the information:
a.) Television on CNBC
or on your computer www.cnbc.com
b.) The Internet (your ISP):
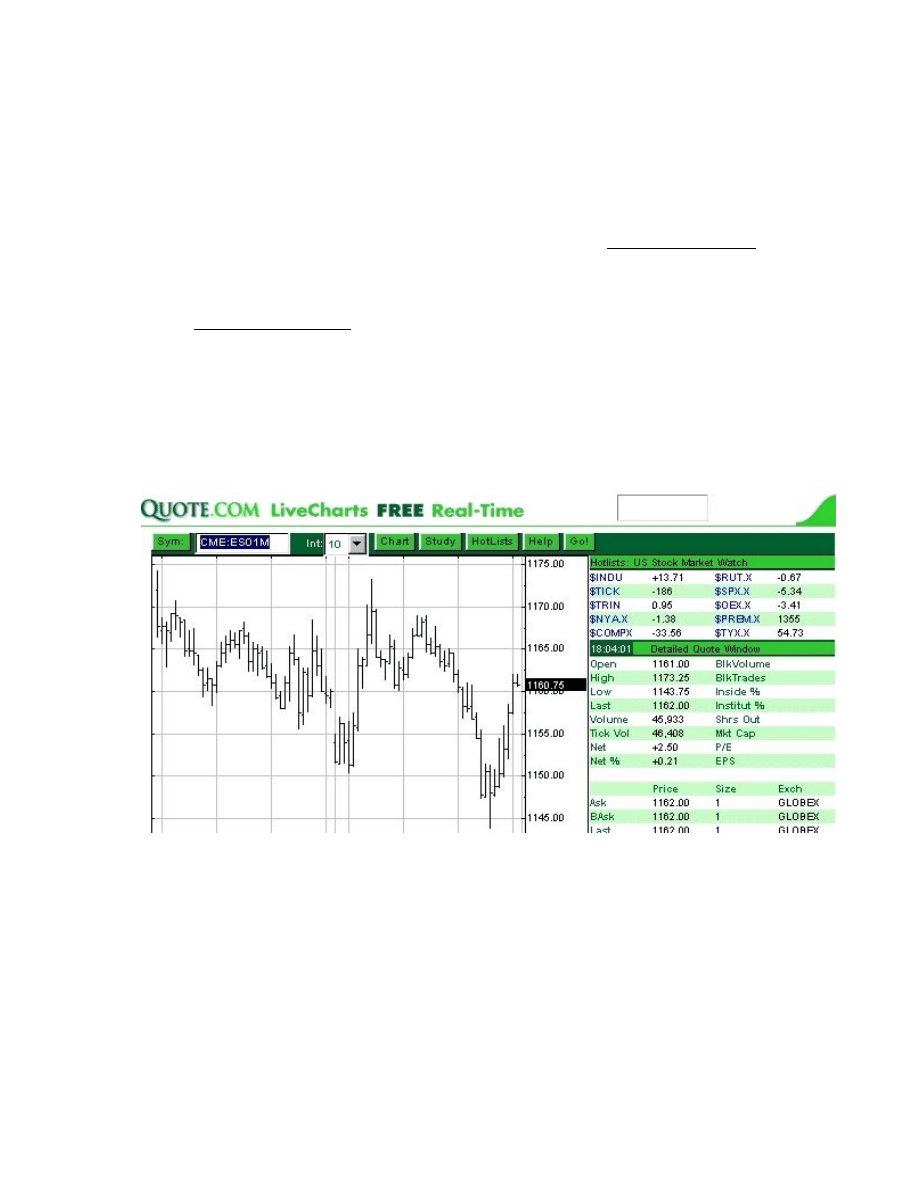
Go to www.quote.com See the chart illustration below.
Best seen on your computer, follow the instructions above the chart.
Instructions for live charts:
Use live charts, it’s on the home page’s menu bar and use the symbol ES01M. These letters and
numbers represent the contract, year, and front month that are now being traded. This is for
illustration purposes; the month and year you would actually use should be the current month,
and year being traded.
Figure 1 Chart of the Emini S&P…June contract 2001.
You are searching for the magic key that will unlock the door to the source of power;
and yet you have the key in your own hands and you may make use of it
the moment you learn to control your thoughts.
Napoleon Hill (1883-1970)
Success writer

11
Belief
• Self-discipline…Follow your strategy.
• Persistence…Stay in the game. Don’t quit after a few losses.
• Consistency…Follow the plan on every trade.
• Self-Control…Fear and Greed. All psychological!
• Knowledge…Understand how the market works.
Discipline:
a.) When in doubt stay out!
b.) Cut losses quickly. Winners always recognize when they are wrong and act accordingly.
Losers rationalize and forget what they were really trying to accomplish.
c.) Learn from your mistakes. Have faith in what you’ve learned.
d.) KISS: keep it simple stupid. Do not try to learn about fundamentals. The only
fundamental information I use is reports and Fed remarks that come out once in while.
You can find these reports on CNBC and quote.com. Use very little technical analysis,
and this method will be Simple-as-123!
e.) Attitude: Have confidence in your ability to act. Take responsibility for your own trades.
f.) Study the psychology of trading. Learn how to deal with your emotions. You win some
and you lose some. But stay in the game, the next trade could be the big one that makes
up for all those small losses. Ask yourself, “Am I psychologically and financially suited
for day-trading?”
g.) Follow your plan. Write out your plan. The risk the reward, mental stop loss, exit target,
and after you write it all down. Enter your order and proof read your order—twice. Twice
I said!
h.) I am a day-trader! I am flat at the end of each day, no matter what. The most common
mistake new and experienced traders make is holding losers. (Flat = HAVING no current
market position.)
i.) Write on the blackboard 100 times—Discipline—
Don’t cut and paste either…I’m watching!

12
Discipline Discipline Discipline Discipline Discipline Discipline
Discipline Discipline Discipline Discipline Discipline Discipline
Discipline Discipline Discipline Discipline Discipline Discipline
Discipline Discipline Discipline Discipline Discipline Discipline
Discipline Discipline Discipline Discipline Discipline Discipline
Discipline Discipline Discipline Discipline Discipline Discipline
Discipline Discipline Discipline Discipline Discipline Discipline
Discipline Discipline Discipline Discipline Discipline Discipline
Discipline Discipline Discipline Discipline Discipline Discipline
Discipline Discipline Discipline Discipline Discipline Discipline
Discipline Discipline Discipline Discipline Discipline Discipline
Discipline Discipline Discipline Discipline Discipline Discipline
Discipline Discipline Discipline Discipline Discipline Discipline
Discipline Discipline Discipline Discipline Discipline Discipline
Discipline Discipline Discipline Discipline Discipline Discipline
Discipline Discipline Discipline Discipline Discipline Discipline
Discipline Discipline Discipline Discipline Discipline Discipline
To profit from good advice requires more wisdom than to give it.
John Churton Collins

13
Your Charts…
Use what you like, but please at least take a look at quote.com’s charts so you can see what I see
to follow the method…after you see what I look at, then set up your platform to get the same
information you need for this method.
Quote.com
These are the charts I use…I think they give you the best layout for my
method.
Take heed…quote.com is not very stable as I write this manual. I hope they will continue to
improve and make it a more dependable platform.
My set-up
For my charts: I use 3 or * 4 charts on my screen.
1.) 5 min. ES chart with a 10 period moving average and volume indicator.
2.) 5 min. COMPX chart with a 10 period moving average indicator.
3.) 15 min. ES chart with a MACD indicator. I use the default settings.
* Once in while I will put up a 5 min. $INDU chart of the DOW using the 10 period moving
average; it can bog down your computer if you don’t have a ton of Ram memory. The more
memory you have for quote.com the more windows you can open up, but try to keep it simple.
I only use the default settings on quote.com indicators!
No sense being pessimistic. It wouldn’t work anyway.

14
Logging On to RealTime Charts…
Go to www.quote.com
Click on log in, and follow the log in procedure. After you log on do the following:
Select “LiveCharts” from the menu bar.
(
See illustration of the home
page and also the chart)
IMPORTANT Note:
These LiveCharts of the Emini S&P are only $9.95 per month plus exchange fees and are
real-time.
It will support the following browsers:
Netscape 4.7 and above
Microsoft Internet Explorer 5.0, M.S.Outlook 5.0, and above
The LiveCharts applet is also supported on the following operating systems:
Windows 95/98 --Windows NT 4.0 and above, and Windows 2000. At the present time (Jan.
2002) they will not work on a Macintosh.
FAQ’s (Frequently asked Questions) on the quote.com live chart site. Read these it’s very, very
important! It will explain most of the information in the different windows on the menu bar on
the live chart.
A Little Trick
Most traders don’t know this little trick…just click on the window just below the clock, there is a
colored bar that says Time, Price, Info, Exch., and Size, just click on the streaming data…You
should now see a new window. This is my preference on my 15 minute ES chart! I can now see
the Open, High, Low, and last, also the Price information…Ask, Best Ask, Last, Best Bid and
Bid. And all that stuff in the upper window, which are the meat and potatoes for this method…all
right in plain sight. Watch the Emini S&P stream in real time. For only $9.95 per month plus
fees!
Ninety percent of those who fail are not actually defeated. They simply quit.
Paul J. Meyer
Entrepreneur and writer
15
Loosen Up … I’ll Save You Some Time
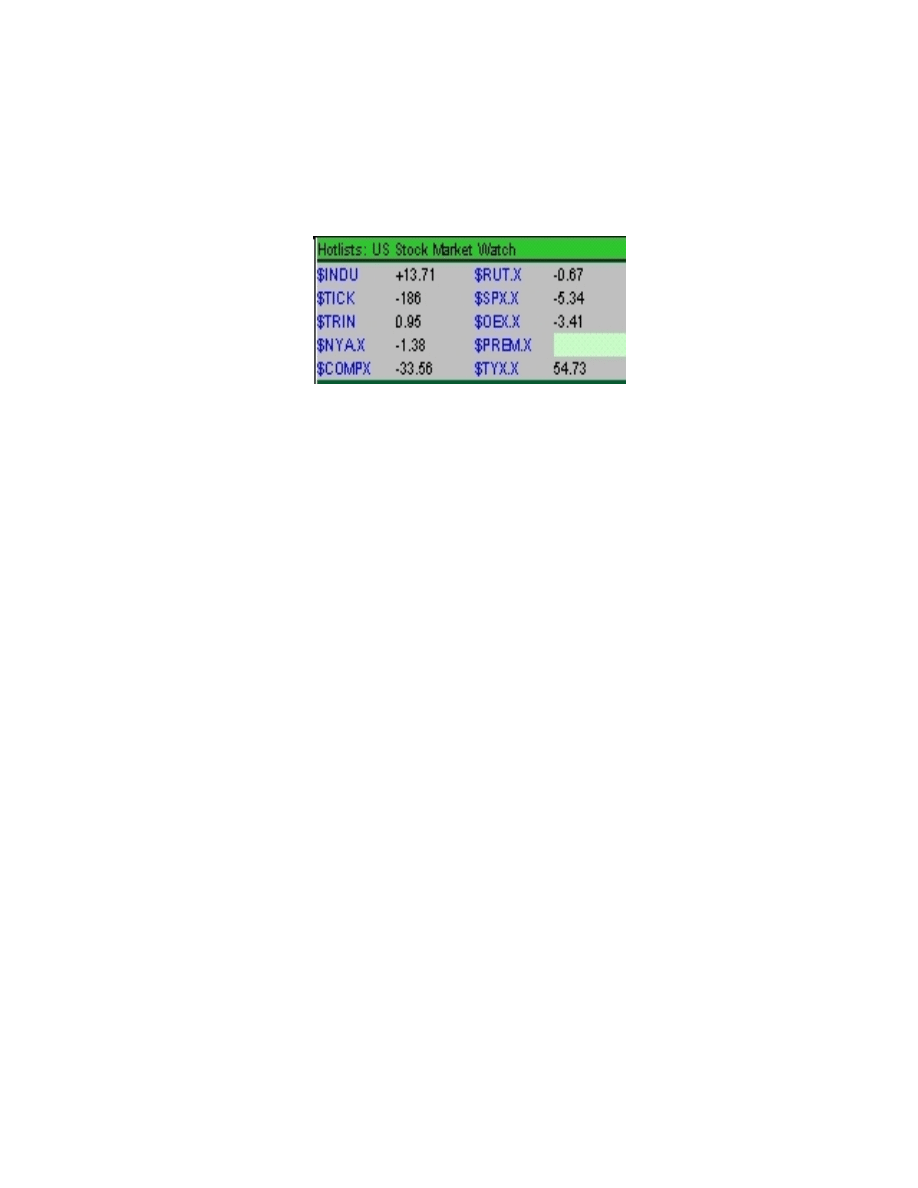
On the right hand side of the chart…under the colored bar labeled…US Stock Market
Watch…In the left hand part of the window is the following:
$INDU: It’s the Dow.
$TICK: It’s an indicator - number of stocks trading on up-ticks minus number of stocks trading
on down ticks. It’s used to show strength or weakness in the market. If more stock trades occur
on up-ticks…that is, at a price higher than the previous trade…than on downticks, the market is
showing strength, which can be measured by the combined numbers. Values over +200 or so are
bullish and –200 are bearish.
$TRIN: In general, if the result is greater than 1.10, the indicator is bearish. A value of 0.90 or
less is considered bullish.
I like to see the TICK and the TRIN both going my way when I’m making a trade. Better safe
than sorry!
$NYA.X: It’s the New York Stock Exchange.
$COMPX: It's the Nasdaq.
In the right hand part of the window:
$RUT.X: It’s the Russell index.
$SPX.X: It’s the cash S&P 500 Index (the big S&P)
$OEX.X: It’s the commodity Index
$PREM.X: It’s the real-time difference between the active S&P futures contract and the index.
They calculate this and send it out real-time.
$TYX.X: It’s from the CBOT (Chicago Board Of Trade) and is the yield on the 30 year Treasury
bond.

16
VOLUME:
I use a simple moving average indicator on quote.com on my 5 minute ES chart; they also have a
moving average and volume indicator…try it maybe it will just give you a clue when volume is
effecting the market.
Be sure to watch the volume of the market carefully at price extremes. Declining volume usually
means the market is not accepting these higher or lower prices and could indicate a turn. A
market that is topping or bottoming out does not spend much time at the extremes, so there will
be little volume at these points. I cannot stress the importance of daily volume enough. When
volume is very low...you may get poor fills.
We want VOLUME!
REMEMBER:
Let the market determine the trend, and trade with the trend by buying on the way up or selling
on the way down.
Patience is power.
Patience is not an absence of action; it is "timing";
it waits on the right time to act, for the right principles and in the right way.
Fulton J. Sheen
1895-1979 Clergyman

17
Keep A Diary If you really want to learn…
Make screen shots of your trades or print them out if your software has that feature. While paper
trading, make screen shots of the chart and use the short hand below on computer post-it-notes,
too show where the Dow and Nasdaq were, when you decided to make the trade.
To really learn this method in 90 days, take screen shots of the chart every 15 minutes; from the
open up to 12:30 eastern time. It sounds like a lot of work but it’s simple; it will also keep you
focused, and you will have an accurate record of where the Dow, Nasdaq, and Emini S&P over
the course of the day. Now you can go back and look at your notes and see what really took
place in that time frame.
It’s the best teacher and it’s free! If you have the patience, take all 28 shots for the day…or use
my Trade Log and Time Zone and just write the information down every 15 minutes.
Learn this simple short hand to keep your Diary up-to date:
• Dow
d
• Nasdaq
n
• Emini S&P
es
• Up
+ or up
• Down
- or dn
• Channel
Ch
• Powertrade
pt
• Sideways (chop)
sw
• Momentum
mom
• Number of contracts
> 1
• By the way
btw
• Double top or bottom DT or DB
• Triple top or bottom TT or TB
This is how it should look:
7:30
8:30
d+25
d+45
n+15
n+30
es 1330.00 > 2
es 1334.00 out < 2

18
Interpretation of the shorthand; it should work like this:
At 7:30 the Dow was 25 points up and the Nasdaq was up 15 points, the Emini S&P was at
1330.00 and I bought 2 contracts. ----- At 8:30 the Dow was 45 points up and the Nasdaq was up
30 points and I sold both contracts at 1334.00
Note:
You need to make those screen shots at the open and then every 15 minutes. It’s important! That
way you can study what took place and see where you were when you decided to make the trade.
Or you may see something unusual. Jot down a note and learn from it.
(Show a sample chart and note)
This is a reminder…just do it!
The minute you make the trade, make a screen shot of the chart and
your order. Your trading software may have this feature to print built
into the program.
Now you have a record just in case your brokerage firm posts an
error on your statement.
Luck is being prepared for the opportunity when it comes.
No matter what happens, keep on beginning and failing. Each time you fail, start all over again,
and you will grow stronger until you find that you have accomplished a purpose…not the one
you began with perhaps, but one you will be glad to remember.
Anne Sullivan (1866-1936)
Helen Keller’s teacher

19
The concept…
when the Dow, Nasdaq and the Emini S&P 500 are all trending
up or down, (otherwise known as synchronized) it can signal a time to make a trade. Waiting for
the three to become synchronized can take awhile, so just be patient. What I am looking for is
momentum. It may take an hour or so. The idea is if the DOW and the Nasdaq are both going
up, the E-mini S&P 500 will follow. That’s really all there is to it.
Here is something that is hard for most newbies (new traders) to understand, regarding in
sync…if the Dow is up 50 points and the Nasdaq is down 25 points, and all of a sudden the Dow
loses 25 points, that is momentum, and is really in sync with the Nasdaq. Having just lost 25
points, the numbers don’t have to match, just be moving in the same direction. One of my
favorite starting points is to have the Dow trading at +25 and the Nasdaq at +15, and to have
both moving in the same direction…with momentum.
What do I mean by momentum? When a market is moving quite a few points in just a few
minutes that’s momentum. You will get the gist of it after watching the market for a few days.
Try to pick a time when you would make the trade. See how you did after you made the decision
to trade. Watch out for the nuances and the Time Zones at the end of this example.
I can’t emphasize how important it is to keep a diary on how you decided to make this trade.
Use the short hand and write down at what point each of the three indicators were when you
decided to make the trade. This will help you review your entry points after you have traded for a
while. How long did you hold it and at what point did you decide to get out? I print out a copy
of the order activity sheet from my broker after I make the trade and I jot down a few notes to
indicate why I made and why I got out of the trade. The most important notes should be why
you lost. Figure it out and write it down.
Let’s look at an example. The Dow is trading at 10500 and is up 50 points from the day before.
The Nasdaq is up 25 points and the S&P is trading around 6 points or higher. All trending up or
they can all be trending down. It's time to make a decision…let’s go for it! (For those of you who
don’t watch the market or who do not know what I mean by up or down from the day before, or
don’t know what a point is…I will explain this in the back of this manual. See the index for any
questions you might have.)
(Note—Watch out for all of the time zones to be avoided? listed in chapter two.)
Ok, ok! Each point of the E-Mini S&P is worth fifty bucks.
Before placing our order we must make a decision on how much we are willing to lose and what
our profit target is. I use a $100.00 mental stop loss. With some brokerages, you can’t use a real
stop loss on Globex 2 (The computer platform used by the Emini S&P to track trades.) I’ll teach
you what I mean by this later in chapter two. This market has a large trading range, it can move 6
points up or down in just a minute or two. If you have a small stop loss of only 2 or 3 points you
might have a tendency to get stopped out too soon. Look at your chart and see how many points
each bar is in the number of points from the open of the bar to the close of the bar, give yourself
this much room so you don’t get stopped out before you even get started. This does not mean

20
you have to lose $150.00 (3 points). Risk more if the bars are longer than 3 points. The point is
you have to give this trade some room. You will learn when to pull the plug.
I like to make at least $200.00 dollars a day (4 points). The market needs to move up or down 4
points, using just one contract. Buy four contracts and take home $800.00. If I see the Dow, the
Nasdaq, and the S&P still trending up or down in the same direction as my trade, I’ll let it ride.
(See chart illustration 2.1) If the Dow starts trending too much in the opposite direction of my
trade, and even though all of the indicators are in my favor (Called a pullback), I might make a
decision to take my profits now. If I have two contracts I might sell one and let the other one
ride. You’ll get the hang of it after you paper trade this method for two or three months.
There are days when all three indicators will not synchronize and you can’t make a trade, and
there are days when the market will go against you. Try to take small losses and the big trades
will come. Work with this method for a month or two and you will see what I mean. If you like
to make high risk trades, I will teach you how to be an aggressive trader.
So why do we as future traders, care so much about the Dow, the Nasdaq and the S&P 500? …
Because they are great leading indicators of the E-Mini S&P!
It is better to look ahead and prepare than to look back and regret.
Jackie Joyner – Kersee
Olympic track and field champion

21
Momentum
As defined in the dictionary:
1. Symbol p Physics. A measure of the motion of a body equal to the product of its mass
and velocity. Also called linear momentum.
2.
An impetus of a physical object in motion. b. Impetus of a nonphysical process, such as
an idea or a course of events: The soaring rise in interest rates finally appears to be
losing momentum.
3.
Philosophy. An essential or constituent element; a moment.
Pretty much covers it! … Huh?
This is what I mean about momentum!
The measure of the motion and movement of the indicators we are looking at; that we use to
make a trade…Dow, Nasdaq, and Emini S&P.
This is the most difficult part of this method to understand, and it’s also very subjective. I cannot
make it mechanical, as you will see when you start to paper trade.
I will try to cover how we use momentum in an example later in another chapter. Learning this
skill is paramount to making the trade low risk. So pay close attention when we cover this
subject. It’s the key to success! Takes lot’s of practice…you will see it for yourself.
Right now a moment of time is passing by!
We must become that moment.
Paul Cézanne (1839 – 1906)
Artist

22
This is how I do it…
I have my computer all set up to make a trade with the software on the web site from my
brokerage firm. It’s really quite simple! I watch CNBC for the morning news, CNBC also sends
me an email after the market closes, called Money Wizard, (CNBC at cnbc.com and get Money
Wizard at http://www.cnbc.com it has most of the market news, and it warns me of any reports
that are coming out. I also read quote.com’s home page for their point of view. Then I click on
live charts of the Emini S&P on quote.com. (I use the “All sessions” in the chart type) and look
to see what the night traders were up too.
At the open of trading which is 9:30 EST I look to see if I can trade the open…maybe a gap trade
or I see the Dow and Nasdaq in sync and moving like a rocket. If not, then I wait for the first half
hour and look for the first reversal, or just let the market settle down. You can just read the
paper, and have a cup of coffee, watch CNBC, and keep your eye on the three indicators on the
lower right hand side of the TV screen. When you see the Dow and Nasdaq get in sync and you
think you may have an opportunity to make a trade, then go look at the chart on your computer
screen and prepare your order. Just remember the concept…Simple-as-123!
(Use a piece of artwork to show what it really looks like).
Figure 2 CNBC’s illustration showing the change in points from the day before.
Nothing stops the man who desires to achieve. Every obstacle is simply a course to develop his
achievement muscle. It’s a strengthening of his powers of accomplishment.
Eric Butterworth
Clergyman
Dow
^
Nasdaq
^
S&P
^

23
Trade Log with Time Zone
Make an Excel Form or whatever spreadsheet programs you use
of the file on page 24.
I will send you a pdf or the Excel file on request.
E-mail me at:
mjjones35@cox.net
Or try my web site:
www.simple-as-123.com
Website should be up and running by Feb. 15th 2002
24
Time Zone and Trade Log
Date:
TIME
DOW
NAS
ES
TRADE
B / S
EXIT
NOTES
W / L P T ' s
9 : 3 0
9 : 4 5
9 : 5 0
1 0 : 0 0
1 0 : 1 0
1 0 : 1 5
1 0 : 2 5
1 0 : 3 0
1 0 : 4 5
1 1 : 0 0
1 1 : 1 5
1 1 : 3 0
1 1 : 4 5
1 2 : 0 0
1 2 : 1 5
1 2 : 3 0
1 2 : 4 5
1 3 : 0 0
1 3 : 1 5
1 3 : 2 5
1 3 : 3 0
1 3 : 3 5
1 3 : 4 5
1 4 : 0 0
1 4 : 1 5
1 4 : 3 0
1 4 : 4 5
1 5 : 0 0
1 5 : 1 0
1 5 : 2 5
1 5 : 3 0
1 5 : 4 0
1 5 : 4 5
1 6 : 0 0
1 6 : 1 5
ZONE

25
Charts will go on this page
Habit is habit, and not to be flung out of the window by any man,
but coaxed down stairs a step at a time.
Mark Twain (1835-1910)
Writer and humorist

26
Charts go here
Almost means not quite. Not quite means not right. Not right means wrong. Wrong means the
opportunity to start again and get it right.
Don’t know who said this…do you?

27
Globex
Commodity Traders Discussion Forum
E-mini trading, General comments
Gunter Kaiserauer posted this article on the Commodity Café (A trading forum I frequent after
trading hours.) Thursday, 23 March 2000. Gunter is a broker, CTA, Educator, and is active on
many trading forums. (gunter@betterfutures.com)
“We often read comments about which brokerage house gives the better or worse fills, and
slower or faster executions on e-mini contacts.
A few words of explanation:
E-mini contracts are traded on an electronic exchange. Once an order is entered into the Globex
computer, only the computer decides how the transaction is being handled, and what fill you are
going to get. There are no differences between having your account with one firm or another. In
that respect, all brokerage firms are equal.
The computer processes the orders in the chronological sequence they were entered. Your fill
should come back within 2-4 seconds, on a normal business day.
However, there are differences in other areas:
As far as “stops” are concerned, the Globex allows only “stop-limit” orders, not regular
“stop” orders. To facilitate regular “stop” orders, another CME computer is used which stores
your stop order and monitors the e-mini price. When your stop price is triggered, it converts our
stop order into a market order. (Even though this process is done electronically, there is a tiny
time delay involved in doing this).
Again, once your stop order has been entered into this system, your brokerage house is not any
better or worse than another brokerage house. However not all brokerage firms are approved
for this set-up. Those brokerage firms, who are not approved, use a clerk in their own offices to
monitor prices and convert your stop order manually. Needless to say, this takes a bit longer
than a completely electronic process.
Somebody made the comments today, that e-mini trading presents no risk to the brokerage firm.
This, of course, is not true. A day-trader can wipe out his account in a matter of a few hours, if
he is left to trade unsupervised.
Some firms (especially the ones that let small accounts trade online) control this risk by having a
clerk intercept each online order and check it against account equity and the day’s earlier
trading activity. Obviously, this takes away one of the main attractions of e-mini trading: speed.
Other firms, let the orders go through without interception, but control their risk exposure by
asking for higher account equity.

28
Finally, there is the quality of the software. Not all online software works smoothly and
efficiently. I have heard some horror stories to that respect, and we took in some ‘refugees’ from
other firms, even though the other firm offered lower commissions.
Slippage on the e-mini S&P is generally less than on the big S&P. Although, from time to time
the e-mini gets into an area void of resting orders. This can result in unusual distortions and
unexpected slippage. The worst such case was a year, or so, ago, when Greenspan made an
unexpected announcement which rattled the markets. Slippage on stop orders in the big S&P, on
that day was in the neighborhood of 1200 points, whereas slippage in the e-mini was 3200
points.
The worst problem with e-mini trading is this: you don’t have a broker any more who you can
blame for bad fills. That leaves only one guy to blame for your losses: yourself! For some
traders, this can be a devastating experience.”
Gunter Kaiserauer
Broker, CTA, Educator
There is only one group of people who don’t have problems and the’re all dead. Problems are a
sign of life. So the more problems you have, the more alive you are.
Noman Vincent Peale (1898 – 1993)
Clergyman and writer

29
Building A Trading Strategy…
Your Plan
Requires using technical analysis, fundamental analysis (very little) and some select indicators,
e.g. the Dow, Nasdaq and the S&P 500. I call these indices indicators because we use them to
find momentum to make the trade on the Emini S&P. The important factor is how to define the
risk and the reward. After watching the TV for a few weeks you should have come to a
conclusion of how far up or down the S&P can go in a day. If it has moved too far too fast at the
open…the risk is too great for the reward. (See illustration 3.1) If it’s too far down, it probably
won’t give you enough reward to pay for the commission and charges. It has to have room to
move past resistance or below support to move any further up or down. Some other technical
indicators I use are the MACD crossover, volume, gaps, and watching the trend line. The
fundamental indicators might be some major news, i.e. Alan Greenspan! Fed reports about
interest rates, reports on employment, gross national product, and consumer price index reports,
just to name a few.
Understand why and how to use market commentary. Stay out of the market till the dust settles.
Use the calendar to find out when these reports are due out, unless you want to become a
gambler! Ask your broker about any market news, and what time they are going to be reported.
But be ready…if it’s good news it should trend up…if it’s bad news it probably will move
down.
Hey we're not building a house here ya know! Hypothesize!
Choose some indicators you think may be potentially indicative of the market. By the way, the
market may move very fast and then turn around and head back the other way. Look for an
opportunity to get in. If this news is at the end of regular trading hours you better watch out at
the open tomorrow, or the next trading day. Look for a gap move, or trade long on a day before
any major holiday! It works most of time! Some people say that if the public thinks it will go up,
it goes down and vice-a-versa…be a contrarian.
Choose a target price for an exit like 2 or 3 points, and a stop loss figure (I use 2 points for a stop
loss, or look at the trading range to make my decision.). Don’t try to get every penny out of the
market; it will just cost you money. You can’t pick tops and bottoms or we would all be rich.
FOLLOW YOUR PLAN!
"The wise trader never ceases to study general conditions, to keep track of developments
everywhere that are likely to affect or influence the course of the various markets."
“Reminiscences of a Stock Operator”
Edwin Lefevre

30
Hey … It’s all in a day’s work!
Let’s look at my typical trading day…
This is my checklist …First thing’s first
My wife brings me my coffee…I take a look at the news on CNBC and I also look at the news
column on quote.com just to see if there are any Fed or important reports out today. I read the
business section from the newspaper if I get up early enough…Not likely!
I leave my computer on twenty-four hours a day except on weekends (We have an energy crises
here in San Diego so I now turn it off.) I keep my live charts running the E-mini S&P, using all
sessions.
(See example of a live chart using all sessions.)
I get up around a half-hour before the opening bell. (9:00 o’clock Eastern time.) Which is early
enough to see what the night traders were up-to. I look to see if there might be a gap up or down
at the open and which way the trend is going. It could be up, down, or sideways. I am also
interested in the location of the position within the trend. Is it at resistance, support, or in the
middle somewhere from the day before?
Gaps? I only consider large gaps…4 to 6 points or better. If the market gaps lower on the
opening it soon rises to fill the gap. I have an opportunity to buy at the open.
Here is a simple rule, we need one of our indicators to be on our side of the trade, and both are
even better, and buy as the market rises to fill the gap, or sell the gap and wait for the downtrend
to end. Try to capture 1 or 2 points. Don’t get greedy. Look to see if you can keep the trade going
by keeping your eye on the Dow or Nasdaq. The minute you see a sign of weakness, get out of
the trade. I use Stochastics, and wait for it to form a hook…you look at it, and you will see it i’m
sure.
"The trend is your friend. It is - unless the trend is about to end."
So says Tom Demark President of Market Studies Inc.

31
Major holidays? The market usually is an up day before a major holiday. Follow the trend and sit
back and wait. This may be the time to trade during the last hour. It takes practice though!
Always have an exit planned.
Major news…that might affect the market? I take advantage of any big event. If it’s good news,
buy…bad news sell. Prepare to exit and take the trade the other way also. It always changes
direction after a few minutes…Usually!!!
CNBC…check my three indicators, the Dow, Nasdaq and S&P. Are they in sync? Any volatility;
or volume problems?
Opening bell: one decision every day-trader has to make is whether or not to trade on the
opening. The market seeks to establish a trend or stable price level during the first half hour or
so. I let the dust settle, then look for my first opportunity to make a trade. If any of the above
information is going to affect the market, I take it into consideration at the open, rather than wait
the first hour or two. Use the Time zones and look for reversals, after the first half hour or so.
So what do we do? Anything…Something.
So long as we just don’t sit there. If we screw up, start over. Try something else. If we wait until
we’ve satisfied all the uncertainties, it may be too late.
Lee Iacocca
Auto executive

32
Here are a few typical trades
12/17/99
Gap up at the open…Sold 2 contracts at 11:36 a.m. on a turn down at 1445.75 and had to wait
until 2:50 p.m. to fill the gap at 1439.25 for a profit of $650.00 less commission. This was a
tough trade and I had to go through a higher risk just to make the trade payoff. I let my emotions
get the best of me but I was lucky I did not lose any money.
12/30/99
Gap up at the open…I missed the ride down to fill the gap, but bought 2 contracts at 11:58 a.m.
at 1483.00 after it filled the gap. I took profits at 1488.75 as it looked like it was at resistance.
Later in the day…1:44 p.m. I bought 2 contracts at support 1481.00 and exited at 2:13 p.m. at
1483.50, which looked like an easy $200.00. It was just a simple trend move at support and
should move back up to resistance. Simple-as-123—Total profits for the day $825.00 less
commission.
You need to keep your eye on the Dow and watch for any fast reversals, as that tends to affect
the S&P. Do not, I repeat, do not trade gaps before any major holiday unless it is a gap down.
When it gaps down, you buy when the bar penetrates the gap. Remember! Look at the risk-to-
reward ratio. Plan your exit around those numbers. If the trade goes against you, get out as soon
as possible. Give the S&P lots of room, at least $150.00 or use the trading range of each bar.
Gaps, gaps, gaps…If you look at an Intra-day bar chart, you will notice that on gap openings the
market often trades away from the gap for the first few minutes, then quickly reverses and "fills"
the gap. For example, a market that gaps lower initially may trend downward, leading everyone
to believe that a downtrend is in effect. After ten minutes or so, however, the price shoots to the
upside, closes the gap and reverses again. Trading lower on the day. This scenario presents two
options. You could buy the opening and then sell when the market rises back to the gap, or sell
as the price fills the gap, expecting the downtrend to resume. If the opening gap is not filled
within five or ten minutes, there is a strong possibility the early trend may be the dominant trend
of the day. Remember, small gaps don’t work well. I only trade gaps when I have either the Dow
or the Nasdaq going my way.
My personal preferences for day trading…Reversals and
Buying dips and selling rallies. … But be careful of the time zones!
Trading the trend with momentum example: I see the Dow moving up fast (momentum) it’s over
25 points and the Nasdaq is up substantially over 15 points and moving also. The S&P is 3 points
higher than yesterday. Look at your chart and see where the trend is. I check my first time frame
and it’s over the first hour. 10:30...If it’s at or near support then wait, and when it makes the turn
up buy in at the market. Exit this trade when you reach your price point …I like to scalp 2 or 3
points. To make the decision to trade the dips or sell the rallies, we need to know which way the
market is trending. If the total market…all of our indicators is bullish we only trade to the up-
side, (long) and vice a versa.

33
Scalper – A trader who trades for small, short-term profits during the
course of the trading session, rarely carrying a position overnight.
If it starts to go the other way (I only risk 2 points) you would exit when you see your mental
stop loss. Don’t let little pullbacks scare you though. You’ll get the hang of it. Keep your eye on
the total market and check the TRIN, TICK, and make sure the NY Stock Exchange and the
Russell Index is on your side of the trade. Check the MACD or Stochastics. They are all right
there in front of you, and it only takes four seconds to check them out…remember your risk
point…and always remember at around the lunch hour time zone we get what I call the 12
o’clock hop or flop. If the market is up it will move down, and if it’s down it will move up. It can
last up to a few minutes or well over an hour and half. The commercials or brokers come back
from lunch and they move the market further up or down. Be alert from 11:15 till 2:15. One
other warning: try to get out of the market an hour before the close around 3:15 p.m. The
probabilities of a successful trade diminish in these time frames due to the impulsive and
reckless buying and selling by institutions just because they didn’t get their trading done earlier.
Nuance
We always trade with the trend of the total market, what I mean by that is … If the Dow,
Nasdaq, Russell, NY, TICK, TRIN and Emini S&P are bullish we only trade to the upside, and
vise-a-versa. Never trade against the total trend. There is no exception to this rule. Be patient and
use discipline. We never sell rallies at resistance (rallies are when the trend is at support and
starts to move up towards resistance) unless the total market is in a downtrend. And vice a versa!
Another safe practice is to avoid trading when the market is making the new high or low of the
day unless other indicators are in your favor.
Power trading…Being aggressive
You will learn what Power trading is all about, it’s when we are trading, and the indicators are
not in sync with one another. That is “Power trading.” It’s when we trade at the open, reversals,
or during the 12 o’clock hop, or during the close. That is Power trading…Just remember it’s very
risky! Probably the most risky trades you will ever make will be when you trade against the
trend.
If you see the Dow or the Nasdaq out of sync (Not going in the same direction at the same time.)
as an example using my shorthand:
Time:
10:15
• d+90
• n-30
• es +1
Well they are definitely out of sync…the Dow is up quite a bit, but we see it starting to drop four
and five points in just a few seconds, and then it drops even more. We can then assume it’s

34
getting into sync or at least it’s moving down, like the Nasdaq. If we keep seeing this movement
then we have an opportunity to make a trade. We could sell one or two contracts and look for 2
or 3 points. It’s a little risky and I would give the trade a small risk of only 2 points. If you see
any movement to the contrary then you would get out and hope for the best. It takes practice to
trade when they are out of sync or when you are trading the 12 o’clock hop.
Knowing that the market moves up if it’s down during that time frame, you could wait for the
market to make a double bottom or just make the turn. Take a high risk and trade the other way
even if they are in sync. Once again use a small risk of only 2 points. This trade is very
subjective. And takes lots of practice.
Only those who have to do simple things perfectly…
will acquire the skill to do difficult things easily.
Johann Schiller (1759—1805)
Poet and dramatist

35
Computer Requirements
#1 Computer:
System requirements:
Pentium II or faster, Windows 95/98/NT, or higher, or Apple Macintosh II CI (Power PC is
better). System 8.6 or greater. 64 megs of ram, (128 megs is better). Color/VGA Monitor with
minimum screen size 800x600 (1020x768 recommended), 56k Baud Modem, (Cable or DSL is
better). Netscape Navigator 4.7 or Microsoft Internet Explorer 5.0 or greater (as new technology
emerges, computer requirements are sure to change.). Check with your brokerage firm.
#2 ISP: (Internet service provider)
I don’t recommend AOL…any service provider will do as long as you are happy with their
service. I have had a lot of students recommend Earthlink.net (Cable or DSL is by far the best.).
#3 Broker:
Open an online trading account. I recommend a minimum $5000.00. You can trade two or more
contracts, (depending on your brokerage firm) of the E-Mini S&P
Most brokerage firms usually require at least this much, but you may find one that will let you
open an account with only $1000.00, such as www.proedgeonline.com (See the list of brokers I
recommend in the back of the manual.)
#4 Software:
Your brokerage firm will have the necessary software to place your orders, and for your live
charts I recommend quote.com…and it’s only $9.95 per month plus fees. They are a little un-
stable as of to-date…I love the look and feel of them though, and I’ve been using them through
thick and thin.
Patience is to keep trying…to keep trying till you get it. Discipline is knowing you get it…and the
patience to make it happen.
Marshall J. Jones
Day-trader

36
Don’t Blame Me…
I just got here………………!

37
Putting Time on Your side
By Barry and Ryan Watkins
Trading is not just a question of what the indicators are telling you, it also depends on timing.
Here’s a breakdown of the most opportune trading periods throughout the day.
Trading isn’t just a matter of what; it’s a matter of when. Your analysis can lead you to what may
turn out to be a correct assumption of the market’s direction But if you enter your trade too early
or too late, your research won’t do much good.
The stock market makes several pauses or reversals every day. Identifying likely market reversal
time zones is critical to maximizing profits for short-term traders. The ebb and flow of trading
throughout the day is influenced by a number of factors, including the supply and demand
situation before the open, when traders typically take lunch and the need for many traders to
square away positions by the end of the day.
Because no two trading day are ever exactly the same, trading time zones are general guidelines
… not rigid rules. When combined with other analysis tools, they can give you a better idea of
when a trade may or may not be a good idea.
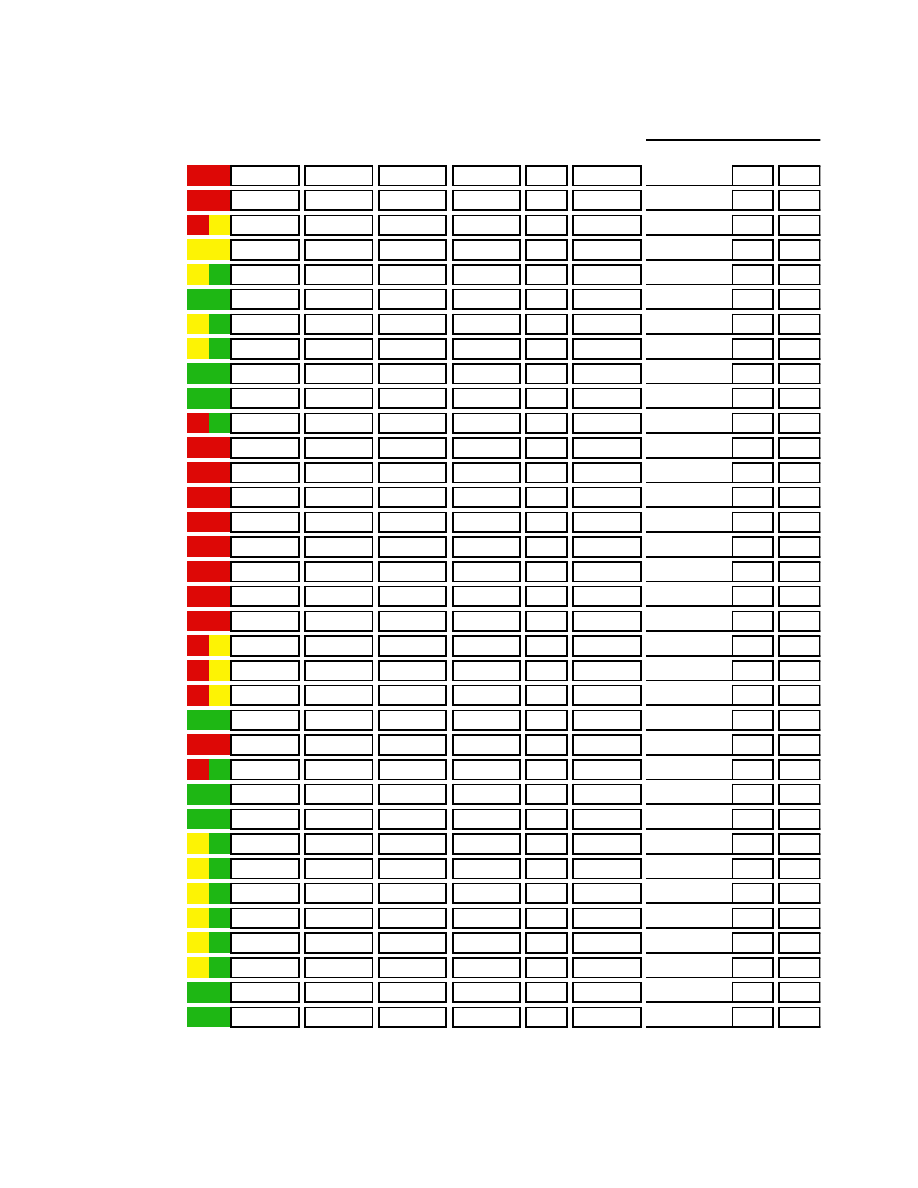
In the zone
On a normal trading day, the stock market is open 6.5 hours, or 390 minutes. The trading session
can be divided into approximately 14 time periods, or zones. Each of these zones can be
classified according to the colors of a traffic signal.
The red zones: These are the most dangerous times of the day to trade. There are two red-zone
trading periods, which comprise a total of 200 minutes, or 51 percent, of the typical trading day.
For experienced traders, the first 20 to 30 minutes of the trading session can be a very
profitable time, but for less experienced traders, it probably is the most dangerous period of
the day.
The yellow zones: These six time zones represent typical (and approximate) times when the
market pauses or reverses. These periods account for about 14 percent of the trading day.
The green zones: While not necessarily safe, the six green time zones represent those periods
when market activity follows more consistent patterns. The market will spend approximately 35
percent of each day in green territory.
38
Watching the clock
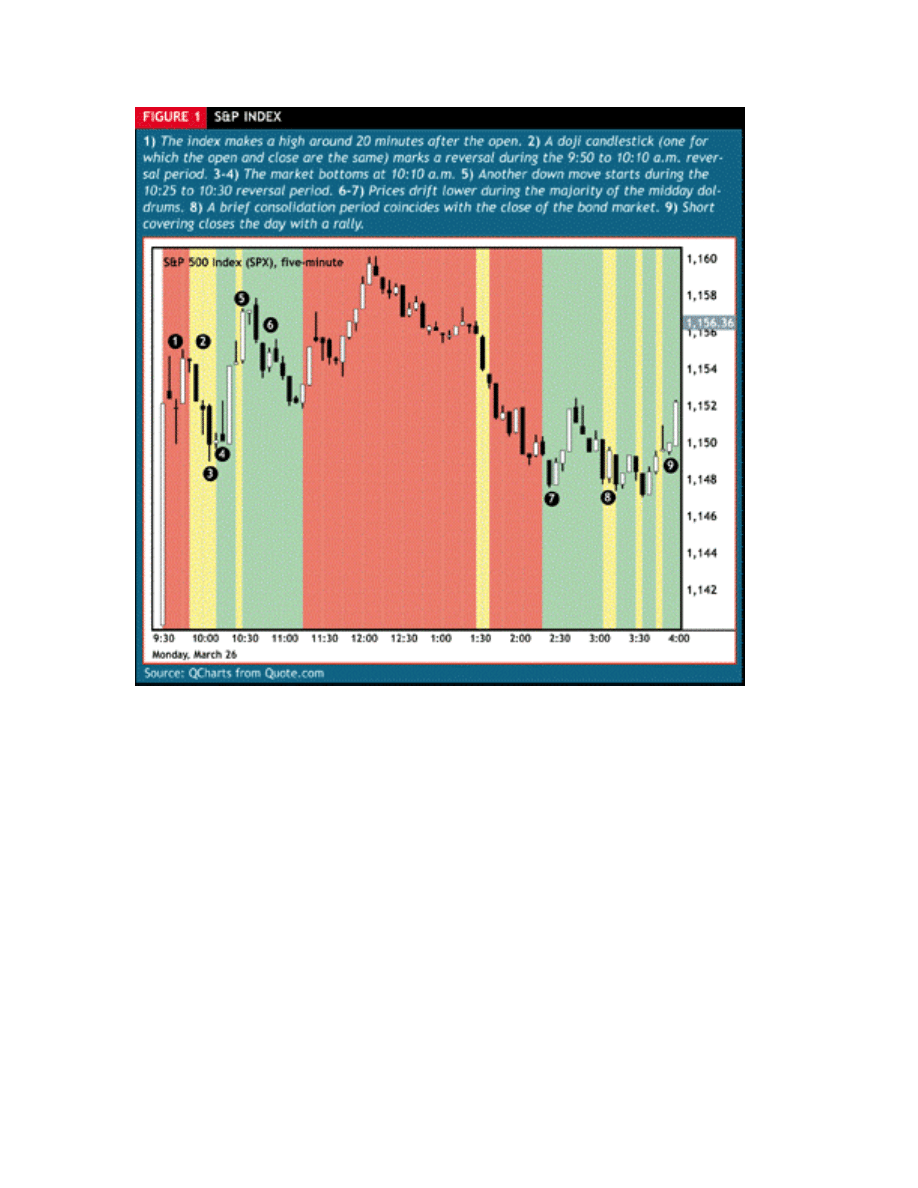
To illustrate the 14 time zones, we’ll walk through a typical trading day. But first, it’s important
to remember there is no such thing as a risk-free trade. To generate a profit, the market must be
moving, which also increases the risk. The largest profits usually occur during the most
dangerous (volatile) times. Therefore, a market environment that is marked as red and dangerous
for might be another trader’s dream market. It depends on your level of expertise and trading
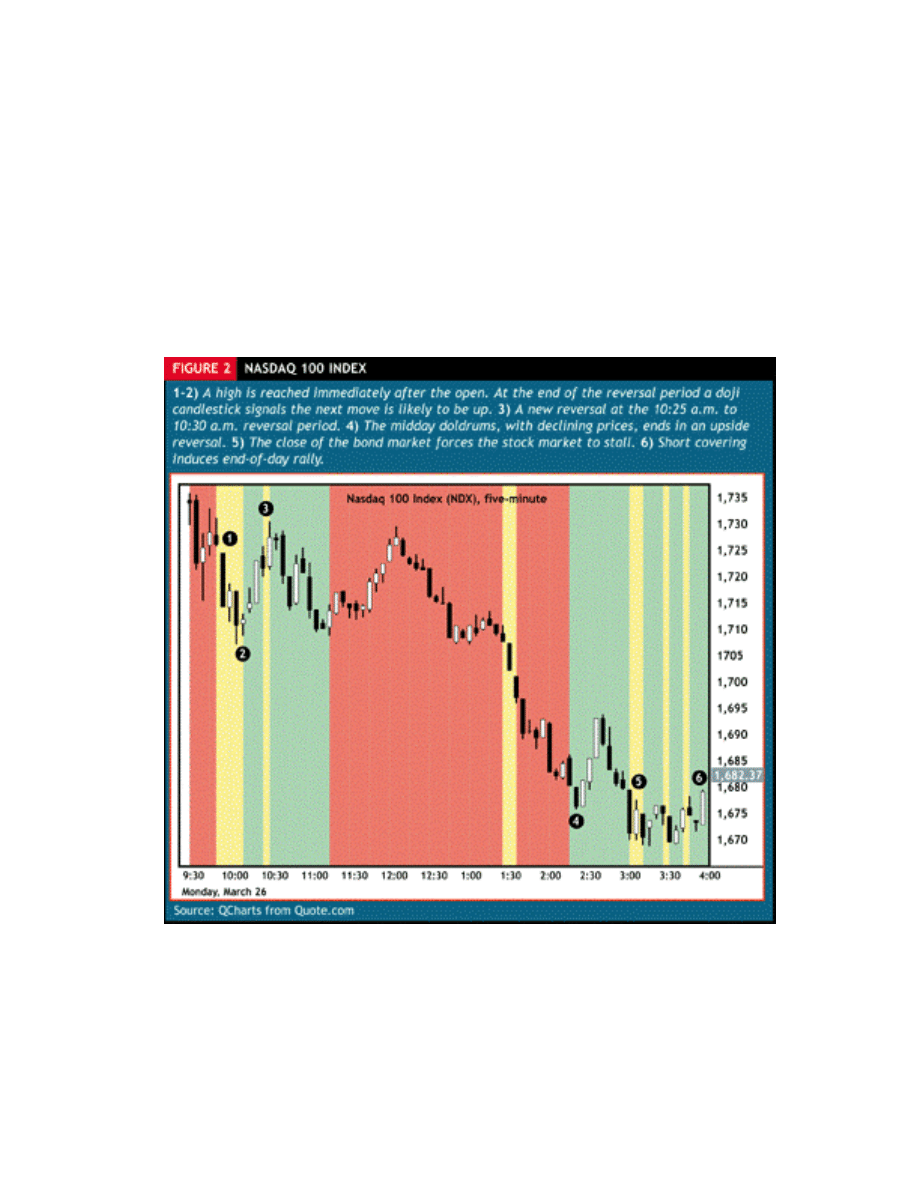
style. Figures 1 through 3 provide chart illustrations of the various zones.
Period 1: 9:30 to 9:50 a.m. EST (red zone)
The market opening at 9:30 a.m. is the first red time zone, which lasts for approximately 20
minutes, until 9:50 a.m. EST. For experienced traders this can be a very profitable time, but for
less-experienced traders it probably is the most dangerous period of the day.
39
The abundance of pre-market orders essentially gives the market makers and specialists “inside
information” about the expected supply and demand in stock…and extreme advantage. To make
the most of supply and demand imbalances, the market makers and specialists often open the
stock much lower or higher, creating extremely large price gaps.
This might entice less-experienced traders to chase the stock. However, they often put on a trade
only to watch the stock move against them shortly thereafter when the forces behind the early
imbalance have disappeared. Depending on the volume it usually takes about 20 minutes for the
market makers and specialists to fill the pre-market orders and make the most of those traders
who were lured into the trap. After this period, more realistic prices should emerge.
The professionals essentially get themselves a good price on the open and profit when the market
snaps back the other way. For example, when a market maker or specialist gaps a stock higher,
it’s because there are more buyers than sellers (perhaps some bullish news came out before the
open). When this happens, the market maker will exploit the greed and open the stock at an
unrealistically high price. Once the buying frenzy has died down, the stock will typically pull

40
back and the market maker or specialist (who shorted the stock at the inflated high price} will
buy the shares back at a profit.
Period 2 9:50 to 10:10 a.m. (yellow zone)
Many of the bigger stocks (as well as the S&P 500 futures contract) often reverse around this
time. Because all the opening orders have now been filled, more realistic prices based on
immediate supply and demand are likely to emerge. If the stock isn’t extraordinarily strong, this
can be a very profitable time of the day because the initial rally sets up the possibility of a short
trade.
Usually, the longer it takes for the first reversal to occur, the more pre-market orders there were.
The market remains stable throughout this period it usually also remains stable until the next
yellow period (period 4).
Period 3: 10:10 to 10:25 a.m. (green zone)
The first green trading zone can start during the first yellow zone as prices have reversed and can
stretch into the second yellow zone, which is the next likely reversal zone.
This zone is usually one of the safest periods to trade and will generally go in the opposite
direction of period 1. For example, if a stock trades higher in period 1 it often reverses during
period 2 and continues down during period 3, if prices move lower in period 3 the end of this
period presents and opportunity to enter a low-risk long trade.
Period 4: 10:25 to 10:30 a.m. (yellow zone)
This zone often marks a pause in a strong market, but a full reversal can sometimes occur, going
against what initially seemed to be a good long position. Reverse the reasoning if the market
reaches this zone on lower prices. If you’re trading short-term, you should consider closing your
position before the market enters this zone (but be ready to re-enter once it is over). If you’re
trading longer-term, use stop-loss orders to protect your positions.
Period 5: 10:30 to 11:15 a.m. (green zone)
After the market has taken a breather, it usually continues in the same direction if established
during the third period.
41
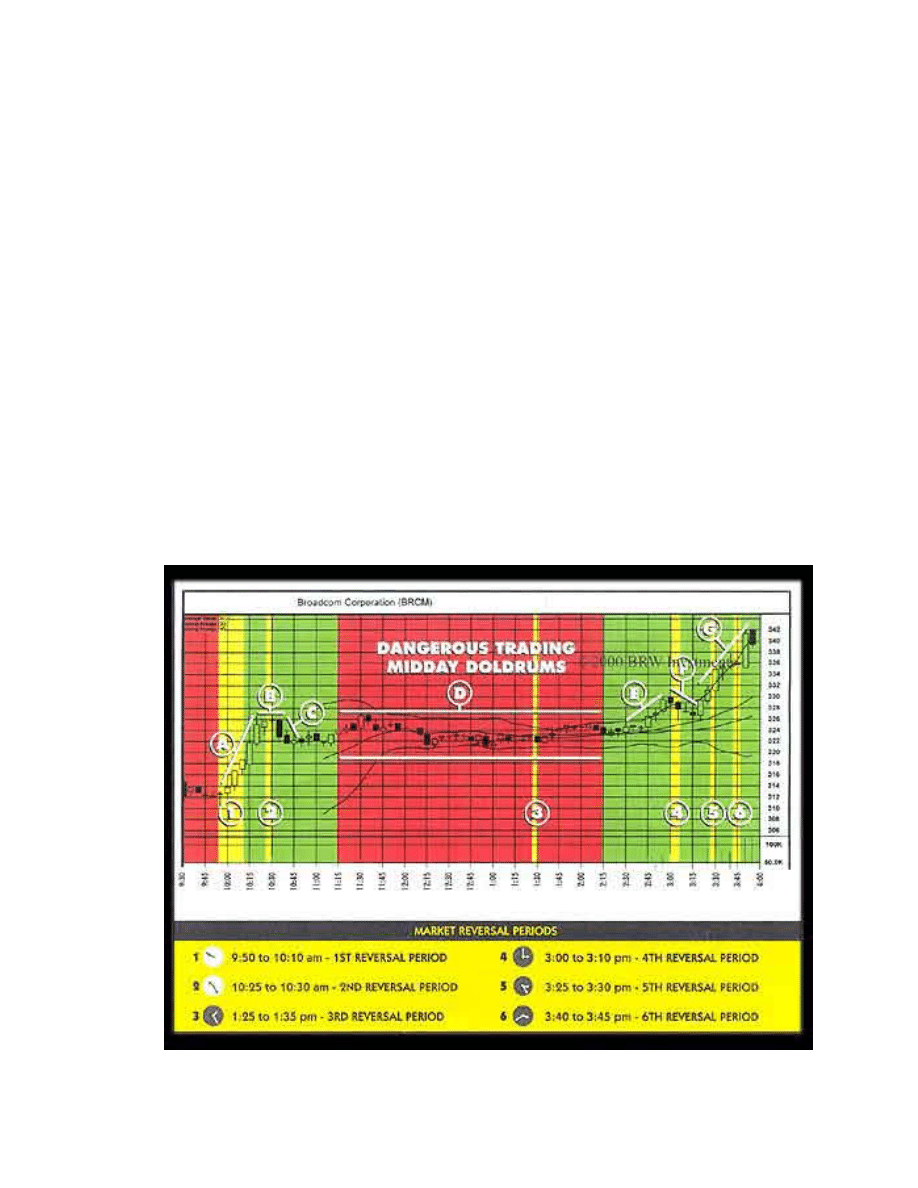
The Red Zone
Period 6: 11:15 to 2:15 p.m. (red zone)
Most traders likely would eliminate 50 percent of their bad trades if they refrained from
trading during the midday doldrums.
This time zone is often referred to as the “midday doldrums” because activity dips when traders
take their lunch breaks. On an up-trending day, you will often notice that prices start to sag, like
air slowly leaking out of a tire. During this period prices show the least amount of follow-
through because of the lack of volume.
Most traders likely would eliminate 50 percent of their bad trades if they refrained from trading
midday. Instead they should monitor this period for price patterns that can act as setups for trades
later in the day. For example, the lowest price before an afternoon breakdown often occurs
between 1:30 and 2 p.m. EST. While this may or may not have any consequences for your
trading later in the day, it still could be a good idea to mark it off, as an indication the market is
behaving as it “should” Note that this time period is counted as one zone, although technically it
is divided into two parts by a short yellow period (see below).

42
Period 7: 1:25 to 1:35 p.m. (yellow zone)
This is the weakest and least significant of the six reversal periods because it typically occurs in
the middle of the midday doldrums. Volume can drop dramatically during this period;
professional traders normally avoid it.
Period 8: 2:15 to 3:00 p.m. (green zone)
After the midday doldrums, this green time zone commences and continues until 3 p.m. EST
when the Chicago bond market closes, This period can be very exciting to trade because it is
often like a new trading day. Patterns that started to form during the lunch hours now find
support from broader volume, resulting in frequent breakouts in both directions.
Period 9: 3 to 3:10 p.m. (yellow zone)
This reversal period coincides with the close of the Chicago bond market. Pay close attention
during this time period reversals are common and often significant.
Reversals are often significant in the period after the close of the Chicago bond market.
Period 10: 3:10 to 3:25 p.m. (green zone)
A short period of relative calm between two significant reversal periods.
Period 11: 3:25 to 3:30 p.m. (yellow zone)
Like period 9, this reversal period is another high-probability reversal zone.
Period 12: 3:30 to 3:40 p.m. (green zone)
Another period of relative calm before the last reversal period of the day.
Period 13: 3:40 to 3:45 p.m. (yellow zone)
A major reason for this final reversal period of the day is many market makers and specialists
settle their accounts for the day. Many day traders also exit their trades.
Period 14: 3:45 to 4 p.m. (green zone)
Quite often, the last 15 minutes of the day resemble period 10 (3:10 to 3:25 p.m.). Also, if the
day was characterized by selling pressure, an upward hook in prices sometimes occurs right
before the close {caused by increased buy-in to cover short positions).
Maintain perspective
These time zones were originally designed to indicate a high-probability reversal periods for the
S&P 500 futures market, but they can be applied to individual stocks as well.
Remember, however, the time zones only are approximate indications
meant to give you a “heads up” of what might happen next. Time zone
analysis should be combined with other analysis to confirm price
movement.

43
Snake-Eye Trading Method
This method applies the same techniques used by the professional Floor Traders and is based
around what a 5 minute bar is indicating at any given time. It is a simple, yet very effective
method of trading that does not rely on complicated, technical methodology or indicators.
Neither does it rely on or care what happened last month, last week, yesterday, or earlier today,
but rather what is happening at this very moment with the current 5 min bar.
Determine this and trade accordingly
What are the professional Floor Traders doing right now?
What direction are they steering the market?
Where does the market want to go?
This trading method applies equally as well to both the S&P 500 and
the E-Mini S&P 500.
Chart Set Up
Set up and refer to these three charts only, no others:
Emini S&P…5 minute bar chart:
Set with a 8 period simple moving average set at “low” and 10 period simple moving average set
“high” – configured with bars. This is the main chart used to look for trade set-ups.
Nasdaq (Compx) 5-minute candle chart:
Set with a 5 period simple moving average configured with candles. This chart is used to confirm
a trade set-up only, and is not to trade from.
Emini S&P 15 minute bar chart
Configured the same as 5 minute. This chart is mainly used to determine trend direction and is
not to trade from.

44
Dow
Refer to this index to observe changes in market direction.
(If you are using quote.com’s live charts, this index is in the Hotlists window in the upper left
hand side ($INDU)).
For example, if the Dow is up 100 points, indicating the market is very strong to the upside, you
should only be trading long positions (only trade in the direction of the trend). However, take
care to regularly observe for reverse movement in the Dow index, in case it suddenly loses 30-40
points, indicating a weakening Dow and possible reversal in trend. This could now be signaling
it would be safer to trade short than long (refer to the Time Zones for possible reversals periods).
Moving Averages
These are used to assist with determining the strength, weakness or neutrality of the market and
which direction to play it.
When the price is trading above the 10 moving average line on the 5- minute chart, with at least
one full price bar having closed above and sitting on top of the line, this indicates strength,
signaling potential upside and possibly a long trade forming.
When the price is trading below the 8 moving average line on the 5- minute chart, with at least
one full price bar having closed below and fully formed below the line, this indicates weakness,
signaling potential downside and possibly a short trade forming.
Whenever the price bars trade above the 10 moving average line or below the 8 moving average
line on the 15-minute chart, this is a stronger confirmation of direction than when on the 5-
minute chart.
Similarly, a complete green candle (white on quote.com’s charts) having fully closed above and
sitting on top of the 5 moving average line on the Nasdaq ($COMPX) index, indicates strength,
signaling potential upside. Conversely a red candle having closed below and fully formed below
the 5 moving average line indicates weakness and potential downside. A closed green candle
(white on quote.com’s charts) split half above and half below the 5 moving average indicates a
strengthening bias to the upside and a similar red candle indicates a weakening to the downside.
Trend Direction
It is important to know this at all times, as you must always trade in the direction of the trend,
never against it. Trend direction is mainly determined by reference to the 15-minute bar chart
and where the price bars are trading in reference to the 8 and 10 moving averages, as previously
explained.
The direction in which the moving average lines are pointing on both the 5-minute and15-minute
charts is a good visual reference for determining trend direction. There may be an obvious trend
direction established for the day, but short-term trend changes will inevitably occur and will

45
be indicated by changes in the direction the moving average lines form, either pointing up, down
or sideways.
The Nasdaq and Dow index numbers also provide a guide to the trend direction and it’s
fluctuations.
Another indicator is that whenever the moving average lines on the 5- minute and 15-minute
charts start to narrow, coming closer together; this often signals a change in direction is about to
occur. This is generally followed by them widening again to form what looks like the shape of a
mouth, prior to the change.
The Set - Up
To recognize a good set-up, you must first develop a “feel” for the market and the market flow.
Go back to basics and literally forget all you have learned. Switch off your 1 – 3 minute charts,
cast aside all of your indicators and simply watch the 5-minute bars, their behavior, formations
and patterns.
Further training is required to accurately and consistently recognize the correct set-ups.
However, the principal of the method relies on the current 5-minute bar’s inability to take out the
previous bar (or bars) high for a “short” set-up and inability to take out a low in the case of a
“long” set–up.
With experience and a high degree of concentration in watching the price activity during the
formation of the current 5-minute bar, the immediate, short-term direction of the market can
be determined with an uncanny accuracy.
By observing and counting the number of times the current price bar pushes in it’s attempt to
take out the high or low of the previous bar (or bars), can provide a clue as to who is in control-
the buyers or the sellers.
For example, if the price bar ticker pushes and pushes upwards at the top of the bar, failing to get
any higher and is unable to take out the immediate, previous highs and then closes, it signals that
it has hit resistance at this level and that the buyers are drying up and losing control. If the
buyers have dried up, then the path of least resistance is down, as the sellers have now taken over
control. This is a time to sell, as prices and the market are going down.
The same holds true when the price bar ticker pushes and pushes downwards at the bottom of the
bar, failing to break through and getting support, indicating no more sellers, so the price is likely
to reverse and go up. This is a time to buy as the market reverses; gains strength and prices start
to immediately increase
.
Education is hanging around until you’ve caught on
Robert Frost (1874 – 1963
Poet

46
The ratio of buyers to sellers is what determines the market direction at any given time.
If you see a possible set-up forming, never take your eyes off the bar, or you will miss the
message it is giving you…you must watch it very closely. As soon as you have made the
decision that it is a set-up, don’t hesitate, don’t wait, get in and take the trade.
Long Set–Up
To take a long trade (buy), the price bars must be trading above the 10 moving average line on
the 5-minute Emini S&P bar chart, which indicates strength. At least one price bar must be fully
formed, closed and sitting above on top of the line to allow a conservative trade – 2 bars for a
more conservative trade.
The Nasdaq ($COMPX) must confirm the trade by displaying a green candle (white on
quote.com’s chart) that is fully formed, closed and sitting above on top of the 5 moving average
line. If it does not confirm, do not enter the trade.
The Dow index should be holding steady, or increasing.
The Nasdaq ($ COMPX) is used for confirmation only … do not trade from it.
Short Set-Up
To take a short trade (sell), the price bars must be trading below the 8 moving average line on the
Emini S&P 500 5-minute bar chart, which indicates weakness. At least one price bar must be
fully formed, closed and sitting below the line to allow a conservative trade – 2 bars for a more
conservative trade.
The Nasdaq ($COMPX) must confirm the trade by displaying a red candle that is fully formed,
closed and sitting below the 5 moving average line. If the Compx does not confirm, do not enter
the trade.
The Dow index should be holding steady, or decreasing.
The Nasdaq ($ COMPX) is used for confirmation only … do not trade from it.
Stop Loss
As soon as a trade is entered into, immediately place a stop loss order for whatever amount suits
your personal risk tolerance. The method allows at least 2 points. This is very important for
peace of mind and to limit your downside risk.
Once your trade is a few points profitable, it may be possible to move your stop to breakeven,
but care should be taken to avoid being stopped out too soon and possibly causing you to miss a
good run.

47
Exiting the Trade
This can vary and is often determined by each individual’s personal experience, financial
circumstances and risk tolerance. As a relatively inexperienced, student trader a conservative
approach is to take 2, 3 or 4 points and button down a profit when it is there, even though the
trade may go on to produce more points. You can never lose by taking a profit and in the early
stages of trading; taking regular, small profits will build confidence. Experience and improved
confidence will then allow you to stay in for the longer term and greater rewards.
However, the method strategy recommends that once in a profitable trade, you stay in the trade
until the Nasdaq ($COMPX) signals you to come out. When in a long trade stay in as long as
there are green candles (white on quote.com’s charts) showing above the 5 moving average line
on the $COMPX chart and as soon as a red candle forms, exit the trade.
Similarly when in a short trade, stay in as long as there are red candles showing below the 5
moving average line on the $COMPX chart and exit as soon as a green candle (white on
quote.com’s charts) forms.
Congestion (choppy, chop)
Chop is a very difficult market to trade and should be avoided as soon as you realize it is in this
phase. Never trade a choppy market.
You can easily recognize a choppy market, as this is indicated on the 5- minute Emini S&P 500
bar chart. Whenever the price bars trade in a channel between the 8 and 10 moving averages,
without seriously penetrating or staying above or below them, then the market is choppy. The
price bars traverse up and down between or a little beyond the two moving averages.
Also, the $COMPX is another good indicator of congestion. The candles alternate in color,
red/green, red/green and traverse from below the 5- minute moving average line to above, or to
below etc.
Inevitably congestion follows trend and trend follows congestion, so whenever the market has
gone into congestion, just be patient, sit it out and wait for the next trend breakout, it often
provides a good move.
If you don’t change today – your tomorrows will be like your yesterdays.

48
His Golden Rules
• Never trade before 10am EST (see yellow Time Zone)
• Never trade at lunchtime between 11.45am – 1.00pm EST
• Never trade after 3.30pm EST
• Never trade on a day when Greenspan is talking, or any major news, without lots of
practice…till you learn how to trade that volatility.
• Forget all that you have learned from seminars and books – scrap all of your indicators
and do not look at 1 or 3 min charts.
• Never trade against the trend. ”The trend’s your friend”, so only trade with it.
• Never trade in a choppy market - congestion.
• Never take a trade without confirming it with the $COMPX.
• Always place a stop loss order (Use a trailing stop loss).
• Never try to pick tops and bottoms – let the market tell you where it wants to go.
• Don’t overtrade, 1–3 good trades per day is enough.
• Don’t be greedy.
• Don’t have any distractions, TV, telephone, people etc. while you are trading.
• Manage your money – take all profits out of your trading account at the end of each
month. This way your trading account does not grow too large and may just prevent you
from taking impulsive, foolish trades due to over- confidence.
Don’t trade on half days, or when options expire…the locals will eat you up
Don’t be long after 2 o’clock
Snake-Eye

49
General Information
The mind- set to adopt with this method is to have patience and let the market tell you and show
you what it wants to do, rather than you trying to get the market to do what you want it to do.
You as an individual can never influence the direction the market will take.
”Wait for the train to pass and jump on for the ride.”
This is far safer, because once the train is rolling; at least you know which direction it’s going in.
As with any method or system, it’s advisable to paper-trade the method or system first.
Remember when you paper-trade; you should trade as if you were trading live, with your money
at stake. Never take a paper trade that you would not take live, just for the sake of it, as you will
make the same errors when you go live. Never paper-trade for too long.
***
This set-up was used with Trade Station Pro. I feel it’s best if you can use two monitors and put
your charts on one and order form and any other window you may use, like calculator, calendar,
paltalk etc.
Snake-Eye
A floor trader who worked in the S&P 500 pit … selling options for
over 10 years developed this method. A lifetime of experience…he is
now retired and has been day trading the S&P 500 for over ten years.
He is very generous and has never charged anyone for this method.
He prefers to remain anonymous.

50
My observations on this method for what it’s worth
It’s very similar to my method …Simple as 123.
I like the 4 chart set up just a little better, and I like to use candles on all of the charts. My
suggestion is to try both for a month or two and see which one gives you the best trades. Pay
close attention to the Time Zones and wait for the turn.
The best trade of the day
First reversal between 9:50 – 10:10 plus or minus a few minutes.
Warning for inexperienced traders … the first half hour, lunchtime,
and the last 30 to 45 minutes of the trading day should be avoided.
Never trade when there is major news broadcast or Fed. Report. Never
trust your charts, constantly check to make sure you have current
data. It’s best to be in a chat room with traders who are watching the
same thing you are. If you are going to make a trade check and ask
someone where the ES is trading.
Like any method or system it takes practice, confidence, discipline, and patience.

51
More charts

52
"Develop a healthy mindset"
The following statements show a healthy mindset that will support success:
1. The market gave me the opportunity.
2. I accept full responsibility for my winners and losers.
3. A good trade is one that follows my rules, regardless of whether it is profitable.
4. Some of my trades lose money and that's a normal part of any approach.
5. I realize that taking losses is normal and thus I must be financially and emotionally prepared
for them.
6. Changing my method during drawdown phases is dangerous and I must avoid the urge.
7. The market does not know me personally and therefore I do not take winners or losers
personally.
8. I do not get overly excited about winners or down over losses. Balance and perspective is key.
Nick Van Nice
President, ctsTrader.com
Something to ponder ….
Author Un-known
At the beginning of a trader's career, he has many handicaps working against him.
• The first is simply not having enough knowledge.
• The second is lack of experience in the application of the knowledge that he
should have.
• The third is the lack of experience in managing one's own emotions.
• The fourth is the lack of risk and money management techniques.
Several of these handicaps can be improved by paper trading and/or using back-testing
methods. Managing one's emotions when cash is on the line must be learned on the job. It
is easier if the trader has made adequate preparation and has confidence gained from
successful testing of his trading method. However, in reality, most people never test their
methods and simply plunge into the market unprepared. If a trader takes this route at the
beginning of his career, only one thing can help him survive until he proves out his
method - Risk and Money Management. Before superior performance can be obtained, a
trader needs to learn how to stay in the game.
"Most traders fail because they allow themselves to take big hits. You need to take small
losses to protect your account. You need to stop losing money before you can make
money."

53
Trivia…The Emini S&P 500 futures contract
Ticker symbol: ES
Contract size: $50 X index
Tick size: .25 index points ($12.50 per contract)
Contract Months: March, June, September, and December.
The Emini S&P 500 futures contract was spawned to allow investors to participate in trade of the
benchmark S&P 500 futures at a lower margin required. The S&P 500,long the benchmark for
stock market indication with its representation of many sectors of the market, has been a popular
contract among speculators of stock trade by index.
With its point value at a high X`s price of the index, it has been out of the reach for smaller
speculators with its considerable high margin requirement. Hence the introduction of the Emini
S&P 500. Electronically traded, It has a point value X`s index of $50 as opposed to the S&P
500`s $250 X`s index value.
This means a lower margin is required to participate in trade with the Emini S&P 500 than with
the S&P 500 and here is an example. If the S&P trades at a 1300 index level, then its point value
is X`s the index, putting a holding of the contract at $325,000 of leveraged futures. At $325,000,
the performance bond, or margin as more commonly known will be greater and this is out of the
reach of many speculators or investors.
The Emini with a $50 X`s index at the same index level trade of 1300 would leverage $65,500 of
holdings, requiring a much lower margin required with a broker since the Mini is 1/5 the size of
the S&P 500.
For more complete information on the Emini S&P 500 contract visit the Chicago Mercantile
Exchange’s website by clicking the link below. There is a complete Emini S&P 500 resource
center.
www.cme.com
The S & P 500, or Standard and Poor's 500, is an index used to gauge the overall health of the
market, similar to the Dow in some ways. The S & P 500 consists of 500 companies selected
because they are judged to be leaders in their respective businesses. The S & P has become so
well respected in the market, a company's stock value may increase simply because it was added
to the S & P 500. Small wonder, considering the S&P 500 returned 181.30% over a five-year
period, including reinvested dividends.
The way stocks are chosen for the S & P 500 is a bit mysterious, and not a lot is widely
understood about the selection process, but the companies are predominantly United States
companies operating in a wide range of businesses. Fundamental analysis plays a role in
selection, as does availability of stock on the open market.
For information on the S & P 500 as well as all the other S & P indexes, take a look at The S & P
web site.

54
Pivot Points
The calculation for the new day are calculated from the High (H), low (L) and close (C) of the
previous day.
Pivot point = P = (H + L + C)/3
First area of resistance = R1 = 2P - L
First area of support = S1 = 2P - H
Second area of resistance = R2 = (P -S1) + R1
Second area of support = S2 = P - (R2 - S1)
Basically, at the end of any trading day, the trading floor is a wash in the blue sheets of paper
that a popular service uses to print pivot points. They are very widely used by floor traders and
short-term traders.
The simplest application of it is that the pivot is the trend point! Above the pivot, the daily trend
is up. Below the pivot, the daily trend is down.
Many floor traders believe that markets will trade between levels. For example, if the pivot is
crossed to the upside, they feel the market should go test R1. If R1 holds, the market should go
back down to the pivot. If R1 is violated to the upside, then the market should go to R2. ... you
get the idea?
Pivot points can also be used on weekly and monthly data as well. Many traders will use R1 and
S1 as breakout points. Buying trend continuation above and below R1 and S1 respectively.
Both Futures Magazine and Technical Analysis of Stocks and Commodities have run articles on
the application of these points.
For shorter-term traders these points may be very valid, simply because they are so widely
followed... sort of self-fulfilling, kind of like Fib numbers.
************
For day-trading:
H is yesterday's high
L is yesterday's low
C is yesterday's Close
P (Pivot line) is calculated (H+L+C)/3
This is considered the dividing line. Cross it from below and R1 is your first ceiling.
S1 is first level of Support (S)
S2 is the second level of support
R1 is first level of Resistance (R)
R2 is the second level of resistance.

55
IMPORTANT: This must be used in conjunction with historical support and resistance.
NOTE: It is sometimes recommended to add Yesterdays Mid point and an additional factor in Pit
Pivot work. i.e., The Mid point, or the Pivot Point are the "pivotal areas".
--
P.S. In the pit they are said to recalculate this mess again at about 11:00, using the mornings
High, Low, and Close. Then, while the big boys eat their lunches the guys who got in wrong
drive the market all over the place trying to hit stops! It's pretty amazing to watch the price go
right back under/over the Pivot Point (wherever it was after the 11:00 recalculation) once the
BB's come back and put things "aright".
BB’s = Big Boys
At 3 o’clock the BB’s are the Bond Boys

56
Rightbraintrading…the OBV Trade
On Balance Volume…what does it mean?
This tool represents a running sum of volume in each interval. If an interval closes up from the
previous interval, the volume during that interval is added to the running sum. If the close of an
interval is down from the previous interval, the volume is subtracted from the running sum.
Here is what I know about the obv divergence trade on the E-mini S&P 500
1. Use a 3 min chart
2. Have obv as an indicator
3. Draw a trend line across the first 3 peaks or bottom 3 valleys of the day on the obv indicator,
do not use peaks or valleys from the previous day and if opening bar creates a peak/valley you
can use that one.
4. When the trend line is broken on a closed bar situation, you would buy/sell at market with a 2
pt target/3 pt loss. The targets will be measured from the open of the entry bar.
This trade had 27 in a row, 1 loss then another 18 in a row according to John and Steve at:
www.rightbraintrading.com or on paltalk chat room on Business and Finance
@Rightbraintrading.
This trade should capture the initial counter trend move of the morning, only take the 1'st trade
of the day then close down chart and wait till next day.
Try it just for fun … on paper only please!
I was seldom able to see an opportunity until it ceased to be one.
Mark Twain (1835 – 1910)
Writer and humorist

57
OH! …But first you need to know the basics:
Basic Training:
If you are not familiar with trading futures, I have written the basics on trading information here.
Read it if you are not knowledgeable. Most of this information can be found at the different
commodity exchange sites for free. Or you may write to them, and have them send the
information to you. It’s all free so what do you have to lose! See the list of exchanges noted in
the manual.
History and Origin:
When civilization began, trading started. Bartering for different commodities has probably taken
place since the beginning of time. Coined money appeared sometime between 800 B.C. and 700
B.C. Soon after that, instead of bartering as a means of business, coined money was used.
Eventually trading had to be done on the basis of future delivery, as a merchant would sell out
his complete stock, but still had customers waiting to buy. The merchant would then take a
partial payment and guarantee delivery at a future date. This type of transaction probably was the
beginning of the present day futures contract.
For nearly three hundred years, commodity futures contracts were used. Merchants and
processors of food would bid for a farmer’s crop before or after planting. Both parties involved
were protected and would not have to fear drastic price changes during harvest or delivery that
would alter the normal course of their business. Modern day commodity futures markets still
offer this protection plus other important uses to be discussed in this manual.
Commodity Exchanges:
What is a Commodity Exchange? A Commodity Exchange is an organized market of buyers and
sellers of various types of commodities. It is public to the extent that anyone can trade through
member firms. It provides a trading place for commodities, regulates the trading practices of the
members, gathers and transmits price information, inspects and governs commodities traded on
the Exchange, supervises warehouses that store the commodity, and provides means for settling
disputes between members. All transactions must be conducted in a pit on the Exchange floor
within certain hours.
Futures Contract:
What is a futures contract? A futures contract is a contract between two parties where the buyer
agrees to accept delivery at a specified price from the seller of a particular commodity, in a
designated month in the future, if it is not liquidated before the contract reaches maturity. A
futures contract is not an option; nothing in it is conditional. Each contract calls for a specified
amount and grade of product.
The average trader does not take delivery of a futures contract, since he normally will close out
his position before the futures contract expires. As a matter of fact, a survey conducted by a
leading exchange has estimated that less than 3% of the contracts traded are settled by actual

58
delivery. (Usually those contracts are in the metal futures.) Futures contracts are traded on
different exchanges. We are only interested in the Chicago Mercantile Exchange, which handles:
Live Cattle, Fresh Eggs, Live Hogs, Lumber, Russet Potatoes, Pork Bellies, Plywood, Stud
Lumber, Feeder Cattle, Fresh Broiler Chickens, S&P 500 Stock Index, S&P 100 Stock Index,
and the E-mini contracts. Take a look at www.cme.com lot’s of good information at their site
on the web.
The Hedger and Speculator:
A hedger buys or sells a futures contract in order to reduce the risk of loss through price
variation. A short hedger sells (And I don’t mean how tall he is!) a futures contract to protect the
possible decline in the actual commodity owned by him. A long hedger (And I don’t mean his
length!) purchases a futures contract to protect the possible advance in the value of an actual
commodity needed to be purchased in the future. (Hint: Futures.)
As a speculator we don’t need to be concerned with what a hedger does.
A futures speculator is like a speculator in any other asset. He seeks to profit from price changes.
The speculator is an important factor in the volume of future trading today. He, in effect,
voluntarily assumes the risk, which the hedger tries to avoid, with the expectations of making a
profit. He is somewhat of an insurance underwriter. The largest number of traders on any
commodity exchange is the speculator. In order for the hedger to participate, he must have
continuous trading interests and activity in the market. This trading activity stems from the role
of the speculator, because he involves himself in the buying or selling of futures contracts with
the idea of making a profit on the advance or decline of prices. The speculator tries to forecast
prices in advance of delivery and is willing to buy or sell on this basis. A speculator involves
himself in an inescapable risk. Speculators, or traders, assume the price risk that hedgers attempt
to lay off in the markets. In other words, hedgers often depend on speculators to take the other
side of their trades adding depth and liquidity to the markets.
Many people are attracted to futures market speculation after hearing stories about the amount of
wealth that can be made trading futures. While there are success stories, the number of big-time
traders is not unlike the number of superstars in professional sports. Many people strive for the
top, but few ever reach it. At the same time, many people have achieved a more modest level of
success in futures trading. The keys to their success are often hard work, a disciplined approach,
and a dedication to master their trade. If you intend to follow this path, this method can help you
get started.
Now, can you be a speculator? Before considering entering into the futures market as a
speculator, there are several facts that you should understand about the market, and also about
yourself. In order to enter into the futures market, you must understand that you are dealing with
a margin account. Margins are as low as 5 to 10% of the total value of the futures contract, so
you are obtaining a greater leverage on your capital.
Fluctuations in prices are rapid, volatile, and wide. It is possible to make a very large profit in a
short period of time, but it’s also possible to take a substantial loss. In fact, surveys taken by the
different exchanges have shown that 80% of the individuals speculating in commodity markets
have lost money. This does not mean that some of their trades were not profitable, but after a

59
period of time with a given sum of money they ended up being a loser. This has been a well-
established fact for some time now. The 80% lost by the public, funnels into the pockets of the
20% who are able to profit at trading. Study, learn a system, or method, use discipline, and be
one of the 20% who trade successfully.
Now taking you as an individual, let us see whether you have the characteristics to become a
commodity trader. Number one, and most importantly, is that you do not take money that you
have set aside for your future or money you need daily to support your family or yourself.
Number two, and almost equally as important, is that you must be willing to assume losses and
be willing to assume these losses with such a temperament that it is not going to affect your
everyday life. Money used in the futures market should be money that has been set aside for
strictly risk purposes and if this money is not risk capital, then your methods of trading could be
seriously affected, because you cannot afford to be a loser. If, for any reason, you are uneasy
with a position that you are holding, it’s better to liquidate it now. If, prior to the time of buying
or selling a contract, you are not sure that this is the right step to take, do not take it. To protect
yourself against this hazard you should pre-decide on every trade exactly now much you intend
to lose. If you are in a winning position, be conservative as to how you add additional contracts
or pyramid your position. If you think this is the perfect trade then buy the extra contracts now.
Don’t build an upside down pyramid.
If you take the time to paper trade and learn this simple method you can be one of the few who
succeed. It’s your money; if you give it to a broker, kiss it goodbye. Most of the losers have
never traded their own account or knew any thing about technical analysis, let alone what a
futures contract really is. Study the charts; learn how to measure the risk and the reward; use the
discipline to take small losses. There is a saying that you let your profits ride, but liquidate your
losses fast.
If at this point you feel that you are ready, both financially and mentally, to trade commodities,
the next step is to begin the actual mechanics of trading a futures contract.
Know when to tune out. If you listen to too much advice,
you may wind up making other people’s mistakes.
Ann Landers
Syndicated columnist

60
Using Support And Resistance
If you look at the chart (use the one on live charts at www.quote.com See illustration.) if the
trend is at the top near resistance wait till it pulls back, or if our three major indicators are all
trending down sell at resistance. If it’s at support and the indicators are trending up buy in.
Risk-To-Reward Ratio
In any trade, you should always know your risk/reward ratio. How
much are you willing to risk? What’s your upside? What you think
you might make? What’s your downside or the amount you might
lose? How much of your trading account should you risk on any one
trade?
Although no one can control which way the market is going, we can
usually control our risk. If you don’t control your risk in trades, you
won’t be around very long to have to worry about it.
Hey! That was important or it would not have been in bold face type.
Here is an example:
The S&P has gained too much at the open, or in the first one or two hours. Anything over 10
points just may be too high. If the distance from resistance is only three or four points (A
$150.00 to $200.00 move) it does not give you enough reward compared to the risk. Let it
pullback at resistance and now see if you have enough room to make a trade, before it pulls back
again. Remember if the total market is up, we only trade to the long side. And vice a versa.
Good Advice
Never risk more than 2% on any one trade if you have a small account less that $10,000.00.
Remember this … if your account is only $5,000.00, you may have to risk up too 4 points which
is $200.00 or you may get stopped out in a volatile market.
Preparation through steady practice is the only honest avenue to achieving your potential.
Chi Chi Rodriquez
Professional golfer
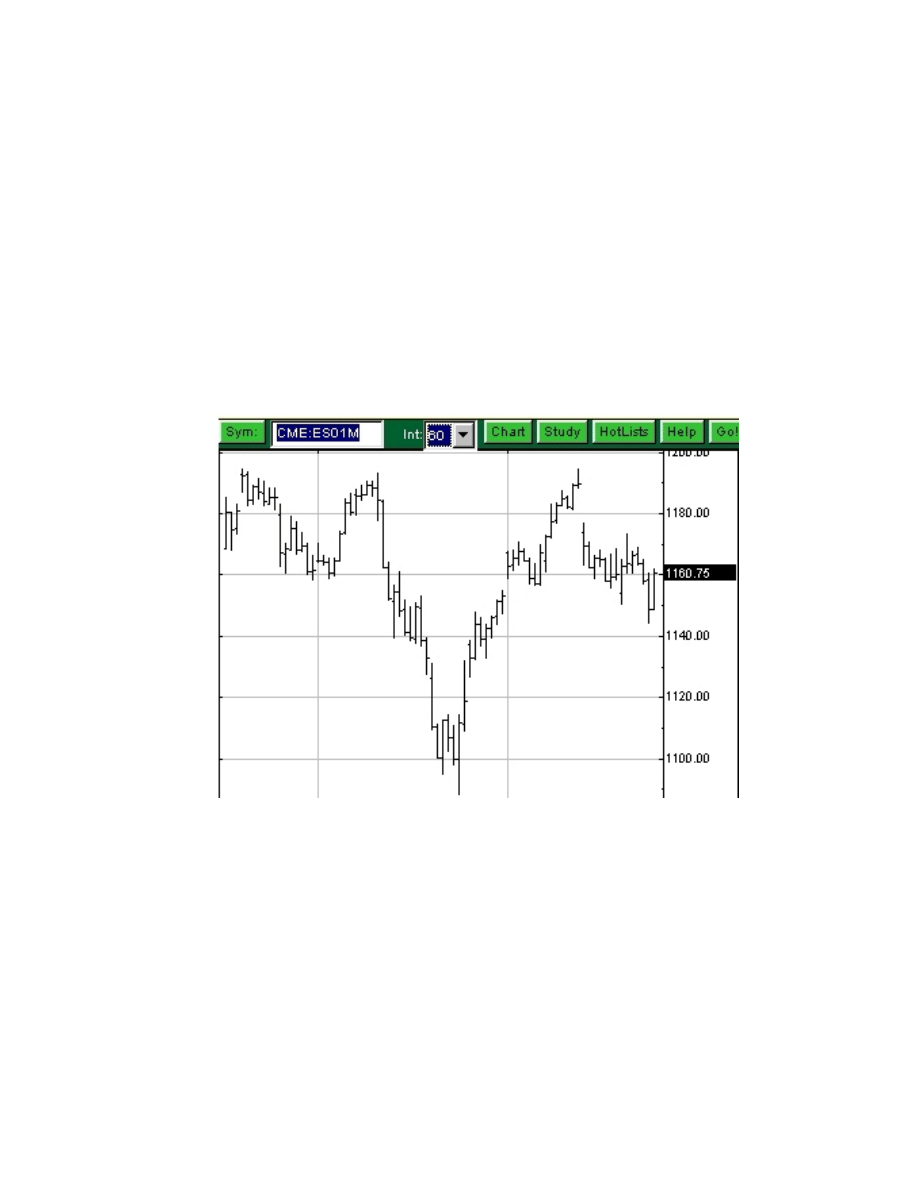
61
Using Technical Analysis To Forecast Prices
#1. Charts:
Charts are the major tools of the technical analyst. While traders can organize and analyze
market data in any number of ways, the bar chart is most common. With this method we use a 5-
minute bar or candle chart from quote.com’s live charts of the Emini S&P, and look back in time
on the chart to see how high and how low the prices had been in say the last two or three days.
(You can do this by clicking on the TIME arrow and use the 30-minute or click on the 60-minute
time frame.) I have a screen shot here if you don’t have a computer.
Figure 3 quote.com’s 60-minute chart showing the last 13-days
(Thom we need to see the whole chart)
#2. Chart Formations:
The study of technical indicators is quite extensive, and certainly encompasses much more detail
than can be provided in this manual. However, it’s possible to introduce you to the most
universally accepted interpretations of price pattern behavior here. Following are the formations
I use to find my risk to reward ratio:

62
Up-trend:
A sequence of higher highs and higher lows.
Connecting the low end of the price bars draws a trend line. For day-traders this may take and
hour or so after the open to form the trend. You can look at the chart and see where the trend was
the day before. Major trends are usually accompanied by increases in volume and open interest.
Down-trend:
A sequence of lower highs and lower lows.
The downtrend line is drawn along the tops of the prices. Again, a major trend will typically
show increasing volume and open interest. (See the info on open interest below.)
Top:
Indicates the probable end of an up-trend.
A double top is a strong indicator that an up-trend has ended. We sell on a double top because we
think it can’t move higher.
***********Show a chart of a double top*******
Bottom:
Signals the probable end of a downtrend.
Again, a double bottom would be considered a strong indicator that a downtrend has ended.
(With a bottom we buy because we think it will move back up.)
Traders watch for these and other patterns in order to position themselves for impending price
movements. For example, assume you saw a top formation taking shape. You may choose to go
short (Sell) in anticipation of a downward price movement.
The technical analysis methods introduced here barely scratch the surface of charting techniques
and technical trading systems. Numerous other complex methods have been developed. I am
only listing patterns that I use with this method, just to keep it simple. Don’t assume that you
must learn every technical trading technique in order to use this method. This may be
overwhelming to you at first, but after a few weeks of paper trading it will start to make sense to
you. Most commodity exchanges have a manual showing you the many different types of
patterns. You can e-mail the Exchanges and they will send the manuals to you. A list of
Commodity Exchanges is available in the back of this manual.
#3. Trend Lines
Using technical analysis to forecast prices we attempt to predict future price direction by looking
for an established pattern of the trend when it reaches either support or resistance. But keep your
eye on the Dow or Nasdaq, as they are our leading indicators that will show you in advance
when that trend will come to an end or just keep right on moving.
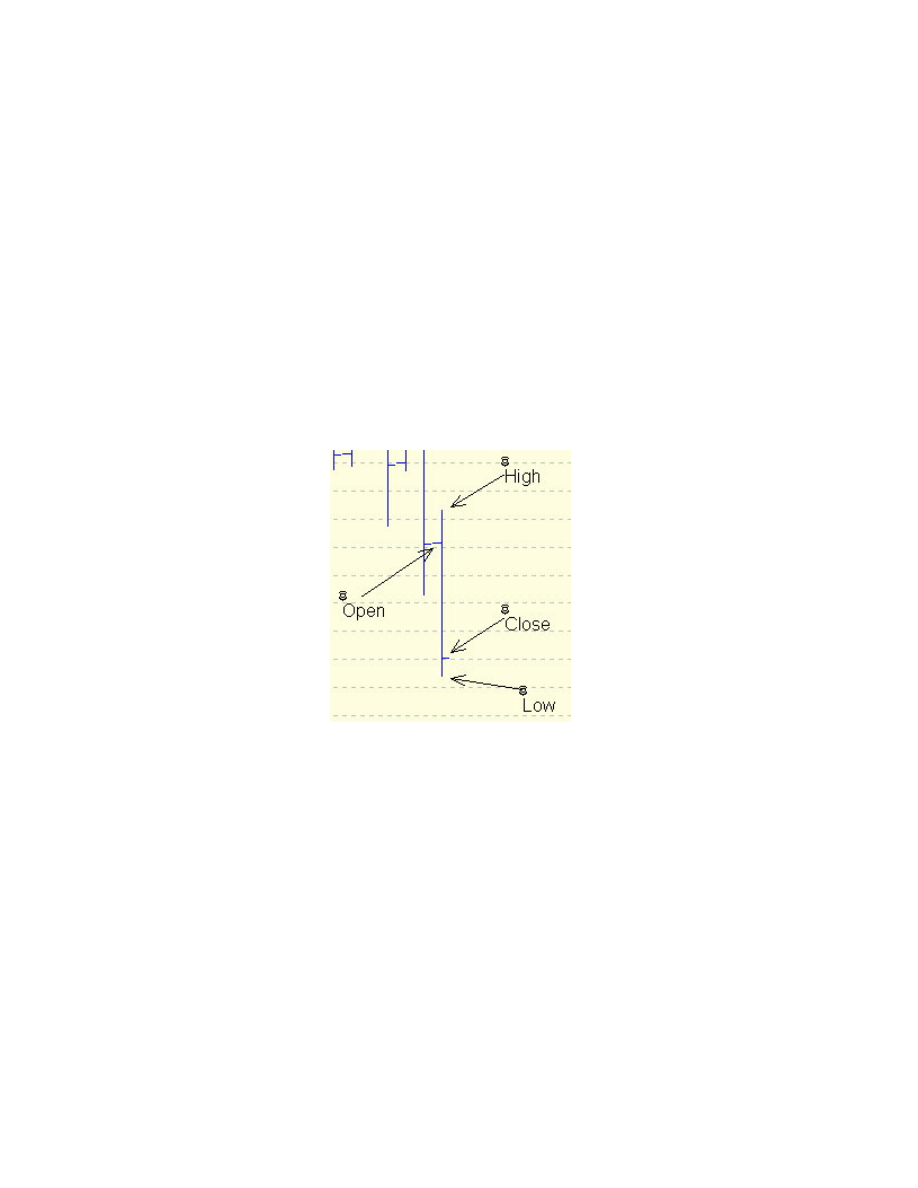
63
#4. Support and Resistance
When you look at a chart, you will see price bars. Price bars consist of a vertical line or bar that
extends from the highest to the lowest price of that time period. If you look closely at a bar, the
highest price is at the top of the bar and lowest price is at the bottom of the bar. The opening
price is a
See illustration on next page
Horizontal tick mark on the left-hand side of the bar, and the closing price is a tick mark on the
right hand side of the bar. These bars are moving from left to right on the chart and create the
pattern we call a trend line that is either moving up or down.
Price bar
You will succeed if you believe it can be done; if you’re willing to work hard while being smart
about it; if you’re willing to surround yourself with great people who will challenge you every
day; if you’re willing to take on the naysayers as a challenge; and if you’re willing to strive for
excellence while recognizing each day is and opportunity to learn.
Amy Love
Publisher
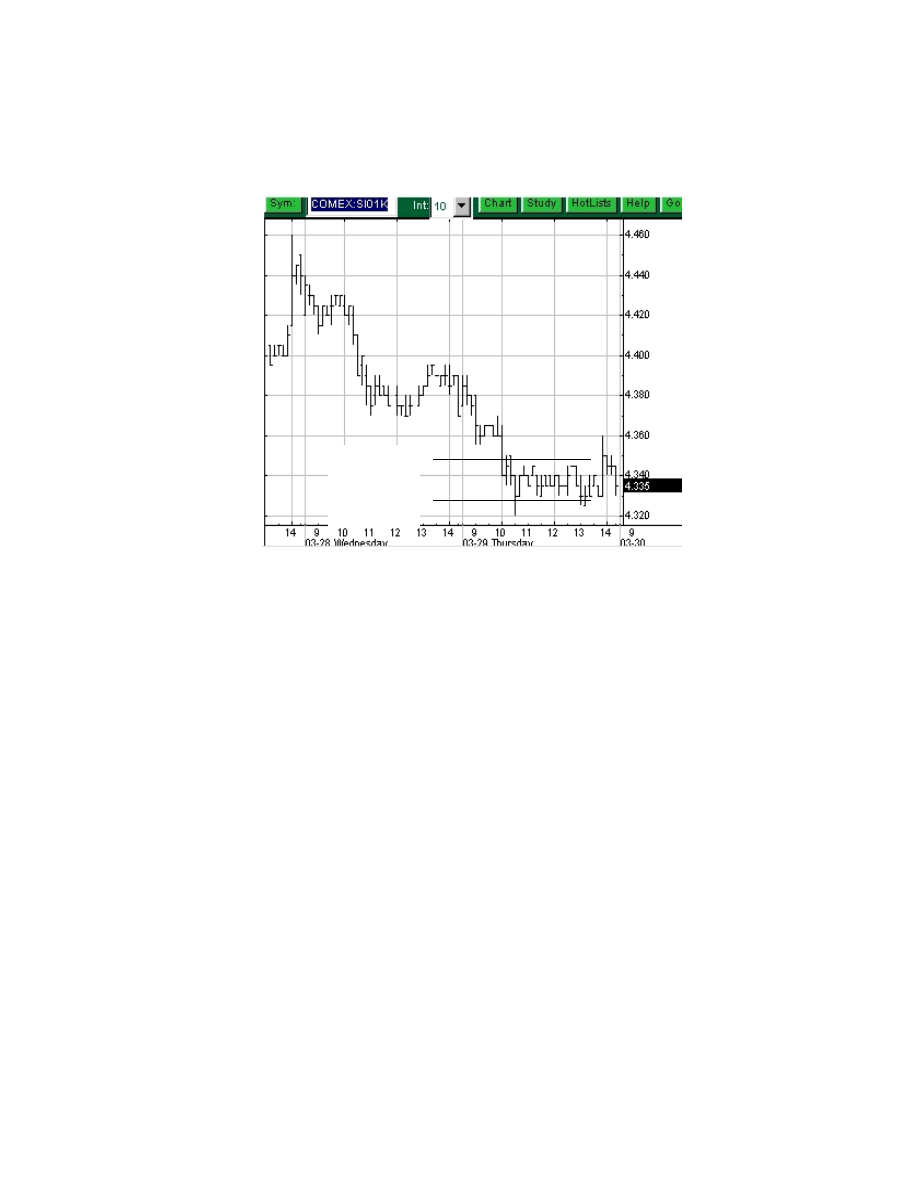
64
You can recognize these patterns by drawing a straight line on the chart at the top of each price
bar.
Stop the line when it heads in a down or up-trend. Sometimes prices get choppy and it’s not
trending up or down. The object is to sell when the trend reaches the top of the channel (This
channel is created as prices move during the time frame we are looking at. It creates a trend
moving up or down, usually about ten or twenty cycles.). Or buy it when it gets to the bottom of
the channel. We use a five-minute time frame with this method. You may find a different time
frame that you like instead. After trading for a few weeks you will be able to pick the one you
prefer
(See Time Zones and formations on page***.)
. We are using the chart to identify price
support and resistance, to identify our risk to reward ratio, and too indicate whether we are going
to buy or sell the market.
#5. Volume and Open Interest
On most chart programs you can find an indicator called “volume” and some programs show the
open interest. Volume is the most frequently cited statistic in reference to a futures contract’s
trading activity. Each unit of volume represents a contract traded and includes both the long and
the short side of the trade. Volume is typically quoted on a daily basis.
resistance
support

65
On quote.com’s Study menu you will find the Moving average and volume indicator, I use this
off and on with other indicators during the trading day. It gives me a chance to see the volume
and also see where we are in the trend using a simple moving average.
Open Interest on the other hand, refers to the number of futures positions that remain open, or
un-liquidated, at the close of each trading session. Open Interest is the total number of futures
contracts of a given commodity that have not yet been offset by opposite futures transactions nor
fulfilled by delivery of the commodity; the total number of open transactions. Each open
transaction has a buyer and a seller, but for calculation of open interest, only one side of the
contract is counted.
By adding the dimensions of volume and open interest, you can learn more about the collective
bullish or bearish sentiments of a market. Volume and open interest are considered confirming
indicators, providing clues about how much strength is behind a trend. For example, if volume
and open interest increase with prices, it is considered a healthy sign of a solid bull market.
Volume and open interest figures are often used to gauge the level of commercial participation in
a market. For example, if a contract experiences relatively low volume levels but high open
interest, it is generally assumed that commercial participation is high. This is because
commercial hedgers tend to use the markets for longer-term hedging purposes.
Hedging –
The initiation of a position in a futures market that is intended as a temporary
substitute for the sale or purchase of the actual commodity. Also, the sale of futures contracts in
anticipation of future sales of cash commodities as a protection against possible price declines, or
the purchase of futures contacts in anticipation of future purchases of cash commodities as a
protection against the possibility of increasing cost.
They put their trades on and keep them until they’re no longer needed to manage a given risk.
Conversely, high volume with low open interest tends to indicate more speculative activity; this
is because the majority of traders prefer to get in and out of the market on a daily basis.
Watch the clock around one o’clock eastern standard time for the commercial trades to take
place, especially on the Dow. If it starts moving fast, up or down, and you can catch it fast
enough, you could have a pretty good opportunity to trade.
#6. Risk Reward Ratio
To determine our risk, we need to look at a chart and find out where we are in relationship to
support or resistance. If we are at a top we need to wait for a pullback. In other words, let the
market come back down a little to at least the amount of reward we are looking for. At $50.00 a
point and a reward of $200.00 per contract we need it to pull back four or five points. That will
give us enough room to make some profit. If we are at support we need to figure out how much
lower it will go. When the market turns bullish we buy one or more contracts. (Work with it.)
This is where a futures chart comes in to play. I will show you an example of what the charts
looked like on the good and the bad trades. Show charts

66
Hey! We’re not building a rocket ship here…it’s not that difficult.
It just takes a little practice…Simple-as-123. Follow the plan…
The indicators are very powerful and it works.
#7. Time
Intraday charts are available in many time frames such as one minute, five-minute, ten minute,
thirty minute, and sixty minute, daily, weekly, and monthly. (More about these later in the
manual.) Each vertical line represents one full bar for each time frame. The top is the high, the
bottom is the low and the tick mark on the left is the open, and the tick mark on the right is the
closing price for that time frame. On a day chart the bar is all of the action for the day, including
the open, the high, the low, and close. I use the ten-minute time frame for this method. You can
experiment with different time frames while you are paper trading and find one that gives you
the best outlook. Or, I sometimes look at all of them when I am ready to make the trade…what
the heck, it doesn’t cost anything and one of the indicators may show you a different look.
#8. Terms
Lingo, jargon, slang, - you know trader’s vernacular ………...(Vernacular…God, I love that
word.).
Long
means the same as buy (not how tall you are). We think the market is going to go up.
Short
means the same as sell (not how short you are). We think the market is going to go
down. Everybody asks me how can I sell something I don’t own? It’s rather simple really! If you
think the market is going to go down you sell. You don’t have to own it. It’s just a term the
exchanges use to describe that you want to short the market…Hey I didn’t make up these
terms…I’m not making this stuff up you know.
Bullish
(Everybody is buying.)
Bearish
(Everybody is selling.)
Gaps
A pattern that occurs when the opening price trades higher than its previous close. It’s
possible to have a gap right in the middle of the trading day, although it’s rare. Gaps are a
powerful pattern. If the market gaps up, it usually trends up for a while then comes down to fill
the gap. If you recognize a gap up, sell. If it gaps down buy. Wait for the turn to make the trade.
Liquidate your position when the market turns back the other way, or only try to scalp two or
three points. You need to practice trading gaps…your screen shots will teach you all you will
ever need to trade gaps. Decide if you want to get in again as it heads the other way. They don’t
always work…but they beeeen berry, berry good to me!

67
MACD
Moving Average Convergence Divergence -- This indicator line is plotted by
subtracting the value of one exponential moving average from that of another exponential
moving average. Another exponential moving average (called a signal line) is then drawn on top
of this.
Interpretation — The simple rule is to buy when the signal line crosses above the indicator line,
and sell when it goes below it. It’s a little slow
for actual trading, but will give you a head start in
identifying a change in the trend. I use it when the market is just trickling up or down (when
there is no momentum).
I will mention Stochastics here because you will ask me about it later.
Stochastics:
Is an oscillator like MACD. Play with it. See if you can get a feel on how it works while paper
trading. There are many other technical indicators. However, for this method keep it Simple-as-
123. All of the indicators I use and have mentioned here are free and on the live charts on the
Internet at www.quote.com. (I use Stochastics on my open gap trades.)
All of the indicators except the Dow and Nasdaq are under the menu heading,
Study
Try them all; it’s free!
#9. Types of Orders:
Please remember, that with this method I suggest using Market orders.
There are many different ways to enter orders into the futures markets! Your decision about
which type of order to use will depend on your trading objectives and your brokerage firm’s
rules. Ask your broker about any restrictions using Globex 2.
Because of the speed of electronic trading I use market orders for this method.
(Place a 2 point stop loss order after you place your market order at least till you gain
confidence using market orders.)
Following are some of the most regularly used orders for trading
futures:
Market Order
The most common type of order is the market order. If you enter a market order, you simply state
the number of contracts you want to buy or sell in a given delivery month. You do not specify
price since your objective is to have the order executed as soon as possible at the best possible
price. When the order is filled, it’s usually close to the price that it was trading at the time it was
placed. In a fast market, however, the price could be considerably different. Example: Buy 1
December E-Mini S&P 500 at the market.

68
Limit Order
(Remember we only use a Market Order with this Method.)
A limit order specifies a price limit at which the order must be executed. In other words, it must
be filled at that price or better. The advantage of a limit order is that you know the worst price
you’ll get if the order is executed. The disadvantage is that you can’t be certain that the order
will be filled. (Please note that with certain brokers, Globex 2 does not accept limit orders. But
check with your broker to make sure.)
Example
“Buy 1 December E-Mini S&P 500 1040.25 OB.” (The OB designation
is added to the limit price to signify or better.)
Stop Order
Stop orders are not executed until the market reaches a given price, at which time they become
market orders. They are normally used to liquidate earlier positions. With my method I use a
trailing mental stop. Just keep track at what point you want to get out if the trade moves against
you.
Stop orders can also be used to enter the market. Suppose you expect a bull market only if the
price passes through a specified level. In this case, you could enter a buy-stop order to be
executed if the market reached this point. One variation is a stop-limit order. With this type of
order, the trade must be executed at the exact price (or better) or held until the stated price is
reached again. If the market fails to return to the stop-limit level, the order is not executed. Be
sure and check with your broker first to see if you can use this type of order electronically.
Using Mental Stops
I prefer mental stops to get me in and out of an order! Many traders prefer mental stops for
protection. I think most traders feel that by having a stop loss order, they are vulnerable to a run
on their stop, and in many cases, they are correct. If you use mental stops, you need to be aware
of the amount of slippage that occurs from the time you decide to place and order until you
receive your flash fill.
Keep a record of the number of times you wish you had used a stop loss order, or you were
happy with your decision to use the market order. Use the one you feel most comfortable with.
Market orders will defiantly cost you some additional slippage. Prices can move very rapidly
against your position and with no stop in the market your trading account could suffer
accordingly.
In any event, if the amount of slippage that occurs between the time you decide to make a trade,
and the time to get your fill is comfortable for you, as it for me, then by all means use mental
stops. If you are emotional, easily distracted, or have other interruptions during trading hours, I
advise against using mental stops.

69
Position and Price Limits
In order to maintain orderly markets, futures exchanges typically set both position and price
limits. A position limit is the maximum number of contracts that may be held by a market
participant. While position limits apply to both hedgers and speculators, a hedger can expand his
limits if he meets certain criteria.
Price limits, also called daily trading limits, specify a maximum price range allowed each day for
a contract. Typically these limits can be expanded under special provisions during periods of
extreme price volatility. Further, price limits are frequently lifted during the delivery month of a
futures contract. The daily price limits are set by the exchanges. Always check with your broker
for current information.
One of life’s most painful moments comes when we must admit that we didn’t do our homework,
that we are not prepared.
Merlin Olsen
Retired football player and announcer

70
Identifying the Contract and Trading Month
All futures contracts have been assigned a unique one or two letter code. This abbreviation, or
ticker symbol, is used to identify the contract on quotation vendor machines and on the price
boards located on the trading floor. Trading floor personnel process all transactions through their
member firms, and the clearinghouse also uses the codes. Because futures contracts are
standardized by predetermined delivery months, a set of one-letter month codes is also used. To
identify the precise futures contract you want to trade, both the contract and month codes must
be specified as well as the year.
Month Codes
These are the only months we need to worry about. We only use these
4 quarters to trade the Emini S&P.
• March .……… H
• June ………… M
• September ……U
• December …… Z
If we were trading the December 2001, E-Mini S&P 500 ESZ01
Please note, each brokerage firm may use the codes in a different layout, for example on
quote.com they use ES01Z….my broker uses ESZ01. ESZ01 stands for E-Mini S&P 500
December 2001
.
Last Day of Trading:
Trading can occur up to 8:30 a.m. (Chicago Time – 9:30 Eastern) on the third Friday of the
contract month. Contract specifications are subject to change without notice. Check with your
broker to confirm this information.
Yea, Yea, Yea (You knew that any way right?) … Right!
Yesterday is history, tomorrow is a mystery, today is a gift.
Eleanor Roosevelt (1884 –1962)
First Lady (1933—1945)

71
Equipment:
Equipment is constantly changing so be sure and check with your provider on the latest
information.
Minimum System
Requirements set up by most brokerage firms are as of Jan. 2002:
Pentium PC or Faster, Windows 95/98/NT/2000, and above.
Or – Apple Macintosh OS 9.0 or higher, Color/VGA Monitor with minimum screen size
800x600 (1024x768 recommended), 28.8 Baud Modem (56K modem recommended), Cable or
DSL is preferred. Netscape Navigator 4.7 or Microsoft Internet Explorer 5.0 or higher.
Please note quote.com at the present time does not support Macintosh. Keep checking and
complain to quote.com if it’s your preference as it is mine!
The Perfect Set Up If You Can Afford It
If you trade for a living, you may want to consider having two computers and use one for back
up on a separate line, with a different Internet Service Provider.
During high volume you may experience down time or worse, get locked up (computer crash). If
your live charts freeze up, you can look over at your back up and it could save what you spent
for the back up system, maybe more! Buy a used, bare bones system, for your back up. Hey! It’s
your money you’re playing with, you can’t be too careful.
You know far more than you know you know.
Never ask, "Can I do this?" Ask instead, "How can I do this?"
Dan Zadra
CEO / Creative Director, Compendium

72
But First You Must Open An Account
It’s Simple-as-123! The first important factor is to decide which brokerage firm will afford you
the best service. You need a state of the art electronic trading system, one that is designed
specifically for futures traders. Because you will be trading electronically on Globex, your most
important question would be how stable is their trading platform. Then you will need to find
someone who will take care of any problems (your broker) you may have with your order, or that
may arise from errors and Internet connections.
If you are going to be a day trader, you should be with a discount brokerage firm. Scalping
requires as small a commission as you can get, without sacrificing speed and service. My
suggestion would be to find a firm with an exemplary reputation and an Account Executive you
feel confident with. Round turn should be around $10.00 to $12.00.
After making a decision on the brokerage firm that would be best for you, contact them and have
them send you the necessary forms to fill out. Fund your margin account that you feel
comfortable with. I feel that $5,000.00 is best for beginners, because it gives you some room to
lose, without wiping you out psychologically. Yes, you can start with only $1,000.00; use only
one contract and keep you risk down to $100.00 or $150.00 per trade. Remember to only trade
with risk capital and be aware of the risk of losing. Start slowly, be conservative, and only trade
perfect scenarios.
In a moment of decision, the best thing you can do is the right thing to do.
The worst thing you can do is nothing.
Theodore Roosevelt (1858-1919)
26th U.S. President

73
Glossary
At The Market:
Orders entered to buy or sell “At the Market”, are executed immediately by the floor broker at
the best obtainable price. On Globex the computer processes the orders in the chronological
sequence they were entered. Your fill should come back within 2 – 4 seconds, on a normal
business day.
Bearish And Bullish:
When market conditions suggest lower prices, and prices are trending lower, a BEAR market is
in existence. Conversely, with higher prices forecast and prices moving upward the situation is
termed BULLISH.
Bid:
An offer to buy a specific quantity of a commodity at a stated price that is subject to immediate
acceptance.
Blue-Chip Stock:
Refers to the common stock of a nationally known company with a long record of profit growth
and dividend payment and with a reputation for it’s management, product, and services. Good
examples of blue-chip stocks are the stocks of the companies listed in the Dow Jones Industrial
Average or the Major Market Index.
Broker:
A registered representative paid a fee or commission for acting either as an account executive or
floor broker who is given the responsibility for the acceptance and/or execution of an order.
Brokerage:
A fee charged by a broker for execution of a transaction; an amount per transaction or a
percentage of the total value of the transaction usually referred to as a commission fee.
Buy In:
A purchase that will offset a previous short sale. Covers or liquidates a short position.
Buy Or Sell On Close Or Opening:
To buy or sell at the end or the beginning of the trading session at a price within the closing or
opening range of prices.
Cash (Commodity):
The physical commodity as distinguished from Futures Contacts based upon the physical
commodity; the commodity as acquired through a cash market.

74
Charting:
The use of graphs and charts in the technical analysis of futures markets to plat price movements,
volume, open interest or other statistical indicators of price movement. See also Technical
analysis.
Clearinghouse:
An agency connected with a commodity exchange through which all futures contracts are
reconciled, settled, guaranteed and later either offset, or fulfilled through delivery of the
commodity and through which financial settlement is made. It may be a fully chartered separate
corporation, rather than a division of the exchange itself.
Close:
A period of time at the end of the trading sessions at which all orders are filled within the closing
range.
CME:
The Chicago Mercantile Exchange.
Commission:
The fee paid for buying and selling commodities in a futures or cash market.
Commodity Futures Trading Commission (CFTC):
A federal regulatory agency charged and empowered under the Commodity Futures Trading
Commission Act of 1974 with regulation of futures trading in all commodities. The commission
is comprised of five commissioners, one of whom is designated as chairman, all appointed by the
President subject Senate confirmation, and is independent of all cabinet departments.
Commodity Trading Advisor (CTA):
A person who, for compensation or profit, directly or indirectly advises others as to the value or
advisability of buying or selling futures contracts or commodity options. Providing advice
indirectly includes exercising trading authority over a customer’s account. Registration with the
Commodity Futures Trading Commission is generally required.
Contract:
The unit of trading in commodity futures. A futures contract specifies the exact grade, amount,
and month of delivery of the commodity.
Contract Month:
The month in which a futures contract may be satisfied by making or accepting delivery.
Cover:
To offset a previous futures transaction with an equal and opposite transaction. “Short-Covering”
is a purchase of futures contracts to cover an earlier sale of an equal number of the same delivery
month; “liquidation” is the sale of futures contracts to offset the obligation to take delivery of an
equal number of futures contracts of the same deliver month purchased earlier.

75
Day Trader:
Speculator who takes positions in commodities and liquidates them prior to the close of the same
trading day.
Dow Jones Industrial Average (DJIA):
It is also referred to as "the Dow." The Average is calculated using a formula and the common
stock prices of 30 major U.S. industrial companies listed on the New York Stock Exchange. (In
1999 they included some Hi-Tech companies as well.)
E-Mini S&P 500:
The e-mini market is 1/5th the full size of the S&P 500, the e-mini offers many investors a
market to trade without the full point risk value of the full size S&P 500. For every point in the
e-mini, the profit or loss is $50.00 per full point per contract. If you buy one contract at $1225.00
and sold that contract at $1231.00, your profit on this trade would be $300.00 minus commission
fees. (Please note that all trading in the E-Mini S&P 500 will occur on GLOBEX
Federal Reserve System:
A quasi-governmental organization of 12 regional banks and a governing board of directors. The
Federal Reserve Bank has several discretionary powers over the volume of credit in the United
States. The system seeks to actively manage the U.S. economy through utilization of its powers,
which are limited to influencing monetary variables.
Flat:
It means that you have closed your account for the day…no open trades. (After you close for the
day call your brokerage firm and make sure you are flat.)
Floor Broker:
An individual who executes orders on the trading floor of an exchange for any other person.
Floor Trader:
Members of an exchange who are personally present on the trading floors of exchanges to make
trades for themselves, also referred to as Locals.
Fundamental Analysis:
An approach to market behavior that stresses the study of underlying factors of supply and
demand in the commodity, in the belief that such analysis will enable one to profit from being
able to anticipate price trends. Contrasted with Charting.
Futures Contact:
An agreement to later sell or buy a commodity of a standardized amount and standardized
minimum quality grade, during a specific month, under terms and conditions established by the
federally designated contract market upon which trading is conducted, at a price established in
the trading pit, or any electronic trading platform.
Futures Price:
The price of a particular futures contract is determined by open competition between buyers and
sellers on the trading floor of a commodity exchange.

76
Globex 2:
Electronic Trading and Order Routing. The CME’s (Chicago Mercantile Exchange) electronic
trading system provides access to CME products around the clock.
Last Trading Day:
Day on which trading ceases for the maturing (current) delivery month.
Leverage:
The potential to increase financial gains as a percentage of an investment. In futures trading, one
speaks of the leverage afforded by margin deposits – often representing only 5 to 10 percent of
the market value of the futures contact – made as performance bonds. Leverage gives a trader the
benefit of price movement on the full contract.
Nasdaq:
The National Association of Securities Dealers Automated Quotations system, created in
February 1971. It is probably the third largest stock market and fastest growing in the world.
S&P 500:
Standard & Poor’s 500 Composite Stock Price Index: A market index composed of 400
industrial stocks, 20 transportation stocks, 40 financial stocks, and 40 utility stocks. The S&P
500 is one of the most widely followed of the market indices, and is widely used as an indicator
of stock market trends and for futures trading strategies. The S&P 500 futures are called
derivatives because they are derived from the actual underlying stock. The S&P 500 Futures
Contract trades on the Chicago Mercantile Exchange, completely independent of the S&P itself.
The contracts expire quarterly. When you see the screen on CNBC, it is always the most current
contract, the one closest to expiration. It’s referred to as the "front month." So, in late December,
after the December contract expires, the front month is the March contract. A day before the
March contract expires; June becomes the front month and so on. (You can learn more about
futures contracts on the Chicago Mercantile Exchange Web site.)
Open higher or lower:
On CNBC The three indicators use a green up triangle and a red down triangle, which indicate
where the points were compared to the day before, e.g. the DOW indicates 10500 with an up
triangle, if you see 25 under the 10500 it means it’s 25 points higher than yesterdays close.
Which must have been at 10475 when it closed the day before. (See illustration. Use a shot from
the TV. Or a piece of art work.)
Margin:
An amount of money deposited by both buyers and sellers of futures contracts to ensure
performance of the terms of the contract i.e. the delivery or taking of delivery of the commodity
or the cancellation of the position by a subsequent offsetting trade. Margin in commodities is not
a payment of equity or a down payment on the commodity itself but rather is a performance bond
or security deposit.

77
To trade in the futures markets, you will be required to post a performance bond margin to
ensure your performance against the obligations of the futures contract. Minimum margin
requirements represent a very small percentage of a contract’s total value. For example, my
brokerage firm’s margin is $4688.00 per contract. The E-mini S&P futures contract is $50.00
times the index. If for example, the S&P 500 Index futures contract is trading at $1400.00, the
value of one contract is $70,000.00. Futures exchanges set minimum margin levels, brokerage
firms can and often do, require a larger margin than the exchange minimum.
Check with your broker and find out what the margin is for day trading. It’s usually about half!
When you first place an order, the amount you must deposit in your account is called initial
margin. Based on the closing prices, your account is then debited or credited each day you
maintain your position. For example, assume you bought 4 e-mini S&P contracts at a price of
$50.00 per contract and posted initial margin. At the end of that trading day, the market closed
up 4 basis points. As a result, the market has moved in your favor $800.00. This amount will
then be credited you your account and is available for withdrawal. Losses, on the other hand, will
be debited. This process is called marking-to-market.
Subsequent to posting initial margin, you must maintain a minimum margin level called
maintenance margin. If debits from market losses reduce your account below the maintenance
level, you’ll be asked to deposit enough funds to bring your account back up to the initial margin
level. This request for additional funds is known as a margin call.
Because margins represent a very small portion of your total market exposure, futures positions
are considered highly leveraged transactions. This can be an attractive feature of futures trading
because little capital is required to control large positions. At the same time, a bad trade can
accrue losses very quickly. This is why successful traders must develop a sound trading plan and
exercise great discipline in their trading activities.
Margin Call:
A call from a clearinghouse to a clearing member, or from a brokerage firm to a customer, to
bring margin deposits up to a required minimum level.
Newbie:
Some one who is just starting out…a new trader, beginner.

78
Just food for thought!
Just thought you may enjoy some of these notes to myself!

79
Claiming trader status…a letter from a fellow trader
Marsh,
In the evening, I caught some of your discussion about taxes. There are 2 categories of tax status
for traders. One is called "trader status". If you claim trader status, then you are basically
claiming that you trade as a business and don’t have any normal wage income. As a business,
you are eligible for all the normal business expense deductions (computer, data-feed costs, etc).
Further, all your income is capital gain/loss. There are *big* advantages to claiming trader
status.
The other option you can file for is called "mark to market". This is the option that lets you
deduct more than the $3000 capital loss for the year. Unless you're losing a lot of money, the
mtm election is not useful. Plus, the mtm election is one-way. I.e. once you claim it, you have
to do a ton of paperwork to go back on it.
All this is caveat emptor. Here are some websites to learn about it yourself. The trader status
election would save you a lot of money I believe.
I'm not endorsing any of these sites. But they do have good information.
www.traderstatus.com
www.tradersaccounting.com
www.greencompany.com
www.fairmark.com
-Jeff
You may not know all the answers, but you probably won’t be asked all the questions either.

80
Hey…this sounds important!
Best risk/reward conditions prevail following an extended period of sideways movement after a
decline.
*******
Never think you can always anticipate the market reaction to any news announcement. Stocks
have been known to rise following bad news, fall after good.
*******
Don't get caught in the middle of a trading range. Buy/sell the outer limits of the range, otherwise
wait for a breakout from that range before acting.
*******
If the price trend is down prior to an important announcement, an advance can be expected
following. Conversely, if the price trend has been up, a sell off is likely following an important
announcement.
*******
As long as a market is acting right, don't rush to take profits.
*******
Bear markets have no supports and bull markets have no resistance.
*******
When time is up, markets must reverse.
*******
" Aim to be fearful when others are greedy and greedy when others are fearful."
Warren Buffett
*******
First you have to learn the rules...watch how it works by applying what you've learned...no your
limitations and use discipline, patience, and consistency
*******
Quote of the Day
I do not think that any civilization can be called complete
until it has progressed from sophistication to un-sophistication,
and made a conscious return to simplicity of thinking and living.
- Lin Yutang

81
I think this was from Buda?
o
Awaken new powers -
o
Have happy relations -
o
Heal past mistakes -
o
Handle difficult people -
o
Dismiss confusion -
o
Be protected always -
o
Live above troubles -
o
Conquer anxiety -
o
Know true love -
o
Stop Stress -
o
Solve problems swiftly -
o
Give life true meaning -
o
Be at ease -
o
Succeed with others -
o
Live above troubles -
o
Feel good always -
o
Make life make sense -
o
Know what to say -
o
Stop energy thieves -
o
Make right decisions -
o
Own your own life -
o
Banish shyness -
Do not dwell in the past, do not dream of the future,
concentrate the mind on the present moment.
Buddha

82
Reflections...
When I look into a mirror I have nothing to fear because looking back at me is whom I can be.
Simply look in the mirror and you will see the person responsible for getting you where you are
today. We seldom look inward to find solutions within ourselves. After all, your present thinking
and actions (or lack of action) have created your present circumstance. If you continue to think
and act in this manner, you will keep getting the same results. This is not to say you have control
over every single event that comes into your life. You don't. But you do choose your response to
each event...although you may not think of your responses as "choices" because they are
ingrained habits, which have become automatic over time. Even if your past choices have been
poor ones, you can still change. The best way to bring about change is through awareness...by
recognizing your bad habits and becoming conscious of your fundamental beliefs. Your beliefs
create your reality. When you make positive changes in your belief system, a corresponding
positive change will take place in your level of achievement and fulfillment. Recognize that
success is not something that randomly happens to you; it is not an accident. Rather, success
springs from within you. It begins with the attitude and is achieved through persistent action.
Simply look in the mirror, smile and tell yourself, i'm going to have a great day!
That's at least a start.
Trading Simple-as-123
Marsh
I look great for my age ... almost life like!

83
The thoughts, ideas, and trading strategies contained in this manual are solely the work of the
author and are not meant to reflect the point of view of any other author, exchange or commodity
clearing firm. While attempting to show the best possible trading advice, the author cannot be
held responsible for the use of these ideas contained in this manual. This is not an offer to buy or
sell any commodity or futures contract. No representation is being made that any individual will
or is likely to achieve profits with this method, or will not incur losses.
Copyright © 1999 by Marshall J. Jones
All rights are reserved. No part of this work may be reproduced or transmitted in any form or by
any means, electronic or mechanical, including photocopying and recording, or by any
information storage or retrieval system without the prior written permission of the copyright
owner unless such copying is expressly permitted by federal copyright law.
This manual is written strictly for educational purposes. All information is from sources that are
deemed to be reliable, but is not guaranteed as to accuracy or completeness.
DISCLAIMER
Important Risk Warning:
The information presented in this manual is for informational purposes only. Investment in
futures involves a high degree of risk, your investment may fall as well as rise, you may lose all
your original investment and you may also have to pay more on the original amount invested.
Consult your broker or advisor prior to making any investment decisions. Past or simulated
performance is not a guide to future performance.
No part of this manual may be transmitted or reproduced in any manner whatsoever without
written permission from the copyright owner: Marshall J. Jones or by my e-mail
address…mjjones35@cox.net
Or write to:
Marshall J. Jones
6214 Lake Athabaska Place
San Diego, CA 92119-3523.
You will succeed if you believe it can be done; if you’re willing to work hard while being smart
about it; if you’re willing to surround yourself with great people who will challenge you every
day; if you’re willing to take on the nay-sayers as a challenge; and if you’re willing to strive for
excellence while recognizing each day is and opportunity to learn.
Amy Love
Publisher

84
The following is a list of things I still have to write about yet.
CHARTS
ABBREVATIONS
PROOFREADING
USEFUL WEB SITES
INDEX
ISP CONNECTIONS
ACTION PLAN CHECKLIST
NARROW SIDEWAYS CHANNEL
POWER TRADING
Art work, charts etc.
(get copyright permission and trademarks noted in the manual)

85
Private Lessons
There are those who feel they need a mentor and want one on one lessons. The following is a list
of what I cover and a whole lot more in a Paltalk chat room one on one, The lessons are for one
week, or ten half days and includes the manual and or CD/DVD when it’s finished. I also offer
continuing support via e-mail, or assistance when I’m in my chat room on paltalk.
Free access to Simple-as-123.net website for students.
Cost
$1000.00 … or form a group not to exceed 4 for the same price. (Example 2 for $500.00 or 4 at
$250.00 per person)
If after the first day of training you are not completely satisfied with my teaching
style or method, you must let me know you don’t want to continue. I will then return your check in full.
On going support with the purchase of the method is included till you understand and
demonstrate you can trade using this method.
Part Time Lessons Cost
$100.00 … 9 a.m. till 12:30 p.m. EST
If you just need help regarding certain issues like recognizing momentum, power trading or other
aspects of the this method, or working on individual mental situations to help you strengthen
confidence. You may just want to observe my trading techniques for half a day. You can pick the
morning session or afternoon session.
If after your first lesson you want to continue, I will apply it towards a whole week.
See Study Guide on next page.

86
STUDY GUIDE
Things we will discuss; but first this list is not in any particular order. Please review and send me
back anything you are fully familiar with. I don’t want to waste your time on stuff you already
know.
1. How the clock works on quote.com
2. Charts…the tools, drawing lines, indicators (moving average) etc.
3. Money management…risk only 2% rule
4. Trailing stops
5. Time Log
6. Time Zones
7. Entry, exit
8. Risk, reward
9. The big picture
10. Candles
11. Order types
12. Support, resistance
13. Pivots
14. Using a stop loss order
15. Market orders
16. Taking the best trade of the day
17. Analysis
18. Recording your trade
19. Phone at the ready (crash)
20. Volume
21. Bollinger bands
22. Bars verses candles
23. Risk capital (over 80% lose)
24. Momentum
25. Noon day doldrums
26. Break out…when do we take the most risk (risk/reward guide)
27. Counting Bars…why we need to know
28. Intra-day…Change in trend. How to use it. (Staying with the trend here and now)
29. Gap trades…When will they be in our favor
30. Warnings to remember…Expires on the third Friday of the month.
31. Fed reports...how does affect the mkt.
32. 50% retracements...when it's likely to occur.
33. Consolidation...what it looks like and what affect it has on the trade.
34. Learning how to keep frustration to a minimum.
35. Streaming data window, how to use it affectively.
36. Time and Sales window, how to use it affectively.
37. Tick and Trin...does it help?
38. Head and Shoulders, flags, (pennants)
39. Ideal long set up.

87
40. Mental stops
Please email me any questions you may have when you check off this list of things I want to
cover in our first lesson. Like I said if you are already familiar with some of this stuff I don’t
want to waste your time…we can cover what you are most unsure of.
------------------------------------------------------------------------------------------------------------
Let me get you going so we can concentrate on how to keep this simple as 123.
Just skip over any of the stuff you know.
1. How the clock works...first of all remember it's the clock on Quote.com's free or it's basic
$9.95 charts that I'm referring. If you click on the default window of the streaming data window,
you will get another window to pop up. I keep that particular window up on the 15 minute ES
chart. I keep the streaming data window up on both the ES, and Compx 5 min. charts. The clock
that is displayed there is at EST, and it's also on the streaming data window, that clock is
showing you the time and sales data. I use it to make sure we are not getting delayed data; they
have to be in sync! You must keep and eye on it during the day to make sure you have live data.
THIS IS IMPORTNANT.
This is all basic stuff, but I will go over it anyway, what the heck it's free, and you might learn
something.
2. By now you should have explored all of quote.com sub menu items, as follows: Refer to
attachment, Picture 4. The first is a small down arrow button; this is used for selecting any charts
you have selected during the session. (Note, that if the chart locks up the default selection is the
only thing that will be there). The next menu window is where you type in the chart symbol you
want, hit the Submit button or click the return or entry key. Next button is the chat time frame, as
you know I use the 5 min. chart and remember the default is the 10 min. chart. If you ever lose
data and refresh the chart you must re-set it to 5 min. next is the Help button, you should use this
when you have a problem with the charts or you just want to find out something. Support on
quote.com in almost non-existent. Next button is the chart style, click on the sub menu and select
candlestick, that’s the one I like...you can look at all of the styles that are available and you can
see the difference, but who cares! While in this sub menu you can also select the draw tool. You
can experiment with this tool like any draw software you may have played around with ... I use it
draw trend lines, support and resistance lines, about every 30 minutes or so. If you can't figure
out to make it work let me know. The Price Scale is something I have never used, so I can't help
you there. The All Sessions (24 Hour Chart) is something I use before the open, when you click
on it you will see what the night traders are up to. You can look at this each morning before the
open and get a feel on how volatile that session was. (Use different time frames to get a feel for
it) This will take sometime for you analyze and I don't think I need to cover it at this time. The
Enable Ambiguous Excgs. Is nothing I use either. I don't even know what it's about to be quite
frank with you. You can check it out if you think it will help you. The Export Chart menu is not
much good either...It does not show the US Stock Market Watch window or the Time & Sales
window. It's best to use a software program to grab a snapshot of the whole chart. The other data

88
in that sub menu I don't feel is of any value, I guess if you wanted to know the Time and Sales to
HTML may help you if you were paper trading and wanted to know exactly what it was when
you called the trade, but just know I don't even think about it. I have the time and sales data on
my trading platform when I take the trade anyway. The HotList menu is not for us either, it's for
stocks. The Study menu is of great interest, I click on them all every once in awhile, and I like to
see a confluence of them going my way. If the market is highly volatile you wont have time
though. We just use the Moving Average or Moving Average and Volume on both 5 min. charts,
and MACD on the 15 min. ES chart.
5. Time Log. The value of the Time Log is to be able to go back after the close and see how the
Dow and Nasdaq moved the ES. Just keep the log up to date every 15 min. (make any notes
within that time frame if something comes up …like if the dow was at +25 at the beginning of
the 15 min. and moved down to minus in 5 or 10 min.) That way you can look at the chart and
understand what happened. THIS IS A MUST, IF YOU WANT TO LEARN THIS METHOD.
You must keep this log and study it after the close each day. You should be able to cover over
each bar and tell me where the next bar will be at.
7. I will go over with you live…about entry and exit. Just remember this – we use a 2 point stop
loss; you may want to use an actual stop loss order instead of a mental one. You will have to
experiment with it while you are paper trading. The entry is somewhat subjective. I can’t make it
mechanical. I will try to show you live where and what I look at to enter the trade.
8. Risk and Reward. Try to keep in mind, where is the reward is at…are we at the high or low of
the day? That would be high risk and we don’t really know what the reward might be. If we are
looking at a breakout or a reversal we should be able to see what the risk (resistance) and what
the reward is (support). We use a 2-point target, but take what the market will give us. I will go
over this when we are watching …you will just have to gain experience and confidence.
9. The Big Picture. I use the US Stock Market window to show me what the total market is
doing, are they all in sync or what. We have the data for the Dow, NY, Nasdaq, and Russell,
even the Commodity index. If all of these are in sync we have a safer or lower risk trade. That is
the big picture!
12. Support and Resistance. We must learn to recognize where support and resistance is at, at all
times. I will try to cover this, and in my own opinion. This is somewhat a subjective area. There
are many ways to figure out where there is support and resistance. I suggest that you find articles
you can read on the subject on the web. Study it well!
13. Pivots. Pivot numbers can show you key timing points. You can use the pivot calculator that
is on the web site or just call your broker and get them from him. As you know I don’t use them,
but I am becoming a believer. So…I suggest you take the time to study them. I will try to cover
more on this subject in an up-date in the manual. They should help you pinpoint entry and exit
prices in fast moving markets. Day traders love to know key intra-day turning points, and pivot
numbers reveal just where to look. The trading floor has been using the pivot numbers for years.
They work because the floor expects them to. If you know what the floor or what the locals

89
know, you can finally work with the floor instead of against it, this often puts your trading with
the so-called “locals” and gives you a better target so you can hold on through the pullbacks.
16. Taking the best trade of the day. I feel the best trade of the day is the 10:00 o’clock reversal. I
will cover this trade and all other types of trades we use, such as reversals, breakouts, buying
dips and selling rallies.
17. Analysis. You must analyze every trade you make…especially the ones that don’t work. I
will try to cover with you the ones I call, and why the trade worked or did not work. THIS IS A
MUST!
18. Recording your trade. When you take a trade be sure to make a snap shot of your actual
trade. I can on my platform from Man Financial. I take a snapshot and keep it with my trade
record and chart that I make at the end of the day. That way the brokerage firm cannot give me a
statement that does not jive with my actual trades. Hey it happens! This way you can prove what
actually took place. They can and do make human errors of the entry on your statement. Be sure
you reconcile your statement each day.
20. Volume. I will go over this when you are on line…On the 5 min. ES chart use the Moving
Average and Volume indicator. There is enough liquidity on Globex to make a trade anytime of
the day, so we really don’t have to worry about the volume to make a trade, but I will show you
where volume picks up and you should see the volatility pick up to look for an opportunity to
make a trade, it’s a big clue.
21. Bollinger Bands. You may like them versus the Moving Average indicator. Bollinger bands
give you the best of both worlds. You can find an article on the subject on the web. I think they
are worthwhile.
www.BollingerBands.com
.
22. Bars vs. Candles. The quote.com chart defaults to bars. I like the candles they are like a
searchlight when we get a pullback; use candles, that’s my preference! One thing about bars
is…you can sort of see the entry, high, low, and exit point, a little more clearly, because of the
tick mark. Look at both and use the one you like best.
24. Momentum. This is the heart of the method and also the most subjective. We must learn to
spot momentum and pull the trigger when see it. We will have many opportunities to see mom
when it happens during our sessions.
We will go over all of this as we are watching together; this will just give you a head start. Hope
it helps you!
Let me know if you have any questions after reading this so we can concentrate
Prosper,
Marsh

90
Notice of Disclaimer
The material found in this method is for educational purposes only. Due to the high leveraged nature, there is
considerable monetary risk associated with trading commodity futures. The output generated from this method is
intended for people to "paper trade" only. No representation is being made that any commodity trading account will,
or is likely to, achieve profits or losses in any particular fashion. In fact, there are frequently substantial differences
between hypothetical commodity trading performance results and the actual results achieved by most traders. You
could lose all your money and more trading. No recommendations or claims of monetary gain or loss using this
method are being stated or guaranteed. Past performance is not necessarily indicative of future results. Account sizes
will vary, along with ancillary costs such as commissions and slippage. Marshall J. Jones who developed this
methodology is not a broker, CTA, or registered individual. Use at your own risk.
Signature ___________________________________ Date ___________________
Printed Name __________________________________________
Release of Liability and Secrecy Agreement
I hereby agree to release Marshall J. Jones of any liability associated with this trading method.
I agree to NOT divulge any part or section of this trading methodology to anyone. This includes discussion about,
or questions on, the method in any and all commodity trading chat rooms or forums except the Simple as 123 chat
room. No material in this method may be reproduced in any fashion. Violations of this Secrecy Agreement are
punishable by law.
Signature ___________________________________ Date ___________________
Printed Name __________________________________________
Guarantee
If after the first day of training you are not completely satisfied with my teaching style or method, you
must let me know you don’t want to continue. I will then return your check in full.
On going support with the purchase of the method is included until you understand and demonstrate you
can trade using this method.
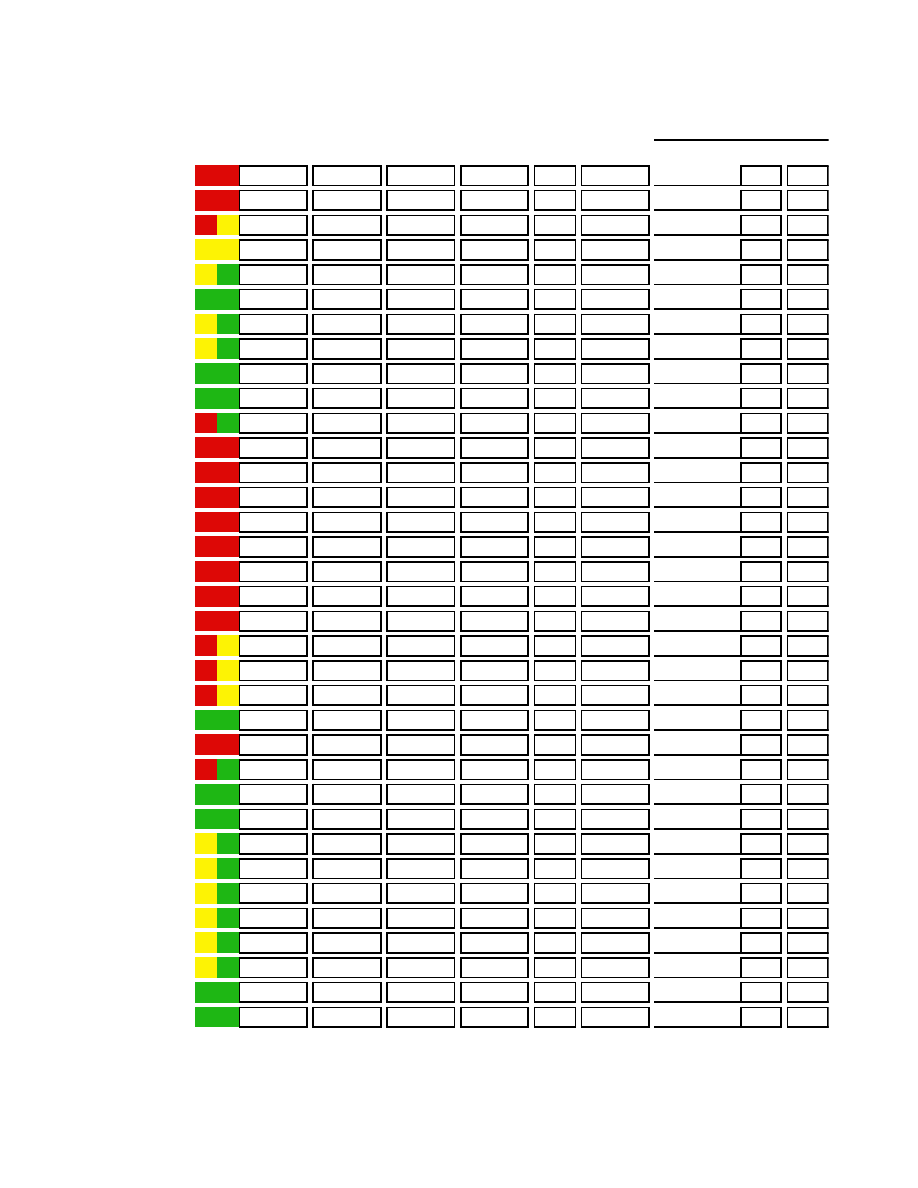
91
Time Zone and Trade Log
Date:
TIME
DOW
NAS
ES
TRADE
B / S
EXIT
NOTES
W / L P T ' s
9 : 3 0
9 : 4 5
9 : 5 0
1 0 : 0 0
1 0 : 1 0
1 0 : 1 5
1 0 : 2 5
1 0 : 3 0
1 0 : 4 5
1 1 : 0 0
1 1 : 1 5
1 1 : 3 0
1 1 : 4 5
1 2 : 0 0
1 2 : 1 5
1 2 : 3 0
1 2 : 4 5
1 3 : 0 0
1 3 : 1 5
1 3 : 2 5
1 3 : 3 0
1 3 : 3 5
1 3 : 4 5
1 4 : 0 0
1 4 : 1 5
1 4 : 3 0
1 4 : 4 5
1 5 : 0 0
1 5 : 1 0
1 5 : 2 5
1 5 : 3 0
1 5 : 4 0
1 5 : 4 5
1 6 : 0 0
1 6 : 1 5
ZONE
92
The Bar Chart
Each black vertical bar is a price bar, and
represents four important price points from a
given trading day: open, high, low and close.
High
Open
Low
Close

93
Testimonials
Marsh:
Just wanted to drop you a note about the lessons so far. In one sense,
I feel like I have made some progress during the lessons. But on the other
hand I feel like I am more confused on certain things. For example, with the
time zones. I have read that article 5 or 6 times now and I think I
understand it. But you said that article was written more for stocks, and
the es differs slightly. For example today, you mentioned a reversal that
frequently occurs at 11:00am, but that is nowhere in the article. I realize
you have picked up many things yourself over the years from studying and
playing the markets, and that is really what I am interested in. If you feel
the es has different reversal time zones based on your experience, then I
would rather learn those than I had learn the ones in the article. Again, I
realize these times are not rigid and can fluctuate or not happen at all, but
if you were writing an article on time zones in the es what would you write?
That is what I want to learn.
I like the way you teach. By that I mean you are always offering
commentary on what you are thinking as you see the markets unfold. At first
it was hard for me because you are mentioning a lot of things and I am trying
to pay attention to you, look at the charts, remember when to write the dow
and compx #'s in my trade log,etc. Yesterday I found it hard to keep up with
everything, but today was better and I am sure every day will get even easier
as I adjust to the pace and learn to handle more things at once. I don't
want you to take this as I think you are covering too much too fast. That is
not the case at all. It is more a case of me just adjusting to be able to
handle and process a lot of tasks at once. In fact, the more information on
things you can give me the better. I am constantly taking notes on what you
are saying. Sometimes it is the little things that you have learned through
experience and share with me that help me out. Please give me all of the
information you can. If you have some specific strategies you use , then
please share those with me also. I realize that trading is not a very
structured thing and a lot is subjective. But I am a very orderly person and
feel I will be more successful if I have a structured trading plan( as much
as possible) and follow specific trading strategies. For example, the snake
method is very structured, You take a trade if a happens, then b confirms,
etc. That is the way I learn best. If we take things in steps...for
example: on the 5 min chart we are looking for ...... to occur. Once that
occurs, then we are going to look at compx for confirmation. Once in the
trade we are watching a, b, and c if ..... happens we get out. Sort of work
out scenarios on things we are looking for. If any of those things occur,
then we do this. We enter the trade only after ........... has happened. I
hope you understand what I am trying to communicate.
Overall I am very pleased with the lessons. I think you are a great
teacher. My problem is I want to learn everything in one day, and that is
not going to happen. I can promise you that I am 100% committed to this.
Like I mentioned today I am going to do my part with the studying, keeping
trade log, etc. I just hope you will continue to be patient with me as I
learn. Even though I have read many courses on commodity trading, this
method in many ways is different from what I have previously learned. Most
everything I previously read was geared towards long term trading. This is
my first experience with day trading. The method is simple, but does take
time to get a "feel " for what is going on. As each lesson passes, I think I
am getting a better feel, but I obviously still have a long way to go.
Take care-----JK

94
Trading Double Tops and Bottoms --
Warning – This technique is in it’s developing
stage…papertrade only
Dear Marshall,
I would like to describe the method I use to trade double tops and double bottoms. I will share
this with you step-by-step. First, I will describe “double top and double bottom”. I will describe
only the double tops because the opposite is true for the double bottoms.
A double top is when two candles, side-by-side, are equal at the top. The wicks of the candles
can be different in length as long as the bodies are equal. However, if the bodies are unequal yet
the tops of the wicks are equal, they are also considered a double top. If you are using a bar
chart, the bars must be equal at the top and likewise at the bottom. If you have more than two
tops and they are equal at the top and at the bottom, the leading edge of the third candle is the
direction of the move. For example, if two candles are equal at the top and also at the bottom,
how do you know which way it is going to go? If the third candle, sets up at the bottom to make
the third bottom; then, the move would be to the long side. Only the leading edge of the candle
can be considered to the previous candle.
Now, please keep in mind that not all double tops and doubles bottoms work to the satisfaction
of the trader, but 80% of them usually do make money.
The methods are:
1. Trading every double top and double bottom through the day
2. Take only the tops at the highest points of waves and the
low points of valleys
3. If you want to make your trading even tighter with less chance of error, only take
either the top or the bottom in the direction of the trends. Once a trend up is
established, take only double bottoms. If the trend is down, take only double tops.
This will lessen your chance of losing.
My particular style is a scalper, so I only look for one point once I enter the trade. One may vary
the amount of your target to suit your trading style; however, I think you will find that there is
the usually only one point behind a double top or a double bottom if you are playing method 1.
If you want more points out of a double top or a double bottom, you would play only method two
and three.
Next and the most important of all, is knowing how to tell when to get in and out of trades.
Having the $compx scrolling price window and the Dow scrolling price window, you can view at
least twelve prior prices. Since the Dow and the compx are the driving force of the E S, one
must know at all times where the Dow and the compx are going because where the Dow and the
compx go so goes the E S. In order to trade with the least amount of risk, one must only trade
when the compx and the Dow are moving in the same direction. If you are in a trade, the same

95
thing holds true, it will help you know when to get out of the trade. If you see the Dow go in
reverse three numbers, get out! If you see the compx go in reverse two numbers, get out!
It is wise to enter the trade when there is less than a half a point on a new candle if you are
trading method number one and taking only one point.
One of the most valuable lessons I learned...is that we all have to learn from our mistakes, and
we learn from those mistakes a lot more than we learn from the things we succeeded in doing.
Ann Richards
Former governor of Texas

96
Trading The Moving Average
Strategies:
Set up on the 10 minute ES candlestick chart with a 10 period Moving Average line. You
can use the 5 minute chart for entry and after you have 2 points, switch to the 10 minute
chart.
Using the method to make a safe entry
1. We don’t trade during the first hour.
2. Our Magic Numbers; Dow +25 Nasdaq +12 or holding.
3. Caution at highs or lows of the day.
4. Enter after the second candle is above the moving average line. You must have
confirmation from the compx chart to take the trade.
5. Option on #4 if there is momentum…risk if the first candle is 3/4 over the line on the
entry of the second candle above the line.
6. Risk 2 points after entry; …or the candle crosses back over the line. See nuances.
7. Exit, when you have your target, or stay in the trade till it moves back over the line. See
nuances.
8. Once you have a 2 point gain place the stop to breakeven, or + 1/4 point to pay for the
trade. Target 6 points or stay in the game till it crosses back over the line.
Nuances:
Time zones, and momentum are a key factor to take a safe trade. Try to feel the pulse of the
market, so you can stay in the game on pullbacks or reversal time zones. Use a trailing stop if
you feel a pullback coming…this is not mechanical, but subjective, don’t be greedy. Count
candles, so that you can gage if a pullback may take you out of the trade…if so, use a tight
trailing stop to lock in your profit.
This strategy will not work in a choppy market (white candle, red candle, etc.) You may have
to wait till after you have an established trend. Use the 15 minute chart and MACD to see the
trend direction clearly.
A break below the Moving Average; use the opposite strategy to short the ES.
Look at these charts and try to see how you could have stayed in the game.
Charts go here….
Wyszukiwarka
Podobne podstrony:
Pristine Intra day Trading Techniques With Greg Capra
Day Trading In Mind
Pristine Intra day Trading Techniques With Greg Capra
Bernstein Jay Inwestor Jednosesyjny Day trading[2002][PDF]
Ten Secrets to Becoming a Highly Profitable Residential Developer Real Estate Investing Day Trading
Richard D Wyckoff The Day Trader s Bible Or My Secret In Day Trading Of Stocks
Forex Trading Strategy Learn how to day tradeswing trade major currency pairs(1)
Forex Intraday Trading by George Bryer (Learn to make a 1000 pips a month)
Trading Online Learn forex and trading techniques finance,economics,investment,market,exchange,mon
18 Learn FOREX Training, Education and Trading Courses
Grid Trading
Metastock Formule X Trading System fixed
Forex Online Manual For Successful Trading
Leclaire Day Bal Kopciuszka 02 Nie ma tego złego
Midsummers Day Wordsearch Answer Key
więcej podobnych podstron