
DCA for Bot Detection
Yousof Al-Hammadi, Uwe Aickelin and Julie Greensmith
Abstract— Ensuring the security of computers is a non-
trivial task, with many techniques used by malicious users
to compromise these systems. In recent years a new threat
has emerged in the form of networks of hijacked zombie
machines used to perform complex distributed attacks such as
denial of service and to obtain sensitive data such as password
information. These zombie machines are said to be infected with
a ‘bot’ - a malicious piece of software which is installed on a
host machine and is controlled by a remote attacker, termed the
‘botmaster of a botnet’. In this work, we use the biologically
inspired Dendritic Cell Algorithm (DCA) to detect the existence
of a single bot on a compromised host machine. The DCA is an
immune-inspired algorithm based on an abstract model of the
behaviour of the dendritic cells of the human body. The basis
of anomaly detection performed by the DCA is facilitated using
the correlation of behavioural attributes such as keylogging and
packet flooding behaviour. The results of the application of the
DCA to the detection of a single bot show that the algorithm
is a successful technique for the detection of such malicious
software without responding to normally running programs.
I. I
NTRODUCTION
Computer systems and networks come under frequent
attack from a diverse set of malicious programs and activity.
Computer viruses posed a large problem in the late 1980’s
and computer worms were problematic in the 1990s through
to the early 21st Century. While the detection of such worms
and viruses is improving a new threat has emerged in the
form of the botnet. Botnets are decentralised, distributed
networks of subverted machines, controlled by a central
commander, affectionately termed the ‘botmaster’. A single
bot is a malicious piece of software which, when installed on
an unsuspecting host, transforms host into a zombie machine.
Bots can install themselves on host machines through sev-
eral different mechanisms, with common methods including
direct download from the internet, through malicious files
received as emails or via the exploitation of bugs present in
internet browsing software [15].
Bots typically exploit traditional networking protocols
for the communication component of their ‘command and
control’ structure. Such variants of bots IRC (Internet Relay
Chat) bots, HTTP bots and more recently Peer-to-Peer bots.
In this research we are primarily interested in the detection
of IRC bots as they appear to be highly prevalent within the
botnet community, and seemingly little research has been
performed within this area of computer security. IRC is a
chat based protocol consisting of various ‘channels’ to which
a user of the IRC network can connect. Upon infection
of a host, the bot connects to the IRC server and joins
Yousof Al-Hammadi, Uwe Aickelin and Julie Greensmith are with
the Department of Computer Science, The University of Nottingham,
Jubilee Campus, Nottingham NG8 1BB, UK (email: yxa@cs.nott.ac.uk,
uxa@cs.nott.ac.uk,jqg@cs.nott.ac.uk).
the specified channel waiting for the attacker’s commands.
The bot is programmed to respond to various commands
generated by the attacker through a Command and Control
(C&C) structure using the IRC protocol [13]. In addition to
the flexibility offered by IRC in the management and control
of bots, this protocol is ideal for such attackers as it provides
a high degree of anonymity for the attacker/botmaster. In
early implementations, bots were used to perform distributed
denial of services attacks (DDoS) using a flood of TCP
SYN, UDP or ICMP ‘ping’ packets in an attempt to over-
load the capacity of computing resources. More recently
bots are developed complete with keylogging features for
closely monitoring user behaviour including the interception
of sensitive data such as passwords, monitoring mouse clicks
and the taking of screenshots of ‘secure’ websites [11].
In this paper we focus on the detection of a single
bot formulated as a host-based intrusion detection prob-
lem, and avoids the technical problems of administrating a
highly infective network within an academic environment.
To perform this research, we rely on principles of ‘extrusion
detection’ [2] where we do not attempt to prevent the bot
from gaining access to the system, but we detect it as it
attempts to operate and subvert the infected host. In addition
to the monitoring of potential keylogging activity through
keystroke analysis, network information is also incorporated
into the implemented method of detection.
The algorithm used for the detection of a single active bot
is the immune-inspired Dendritic Cell Algorithm (DCA) [9].
This algorithm is a ‘2nd Generation’ Artificial Immune
System (AIS), and is based on an abstract model of the
behaviour of dendritic cells (DCs) [16]. These cells are the
natural intrusion detection agents of the human body, whom
activate the immune system in response to the detection of
damage to the host. As an algorithm, the DCA performs
multi-sensor data fusion on a set of input signals, and this
information is correlated with potential ‘suspects’ which
we term ‘antigen’. This results in a pairing between signal
evidence and antigen suspects, leading to information which
will state not only if an anomaly is detected, but in addition
the culprit responsible for the anomaly. Given the success
of this algorithm at detecting scanning activity in computer
networks [8] the DCA is a good candidate solution for the
detection of a single bot.
The aim of this paper is to apply the DCA to the
detection of a single bot and to assess its performance
on this novel problem area. For these experiments the
basis of classification is facilitated through the correlation
of malicious activities such as keylogging, SYN or UDP
flooding attacks, anomalous file access and potential bot-
related communications. Our results show that correlating the

different behaviours exhibited by a single bot can enhance the
detection of malicious processes on the system to determine
the presence of a bot infection and to identify the processes
involved in the bot’s actions. As part of this investigation
we also introduce a more sophisticated analysis method for
the DCA which may give an improved performance than
the anomaly coefficient method described in Greensmith et
al. [8].
This paper is structured as follows: Section II contains
background information describing the DCA algorithm. Sec-
tion III discusses the existing bots detection techniques. We
present our methodology of bot detection in section IV. The
conducted experiments are explained in section V. Our results
and analysis are presented in section VI and we summarize
and conclude in section VII.
II. T
HE
D
ENDRITIC
C
ELL
A
LGORITHM
A. Algorithm Overview
Artificial Immune Systems have been applied to problems
in computer security since their initial development in the
mid-1990’s. A recent addition to the AIS family is the DCA,
which unlike other AISs does not rely on the pattern match-
ing of strings (termed antigen), but instead uses principles
from the danger theory to perform ‘context aware’ intru-
sion detection. The danger theory is an alternative view of
presenting the activation of the immune system. The danger
theory states a response is generated by the immune upon the
receipt of molecular signals which indicate that the body is
in distress. DCs are sensitive to changes in the concentration
of danger signals. In this work we have produced an abstract
view of the essential features of DC biology, which are
presented in this paper. For further information on the natural
functions of DCs please refer to Lutz and Schuler [14]. A
detailed description and formal analysis of the DCA is given
in Greensmith et al. [9]
In addition to the processing of signals, DCs consume
any proteins within their locality and storing these antigen
proteins for future use. DCs combine the evidence of damage
with the collected suspect antigen to provide information
about how ‘dangerous’ a particular protein is to the host
body. In addition to danger signals, two other sources of
signal are influential regarding the behaviour of DCs -
namely PAMPs (pathogen associated molecular patterns) and
safe signals which are the molecules released as a result of
normal cell death.
In nature DCs exist in three states: immature, semi-mature
and mature. The initial state of a DC is immature, where
it performs its function of processing the three categories
of input signal (PAMP, danger and safe) and in response
produces three output signals. Two of the output signals
are used to represent the state of the cell, as the immature
DC can change state irreversibly to either semi-mature or
mature. During its lifespan collecting signals, if the DC
has collected majority safe signals it will change state to
a semi-mature state and all antigen collected by the cell is
presented in a ‘safe’ context. Conversely, cells exposed to
TABLE I
S
IGNAL
W
EIGHT
V
ALUES
csm
semi
mat
PAMP
4
0
8
DS
2
0
4
SS
3
1
-6
PAMP and danger signals transforms into a mature state,
with all collected antigen presented in a dangerous context.
To initiate maturity, a DC must have experienced signals,
and in response to this express output signals. As the level
of input signal experienced increases, the probability of
the DC exceeding its lifespan also increases. The level of
signal input is mapped as a costimulatory output signal
(CSM). Once CSM reaches a ‘migration’ threshold value,
the cell ceases signal and antigen collection and is removed
from the population for analysis. Upon removal from the
population the cell is replaced by a new cell, to keep the
population level static. Each DC is assigned a different
migration threshold. This results in a population of cells
whom sample for different durations and experience different
input signal combinations. The transformation from input to
output signal per cell is performed using a simple weighted
sum (Equation 1) described in detail in [8] with the corre-
sponding weights given in Table I, with values derived from
preliminary experimentation. Pseudocode for the functioning
of a single cell is presented in Algorithm 1.
input : Sorted antigen and signals (PAMP,DS,SS)
output: Antigen and their context (0/1)
Initilize DC;
while CSM output signal
< migration threshold do
get antigen;
store antigen;
get signals;
calculate interim output signals;
update cumulative output signals;
end
cell location update to lymph node;
if semi-mature output
> mature output then
cell context is assigned as 0;
else
cell context is assigned as 1;
end
kill cell;
replace cell in population;
Algorithm 1: DCA algorithm
O
j
=
2
i=0
(W
ijk
∗ S
i
)
∀j, k
(1)
where:
•
W is the signal weight of the category i
•
i is the input signal category (i
0
= P AMP , i
1
= DS,
and i
2
= SS)

•
k is the weight set index as shown in Table II (k =
1 . . . 5)
•
j is the output signal value where:
–
j = 0 is a costimulatory signal (csm)
–
j = 1 is a semi-mature DC output signal (semi)
–
j = 2 is a mature DC output signal (mat)
B. Signals and Antigen
In nature the three different categories of signal are derived
from different sources and have different effects on DCs.
To use such signals within a computational context, abstract
semantic mappings between potential sources of input data
and the signal categories are derived. The signal mappings
are as follows, with the details of the signals used for the
detection of bots given in section IV:
•
PAMPs: A signature of abnormal behaviour. An increase
in this signal is associated with a high confidence of
abnormality.
•
Danger Signal: A measure of an attribute which in-
creases in value to indicate an abnormality. Low values
of this signal may not be anomalous, giving a high value
a moderate confidence of indicating abnormality.
•
Safe Signal: A measure which increases value in con-
junction with observed normal behaviour.This is a con-
fident indicator of normal, predictable or steady-state
system behaviour. This signal is used to counteract the
effects of PAMPs and danger signals.
In previous experiments with the DCA, the system calls
invoked by running processes are used as antigen [7]. This
implies that behavioural changes observed within the signals
are potentially caused by the invocation of running programs.
For the purpose of bot detection, antigen are derived from
API function calls, which are similar to system calls. The
resultant data is a stream of potential antigen suspects,
which are correlated with signals through the processing
mechanisms of the DC population. One constraint on antigen
is that more than one of any antigen type must be used to
be able to perform the anomaly analysis with the DCA. This
will allow for the detection of which type of function call
is responsible for the changes in the observed input signals.
More details are given in Section IV-D regarding the mapping
of antigen.
C. Analysis
Once all antigen and signals are processed by the cell pop-
ulation, an analysis stage is performed. This stage involved
calculating an anomaly coefficient per antigen type - termed
the mature context antigen value, MCAV. The derivation of
the MCAV per antigen type in the range of zero to one is
shown in Equation 2. The closer this value is to one, the
more likely the antigen type is to be anomalous.
MCAV
x
=
Z
x
Y
x
(2)
where MCAV
x
is the MCAV coefficient for antigen type
x, Z
x
is the number of mature context antigen presentations
for antigen type x and Y
x
is the total number of antigen
presented for antigen type x.
In previous work [9], it has been shown that the MCAV
for processes with low numbers of antigen per antigen type
can be higher than desired. This can lead to the generation
of false positives. In this paper we address this problem by
producing an anomaly coefficient which is an improvement
on the MCAV, by incorporating the number of antigen used
to calculate the MCAV. This improvement is termed the
MCAV Antigen Coefficient or MAC. The MAC value is the
MCAV of each antigen type multiplied by the number of
output antigen per process and divided by the total number
of output antigen for all processes. This calculation is shown
in Equation 3. The MAC value also ranges between zero
and one. As with the MCAV, the nearer the MAC value to
one, the more anomalous the process.
MAC
x
=
MCAV
x
∗ Antigen
x
n
i=1
Antigen
i
(3)
where MCAV
x
is the MCAV value for process x and
Antigen
x
is the number of antigen processed by process
x.
III. R
ELATED
W
ORK
: B
OTS AND
T
HEIR
D
ETECTION
A. Bots
The aim of a bot is to subvert a host machine for use by
the central controller. In order to achieve this aim, each bot
is armed with various methods to facilitate their malicious
activities. To communicate with the bot commander, the IRC
bot must connect to an IRC channel, where the bot is termed
to have ‘membership’. Once a bot is installed and becomes
active on a channel, it awaits commands from its controller.
Bots frequently rely on the ability to perform keylogging.
This is the means of intercepting and recording user activities
such as keystroke typing. Keylogging represents a serious
threat to the privacy and security of our systems as the
keylogger can collect sensitive information from the user
such as personal information, passwords and credit card
numbers. The acquisition of this information can constitute
identity theft and fraud.
Another malicious activity is performing a denial of ser-
vice attack by sending numerous network packets to the
remote host across the network, including both SYN and
UDP packet flooding. SYN attacks are invoked when the
controlling botmaster issues a SYN attack command to the
bot and exploits the ‘3-way handshake’ of a TCP connection
stream. The bot on the infected host sends a series of SYN
packets to the target host, using modified packet headers
to disguise the IP address of the infected host. The target
host replies with a SYN ACK packet. The target host then
waits to receive the corresponding ACK from the bot-infected
machine. However, the bot never responds back because the
SYN ACK is sent to a random IP address as the bot had
spoofed the IP address of the outbound packets. As a result,
multiple connection requests accumulate at the target host,
resulting in the victim memory buffers become full so that it

cannot accept further legitimate connection requests causing
a denial of service, as the target is rendered unusable. In a
similar manner, UPD floods are also used to slow down a
target system to the point where further connections cannot
be handled, by sending large number of UDP packets to a
specified port on a remote host.
In addition to the aforementioned attacks, the infection
of a bot on a host machine seriously compromises the
confidentiality of the data contained within the infected host.
In effect, once a bot has infected a machine, it becomes
under the control of the botmaster and can be subverted for
whatever purpose the controller requires.
B. Detection Techniques
The majority of existing techniques for botnet detection are
signature-based approaches, in a similar manner to many in-
trusion detection systems. Such techniques frequently use the
analysis of network traffic [4][5][6]. Although this approach
is a useful mechanism for bot detection, it is impossible if
the network packet data is encrypted. Freiling et al. [5][10]
collect bot binaries by using a non-productive resource, such
as a honeypot, to analyse bot traffic and collect useful
information to shut down the remote control network by
emulating bot activities. There are numerous problems with
this approach. First, the non-productive resource needs to
receive activities directed against it in order to analyse
bot behaviour. In addition, emulating bots’ actions to join
botnet community can be discovered if the botnet size is
relatively small. To avoid these problems, our work focuses
on monitoring API function calls.
The technique used by Cooke et al. [4] performs bot
detection through the analysis of two types of bot-based
communications, namely bot-to-bot and between bots and
their controllers. In the approach taken by Cooke et al., bot
payloads are analysed using pattern matching of known bot
commands and in addition examines a system for evidence
of non-human characteristics. They conclude that bots can
run on non-standard ports and that the analysis of encoded
packets is very costly on high throughput networks. They
determined that there are no simple characteristics of the
bot communication channels that can be used for detection,
which makes the detection of bots an interesting and difficult
problem. They also discuss the approach of detecting bots by
their means of distribution or attack behaviour by correlating
data from different sources. While it is suggested in their
work that correlation would be beneficial for the detection
of a single bot, they did not provide information regarding
how this correlation should be performed. To alleviate this
problem, the DCA is applied to bot detection, with their
suggestions further promoting the use of such correlation
algorithms for this type of detection problem.
A alternative method for detecting bots introduced by
Goebel and Holz [6] through monitoring IRC traffic for
suspicious IRC nicknames, IRC servers and non-standard
server ports. Such potentially suspicious packets are assessed
using regular expressions to classify suspicious nicknames,
resulting in a scoring function per packet. However, their
approach can be overcome in numerous ways such as using
hitlists which contain normal names or again, through the
encryption of such vital information.
Anomaly detection is also used to detect the presence
of a bot [3], where deviations from a defined ‘normal’ are
classed as an anomaly. In anomaly detection, behavioural
attributes are often profiled to perform the assessment of
potentially anomalous data. An approach for detecting bots
using behavioural analysis is presented by Racine [15].
This method is based on the discovery of inactive clients
and their subsequent assignment to a network connection.
Any active clients are then classified according to the IRC
channel membership. This approach is successful in detecting
idle IRC activity, but suffers from high false positive rates
when applied to a scenario consisting of both active users
and active bots. As with similar techniques, searching for
such IRC patterns can be costly and difficult especially if
the packets are encrypted. However, we believe the use
of behavioural monitoring is a promising method for the
detection of bots, especially if such attributes can be used
to correlate the behavioural changes with evidence of active
IRC bots. This provides us with a strong motivation for
using an algorithm designed for the purpose of correlating
behaviour with activity, as performed by the DCA.
In summary the majority of techniques for the detection of
a single bot are based on developing signatures and through
the use of network packet header information. These tech-
niques are limited - if packet streams are encrypted then these
measures can be circumvented with relative ease. Current
behaviour-based approaches are also limited, generating high
rates of false positives, which have the potential to slow
down a system. We believe that using the DCA to perform
this detection task will be successful as it contains elements
of signature based detection through the use of the PAMP
signals, which is combined with the anomaly-based approach
represented by the danger signals. In addition the DCA
can be used to correlate relevant behavioural attributes with
programs potentially involved with a bot infection.
IV. M
ETHODOLOGY
A. Bot Scenarios
For the purpose of experimentation two different types
of bot are used, namely spybot and sdbot [1]. The spybot
is a suitable candidate bot as it uses various malicious
functionalities such as keylogging and SYN attacks. The
sdbot is also used as it contains the additional functionality
of a UDP attack. As a communication vessel, IceChat [12],
an IRC client, is used for normal conversation and to send
files to a remote host. To provide suitable data for the DCA
a ‘hooking’ program is implemented to capture the required
behavioural attributes and to intercept and capture function
calls. To emulate real-world bot infections, three different
scenarios are constructed including inactive (E1), attack
(E2.1-2.3) and normal (E3) scenarios. The attack scenario
consists of three sessions: a keylogging attack session, a
flooding session and a combination session comprising both

keylogging and packet flooding. The derived sessions include
the following:
•
Inactive bot (E1): This session involves having inactive
bots running on the monitored host in addition to
normal applications such as an IRC client, Wordpad,
Notepad and CMD processes. Spybot is used for this
session. The bot runs on the monitored victim host and
connects to an IRC server where it joins a specified
channel to await commands from its controller, though
no attacking actions are performed by this idle bot. This
results in minimal data, with the majority of transactions
involving simple PING messages between the bot, the
IRC server and the IceChat IRC client.
•
Keylogging Attack (E2.1): The sdbot is capable of
intercepting keystrokes, upon receipt of the relevant
command from the botmaster. Bots use various methods
to perform keylogging - both techniques involves the bot
intercepting API (Application Programming Interface)
function calls. In this scenario, two methods of key-
logging are used including the ”GetKeyboardState” and
”GetAsyncKeyState” function calls. However, detection
cannot be performed by examining these two function
calls alone, as normal legitimate programs often rely on
such function calls. For example, MS Notepad utilises
GetKeyboardState as part of its normal functioning.
The DCA will be employed to discriminate between
malicious and legitimate keystroke function calls.
•
Flooding Attack (E2.2): This involves performing
packet flooding using the spybot for a SYN flood attack
and the sdbot for a UDP attack. These flooding methods
are designed to emulate the behaviour of a machine
partaking in a distributed denial of service attack. As
part of the process of packet flooding the bots rely
heavily on socket usage, as part of the packet sending
mechanism. Therefore to detect these attacks, socket
uses monitors are employed, with the exact nature of
this data given in the forthcoming section. It is important
to note that during the flooding attack no ‘normal’
legitimate applications are running.
•
Combined Attack (E2.3): In this session, both keylog-
ging and SYN flooding are invoked by the bot. As with
session E1, spybot is used to perform this attack. Note
that the two activities can occur simultaneously in this
scenario.
•
Normal Scenario (E3): The normal scenario involves
transferring a file of 10 KB from one host to another
through IRC client. Other applications such as Wordpad,
Notepad, cmd and the hook program are running on the
victim host. Note that no bots are used in this scenario as
this is the normal/uninfected session used to assess the
occurrence of any potential false positive errors made
by the DCA.
B. Data Collection
It is assumed that either bot is already installed on the
victim host, through an accidental ‘trojan horse’ style infec-
tion mechanism. Therefore we are not attempting to prevent
the initial bot infection but to limit its activities whilst on a
host machine. The bot runs as a process whenever the user
reboots the system and attempts to connect to the IRC server
through IRC standard ports (in the range of 6667-7000). The
bot then joins the IRC channel and waits for the botmaster
to login and issue commands.
For the purpose of use by the DCA an interception
program is implemented and run on the victim machine to
collect the required signals and antigen data. These collected
data are then processed, normalised and streamed to the
DCA. In terms of the function calls intercepted, three specific
types of function calls are used as signal and antigen input
to the DCA. These function calls are as follows:
•
Communication functions: socket, send, sendto, recv
and recvfrom.
•
File access functions: CreateFile, OpenFile, ReadFile
and WriteFile.
•
Keyboard state functions: GetAsyncKeyState, GetKey-
boardState, GetKeyNameText and keybd event.
Invoking these function calls within specified time-window
can represents a security threat to the system, but also may
form part of legitimate usage. Therefore, an intelligent cor-
relation method such as the DCA is required to determine if
the invocations of such function calls are indeed anomalous.
C. Signals
Signals are mapped as a reflection of the state of the victim
host. A major function of the DC is the ability to combine
signals of different categories to influence the behaviour of
the artificial cells. Three signal categories are used to define
the state of the system namely PAMPs, DSs (danger signals)
and SSs (safe signals), with one data source mapped per
signal category. These signals are collected using a function
call interception program. Raw data from the monitored host
are transformed into log files which are then analysed by the
DCA, following a signal normalisation process. The resultant
normalised signals are in the range of 0 - 100 for the PAMP
and DS with the SS having a reduced range, as suggested in
Greensmith et al [8]. This reduction ensures that the mean
values of each signal category are approximately equal, with
preliminary experiments performed to verify this.
In terms of the signal category semantics, the PAMP
signal is a signature based signal. This signal is derived
from the rate of change of invocation of selected API
function calls used for keylogging activity. Such function
calls include GetAsyncKeyState, GetKeyboardState, GetKey-
NameText and keybd event when invoked by the running
processes. To use this data stream as signal input, the rate
values are normalised. For this process n
p
is defined as the
maximum number of function calls generated by pressing a
key within one second. Through preliminary experimentation
it is shown that by pressing any key on the keyboard for a
one second it generates n
p
number of calls. Subsequently
n
p
is set to be the maximum number of calls that can be
generated per second. The resultant normalised the PAMP
signal based on this value by applying linear scale between
0 and 100.

The danger signal is derived from the time difference
between receiving and sending data through the network. As
bots respond directly to botmaster commands, a small time
difference between sending and receiving data is observed.
In contrast, normal chat will have a higher value of time
difference between sending and receiving activity. As with
the PAMP signal, the normalisation of the danger signal
involves calculating a maximum value. For this purpose n
d
is
the maximum time difference between sending a request and
receiving a feedback. If the time difference exceeds n
d
, the
response time is normal. Otherwise, the response time falls
within the abnormality range and is scaled between 0 and 100
through the use of this maximum value. We set up a critical
range (
0 to n
d
) that represents a abnormal response time.
The zero value is mapped to 100 (danger) and n
d
is mapped
to zero (not danger). If the response time falls within the
critical value, it means that the response is fast and consider
to be dangerous.
Finally, the safe signal is derived from the time difference
between two outgoing consecutive communication functions
such as [(send,send),(sendto,sendto),(socket,socket)]. This is
needed as the bot sends information to the botmaster or
issues SYN or UDP attacks. In normal situation, we expect
to have a large time difference between two consecutive
functions. In addition, we expect to have a short period of
this action in comparison to SYN attack or UDP attack.
Therefore n
s1
and n
s2
are the maximum time differences
between calling two consecutive communication functions.
If the time difference is less than n
s1
, the time is classified
as abnormal. If the time difference falls between n
s1
and
n
s2
, the time difference is classified as uncertain time. If
the time difference is more than n
s2
, the time difference is
classified as safe time. These timings are scaled between 0
and 10. Using statistical analysis, we notice that the mean
value for bot to respond to the command is around 3.226
seconds. Therefore, we set up a critical range for the safe
signal. We divide our critical range into three sub-ranges. The
first range is from zero to n
s1
where n
s1
= 5. Any value
that falls within this range is considered as an unsafe signal.
The second range is where there is uncertainty of response.
The uncertainty range is between n
s1
and n
s2
= 20. The
third range is that the time difference is above n
s2
and is
considered as the confidence range. In this range, we are sure
that the time difference between two consecutive function
calls is generated as a normal response.
D. Antigen
The collected signals are a reflection of the status of the
monitored system. Therefore, antigen are potential culprits
responsible for any observed changes in the status of the
system. In order to detect the bot, correlation of antigen
signals is required to define which processes are active when
the signal values are modified. Any process executed one of
the selected API function calls explained in section IV, the
process id which causes the calls is stored as an antigen in
the antigen log file. The more active the process, the more
antigen it generates. Each intercepted function call is stored
TABLE II
W
EIGHT
S
ENSITIVITY
A
NALYSIS
signal
WS1
WS2
WS3
WS4
WS5
PAMP
2
4
4
2
8
csm
DS
1
2
2
1
4
SS
2
6
3
1.5
0.6
PAMP
0
0
0
0
0
semi
DS
0
0
0
0
0
SS
1
1
1
1
1
PAMP
2
8
8
8
16
mat
DS
1
4
4
4
8
SS
-3
-12
-6
-6
-1.2
and is assigned the value of the process ID to which the
function call belongs and the time at which it is invoked.
Both signal and antigen logs are combined and sorted based
on time. The combined file form a dataset which is passed
to the DCA through a data processing client. The combined
log files are parsed and the logged information is sent to the
DCA for processing and analysis.
V. E
XPERIMENTS
The aim of these experiments is to use the DCA to perform
detection of the bot. Various experiments are performed to
verify this aim. Each experiment is repeated ten times which
is sufficient, as the results from the repeated experiments
produce a small variation on standard deviation by using
Chebyshev’s Inequality. After collecting and processing the
data, one dataset is selected randomly from each repeated
experiments. The dataset is passed to the DCA using a data
collection client. Each scenario (E1 - E3) is used for the
purpose of experimentation with three hypotheses tested:
1) Null Hypothesis One: Data collected per dataset are
normally distributed. The Shaprio Wilk test is used for
this assessment.
2) Null Hypothesis Two: The MCAV/MAC values for the
normal processes are not statistically different from
those produced by the bot process. This is verified
through the performance of a two-sided Mann-Whitney
test, where p
=0.95.
3) Null Hypothesis Three: Variation of the signal weights
as described in Table II produces no observable dif-
ference in the resultant MCAV/MAC values and the
detection accuracy. Wilcoxon signed rank tests (two-
sided) are used to verify this hypothesis.
A. System Setup
In all experiments, the parameters used are identical to
those implemented in Greensmith and Aickelin [8], with the
exception of the weights, as per Null Hypothesis Three. All
experiments are performed in a small virtual IRC network
on a VMWare workstation. The VMWare workstation runs
under a Windows XP P4 SP2 with 2.4 GHz processor.
The virtual IRC network consists of two machines, one
IRC server and one infected host machine. Two machines
are sufficient to perform these experiments as one host is
required to be infected (i.e. the monitored machine) and the

TABLE III
T
HE RESULTS OF THE
MCAV/MAC
VALUES GENERATED FROM
DCA
BASED ON SIGNAL WEIGHTS OF
T
ABLE
I. T
HE VALUES THAT HAVE
ASTERISKS ARE NOT SIGNIFICANT
Expe-
Output
mean
Mann-Whitney
riment
Process
Antigen
P-Value
MCAV
MAC
MCAV
MAC
bot
35
0.0978
0.0578
E1
IRC
24
0.0625
0.0255
0.1602*
0.0202
bot
1329.7
0.4736
0.4542
E2.1.a
IRC
59
0.2881
0.0122
0.0002
0.0002
bot
1296.2
0.5441
0.3098
IRC
464.9
0.5284
0.1077
0.0089
0.0002
E2.1.b
cmd
8.9
0.7889
0.0031
0.0002
0.0002
Notepad
239.4
0.6916
0.0726
0.0002
0.0002
Wordpad
268.8
0.8286
0.0977
0.0002
0.0002
bot
19206.3
0.6047
0.6038
E2.2.a
IRC
18
0.3441
0.0003
0.0002
0.0000
cmd
9.8
0.2889
0.0002
0.0003
0.0000
bot
5790.5
0.4360
0.4346
E2.2.b
IRC
19
0.2772
0.0009
0.0002
0.0000
bot
41456
0.8218
0.8214
E2.3.a
IRC
20.5
0.5480
0.0003
0.0002
0.0000
bot
22446
0.9598
0.9461
IRC
59.1
0.7802
0.0021
0.0000
0.0002
E2.3.b
cmd
9.7
0.6300
0.0003
0.0002
0.0002
Notepad
23.1
1.0000
0.0010
0.0001
0.0002
Wordpad
233.6
0.8801
0.0090
0.0002
0.0002
E3
IRC
135.5
0.1136
0.1136
N/A
N/A
other to be an IRC server to issue commands to the bot in
question.
VI. R
ESULTS AND
A
NALYSIS
The results from the experiments are shown in Table III,IV
and V. The mean MCAV and the mean MAC values for each
process are presented, derived across the ten runs performed
per scenario.
A. Null Hypothesis One
Upon the application of the Shapiro-Wilk test to each of
the datasets, it was discovered that the resultant p-values
imply that the distribution of scenarios E1, E2.1 and E3 are
normal, with E2.2 and E2.3 not normal. Given these two
rejections of the null, Null Hypothesis One is rejected. As a
result of this, further tests with these data use non-parametric
statistical tests such as the Mann-Whitney test, also using
95% confidence.
B. Null Hypothesis Two
For all scenarios E1-E3, a comparison is performed using
the results generated for the bot versus all other normal
processes within a particular session. The results of this com-
parison are presented in Table III. In this table, the computed
p-values using an unpaired Mann-Whitney test are presented,
with those results deemed not statistically significant marked
with an asterisks. In experiment E1, significant differences
do not exist between the resultant MCAV values for the
inactive bot and the normal IRC process, and so for this
particular scenario the null cannot be rejected. This can
be attributed to the fact that the total number of antigen
produced by both processes is too small in number to give
an accurate description of the state of the monitored host.
This is supported by the fact that the MAC values differ
significantly for this experiment. This implies that the MAC
is a useful addition to the analysis of the data output from
the DCA as it allowed for the incorporation of the antigen
data, which can influence the interpretation of the results.
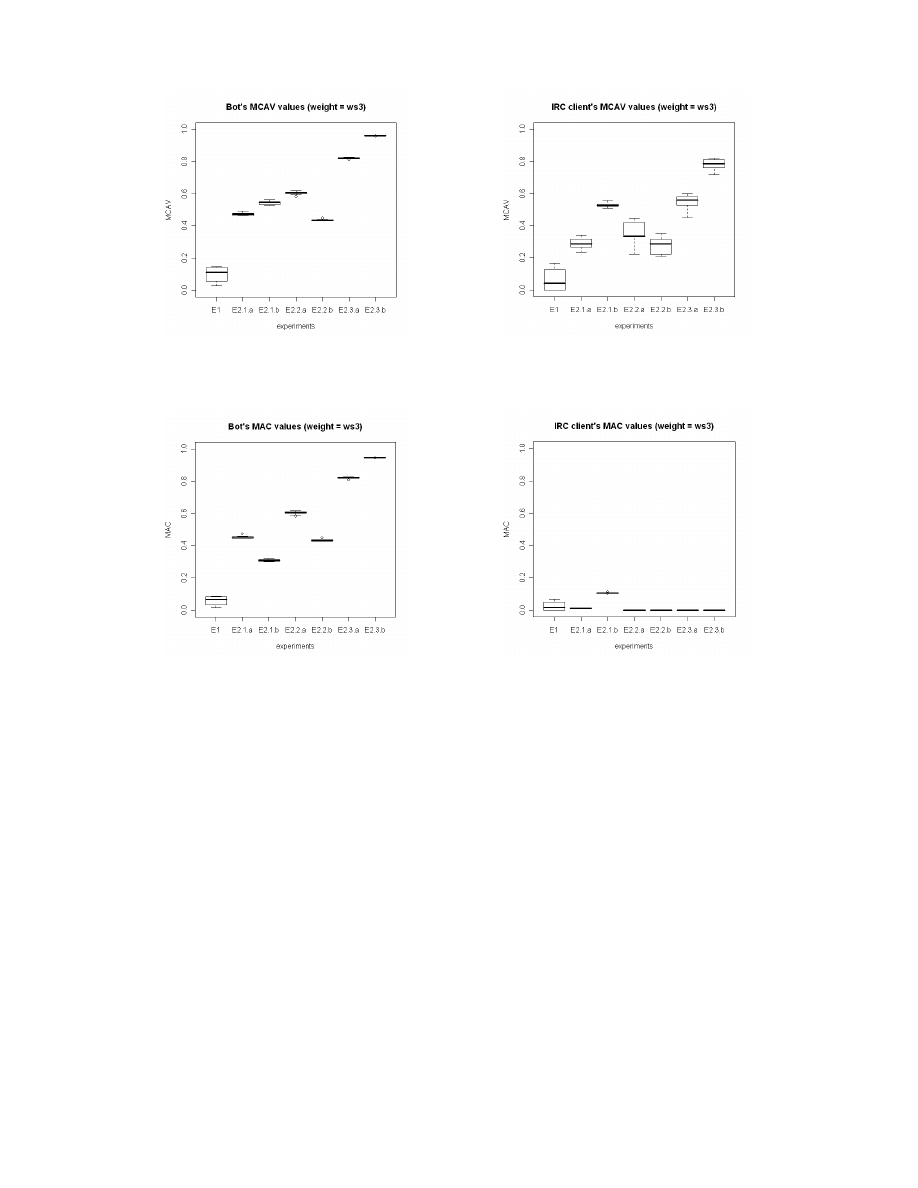
Significant differences are shown by the low p-values pre-
sented in Table III for experiments E2.1.a and E2.1.b for both
the MAC and MCAV coefficient values, where the sample
size is equal to ten. The differences are further pronounced
in the generation of the MAC values, further supporting
its use with the DCA. We can conclude therefore, that the
DCA can be used in the discrimination between normal and
bot-directed processes and that the DCA is successful in
detecting keylogging activities. This trend is also evident for
scenarios E2.2.a/b and E2.3.a/b, where the bot process MAC
and MCAV are consistently higher than those of the normal
processes, IRC and notepad inclusive. This information is
also displayed in Figures 1 and
2. This implies that in
addition to the detection of the bot itself the DCA can detect
the performance of outbound scanning activity - further
supporting the experiments performed in Greenmsith and
Aickelin [8]. Therefore the null hypothesis can be rejected as
in the majority of cases the DCA successfully discriminates
between normal and bot processes, with the exception of E1.
C. Null Hypothesis Three
Tables IV and V include the results of the sensitivity
analysis on the weight values for the bot process. The figures
presented are mean values taken across the ten runs per
session (E1-E2). An arbitrary threshold is applied at 0.5:
values above deem the process anomalous, and below as
normal. From these data, it is shown that changing the
weights used in the signal processing equation has some
influence on the performance of the system. For example, in
the case of session E2.1.a, weight set (WS) WS1 produces
a MAC value of 0.09 for the bot yet produces a value of
0.72 for WS5. This increase is likely to reduce the rate of
false negatives. To further explore these effects, the resultant
data are plotted as boxplots as the data are not normally
distributed. To assess the performance of the DCA as an
anomaly detector the results for the anomalous bot and the
normal IRC client are shown for the purpose of comparison.
For these boxplots, the central line represents the median
value, with the drawn boxes representing the interquartile
ranges.
In Figure 3 the median MCAV values are presented,
derived per session across the ten runs performed for each
WS (n=50). For the bot process, (Figure 3(a)) the MCAV is
low for session E1, in-line with previous results. For E1,
variation in the weights does not influence the detection
results, as this process has low activity and therefore does
not generate any great variation in the signals. Therefore,
without input variation, the output does not vary in response
to changing the manner in which the input is processed. This
is also evident in Figure 4(a) when using the MAC value.
(a) Bot’s MCAV value using weight set (WS3)
(b) IRC client’s MCAV value using weight set (WS3)
Fig. 1.
The MCAV values generated by DCA based on the weights described on Table I
(a) Bot’s MAC value using weight set (WS3)
(b) IRC client’s MAC value using weight set (WS3)
Fig. 2.
The MAC values generated by DCA based on the weights described on Table I
For all other sessions, much greater variation is observed
upon weight modification, as shown by the large interquartile
ranges produced for both MCAV and MAC values of the
bot processes. While the similar trends are shown across
the sessions in the MCAV of the IRC client, differences are
evident for the MAC value. In Figure 4(b) it is evident that
all sessions have low MACs for this process across all weight
sets. Therefore as the weights are modified, there is a greater
influence on the anomalous processes than on the normal
processes. Should the arbitrary threshold applied to the MAC
values be set at 0.2 as opposed to 0.5, then the performance
of the DCA on botnet detection is good, producing low rates
of false positives and high rates of true positives.
To further explore this effect, an alternative plotting is
presented in Figures 5 and 6. Here, each bar represents the
results for each WS, derived from the ten runs per session
(E1-E2 inclusive) totaling 70 runs per bar. As with Figures 3
and 4 some influence is shown through weight modification.
WS1 produced low MCAV and MAC values for both
processes. This indicates that these weights, used previously
with the DCA, are less suitable for this particular application.
WS2 shows little improvement when compared to WS1,
producing the lowest MCAV and MAC for the bot process.
WS3 shows an improved performance, producing much
higher MAC values for the bot process and very low values
for the IRC client. WS4 produced even higher values for the
bot process, whilst keeping the values low for the normal
IRC client process. WS5 also produced high MCAV and
MAC values for the bot, but the interquartile range of the
normal process increased. This suggests that as the ratio of
PAMP to safe signal weight for producing the mature output
signal must be sufficiently small to avoid false positives, and
sufficiently large to avoid potential false negatives.
Finally, to verify these findings statistically, each set of
results per session per weight are compared exhaustively
using the non-parametric Wilcoxon signed rank test. For each
test performed the resultant p-value is less than 0.001. This
allows us to conclude that modification of the weights has
a significant effect on the output of the DCA when applied
to this detection problem, and leads to the rejection of Null
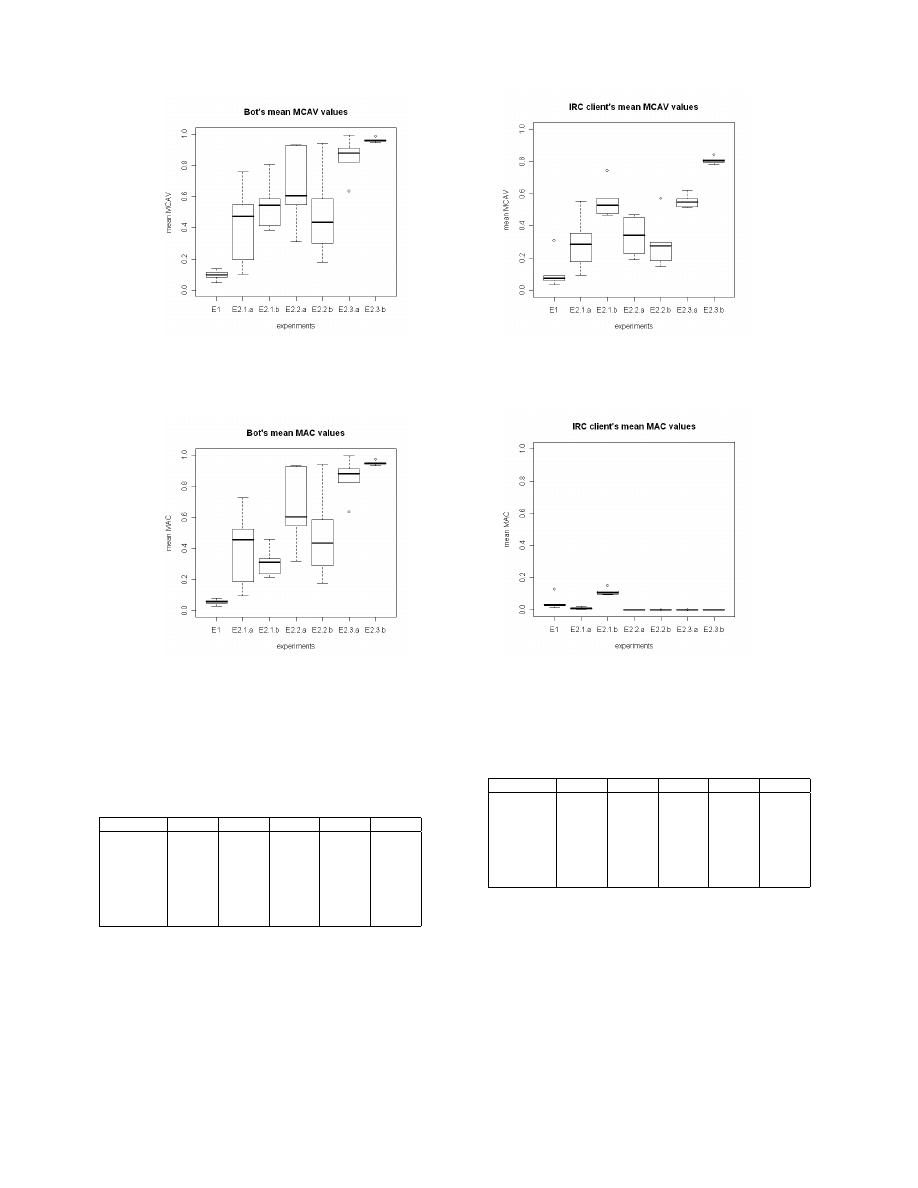
(a) Bot’s mean MCAV value
(b) IRC client’s mean MCAV value
Fig. 3.
The mean MCAV/MAC values generated by DCA using different signal weight values (WS1-WS5)
(a) Bot’s mean MAC value
(b) IRC client’s mean MAC value
Fig. 4.
The mean MCAV/MAC values generated by DCA using different signal weight values (WS1-WS5)
Hypothesis Three.
TABLE IV
W
EIGHT SENSITIVITY ANALYSIS FOR THE BOT
’
S
MCAV
VALUES
Expriment
WS1
WS2
WS3
WS4
WS5
E1
0.0484
0.0834
0.0978
0.1140
0.1377
E2.1.a
0.1030
0.1964
0.4736
0.5477
0.7595
E2.1.b
0.3823
0.4123
0.5440
0.5861
0.8032
E2.2.a
0.5488
0.3119
0.6047
0.9269
0.9319
E2.2.b
0.2995
0.1770
0.4360
0.5863
0.9427
E2.3.a
0.8802
0.6345
0.8218
0.9112
0.9955
E2.3.b
0.9553
0.9443
0.9598
0.9641
0.9873
VII. C
ONCLUSION AND
F
UTURE
W
ORK
In this paper, we have applied the DCA to the detection
of a single bot with three null hypotheses explored. It is
shown that the DCA is capable of discriminating between
bot and normal processes on a host machine. Additionally,
the incorporation of the MAC value has a positive effect on
the results, significantly reducing false positives. Finally, the
modification of the weights used in the signal processing
TABLE V
W
EIGHT SENSITIVITY ANALYSIS FOR THE BOT
’
S
MAC
VALUES
Expriment
WS1
WS2
WS3
WS4
WS5
E1
0.0288
0.0495
0.0578
0.0671
0.0810
E2.1.a
0.0947
0.1882
0.4543
0.5246
0.7274
E2.1.b
0.2168
0.2355
0.3098
0.3340
0.4572
E2.2.a
0.5479
0.3155
0.6038
0.9255
0.9305
E2.2.b
0.2886
0.1764
0.4345
0.5845
0.9395
E2.3.a
0.8798
0.6342
0.8214
0.9108
0.9949
E2.3.b
0.9418
0.9306
0.9461
0.9507
0.9726
component has a significant effect on the results of the
algorithm. It is concluded that appropriate weights for this
application include high values for the safe signal weight
which appears to be useful in the reduction of potential false
positives without generating false negative errors. We now
intend to apply the DCA to the detection of “peer-to-peer”
bots, which pose an interesting problem as the use of peer-
to-peer networks increases. In addition we aim to use the
results of these experiments to further our understanding
of the DCA, to ultimately enhance the performance of this
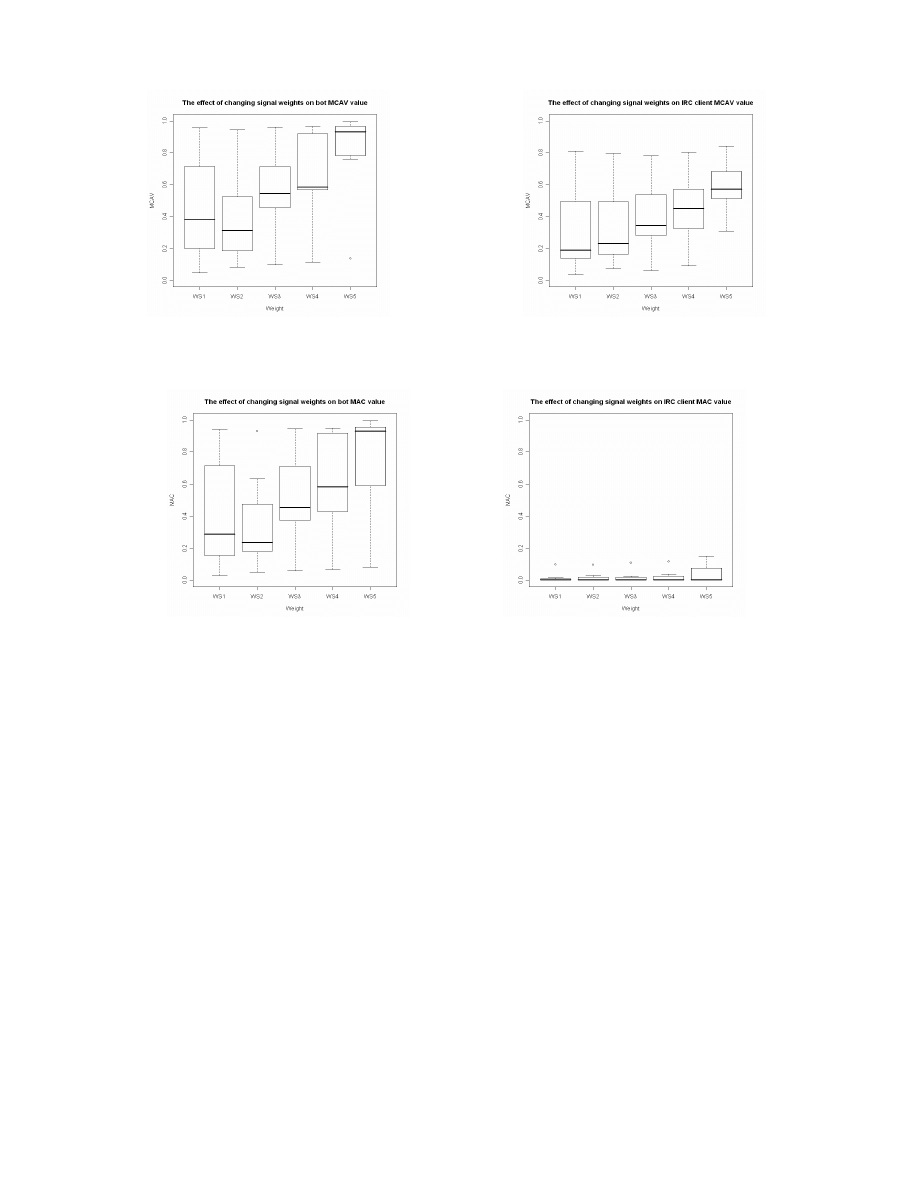
(a) Bot’s mean MCAV value
(b) IRC client’s MCAV value
Fig. 5.
Affect of changing signal weights of the MCAV values on DCA detection performance
(a) Bot’s MAC value
(b) IRC client’s MAC value
Fig. 6.
Affect of changing signal weights of the MAC values on DCA detection performance
immune-inspired detection algorithm.
A
CKNOWLEDGMENT
The authors would like to thank Etisalat College of
Engineering and Emirates Telecommunication Corporation
(ETISALAT), United Arab Emirates, for providing financial
support for this work.
R
EFERENCES
[1] P. Barford, and V. Yegneswaran, “An Inside Look at Botnets”, Special
Workshop on Malware Detection Advances in Information Security,
Springer Verlag, 2006.
[2] R. Bejtlich, “Extrusion Detection: Security Monitoring for Internal
Intrusions”, Addison-Wesley Professional, 2005.
[3] J. R. Binkley, and S. Singh, “An Algorithm for Anomaly-based Botnet
Detection”, Proceedings of USENIX Steps to Reducing Unwanted
Traffic on the Internet Workshop (SRUTI), July 2006, pp. 43–48
[4] E. Cooke, F. Jahanian and D. McPherson, “The Zombie Roundup:
Understanding, Detecting, and Disrupting Botnets”, In Proceedings
of Usenix Workshop on Stepts to Reducing Unwanted Traffic on the
Internet (SRUTI 05). Cambridge, MA, July 2005, pp. 39–44.
[5] F. C. Freiling, T. Holz and G. Wicherski, “Botnet Tracking: Exploring
a Root-Cause Methodology to Prevent Distributed Denial-of-Service
Attacks”, Technical Report AIB-2005-07, RWTH Aachen University,
April 2005.
[6] J. Geobel and T. Holz, “Rishi: Identify Bot Communicated Hosts by
IRC Nickname Evaluation”,
[7] J. Greensmith and U. Aickelin, “Dendritic Cells for SYN Scan
Detection”, Proceedings of the Genetic and Evolutionary Computation
Conference (GECCO 2007), pp. 49–56
[8] J. Greensmith, U. Aickelin and G. Tedesco, “Information Fusion for
Anomaly Detection with the Dendritic Cell Algorithm”, Accepted for
the Special Issue on Biologically Inspired Information Fusion; To be
appear in International Journal of Information Fusion, Elservier, 2007.
[9] J. Greensmith, “The Dendritic Cell Algorithm”, PhD Thesis, Univer-
sity of Nottingham, 2007.
[10] The Honeynet Project, “Know your enemy: Tracking botnets”, http:
//www.honeynet.org/papers/bots/
, March 2005.
[11] N. Ianelli and A. Hackworth, “Botnets as a Vehicle for Online Crime.
CERT Coordination Center”, 2005.
[12] IceChat - IRC Client: http://www.icechat.net/, Accessed on
10
t
h March 2008.
[13] C. Kalt, Internet Relay Chat: Architecture. Request for Comments:
RFC 2810, April 2000.
[14] M. Lutz and G. Schuler, “ Immature, semi-mature and fully mature
dendritic cells: which signals induce tolerance or immunity? ”, Trends
in Immunology, 23(9):9911045, 2002.
[15] S. Racine, “Analysis of Internet Relay Chat Usage by DDoS Zombies”,
Master’s Thesis. Swiss Federal Institute of Technology Zurich, April
2004.
[16] J. Twycross and U. Aickelin, Biological Inspiration for Artificial Im-
mune Systems, Proc. of the 6th International Conference on Artificial
Immune Systems, Santos/SP, Brazil, August 2007.
Wyszukiwarka
Podobne podstrony:
Are Evolutionary Rule Learning Algorithms Appropriate for Malware Detection
Solid phase microextraction for the detection of termite cut
On the Infeasibility of Modeling Polymorphic Shellcode for Signature Detection
Fileprint analysis for Malware Detection
Immune System for Virus Detection and Elimination
Using Spatio Temporal Information in API Calls with Machine Learning Algorithms for Malware Detectio
Limits of Static Analysis for Malware Detection
Development of a highthroughput yeast based assay for detection of metabolically activated genotoxin
A protocol for polymerase chain reaction detection of Enterococcus faecalis and Enterococcus faec
Magnetometer Systems for Explosive Ordnance Detection on Land
Classification of Packed Executables for Accurate Computer Virus Detection
Dime Detective Magazine 4411 C D for Corpus Delecti by Jul
SmartSiren Virus Detection and Alert for Smartphones
Intrusion Detection for Viruses and Worms
System and method for detecting malicious executable code
Computer Viruses The Disease, the Detection, and the Prescription for Protection Testimony
A Model for Detecting the Existence of Unknown Computer Viruses in Real Time
więcej podobnych podstron