
CREN
Ã
S
CENTRO RICERCHE
ECONOMICHE NORD SUD
Università di Cagliari
Università di Sassari
BANKING STRUCTURE AND REGIONAL ECONOMIC GROWTH:
LESSONS FROM ITALY
Stefano Usai
Marco Vannini
WORKING PAPERS
2 0 0 4 / 1 7
C O N T R I B U T I D I R I C E R C A C R E N O S
CUEC

Stefano Usai
Department of Economics and CRENoS, University of Cagliari
usai@uniss.it
Marco Vannini
Department of Economics and CRENoS, University of Sassari
vannini@uniss.it
BANKING STRUCTURE AND REGIONAL ECONOMIC
GROWTH: LESSONS FROM ITALY
Abstract
Following the literature on the comparative advantage of small versus large
banks at lending to small businesses, and in light of the worldwide decline in the
number of intermediaries that specialize in this type of lending associated with
deregulation in the banking industry, we examine the role that specific categories
of banks have played in the context of Italy’s regional economic growth. Over
the estimation period, 1970-1993, which ends in the year of full implementation
of the banking reform that introduced statutory de-specialization and branching
liberalization, Italy featured not only a substantial presence of SME’s in the real
sector, as is still the case, but also a large and heterogeneous set of credit
institutions with different ownership, size and lending styles. Exploiting these
peculiarities we study the role of specific intermediaries and gather indirect
evidence concerning the likely effects, ceteris paribus, of the current consolidation
processes. The main findings, stemming from panel regressions with fixed
effects, are as follows. The overall size of the financial sector has a weak impact
on growth, but some intermediaries are better than others: Co-operative banks
and Special credit institutions play a positive role, Banks of national interest
(basically large private banks) and Public law banks (government-owned banks)
either do not affect growth or have a negative influence depending on how
growth is measured. Co-operative banks were mostly small banks and Special
credit institutions were all but large conglomerates with standardized credit
policies, hence our results lend support to the current world-wide concerns of a
reduction in the availability of credit to SME’s resulting from consolidation and
regulatory reforms in the banking industry.
JEL classification: R11 R15 016
November 2004

2
1. Introduction
There are two distinct streams of literature related to our application.
The first is the large body of work on financial structure and economic
development originated by Goldsmith (1969), its follow-up within the
endogenous growth literature (see the surveys by Pagano, 1993, and
Levine, 1997, 2003). The second is a relatively smaller and scattered set
of contributions which investigate the relationship between various
dimensions of the banking firm (e.g. ownership, as in La Porta et. al.,
2002, or organisational structure, as in Berger and Udell, 2002) and its
lending behaviour.
As it is well known, Goldsmith (1969) provided considerable
evidence on the positive correlation between indicators of financial
development and the level of economic activity, but due to data
limitations and insufficient theoretical underpinning, was unable to lay
bare causal links and growth effects. This task has been carried out by
many scholars within the endogenous growth research programme, by
stressing the role of financial intermediaries in a world of imperfect
information
1
.
In an influential paper by Greenwood and Jovanovic (1990), for
instance, trading arrangements are costly to establish and technological
shocks have two components -aggregate and project specific- which
cannot be observed separately. Organisational structures, like financial
intermediaries, arise endogenously to facilitate trade in the economy:
“[T]hrough a research type process, intermediaries collect and analyse
information that allows investors’ resources to flow to their most
profitable uses. By investing through an intermediary, individuals gain
access, so to speak, to a wealth of experience of others” (p. 2). Thanks to
their large portfolios intermediaries can infer the aggregate productivity
shock and select the best technology relative to the current realisation of
the shock. Furthermore, by performing their traditional risk pooling
activities, they are able to offer individuals both a higher and safer return.
As the economy grows it becomes possible to implement costly financial
structures, which in turn promote growth by allowing a higher rate of
return to be earned on capital.
Bencivenga and Smith (1991), instead, derive new links from the
basics of banking, i.e. borrowing from and lending to large numbers of
agents, holding liquid reserves against withdrawal, matching maturities
and reducing the need for self-financing. By providing these services
optimally, the banking industry reduces the fraction of savings that

3
society has to hold in the form of unproductive liquid assets and
increases the rate of capital accumulation. If growth is modelled as an
endogenous process, this is going to affect positively the rate of
economic growth.
A direct mechanism was suggested by King and Levine (1993a,
1993b), who restated in a modern general equilibrium framework
Schumpeter’s idea that profit-seeking innovators are the main actors of
economic growth. Accordingly, financial institutions stimulate growth by
sorting and funding innovative entrepreneurial activities, i.e. by
accelerating the pace of technological change
2
.
These new insights have produced a large empirical literature. We
provide a short account of these applications in the next section. It is
worth stressing, however, that although most findings are broadly
consistent with the prediction that countries with better-developed
financial systems grow faster, they are still controversial and, what’s
more, provide little guidance to policymakers. As pointed out recently by
Zingales (2003), there are at least six weak links in the quest for a reliable
relation between finance and growth
3
. Our attempt here addresses
directly one of these, namely the limitations of measures of financial
development, and has the ambition of providing some clue to
policymakers for evaluating the present-day consolidation.
The second stream of literature relevant for our work focuses on two
closely related aspects: the interaction between lending styles and the
organisational structure of the banking firm; the influence of ownership
on bank behaviour.
Following Berger and Udell (2002) lending can be categorised into
four different technologies: financial statement lending, asset-based
lending, credit scoring and relationship lending. The first three
technologies, also known as transaction based lending, require as input
“’hard’ information that is relatively easily available at the time of loan
origination and does not rely on ‘soft’ data gathered over the course of a
relationship with the borrower”
4
(p. 36). On the contrary, under
relationship lending “the lender bases its decisions in substantial part on
proprietary information about the firm and its owner gathered through a
variety of contacts over time” (p. 37). A pivotal role within relationship
lending is played by the loan officer, who collects and provides to the
bank soft, hard to quantify information concerning the firm, its owner
and the local community. Clearly, this type of lending is worthwhile with
informationally opaque customers, like many small businesses. In any
event, in order to offer relationship lending, greater authority must be

4
delegated to the loan officer, with the twofold consequence of worsening
agency problems between the officer and the bank and creating the need
for an organisational structure capable of coping with them.
Viewing bank lending as the outcome of a hierarchy of contracting
problems in which the interaction between the loan officer and the small
business borrowers is just the first layer of contracting
5
, Berger and Udell
(2002) show that small organisations may do better than large
organisations in activities based on soft information. Several studies
confirm this prediction (see, in addition to the works referred to in the
paper, Berger et. al. 2002 and Cole et. al. 2004), hence we should expect
larger institutions to be less likely to make relationship loans.
As to the influence of ownership on bank behaviour, two recent
works need consideration here. La Porta et. al. (2002) investigate the
consequences for economic and financial development of government
ownership of banks according to two different perspectives, the
“development” view and the “political” view
6
. The former places
government ownership of banks within a broader plan for reaching
social objectives through government control of strategic economic
sectors. The latter emphasizes political objectives, i.e. the provision
through the control of enterprises (including banks) of employment,
subsidies and other benefits in exchange for votes and political support.
Both views imply greater pervasiveness of government ownership in
poorer countries or, more generally, countries with less well functioning
institutions. However, ceteris paribus, the development view imply that
government ownership of banks should benefit subsequent economic
development, whereas the political view imply a detrimental effect due to
crowding out of private firms. The empirical findings, using data from 92
countries around the world, support some elements of the development
view but are overall more favourable to the political view (p. 267).
Much in the same vein, Paola Sapienza (2002) considers three main
views of state-owned enterprises (social, agency and political) and tests
their validity by looking at the differences in the credit policies of both
privately owned and state-owned banks. The analysis, based on a unique
dataset on over 37,000 Italian firms, examines the interest rate charged to
similar companies (in terms of risk profile) by the two types of banks.
Overall, the results are supportive of the political view and suggest that
“state-owned banks serve as a mechanism to supply political patronage”
with “distorting effects on the financial allocations of resources” (p. 3).
In light of these intuitions it is evident that a large body of the current
empirical research on finance and growth, based on aggregate cross-

5
country measures, is neglecting an important trait of the financial
structure. Our contribution exploits the peculiarities of the Italian
context before the unification of the European financial market to fill
this gap. Using a panel approach we find that, irrespective of ownership,
large banks are, if anything, negatively correlated with growth, whereas
Co-operative banks and Special credit institutions do have a positive
influence.
The remainder of the paper is organized as follows. The next section
selectively discusses recent empirical work on finance and growth.
Section 3 documents the importance of SME’s for economic
performance across the main world economies and their dependence on
external finance provided by banks. Section 4 describes the Italian
context over the estimation period. Section 5 presents the methodology
and the main empirical findings. Section 6 concludes.
2. Empirical research on finance and growth
The growing body of empirical research on financial development and
economic growth has employed several econometric techniques, ranging
from pure cross-country regressions to microeconomic studies based on
the natural experiment approach. Here we limit the discussion to four
empirical investigations which have direct bearings with our study.
King and Levine (1993a,b) explores the linkages between finance and
growth using data on 80 countries from 1960 through 1989. They start
with a “base” regression in which the growth rate of real per capita GDP
depends on the logarithm of initial income, the logarithm of the initial
secondary school enrolment rate, and four indicators of the level of
financial sector development. These are intended to capture, respectively,
the overall size of the formal financial intermediary sector, the incidence
of those financial intermediaries which are more likely to provide the
services suggested by the theory, the extent to which total credit is
allocated to the private sector and the weight of this monetary aggregate
relative to GDP.
7
The cross-country evidence indicates a strong link
between financial indicators and long run growth. This result survives a
number of sensitivity checks, which include altering the conditioning set
of information, using different subperiods of time and subsamples of
countries. To overcome endogeneity problems, the authors also examine
the relationship between the values of the financial indicators at the start
of the period and subsequent economic growth (King and Levine,
1993a); in addition, using instrumental variable methods, they evaluate
whether the predictable component of financial indicators are

6
significantly related to growth (King and Levine, 1993b). Both
extensions of the analysis support the original finding that financial
indicators tend to be strongly associated with economic growth.
Along similar lines, De Gregorio and Guidotti (1995) include in the
basic specification of Barro (1991) a measure of financial development,
termed CREDIT, which corresponds to domestic credit to the private
sector as a fraction of GDP. The reason why other candidate indicators
are discarded is that one can easily envisage situations in which they
reflect financial underdevelopment rather than development
8
.They find
that per capita real output growth is positively and significantly
correlated with their preferred indicator of financial development, while
the remaining parameter estimates conform to previous works. This
result does not change if in the regression the average value of the
variable CREDIT over the estimation period is replaced by the same
variable measured at the beginning of the period (so as to circumvent
endogeneity problems). To explore the robustness of this result across
different stages of development, they also run the same regressions
across subsamples of countries, and find that CREDIT has an increasing
impact on growth as one moves from high-income to low-income
countries. Finally, they concentrate on the Latin American countries and
carry out estimations of the basic specification using panel data (pooled
cross-section averaged over six years period) with random effects.
Surprisingly, the impact of CREDIT is significantly negative, despite the
remaining parameters stand in line with earlier results. The suggested
interpretation of this finding is that “it may reflect the effects of
experiments of extreme liberalisation of financial markets followed by
their subsequent collapse” (De Gregorio and Guidotti, p. 443).
From a different perspective, Samolyk (1994) examines the empirical
relationship between banking conditions and regional economic growth
using state-level data for the US economy between 1983 and 1990. The
hypothesis, here, is that “the health of the regional financial sector (in
terms of the credit quality of local banks and nonbanks borrowers) can
influence investment activity and regional economic growth by affecting
a region’s ability to fund local projects” (Samolyk, 1994, p. 261). Thus, in
the basic empirical model, the relative state personal income growth is
regressed on its lagged values and a set of variables representing different
aspects of local credit conditions (like, for instance, the bank return on
assets (ROA) and the share of nonperforming loans). The results from
panel estimation are broadly consistent with the credit view hypothesis.
Further evidence in favour of the hypothesis is found by splitting the

7
sample, via interactive dummy variables, into low and high lagged-
income-growth groups, and testing whether there is a different
association between credit conditions and output.
Finally, we ought to mention two closely related papers by Levine,
Loayza and Beck (2000) and Beck, Levine and Loayza (2000) which use
panel techniques to study the relationship between financial intermediary
development and, respectively, growth and the sources of growth (i.e.
productivity of growth and physical capital accumulation). The measures
of financial intermediaries development included in the regressions are
LIQUID LIABILITIES (currency plus demand and interest-bearing
liabilities of banks and non banks financial institutions),
COMMERCIAL-CENTRAL BANK (commercial bank assets relative to
commercial bank plus central bank assets) and PRIVATE CREDIT
(credit issued by banks and other financial intermediary to the private
sector divided by GDP). These are meant to capture, respectively,
financial depth, the extent to which society’s savings are allocated by
private banks, and the size and quality of financial sector. To assess
robustness, various conditioning information sets are used. The overall
results indicate a positive relationship between the exogenous
component of financial development and both growth and the sources
of growth.
More recent investigations, in particular the massive effort carried out
at the World Bank by a number of researchers (see Demirgüç-Kunt and
Levine, 2001) working on a unique dataset on financial systems around
the world, have taken advantage of the quantity and quality of indicators
of financial structure now available in order to test for the influence of
both banks and stock markets. The indicators of financial institutions
used are richer than in earlier studies and not only distinguish among
central banks, deposit money banks and other financial institutions
(institutions that serve as financial intermediaries while not incurring
liabilities usable as means of payments) but also reflect activity and
efficiency of intermediaries. Due to their cross-country nature, however,
they are only able to capture the role of broad categories of
intermediaries (central banks, private banks, others).
In what follows we exploit the characteristics of our regional dataset
to address basically the same questions of the above investigations. We
adopt a full panel approach that allow for both economy-wide fixed
effects by year and region-specific fixed effects that might reflect
persistent differences across regions, such as initial conditions and

8
cultural differences. Unlike previous studies, we are able to introduce a
meaningful institutional breakdown among banking intermediaries.
3. Small businesses and small business credit
The importance of small businesses across the main world economies
can be immediately appreciated by looking at Table 1, which depicts the
size class structure and share of employment for non-primary sector
private enterprises in Europe-19
9
, USA and Japan. The vast majority of
enterprises are SMEs, with LSEs accounting for only 0,25% of all
enterprises. In Europe and Japan, SMEs provide a job for about two
thirds of the occupied persons, whereas in the U.S., where many micro
enterprises are sole proprietors, the employment shares of SMEs and
LSEs are pretty close.
Looking at the role of SMEs in Europe-19 through the indicators
presented in Table 2, it can be seen that SMEs export a lower share of
turnover and create a lower value added per occupied person than do
larger enterprises.
Tab. 1 – Private Enterprises in USA, Japan and Europe-19
SME
LSE
Micro Small
M-sized Total
Enterprises
USA, 2000
94
5
1
100
0
Japan, 2001
n/a
n/a
n/a
100
0
Europe-19, 2003
92
7
1
100
0
Employment
USA, 2000
22
15
12
49
51
Japan, 2001
n/a
n/a
n/a
67
33
Europe-19, 2003
39
17
13
70
30
Source: Estimated by EIM Business & Policy Research – Observatory of European
SMEs, 2003/7. Micro: less than 10 occupied persons; Small: between 10 and 50
occupied persons; Medium-sized enterprises: between 50 and 250 occupied
persons; LSE: 250 or more occupied persons.

9
As suggested in the Observatory Report (2003b, p. 26), the export
performance indicates that most small enterprises serve only limited local
and regional markets. The productivity gap instead can be influenced by
the distribution of enterprises across different sectors and by industry
structure. Indeed, when adjustments for differences in industry structure
are made “a rather different picture emerges, as the differences between
small, medium-sized and large enterprises to a large extent disappear;
only micro enterprises still lag behind with respect to value added per
occupied persons” (p. 26). This latter size-class dominates in 10
countries and reaches its lowest ratio of occupied person per enterprises
in Greece and Italy (2 and 4 respectively). Similar patterns can be
observed in the Acceding and Candidate Countries (ACC), but within
this group large differences exist between the Central and Eastern
European Countries and the Mediterranean Countries. The former tend
to have a larger enterprise size than the average of ACC and Europe-19;
the latter seem to conform to the structure of Southern EU countries (p.
33).
Turning now to the relationship between SMEs and banks, it is worth
stressing that the study of enterprises access to finance, unlike
demographic studies, has to rely on a wider and diverse range of sources.
Some basic facts, however, can be inferred from the BACH (Bank for
the Accounts of Companies Harmonised) database of the European
Commission and the ENSR Enterprise Survey 2002 (see Observatory
Report, 2003a). First, there is no clear link between the equity ratio
(equity as a percentage of total capital) and firm size, i.e. in some
countries the ratio of small enterprises is higher than in medium-sized
enterprises, and vice versa (Observatory Report, 2003a, p. 20)
10
. Second,
despite the presence of both bank-based financial systems (Germany,
Tab. 2 – Basic features of SME and LSE in Europe 19, 2003
SME
LSE
TOTAL
Micro Small M-sized Total
Number of enterprises
(,000)
17820
1260
180
19270
40 19310
Employment
(,000)
55040
24280
18100
97420
42300 139710
Occupied person per enterprise
3
19
98
5
1052 7
Turnover/n. of enterprises
(,000€)
440
3610
25680
890 319020 1550
Value added/n. of enterprises
(,000€)
120
1180
8860
280 126030 540
Exports/turnover
(%)
9
13
17
12
23 17
Value added/occupied persons
(,000€)
40
60
90
55
120 75
Labour costs/value added
(%)
57
57
55
56
47 52
Source: Observatory of European SMEs, SMEs in Europe 2003.

10
Austria, Italy) and market-based financial systems (United Kingdom), the
majority of European SMEs depend on bank financing and rely more
than large firms on this source of capital. Estimates provided by the
Group of Ten (2001) and partly based on BACH, concerning a subset of
EU countries (Belgium, France, Germany, Italy and Netherlands) plus
Canada, Japan and the U.S., indicate an average share of bank debt to
total debt for small enterprises of about 54% for EU countries, 53% for
Canada, 28% for Japan and 41% for the U.S. The average share of large
firms, not available for Canada and U.S., is obviously smaller but still
remarkable, equalling 33% both in Europe and Japan.
11
More insights into the importance of bank financing for SMEs can be
gained from the ENSR Enterprise Survey (see Observatory Report, p.22-
23). The majority of SMEs that have credit lines with banks interacts
with just one bank, and the credit amount is relatively small (less than
100,000 euro). The highest percentage of SMEs that concentrate all their
credit lines in one bank is found in Denmark (90%) and Norway (80%),
whereas in several southern European countries the percentage is
smaller. Indeed, according to our calculations based on the Survey of
Manufacturing Firms (SMF) by Mediocredito Centrale,
12
Italian firms
interact on average with 6 banks (see Table 3).
Tab. 3 – Relationships between enterprises and banks in Italy
Turnover (million of euros)
Whole sample
Below 5
From 5 to 50
Obs Mean Obs Mean Obs Mean
Number of banks
4445
6
2380
4.5
1687
8.0
Share of first bank on debt
3300
38%
1755
42.27%
1261
34.2%
First bank is in province
4339
65.1%
2335
68.5%
1641
62.2%
Years of relationship with first
bank
4279
16
2300
15.0
1622
17.4
Need more credit
4440
13.7%
2374
15.5%
1685
12.6%
Wish to pay higher interest
rate
4437
5.0%
2370
5.6%
1686
4.9%
Applied for credit but it has
been denied
4440
3.6%
2373
4.0%
1685
3.2%
Firms employing innovative
financial instruments
4487
3.8%
2395
2.2%
1706
5.3%
Source: Mediocredito Centrale - Survey of Manufacturing Firms (SFM), 1998.
11
For the vast majority of firms the first bank in the pool is located in the
province and the relationship between the firm and the first bank lasts
on average more than 15 years. Also, the share of the first bank on debt
ranges from 42% to 34%.
Differences in the relationship between banks and enterprises by
country might be explained by a host of factors (e.g. tax system, financial
system, legal framework, business culture) which cannot be studied
further here. It is apparent however that SMEs depend on banks and
that such dependence, though not expected to change dramatically in
the near future, might nevertheless evolve in tandem with the
transformations of the banking industry. Today, regulatory reforms and
consolidation of financial institutions are the overriding features of the
world financial landscape. Both phenomena may result in restricted
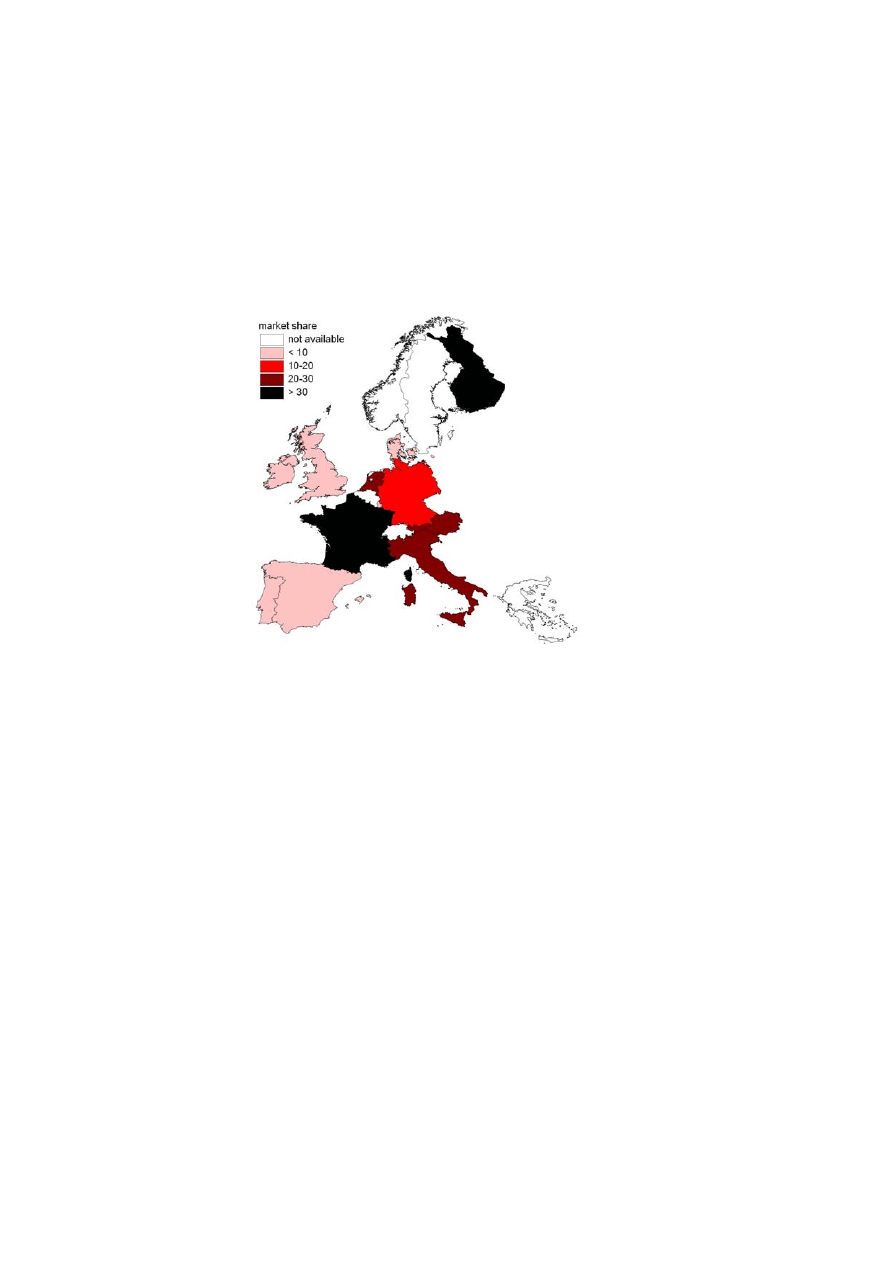
Figure 1 – Market Sares of Cooperative banks, Europe 15, 2001
Source: European Association of Co-operative Banks, Activity Report, 2000-2002

12
credit availability to SMEs due to the decline in the number of
intermediaries that traditionally specialise in small business lending. As
shown in Figure 1, the latter still have significant market shares in many
European countries
13
.
Before the completion of the EU, Italy featured a variety of banking
institutions, its stock market was rather modest and the economic
growth of its regions was driven by SMEs. Which bank type, if any, had
a positive impact?
4. Italy’s credit markets
Some characteristics of Italy are well-known: the leading role of SMEs in
promoting growth, the uneven pattern of regional economic
development, the persistence of the North-South divide. Others, like the
presence of over 1,000 banks scattered throughout the country, the
segmentation of the banking markets along regional lines, and the
heterogeneity of intermediaries -by size, ownership and range of services
supplied- are less well-known. The role of national and regional financial
institutions has been a recurring issue in both the political and academic
debate and has prompted a large literature. In this section we limit the
presentation to the salient features of the banking system with an eye to
the subsequent empirical analysis.
Despite the important transformations that took place in the 1980’s -
mostly associated with the construction of the European economic and
monetary union- and that culminated in the 1993 “Testo Unico in
materia bancaria e creditizia”
14
, until recently the Italian banking system
was regulated by the 1936 “Legge Bancaria”. This act, adopted soon after
the financial crisis of the 1930’s, achieved three important goals: (i) it
gave the Bank of Italy the status and functions of Central Bank, (ii) it
created a government body for the supervision of the banking system,
with wide discretionary powers that in 1947 were transferred to the Bank
of Italy, (iii) it established the two basic classes of banking intermediaries
that could operate in the country, i.e. “Aziende di credito” (or simply
banks) and “Istituti di credito speciale” (special credit institutions). The
former were allowed to carry out all standard banking operations and to
provide only short-term (up to eighteen months) credit. The latter could
provide medium- and long term credit but could not issue short term
liabilities
15
. As of December 1990 assets and loans by banks amounted
respectively to 76.8% and 63.2% of the total. Therefore banks play a
prominent role in the intermediation industry and, given the thinness of
the stock market, in the whole financial system
16
.

13
Table 4 summarises information on the number of banks in the various
categories and their market shares at the end of 1990. Contrasting this
data with those of any major Western country, one might get the
impression of a somewhat overbanked and underbranched
configuration. As a matter of fact, this was truly the case before the
recent wave of reforms: supervision authorities would systematically put
stability before competition and both government interferences in the
management of major banks and obsolete legislation would reduce
incentives for mergers and acquisition among intermediaries. Indeed, the
modernisation process prompted by the Bank of Italy in the 1980’s was
triggered by the urge to boost the capital structure of banks, especially of
the State-owned ones, and to foster their entrepreneurial nature relative
to European rivals.
table 4. Credit banks in Italy (1990)
Banks
Branches
Total
Domestic
Domestic
assets (%)
customer
customer
loans (%)
deposits (%)
Public law banks
6
2449
20.1
19.4
19.2
Banks of national interest
3
1459
14.4
14.0
10.6
Ordinary credit banks
106
3981
23.2
25.6
23.9
Cooperative banks
108
3290
15.0
15.3
17.2
Savings banks
75
4498
24.4
23.7
28.4
Rural and craftsmen's banks
715
1792
0.4
0.4
0.6
Central credit institutions
5
5
2.5
1.1
0.1
Total
1018
17474
100.0
100.0
100.0
Source: Bank of Italy
For a long time these different categories of intermediaries have played
quite distinct roles. Some of them, in particular, have revealed a strong
propensity to long-term lending relationships with small businesses
within the local markets. This is certainly the case for the “Cooperative
banks” (CB) and the “Rural and craftsmen’s banks” (RCB), which have
pursued consistently these goals across time and space
17
. Today some of
these banks rank among the largest Italian banks, but they are generally
smaller banks and “their geographical competence is still largely
restricted to the regions of origin (although nowadays, this is not caused
by regulation constraints)”(Commission of the European Communities, 1993,
p. 151). It is unclear whether they will survive the ongoing process of
financial liberalisation. For our purposes, however, what matters is their
historical role of credit providers for information-intensive borrowers,

14
i.e. of good empirical counterpart for the kind of intermediary
specialising in relationship lending.
To complete this outline of the Italian financial context we ought to
mention two more things, namely the financial backwardness of
Southern regions and the segmentation of banking markets along
regional lines.
As to the first question, that was hotly debated and that received a
prominent part in the 1988 Annual Report of the Bank of Italy, there is no
doubt that a financial issue existed (and still exists) in Southern regions:
“with respect to the rest of the country there are important differences
regarding both the thinness and the competitiveness of markets, the
efficiency of intermediaries, the cost and quality of credit provided"
(Galli and Onado, 1990, p. 2). However, this financial backwardness of
Southern regions might reflect both qualitative differences in the
behaviour of customers and inefficiencies by banks.
Over the sample period, households in the South held around 17% of
their savings at the Post Office
18
, despite the fact that returns and
services were often dominated by those attached to bank deposits. On
the contrary, in the North only 7% of household savings were held at the
Post Office, and a significant fraction was invested in treasury bills
(BOT, CCT, BPT). Firms in the South would not exploit the array of
financial instruments alternative to standard loans, even classical financial
instruments such as leasing and factoring. They depended heavily on
bank loans, especially of government subsidised loans.

15
table 5. Credit market structural indicators
GDP per branch
Branches per capita
Employee per branch
(millions of lire)
(10,000 inhab.)
North
70-72
47.97
2.38
82-84
58.86
2.69
49.67
90-92
48.92
4.03
51.50
South
70-72
53.87
1.34
82-84
63.34
1.51
24.58
90-92
52.43
2.21
26.29
North/South
70-72
0.89
1.78
82-84
0.93
1.78
2.02
90-92
0.93
1.83
1.96
Source: Authors' calculations on Bank of Italy data
table 6. Regional concentration index (top five banks loans over total loans)
83-85
92-94
var % 83-94
Piemonte-Val D'Aosta
0.52
0.53
1.9
Lombardia
0.31
0.32
3.2
Trentino Alto Adige
0.47
0.43
-8.5
Veneto
0.47
0.43
-8.5
Friuli Venezia Giulia
0.49
0.40
-18.4
Liguria
0.55
0.50
-9.1
Emilia Romagna
0.37
0.38
2.7
Toscana
0.61
0.50
-18.0
Umbria
0.62
0.53
-14.5
Marche
0.51
0.42
-17.6
Lazio
0.48
0.53
10.4
Abruzzi
0.61
0.45
-26.2
Molise
0.95
0.75
-21.1
Campania
0.53
0.56
5.7
Puglia
0.44
0.42
-4.5
Basilicata
0.80
0.78
-2.5
Calabria
0.79
0.72
-8.9
Sicilia
0.64
0.60
-6.3
Sardegna
0.85
0.82
-3.5
Source: Authors' calculations on Bank of Italy data

16
Tables 5 to 7 below provide a number of indicators of the spatial
features of the banking market. The structural and dimensional measures
reported in Table 5 show that while the ratio of GDP to branches is
rather steady and very close to one (it was 0.89 in the seventies and it has
been equal to 0.93 since the eighties), the number of branches for 10,000
of the population in the North is twice as much as in the South.
Moreover, despite the increase of this index both in the North and in the
South
19
, the gap between the two macro-regions, instead of decreasing,
has slightly widened. As for the level of competition, Table 6 shows the
concentration ratio (top five banks loans to total loans) by regions (there
are 19 regions because data about Valle d’Aosta and Piemonte are not
separately available) in the early 1980’s and 1990’s. This index has many
limitations
20
, nonetheless it provides a clear idea of the degree of
oligopoly at the regional level over the sample period. The concentration
index is higher in the South than in the North and, with the exception of
Abruzzo and Puglia, suggests tight oligopoly in the former area and of
loose oligopoly in the latter. Over the period the levels of concentration
have generally decreased (Lazio being the only case of serious increase in
the concentration ratio, from 0.48 in the early eighties to 0.53 in the
nineties), as a result both the gap between the two macro-areas and the
interregional variability of the indicator have slightly declined, but
substantial differences still existed at the end of the period, with the
concentration index equalling 0.35 in Lombardia and 0.82 in Sardinia.
table 7. Credit market efficiency in Italy
loans/deposits loans per employee
loans and deposits
value added
value added
(millions of lire)
per employee
per branch
per employee
(millions of lire)
(millions of lire)
(millions of lire)
North
70-72
0.65
82-84
0.55
1200.37
3898.39
268.82
14.61
90-92
0.80
1829.78
4978.93
254.88
19.92
South
70-72
0.62
82-84
0.44
816.93
3254.25
182.61
11.24
90-92
0.61
1233.24
4053.29
187.09
15.66
North/South
70-72
1.06
82-84
1.26
1.47
1.20
1.47
1.30
90-92
1.33
1.48
1.23
1.36
1.27
Source: Authors' calculations on Bank of Italy data

17
Finally, let us examine the efficiency measures for the two macro-
regions in selected sub-periods since 1970 (Table 7). Again, value added
per branch or per employee is much higher in the North than in the
South. The two additional rough measures of market efficiency (or
labour productivity) considered, i.e. the ratio of deposits plus loans, and
loans alone, on the number of employees, increase overtime, but the
regional gap tends to widen, rising worries about the effects of the
deregulation process. Similarly, the loan to deposit ratio, which was
almost the same in the two macro-regions in the 1970’s, becomes 30%
higher in the North than in the South towards the end of the period.
Additional insights on the credit market conditions of the two areas
can be gained by looking at the interest rate differential. The interest rate
in the Mezzogiorno is constantly a few points above the interest rate in
the North. Although a substantial part of the observed gap is accounted
for by differences in risk conditions
21
, extensive research on this issue
has made clear that a significant part can also be attributed to other
factors, mostly related to lack of competition among banks
22
.
In the post-sample decade Italy’s financial market has changed
significantly. The stock market has grown larger and so has the number
of listed companies. The banking industry has seen the privatisation of
former government-owned banks (though this has happened fully in the
juridical for rather than in the governance of institutions), and a massive
process of mergers and acquisition has taken place.
Table 8 – Italian banking system merger and acquisition activity (1993-2002)
Merger and acquisition
Majority acquisition
No of banks
No of deals
Total assets
No of
deals
Total
assets
year
BCC BCC BCC
1993
1.029 667 38
25
0.63
0.05
6
1.50
1994
994 643 42
25
1.59
0.05
10
1.90
1995
970 619 47
28
1.57
0.10
19
4.50
1996
937 591 37
25
0.47
0.05
19
1.08
1997
935 583 24
12
0.80
0.05
18
3.42
1998
921 562 27
18
2.65
0.08
23
11.02
1999
876 531 36
23
0.39
0.06
28
14.35
2000
841 499 33
22
1.50
0.09
24
4.86
2001
830 474 31
21
0.08
0.06
9
1.55
2002
814 461 18
16
0.06
0.05
11
4.94
Total
333
215
9.67
167
36.79
*At the end of the year before the deal and relative to total assets of the system
Source: Bank of Italy, Annual Report for the year 2002

18
This activity (see Table 8) has involved a large number of Co-operative
Credit Banks. It goes without saying that this doesn’t necessarily imply a
worsening of credit opportunities for SMEs, but due to the strong ties of
BCC with small business it is certainly a matter of concern that calls for
careful investigations.
5. Empirical analysis
5.1. Market segmentation
The study of economic growth using regional-level data makes sense
only if local markets are not fully integrated. So, as a preliminary, we
tested for market segmentation. Instead of the standard inspection of the
interest rate differentials between locations, which can exist and persist
simply because of higher risk, uncertainty and transaction cost, we
applied a straightforward test -widely used by economic historians to
study the integration of capital markets (Odell, 1989)- which focuses on
the time profile of interest rates across different geographical areas. For,
in integrated markets, marginal movements in the interest rates of
different regions should be alike. Accordingly, we estimate the following
equation
log r
i
= a + b log r
j
where r
i
and r
j
are the interest rates in region i and j respectively. Basically
this specification relates the demand and supply in two different markets,
captured by the corresponding interest rates:”[I]n a world of perfectly
integrated markets, equal transaction costs, uncertainty and risk premia,
and speedy transmission of local shocks, the constant term a would equal
zero (no interest differential) and the coefficient b would equal one
(movements in the hinterland rate would not differ significantly from
movements in the centre rate)“ (Odell, 1989, p. 304).

19
We run the above regression using every possible combination of 2
regions. The results for the intercepts and the slopes, with benchmark
regions listed by columns
23
, are reported in
Table X
. As the data
reported in these tables indicate, the intercepts of Southern regions with
respect to Northern regions as benchmarks are always much greater than
zero (only in 5 cases out of 96 the constant is not significantly different
from zero); whereas the corresponding slopes are all less than unity (only
in 13 cases out of 96 we cannot reject the hypothesis that the coefficient
is equal one). The regression evidence, therefore, indicates the existence
of significant fixed interregional price gaps, related to regional capital
market peculiarities, such as different operating costs and/or disparities
in risk levels. Moreover, marginal movements in the interest rates do not
generally correspond (estimated slopes are different from one), indicating
that capital mobility between regions is far from perfect.
Instances of integration can be found only within the two macro-
areas. Furthermore, if integration is measured against the two central
financial locations of Rome and Milan (proxied, respectively, by the
interest rates of Lazio and Lombardia), then most regional markets
appears to be isolated, confirming the idea of an imperfectly integrated
national capital market.
These findings are consistent with the historical evidence indicating
the existence of a dualistic financial structure, with weak price linkages
between local and central financial districts, and significant instances of
integration only between regions belonging to the same macro-area.
They also imply that Italy can be an interesting country in which to study
the interplay between finance and growth., provided that spillover effects
among neighbouring regions within the two macro-areas are controlled
for in the empirical analysis.

20
Table 9. Integration indexes (intercepts)
PIE
VDA
LOM
TAA
VEN
FVG
LIG
EMR
TOS
UMB
MAR
LAZ
ABR
MOL
CAM
PUG
BAS
CAL
SIC
SAR
PIE
0.10
*
-0.01
0.08
*
0.04
*
-0.01
-0.05
*
0.01
0.03
0.01
0.03
-0.02
0.12
*
0.17
*
0.15
*
0.17
*
0.17
*
0.21
*
0.23
*
0.26
*
VDA
-0.09
*
-0.10
*
0.00
-0.05
-0.10
*
-0.14
*
-0.08
*
-0.06
-0.08
*
-0.07
-0.11
*
0.03
0.09
*
0.06
*
0.08
*
0.07
0.12
*
0.14
*
0.19
*
LOM
0.02
0.11
*
0.09
*
0.06
*
0.01
-0.04
*
0.03
0.05
0.03
0.04
-0.01
0.14
*
0.19
*
0.16
*
0.19
*
0.19
*
0.23
*
0.24
*
0.28
*
TAA
-0.07
*
0.03
-0.09
*
-0.04
*
-0.08
*
-0.13
*
-0.07
*
-0.04
-0.06
-0.05
-0.10
*
0.05
0.10
*
0.08
*
0.10
*
0.10
0.15
*
0.16
*
0.21
*
VEN
-0.03
0.06
*
-0.05
*
0.04
*
-0.05
*
-0.09
*
-0.03
0.00
-0.03
-0.02
-0.06
*
0.08
0.14
*
0.11
*
0.13
*
0.13
*
0.18
*
0.19
*
0.23
*
FVG
0.01
0.11
*
0.00
0.09
*
0.05
*
-0.04
*
0.02
0.04
0.02
0.04
-0.02
0.13
*
0.18
*
0.16
*
0.18
*
0.18
*
0.22
*
0.24
*
0.27
*
LIG
0.05
*
0.15
*
0.04
*
0.13
*
0.09
*
0.04
*
0.07
*
0.08
*
0.06
*
0.08
0.03
0.17
*
0.22
*
0.19
*
0.22
*
0.22
*
0.26
*
0.27
*
0.30
*
EMR
0.00
0.09
*
-0.02
0.07
*
0.03
-0.01
-0.05
0.02
0.00
0.01
-0.03
0.11
*
0.17
*
0.14
*
0.16
*
0.16
*
0.20
*
0.22
*
0.26
*
TOS
-0.02
0.08
*
-0.03
0.06
0.02
-0.03
-0.07
*
-0.01
-0.02
-0.01
-0.05
*
0.09
*
0.15
*
0.12
*
0.15
*
0.15
*
0.18
*
0.21
*
0.23
*
UMB
0.00
0.09
*
-0.02
0.08
*
0.04
-0.01
-0.05
0.01
0.02
0.01
-0.03
0.11
*
0.17
*
0.14
*
0.17
*
0.16
*
0.20
*
0.22
*
0.26
*
MAR
0.02
0.11
*
0.01
0.09
*
0.05
0.01
-0.02
0.02
0.03
0.02
-0.01
0.10
*
0.18
*
0.15
*
0.18
*
0.17
*
0.20
*
0.23
*
0.26
*
LAZ
0.04
0.14
*
0.02
0.11
*
0.08
*
0.02
-0.02
0.05
0.06
*
0.04
0.05
0.15
*
0.21
*
0.17
*
0.20
*
0.20
*
0.24
*
0.26
*
0.28
*
ABR
-0.08
0.01
-0.09
0.00
-0.05
-0.09
-0.13
*
-0.08
-0.06
-0.08
-0.10
*
-0.12
*
0.09
0.05
0.08
*
0.06
0.11
*
0.14
*
0.19
*
MOL
-0.16
*
-0.06
-0.18
*
-0.08
-0.12
*
-0.17
*
-0.22
*
-0.15
*
-0.13
*
-0.14
*
-0.14
*
-0.18
*
-0.04
-0.01
0.02
0.01
0.07
0.08
0.14
*
CAM
-0.14
*
-0.05
-0.16
*
-0.05
-0.10
*
-0.15
*
-0.20
*
-0.13
*
-0.12
*
-0.14
*
-0.13
*
-0.18
*
-0.03
0.03
0.04
0.02
0.07
*
0.10
*
0.14
*
PUG
-0.17
*
-0.08
*
-0.19
*
-0.09
*
-0.14
*
-0.19
*
-0.23
*
-0.17
*
-0.14
*
-0.17
*
-0.16
*
-0.21
*
-0.06
0.01
-0.02
-0.01
0.05
0.06
*
0.12
BAS
-0.13
*
-0.05
-0.15
*
-0.05
-0.10
-0.14
*
-0.19
*
-0.13
*
-0.11
-0.13
*
-0.13
*
-0.17
*
-0.04
0.04
0.00
0.03
0.07
0.10
*
0.15
*
CAL
-0.20
*
-0.10
*
-0.21
*
-0.11
*
-0.16
*
-0.21
*
-0.26
*
-0.20
*
-0.18
*
-0.20
*
-0.21
*
-0.24
*
-0.10
*
-0.01
-0.05
-0.02
-0.04
0.04
0.08
SIC
-0.23
*
-0.14
*
-0.25
*
-0.15
*
-0.19
*
-0.24
*
-0.29
*
-0.23
*
-0.20
*
-0.23
*
-0.23
*
-0.26
*
-0.12
*
-0.05
-0.08
*
-0.05
-0.06
-0.01
0.06
SAR
-0.24
*
-0.13
-0.26
*
-0.14
-0.19
*
-0.26
*
-0.30
*
-0.23
*
-0.22
*
-0.23
*
-0.23
*
-0.28
*
-0.11
-0.04
-0.08
-0.04
-0.06
-0.03
0.01
*: significantly different from zero at the 5% level.

21
Table 10. Integration indexes (slopes)
PIE
VDA
LOM
TAA
VEN
FVG
LIG
EMR
TOS
UMB
MAR
LAZ
ABR
MOL
CAM
PUG
BAS
CAL
SIC
SAR
PIE
0.94
*
1.01
0.94
0.98
1.01
1.05
*
0.99
0.99
1.00
0.99
1.02
0.93
0.90
*
0.92
*
0.90
*
0.91
*
0.88
*
0.86
*
0.80
*
VDA
1.05
1.06
0.99
*
1.02
1.06
1.09
*
1.04
1.03
1.05
1.04
1.07
0.98
0.95
0.97
0.95
*
0.97
0.93
*
0.91
*
0.84
*
LOM
0.99
0.93
*
0.93
0.97
*
1.00
1.03
*
0.98
0.97
0.99
0.98
1.01
0.92
*
0.89
*
0.90
*
0.89
*
0.90
*
0.87
*
0.85
*
0.79
*
TAA
1.05
0.99
1.06
*
1.03
*
1.07
*
1.10
*
1.05
*
1.04
1.05
1.05
1.08
*
0.98
0.95
0.96
0.95
*
0.96
0.92
*
0.91
*
0.84
*
VEN
1.02
0.96
1.03
*
0.97
*
1.03
*
1.06
*
1.02
1.01
1.02
1.01
1.04
0.95
0.92
*
0.94
*
0.92
*
0.94
0.90
*
0.88
*
0.81
*
FVG
0.98
0.93
*
1.00
0.93
*
0.96
*
1.03
*
0.98
0.97
0.99
0.97
1.01
0.91
*
0.89
*
0.90
*
0.88
*
0.90
*
0.86
*
0.85
*
0.79
*
LIG
0.95
*
0.90
*
0.96
*
0.90
*
0.93
*
0.97
*
0.95
*
0.94
*
0.95
*
0.94
0.98
0.88
*
0.86
*
0.87
*
0.85
*
0.87
*
0.83
*
0.82
*
0.76
*
EMR
1.00
0.95
*
1.01
0.95
*
0.98
1.01
1.04
0.99
1.00
1.00
1.02
0.94
0.90
*
0.92
*
0.90
*
0.92
*
0.88
*
0.87
*
0.80
*
TOS
1.00
0.95
1.01
0.95
*
0.98
1.02
1.05
1.00
1.01
1.01
1.03
0.94
0.90
*
0.92
*
0.90
*
0.92
*
0.89
*
0.87
*
0.81
*
UMB
0.99
0.94
*
1.00
0.93
0.97
1.00
1.03
0.99
0.98
0.99
1.02
0.93
*
0.89
*
0.91
*
0.89
*
0.91
*
0.88
*
0.86
*
0.79
*
MAR
0.97
0.93
*
0.98
0.92
*
0.96
0.98
1.01
0.98
0.97
0.99
1.00
0.93
*
0.88
*
0.90
*
0.88
*
0.91
*
0.88
*
0.85
*
0.79
*
LAZ
0.97
0.91
*
0.98
0.91
*
0.95
*
0.98
1.01
0.96
0.96
*
0.97
0.96
0.90
*
0.87
*
0.89
*
0.87
*
0.89
*
0.85
*
0.83
*
0.78
*
ABR
1.03
0.99
1.04
0.98
*
1.02
1.05
1.08
1.04
1.03
1.05
1.06
*
1.07
0.94
0.96
0.94
*
0.97
0.93
*
0.91
*
0.83
*
MOL
1.08
*
1.03
1.10
*
1.03
1.06
1.10
*
1.13
*
1.08
*
1.07
1.08
1.08
1.11
*
1.02
1.00
0.98
1.00
0.95
0.94
0.86
*
CAM
1.08
*
1.03
1.09
*
1.02
1.05
*
1.09
*
1.13
*
1.07
*
1.07
*
1.09
*
1.08
*
1.11
*
1.02
0.98
0.97
1.00
0.96
0.94
*
0.87
*
PUG
1.10
*
1.05
*
1.11
*
1.04
1.08
*
1.12
*
1.15
*
1.10
*
1.09
*
1.11
*
1.10
*
1.13
*
1.04
1.00
1.02
1.02
0.98
0.96
0.88
*
BAS
1.05
1.01
1.06
1.00
1.03
1.07
1.10
1.05
1.04
1.06
1.06
1.08
1.01
0.96
0.98
0.96
0.94
0.92
*
0.84
*
CAL
1.11
*
1.06
1.12
*
1.05
1.08
*
1.12
*
1.15
*
1.11
*
1.11
*
1.12
*
1.13
*
1.14
*
1.06
*
1.00
1.03
1.00
1.03
0.97
0.90
*
SIC
1.14
*
1.09
*
1.15
*
1.08
1.12
*
1.15
*
1.19
*
1.14
*
1.12
*
1.14
*
1.14
*
1.16
*
1.07
1.03
1.05
1.03
1.05
1.01
0.92
SAR
1.18
*
1.11
1.19
*
1.11
*
1.15
*
1.20
*
1.23
*
1.17
*
1.18
*
1.18
*
1.18
*
1.21
*
1.10
1.06
1.09
1.06
1.08
1.06
1.03
*: significantly different from unity at the 5% level.

22
5.2 Some estimation issues
Regional economic growth can be effectively proxied either by the
growth rate of gross domestic product per capita or by the growth rate
of regional value added per worker. We use both indicators for two
reasons. First, because they are not perfect substitutes (the former is an
imperfect measure of welfare whereas the latter is a measure of
productivity); second, because this allows us to test for the robustness of
results with respect to the proxy for economic growth.
Unfortunately, both rates are likely to be affected by the national
business cycle. Therefore, in order to focus on genuine regional growth,
it is essential to get rid of this component. In what follows, this is
achieved by including time fixed effects, which control for idiosyncratic
year effects due not only to the interregional business cycle but also to
other unobserved institutional changes through time
24
.

23
To begin with, we run a “base” regression featuring the level of
economic growth in the starting period
25
, human capital, proxied by the
secondary school enrolment rate, and government consumption. This
formulation controls for the main economic phenomena which
according to available evidence (Di Liberto, 1994) are robustly associated
with growth and which are at work at the regional level. We extended
this “base” conditioning set by including several measures of regional
financial development and, in particular, of credit markets. As far as the
aggregate level of financial intermediation is concerned, we considered
various measures of both the banking product relative to regional GDP
(such as deposits, loans and deposits plus loans) and its spatial coverage
(branches per inhabitants, or per GDP, by region). All such variables
prove weakly and unrobustly related to economic growth. Next, we
introduce our institutional breakdown. We consider four types of
intermediaries: Banks of National Interest, Co-operative and rural banks,
Special Credit Institutions and Public Law Banks. As discussed in the
previous sections, historically Co-operative banks have provided credit
to small entrepreneurs operating within local markets, and they still play
this role, despite the fact that some of them grew very large and have
attracted among their clients even major industrial corporations. The
Banks of national interest (private banks) and the Public law banks
(government-owned banks), on the other hand, are large geographically
diversified banks with, in few cases, a significant international presence.
Both should be better equipped to support local economies thanks to
more opportunities for cross-subsidisation and to economy of scale and
scopes. Finally, the special credit institutions -that disappeared as a
separate category after the recent banking reform- during the sample
period were the main institutions specialised in medium and long term
lending to private and public companies. They were not allowed to
collect savings directly from depositors and were controlled, directly or
indirectly, by the government. Most of public “subsidised credit” to
private firms, in the form of interest rate reductions and capital grants,
has been channelled through these institutions. It goes without saying
that there are other intermediaries that play the function of screening and
funding local projects and provide financial services capable of
increasing the social productivity of investment. The above categories of
banks, however, operate everywhere in the country and for a number of
historical, economic and legal reasons mirror more closely the type of
financial institution found in the theory
26
. To take account of possible
time impacts of financial development on economic growth we estimate

24
three panel regressions: a full panel regression with one-year growth
rates, and two other panel regressions with average growth rates of the
dependent variable for three and five years respectively. The former
panel includes, as a result, 420 observations, and it is meant to focus on
the short-run impact of financial development on economic growth,
whilst the second (consisting of 140 observations) and the third panel
(with 80 observations) concentrate on the medium and the long-run
impact respectively.
Finally, it is worth noting that the equations include regional fixed
effects and are estimated by using weighted least squares so as to control
for heteroscedasticity across regions. Moreover, in order to avoid
problems of simultaneity, all regressors are referred to the initial period
(t-1, t-3 and t-5 respectively). No problem of autocorrelation in the
residual is detected.
5.3 Main findings
Panel regressions results for the 20 Italian regions over the 1970-1993
period are presented in table 11 (for value added per worker) and table
12 (for gross domestic product per capita). The aforementioned four
indicators of financial specialisation are added to the subset of robust
regressors from earlier studies on the determinants of growth. The first
column, in the two tables, shows estimates from the more general
formulation which allows one to focus on the short run relationship,
whilst in the second and the third column one finds the estimates for the
medium and the long run impact respectively. The parameter estimates
of the control variables (that is, lagged dependent variable, human capital
and government consumption) are in line with previous evidence. It is
worth stressing that the coefficient on government consumption is
usually positive and significant in the short run whilst it loses such
significance and sometimes it changes sign for longer lags. This may be
interpreted as a signal that such expenditures affect just temporarily
regional growth and that it effects die out quite quickly.

25
table 11. Regression results
method: generalised least squares (cross section weights) with temporal and fixed effects
dependent variable: growth rate of value added per worker
420 observations,
short-run analysis
(i=1)
140 observations,
medium-run
analysis (i=3)
80 observations,
long run analysis
(i=5)
value added(t-i)
-0.14
-0.17
-0.13
(-6.22) a
(-6.36) a
(-6.67)
a
human capital(t-i)
0.11
0.02
0.04
(5.28) a
(1.34)
(2.86)
a
public consumption(t-i)
0.05
0.00
0.01
(2.18) b
(0.21)
(-0.61)
public banks(t-i)
-0.009
-0.009
-0.01
(-1.18)
(-1.63)
(-1.84)
c
banks of national interest(t-i)
-0.016
0.004
-0.001
(-2.15) b
(0.66)
(-0.17)
cooperative banks(t-i)
0.004
0.004
0.001
(2.09) b
(3.75) a
(1.50)
special credit institutions(t-i)
0.012
0.005
0.008
(2.09) b
(0.96)
(-2.01)
b
Adjusted R-squared
0.65
0.80
0.95
t-student in parentheses, a= significant at 1% level, b=significant at 5% level, c=significant at 10% level
table 12. Regression results
method: generalised least squares (cross section weights) with temporal and fixed effects
dependent variable: growth rate of gdp per capita
420 observations,
short-run analysis
(i=1)
140 observations,
medium-run
analysis (i=3)
80 observations,
long run analysis
(i=5)
value added(t-i)
-0.12
-0.44
-0.21
(-5.70) a
(-3.87) a
(-9.76)
a
human capital(t-i)
0.11
0.13
0.07
(4.98) a
(2.25) b
(5.51)
a
public consumption(t-i)
0.10
0.13
-0.04
(3.96) a
(1.28)
(-1.78)
c
public banks(t-i)
-0.022
-0.049
-0.004
(-3.07) a
(-2.63) b
(-0.78)
banks of national interest(t-i)
-0.023
-0.047
-0.028
(-3.06) a
(-2.17) b
(-4.89)
a
cooperative banks(t-i)
0.004
0.01
0.004
(2.25) b
(2.20) b
(5.93)
a
special credit institutions(t-i)
0.011
0.011
0.005
(2.03) b
(0.83)
(1.92)
c
Adjusted R-squared
0.68
0.75
0.96
t-student in parentheses, a= significant at 1% level, b=significant at 5% level, c=significant at 10% level
As for the role of different financial institutions, results show some
similarities and some differences depending on the variable used to

26
proxy for economic growth. As far as the similarities are concerned, the
most robust result refers to the Co-operative banks, which display a
positive impact (in the short, medium and long run) on the rate of
regional economic growth irrespective of how this is measured (gdp per
head or value added per worker). The significance of such a positive
coefficient is however rather unstable. This result is certainly interesting
and confirms the finding of similar cross-sectional studies based on
provincial data
27
. Special credit institutions, again, have a positive and
significant impact in most regression
28
. We tend to interpret this result as
a signal of the importance of government financial intervention to foster
the process of structural change which has characterised public policies
for the Mezzogiorno until the 1980’s. As for the differences, banks of
national interest and public banks often have a negative but insignificant
impact on value added per worker; whilst such a negative impact proves
significant when gross domestic product per capita proxies growth. This
is a somewhat puzzling result, as these banks are expected to be more
efficient and highly specialised in the provision of innovative services to
firms. We take this result as indirect evidence that their organisational
structure has prevented them from dealing effectively with information-
intensive borrowers, particularly those small businesses that drive
economic development in most Italian regions.
6. Conclusions
Following the tradition of cross-countries studies of growth, this
paper has examined the empirical linkages between financial
development and economic growth in Italian regions before the
unification of the European financial market. Taking a full panel
approach we find that indicators of financial development are positively
associated with economic growth. We control for unobserved region-
specific differences and unspecified interregional fluctuations and,
relative to previous efforts in this area, we introduce a finer institutional
breakdown. Although the overall size of the financial sector does not
have a robust impact on growth, two types of intermediaries, Co-
operative banks and Special credit institutions, appear to play a role,
whilst two other types of intermediaries, Banks of national interest and
Public law banks, either do not affect growth (when measured by valued
added per worker) or their influence is negative (when growth is
measured by GDP per capita). Italian regional development is mostly
driven by the performance of information-intensive SMEs, hence our
results lend support to the idea that smaller and less complex banking

27
institutions are better equipped than large hierarchical banking
corporations at funding these important economic actors. Since the
ongoing process of consolidation in financial markets is producing larger
and more complex institutions, these results raise serious worries about
the final impact on SMEs. At the same time, the apparently inconsistent
result concerning the role of Public law banks and Special credit
institutions, shows that both the “political” and “development” function
of government ownership can be simultaneously at work. After all, as
stressed by Rodrik (2002), economic progress is everywhere the result of
orthodoxy and local heresies.

28
References
Alessandrini, P. (1992) Squilibri regionali e dualismo finanziario in Italia:
alcune riflessioni, Moneta e credito, 165.
Atje, R. and R. Jovanovic (1993) Stock Markets and Development,
European Economic Review, 37, 632-640.
Barro, R.J. (1991) Economic Growth in a Cross Section of Countries,
Quarterly Journal of Economics, 106, 2, 407-443.
Bencivenga, V. R. and B. D. Smith (1991) Financial Intermediation and
Endogenous Growth, Review of Economic Studies, 58, 195-209.
Berger, A. N. and G. F. Udell (2002) Small Business Credit Availability
and Relationship Lending: the Importance of Bank Organisational
Structure, Economic Journal, february, pp. 32-53.
Berger, A. N., N.H. Miller, M. A. Petersen, R. G. Rajan and J. Stein
(2002) Does Function Follow Organizational Form? Evidence From the
Lending Practices of Large and Small Banks, NBER Working Papers,
8752.
Cole, R., Goldberg L. and White L. (2004) Cookie Cutter vs. Character:
The Micro Structure of Small Business Lending by Large and Small
Banks, Journal of Financial and Quantitative Analysis, 39, n. 2 , pp. 227-51.
Commission of the European Communities (1993) The Economic and
Financial Situation in Italy, European Economy, Report and Studies, vol. 1.
De Gregorio, J. and Guidotti , P.E. (1995) Financial Development and
Economic Growth , World Development, 23, 433-448.
Demirgüç-Kunt, A. and R. Levine (2001) Financial Structure and Economic
Growth, MIT Cambridge Mass., MIT Press.
Diamond D.W. (1984) Financial Intermediation and Delegated
Monitorin, Review of Economic Studies, n. 51, pp. 393-414.

29
Di Liberto, A. (1994) Convergence Across Italian Regions, MSc Dissertation,
University College London, University of London.
Faini, R., Galli, G. and Giannini, C. (1992) Finance and Development:
the Case of Southern Italy, Banca d’Italia, Temi di Discussione, n. 170
Ferri, G. and Di Salvo, R. (1994), Credito cooperativo finanziamento alle
piccole imprese e alle economie locali e sviluppo economico decentrato:
valutazioni teoriche e primi riscontri empirici, Cooperazione di credito, 146,
1-49.
Ferri, G. and Mattesini, F. (1995) Accounting for local economic growth.
Can co-operative banks make a difference? , presented at the Crenos 2°
Conference on Economic Integration and Regional Gaps, Cagliari, Italy
Galli, G. and Onado, M. (1990) Dualismo territoriale e sistema
finanziario, G. Galli (ed.). Il sistema finanziario del Mezzogiorno, Roma,
Banca d’Italia, special issue of Contributi all’analisi economica.
Goldsmith, R.W. (1969) Financial Structure and Development, New Haven:
Yale University Press.
Greenwood, J. and Jovanovic, B. (1990) Financial Development,
Growth, and Distribution of Income , Journal of Political Economy.
Group of Ten (2001) Report on consolidation in the financial sector, OECD.
Jappelli, T. (1993) Banking Competition in Southern Italy: a Review of
Recent Literature Studi economici, 49, 47-60.
Jappelli, T. and M. Pagano (1994) Saving, Growth, and Liquidity
constraints, Quarterly Journal of Economics, 109, 83-109.
King, R. G. and R. Levine (1993a) Finance and Growth: Schumpeter
Might be Right , Quarterly Journal of Economics, 108, 717-37.
King, R.G. and R. Levine (1993b) Finance, Entrepreneurship, and
Growth, Journal of Monetary Economics, 32, 513-42.

30
La Porta, R., F. Lopez-de-Silanes, A. Shleifer (2002) Government
Ownership of Bank, Journal of Finance, v. 57, n. 1, pp. 265-301.
Leland, H. and Pyle D. (1977) Informational Asymmetries , Financial
Structure and Financial Intermediation, Journal of Finance, 32
Levine, R. (1997) Financial Developmentand Economic Growth: Views
and Agenda, Journal of Economic Literature, v. 35, pp. 688-726
Levine, R. (2003) More on Finance and Growth: More Finance, More
Growth?, Federal Reserve Bank of St. Louis Review, v. 85, n. 4, pp. 31-46.
Lucas, R. (1988) On the Mechanics of Economic Growth, Journal of
Monetary Economics, 22, pp. 3-42.
Marullo Reedz, P. (1990) La redditività delle aziende di credito , G. Galli
(ed.). Il sistema finanziario del Mezzogiorno, Roma, Banca d’Italia, Contributi
all’analisi economica.
McKinnon, R.I. (1973), Money and capital in economic development, Brookings
Institution, Washington, DC.
McKinnon, R.I. (1989), Financial Liberalisation and Economic
Development: Reassessment of Interest Rate Policies in Asia and Latin
America, Oxford Review of Economic Policy, 4.
Murinde V. and Eng F.S.H. (1994) Financial development and
Economic Growth in Singapore: Demand Following or Supply Leading,
Applied Financial Economics, 4, 391-404.
Observatory of European SMEs (2003) SMEs and Access to Finance,
Report n. 2.
Observatory of European SMEs (2003) SMEs in Europe 2003, Report n.
7.
Odell K. A. (1989) The Integration of Regional and Interregional Capital
Markets: Evidence from the Pacific Coast, 1883-1913, Journal of Economic
History, 49, 197-210.

31
Paci, R. and Pigliaru, F. (1995) -Convergence and /or Structural
Change? Evidence from the Italian Regions, Nota di Lavoro 72.95,
Fondazione Eni Enrico Mattei.
Paci, R. and Pusceddu, N. (1995) Intervento pubblico,
industrializzazione e crescita delle regioni del Mezzogiorno, Studi
Economici, 54.
Pagano, M. (1993) Financial Markets and Growth: an Overview ,
European Economic Review, 37, 613-622.
Picci L. (1995) Lo stock di capitale nelle regioni italiane, Collana di
economia applicata, n. 229, Dipartimento di Scienze Economiche-
Università degli Studi di Bologna,
Pittaluga, G.B. (1987) Il razionamento del credito in Italia: una verifica
empirica , Moneta e credito, 160.
Rodrik, D. (2002)
Saint-Paul, G. (1992) Technological Choice, Financial Markets and
Economic Development, European Economic Review, 36, 763-781.
Samolik, K.A. (1994) Banking Conditions and Regional Economic
Performance. Evidence of a Regional Credit Channel, Journal of Monetary
Economics, 34, 259-278.
Stiglitz, J. (1989) Financial Markets and Development, Oxford Review of
Economic Policy, 5, 55-67.
Van Damme, E. (1994) Banking: A Survey of Recent Microeconomic
Theory, Oxford Review of Economic Policy, 4.
Zazzaro, A. (1993) Le banche in un’economia regionale: una rassegna
della letteratura Quaderni di ricerca, 40, Università degli Studi di Ancona.
Zingales (2003), The weak links, commentary to More on Finance and
Growth: More Finance, More Growth? (by R. Levine), Federal Reserve
Bank of St. Louis Review, v. 85, n. 4, pp. 31-46.

32
1
In this context, a potential entrepreneur who wants to rise investment capital
for a project with substantial expected returns and who has superior
knowledge about his business than anyone else, might not be able to raise the
desired amount of capital because of three problems: (i) adverse selection;
(ii) moral hazard; (iii) ex-post verifiability. In such a context, it can be shown
(see Leland and Pyle (1977), Stiglitz and Weiss (1981), Diamond (1984), van
Damme (1994)) that resorting to an intermediary that screens potential
borrowers, evaluates their projects and ensures that money is well used, can
be preferable to a situation of direct finance. Therefore, putting together the
traditional functions of intermediaries, arising from maturity mismatch, with
the newer ones, associated with imperfect information, financial institutions
can be seen to play at least three critical roles: transformation of savings into
investment; screening and monitoring; provision of payment services.
2
It must be stressed that in many of these models the higher rates of return
from better resource allocation due to financial development may discourage
saving rates and, in some circumstances, decelerate growth.
3
These weaknesses concern the following: 1) high correlation between
measures of financial development and measures of good government
institutions; 2) measures of financial development often do not reflect
effective access to finance by firms; 3) channels through which finance
works are generally neglected; 4) role of international financial integration
are hardly considered; 5) single-minded fous on aggregate economic growth
(instead of, e.g., investment and total factor productivity); 6) little attention to
what promotes financial development.
4
According to the authors, the decision to lend and the term of the contract
are primarily based on the strenght of balance sheet and income statement in
the case of Financial Statement Lending, on the quality of the available
collateral under Asset-Based Lending, on the financial condition and history
of the principal owner, in addition to financial statement ratios, when Small
Business Credit Scoring is used.
5
The remaining layers concern the sequential contracting within the bank
between loan officer, senior management, stockholders, creditors and
regulators.
6
The authors relate the “development” perspective to the work of Alexander
Gershenkron (1962) and the “political” view to the research of Kornai
(1974) and Shleifer and Vishny (1994).

33
7
These four indicators are termed, respectively, LLY, BANK, PRIVATE and
PRIVY, and are measured as follows (see King and Levine, 1993a, pp. 720-
21): LLY = “M3” (or “M2”)/GDP; BANK = deposit money bank domestic
assets/(deposit money bank domestic assets + central bank domestic assets);
PRIVATE = claims on the nonfinancial private sector/(total domestic credit -
credit to money banks); PRIVY = claims on the nonfinancial private
sector/GDP.
8
This is particularly true for monetary aggregates such as M1 and M2, which
reflect the ability of the financial system to provide liquidity services, but do
not necessarily reflect its ability to allocate credit -a function which is more
directly connected to investment and growth. These aspects of financial
intermediation are not necessarily related. In particular, high level of
monetization can be the result of lack of financial sophistication and low
monetization may be associated with very advanced financial structures (see
the examples discussed in De Gregorio and Guidotti, 1995, p. 438).
9
Europe-19 indicates EU-15 (i.e. Austria, Belgium, Denmark, Finland,
France, Germany, Greece, Ireland, Itay, Luxembourg, Netherlands, Portugal,
Spain, Sweden, United Kingdom) plus Iceland, Norway and Swutzerland
(incl. Liechtenstein).
10
Data refers to 2000. It is worth stressing that the BACH dataset
overestimates the equity ratio of small enterprises. Indeed, in a parallel
calculation on data from the Survey of Manufactoring Firm by Mediocredito
Centrale, we found that in 1997 the equity ratio of Italian small and medium-
sized firms was significantly smaller than the one from BACH, averaging
22,9 (small) and 23,9 (medium-sized) with very tiny (around 0.15) standard
deviations.
11
Regarding medium-sized firms, our calculations for three consecutive year
(1995-1997) from the SMF-Mediocredito Centrale show an average share of
bank debt to total debt of 56.4%.
12
The survey excludes the micro size and concentrates on a stratified sample
of Italian firms with at least 11 and up to 500 employees plus all
manufacturing firms with more than 500 employees.
13
It goes without saying that co-operative banks are not the sole intermediary
specialising in small business lending and that in some countries, in many
respects, they are closer to larger diversified banks than to small local banks.

34
14
Decree 1st September 1993, n. 385.
15
These limits have been gradually removed. In 1987 short-term banks have been
allowed to provide credit up to a maximum of five years. Since 1993 the distinction
between these two type of intermediaries has been abolished and they can carry out the
whole range of banking operations.
16
For an up-to-date picture of the Italian financial system see the special report on Italy
in Commission of the European Communities, n. 1, 1993.
17
CBs are limited liabilities companies with special partnership features (e.g. one
shareholder one vote), whereas RCBs can be either limited or unlimited companies and,
usually, set ceilings on the amount of credit that can be extended to non-members.
18
This behaviour, however, cannot be ascribed to irrationality of Southern economic
agents. The Post Office has a pervasive network, hence transport and other transaction
costs may partially explain this preference.
19
Since 1990 the opening of new branches has been essentially liberalized. Before then it
was impossible to open new branches, and close old ones, without formal permission
from the Bank of Italy, which would call banks to apply for new branches occasionally, in
connection with the so-called “Piani Sportelli”, and would decide whether or not to
accept their applications discretionally. The latest “call for branches” took place in 1978,
1983 and in 1986.
20
The Herfindal index would be more suitable, but unfortunately it is not available with
the same frequency. The correlation ratio between the two measures, however, is usually
very high.
21
In 1994, for instance, the quota of nonperforming loans in the South was 17.0, whilst it
was just 6.1 in the North.
22
See, for instance, Jappelli (1983) and Faini et al. (1992). In this latter work, based on
microdata, it is shown that despite the cost of credit from outside banks is systematically
and significantly lower, Southern firms accept to borrow at different rates from outside
and inside banks. This can be interpreted as evidence of the fact that information is
imperfect and asymmetric. In other words, in the South captive relationships between
firms and banks are implemented thanks to the market power of the latter, and this leads
to a widespread phenomena of rationing and potentially distorted allocation processes.
23
For the sake of clarity we have not reported all the usual diagnostics (standard errors
and R-squared). Suffice to note here that standard errors are such that the slope
coefficient is always significantly different from zero at the 1% level and that the adjusted
R-squared ranges between 0.91 and 0.99 and its average is 0.97.
24
It is worth noting that this problem has been solved differently by Samolik (1993), who
subtracted the national growth rate from the regional one in order to obtain the
dependent variable. This method has pros and cons with respect to ours. On the one

35
hand, it reduces the number of right hand side variables; on the other hand, unlike our
method, it fails to consider additional time effects different from the business cycle.
25
This corresponds to test for convergence, a problem we are not directly interested in.
For a more detailed analysis see DiLiberto (1994) and Paci and Pigliaru (1998).
26
The bulk of the excluded categories is represented by the “Savings banks”.
27
See Ferri and Mattesini (1995). These authors use as indicator of financial development
the ratio of provincial income to bank branches and control for the effect of Cooperative
banks by including in the regression the fraction of total branches held by this category.
Neither spillover effects nor other intermediaries are considered.
28
Strangely enough, the coefficient is significant for the short and the long-run
regression but not for the medium one.
Wyszukiwarka
Podobne podstrony:
Stewart Hamilton, Alicia Micklethwait Greed and Corporate Failure; The Lessons from Recent Disaster
Human teeth as historical biomonitors of environmental and dietary lead some lessons from isotopic s
How Taxes and Spending on Education Influence Economic Growth in Poland
USŁUGI, World exports of commercial services by region and selected economy, 1994-04
Good Capitalism, Bad Capitalism, and the Economics of Growth and Prosperity
Smile and other lessons from 25 years in business
The pathogenesis of Sh flexneri infection lessons from in vitro and in vivo studies
Good Capitalism, Bad Capitalism, and the Economics of Growth and Prosperity
A Cebenoyan Risk Management, capital structure and lending at banks Journal of banking & finance v
business group structure and firm performance in china s transition economy
Role of Antibodies in Controlling Viral Disease Lessons from Experiments of Nature and Gene Knockout
[38]QUERCETIN AND ITS DERIVATIVES CHEMICAL STRUCTURE AND BIOACTIVITY – A REVIEW
Syntheses, structural and antimicrobial studies of a new N allylamide
Power Structure and Propoganda in Communist China
Behrens regional economics a new economic geography
lessons from Finland id 267314 Nieznany
Plant Structure and Function F05
więcej podobnych podstron