Introduction to Borland's Turbo Debugger
Compile and link your assembly program.
1.
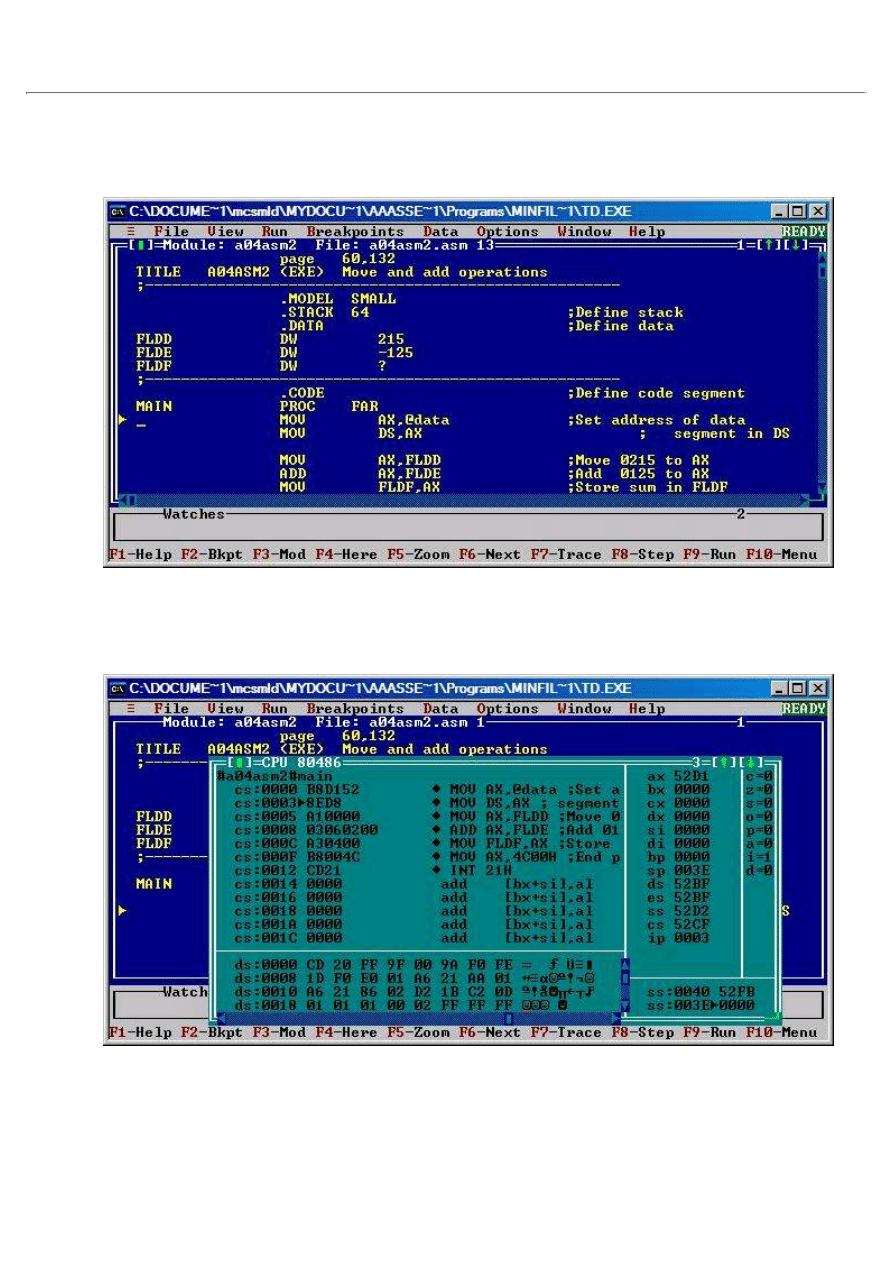
Start the debugger by using the Td command under Textpad's Tools menu. (If using DOS, type TD
<program>.exe. You should see a screen similar to the one shown in the figure below.
2.
Type ALT-V, and then type C, to get a view of the CPU state. In the CPU window, you see the program code,
the CPU registers, the flags, the stack, and the contents of memory where your program is located. You can
step through the program using the F7 key.
3.
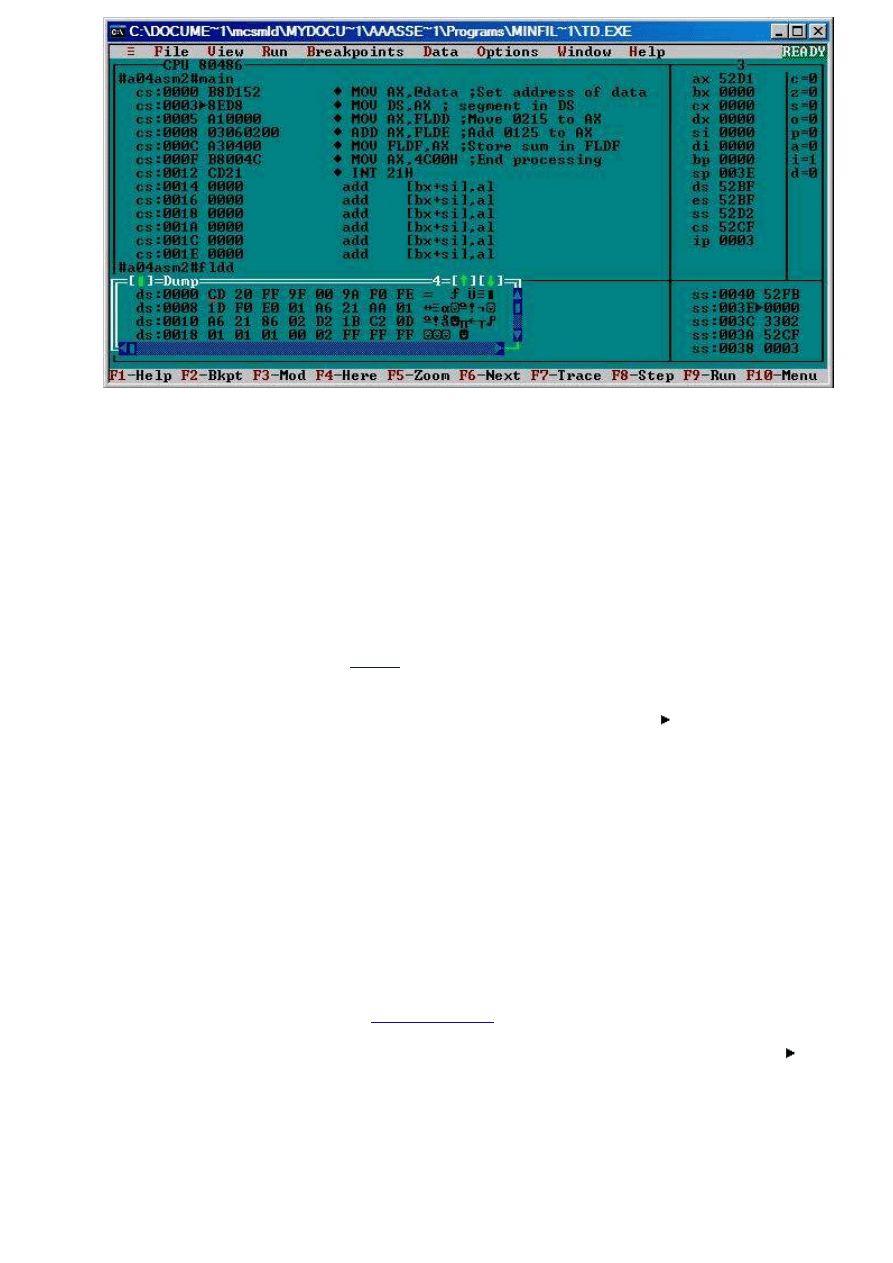
Click on the green arrow to maximize the CPU window.
4.
Click on View and choose Dump. Then slide the data window to the bottom of the screen.
5.

The assembly program window displays information about the code.
Each line looks something like the: cs:0005 A10000 MOV, AX, FLDD
The cs indicates that the CS (code segment) register contains the segment where the code is stored. Take the
value in CS, shift it left 4 bits (i.e., add four binary zeros or one hexadecimal zero to right side), then add
hexadecimal number to right of colon to shifted CS value. This is physical address of line of code.
For example, if CS = 52CF
16
, then CS:00054 indicates that the physical address that the line of code is stored
in is 52CF5
16
.
52CF from CS becomes 52CF0
+ 0005
52CF5
The user can also determine the next address to be executed. The instruction with after the address is the
next address. You can also determine this by adding the value in register IP to CS using technique above.
For example, if CS=52CF
16
and IP=0003
16
, then the next address to execute would be CS:IP (52cf:0003).
The hexadecimal number following the address represents the actual binary data (machine code) stored in
memory that represents the instruction.
Data Display Window - displays hexadecimal values of memory where the data segment register (DS) is
pointing. This is where the program will get its data. Notice once again the use of the segmented addressing
with DS as the segment.
6.
Debugging Exercise
Compile and link the following program:
A04ASM2.ASM
1.
Use F7 to execute the first two instructions. Note: F7 executes the current instruction pointed to by . Note
that value in IP, the instruction pointer, is following the triangle symbol indicating which instruction is being
executed next. Watch what happens to the instruction pointer (IP - right hand side, just below the middle).
Right click on top of ip and pick Zero. What happened to the triangle symbol?
2.
F7 to the third instruction (MOV AX, FLDD). This instruction copies the memory location referenced by the
variable FLDD into the register AX. The variable's address is ds:0000 where DS is the address of the data
segment.
Look at the data dump window and write down the first two byes stored at ds:0000?
3.

Now enter F7 to execute MOV AX, FLDD and notice what happened to register AX. The instruction copied
two bytes (16 bits --> 4 hex values).
Why is the value in AX different than the value as ds:0000?
4.
Execute ADD AX, FLDE and write down the new result stored in register AX.
The 3rd and 4th hex values (83 FF) in the data window were added to the value in AX.
00D7 + 83FF
Why did the value in AX go down ?
5.
Execute the next instruction (MOV FLDF,AX) and write down the new 5th and 6th hex values in the data
window.
6.
Turn in the values that you wrote down. Make sure to write the step #, register name or memory location, and value.
Wyszukiwarka
Podobne podstrony:
ECE 353 Assembler Debugger Tutorial
tutorial turbo pascal
DEBUGGER W TURBO PASCALU
bugzilla tutorial[1]
freeRadius AD tutorial
Alignmaster tutorial by PAV1007 Nieznany
free sap tutorial on goods reciept
ms excel tutorial 2013
Joomla Template Tutorial
ALGORYTM, Tutoriale, Programowanie
8051 Tutorial uart
Mazda 6 (Mazda6) Engine Workshop Manual Mzr Cd (Rf Turbo)(3)
B tutorial
Jeep Cherokee Sport 2 5 Litre Turbo Diesel Manual
Labview Tutorial
Obraz partycji (ghost2003) Tutorial
więcej podobnych podstron