
arXiv:cond-mat/0205260 v1 13 May 2002
Epidemics and immunization in
scale-free networks
R. Pastor-Satorras and A. Vespignani
WILEY-VCH Verlag Berlin GmbH
May 23, 2004


1 Epidemics and immunization in scale-free networks
Romualdo Pastor-Satorras
Departament de F´ısica i Enginyeria Nuclear
Universitat Polit`ecnica de Catalunya
08034 Barcelona, Spain
Alessandro Vespignani
The Abdus Salam International Centre for Theoretical Physics (ICTP)
P.O. Box 586, 34100 Trieste, Italy
1.1
Introduction
Epidemic models are heavily affected by the connectivity patterns characterizing the popula-
tion in which the infective agent spreads [1, 2, 3]. Many models map this pattern in terms of
networks, in which nodes represent individuals and links represent the possible contacts along
which the epidemic diffuses. In this perspective scale-free (SF) networks [4, 5, 6] represents
a very interesting cases since they exhibit a power-law connectivity distribution
P (k) ∼ k
−
γ
(1.1)
for the probability
P (k) that a node of the network has k connections to other nodes. For
connectivity exponents in the range
2 < γ ≤ 3 this fact implies that each node (element
of the population) has a statistically significant probability of having a very large number of
connections compared to the average connectivity
hki of the network. In mathematical terms,
the implicit divergence of
k
2
is signalling the extreme heterogeneity of the connectivity
pattern, and it easy to foresee that this property is going to change drastically the behavior
of epidemic outbreaks in SF networks. The interest in the study of epidemic models in SF
networks is enhanced by the evidence that both the Internet [7, 8, 9, 10, 11] and the maps
of human sexual contacts [12] are characterized by scale-free connectivity properties. The
Internet and the web of sexual contacts are, in fact, the natural environment in which cyber
viruses and sexually transmitted diseases (STD), respectively, live and proliferate. The study
and characterization of epidemics in scale-free networks is therefore of potential importance
for those seeking to control and arrest human and electronic plagues. These considerations
motivate the analysis of the effect of complex network topologies in standard epidemic models
leading to several interesting and novel results [13, 14, 15].
Perhaps, the most surprising result, first originated by the inspection of the susceptible-
infected-susceptible (SIS) model, is that the spread of infections is tremendously strength-
ened on SF networks [15, 16]. Opposite to standard models, epidemic processes in these

4
1
Epidemics and immunization in scale-free networks
networks do not possess any epidemic threshold below which the infection cannot produce
a major epidemic outbreak or an endemic state. In principle, SF networks are prone to the
persistence of diseases whatever infective rate they may have. The same peculiar absence
of an epidemic threshold has been readily confirmed in other epidemic models such as the
susceptible-infected-removed (SIR) model [17, 18, 19] and appears as a general feature of
epidemic spreading in SF networks. This feature reverberates also in the choice of immuniza-
tion strategies [20, 21] and changes radically the standard epidemiological framework usually
adopted in the description and characterization of disease propagation.
In this chapter we want to provide a review of the main results obtained in the modeling
of epidemic spreading in SF networks. In particular, we want to show the different epidemi-
ological framework originated by the lack of any epidemic threshold and how this feature is
rooted in the extreme heterogeneity of the SF networks’ connectivity pattern. As a real world
example of epidemic spreading occurring on SF connectivity patterns, we shall consider the
diffusion of computer viruses. Computer virus spreading, in fact, can be characterized by sim-
ple population models that do not consider properties such as gender, sex, or age, that must be
included in the modeling of STD and other kinds of epidemics. On the other hand, computer
viruses proliferate in the Internet, that is a capital example of SF network, and it is natural to
include this topology in their modeling. Finally, many real data are available in computers epi-
demiology and we can use them to show experimentally the failure of the standard epidemic
framework and support the new picture arising for SF networks.
We also present how the scale-free nature of the network calls for different immunization
strategies in order to eradicate infections. Opposite to standard models, it is found that SF net-
works do not acquire global immunity from major epidemic outbreaks even in the presence
of unrealistically high densities of randomly immunized individuals. Successful immuniza-
tion strategies, therefore, can be developed only by taking advantage of the inhomogeneous
connectivity properties of the scale-free connectivity patterns. Finally we consider the effect
of the network finite size, referring to real systems which are actually made up by a finite
number of individuals. The presented results provide a general view of the novel features of
epidemic models in SF networks that, besides the application to computer viruses, prompt to
the relevant implications of these studies in human and animal epidemiology.
1.2
Computers and epidemiology
In a classic paper [22], it is described the Domain-Name-Server (DNS) cache corruption
spreading as a natural computer virus proliferating on the Internet. Computers on the In-
ternet rely upon DNS servers to translate Internet protocol addresses into computer names and
vice-versa. On their turn, DNS servers communicate with their DNS peers to share and update
these informations. The updating is periodic in time and in the meanwhile, translation tables
are “cached” and eventually transmitted to the other DNS peers. If any portion of this cache is
corrupted, the DNS server will provide incorrect addresses not only to requesting computers
but to DNS peers as well, propagating the error. At the same time, any DNS server can get
“cured” by an updating with an error-free DNS peer. The same kind of processes can occur
with routing tables exchanged by routers. This propagation of errors occurring on routers
and servers that are physically linked is a typical example of epidemic process, in which the

1.2
Computers and epidemiology
5
corruption (virus) is transmitted from infected to healthy individuals.
From a more familiar point of view, however, computer viruses are usually referred to
as little programs that can reproduce themselves by infecting other programs [23, 24]. The
basic mechanism of infection is as follows: When the virus is active inside the computer, it
is able to copy itself, by different ways, into the code of other, clean, programs. When the
newly infected program is run into another computer, the code of the virus is executed first,
becoming active and being able to infect other programs. Apart from reproducing themselves,
computer viruses perform threatening tasks that range from flashing innocuous messages on
the screen to seriously corrupt data stored in the computer. These deleterious effects render
most computer viruses as dangerous as their biological homonyms, and explain the interest,
both commercial and scientific, arisen around their study.
Computer viruses have evolved in time (driven of course by their programmers’ skills),
adopting different strategies that take advantage of the different weak points of computers
and software. Computer viruses can be classified into three main classes, or strains [24].
The first strain includes file viruses that infect application programs. A second and more
harming family contains the boot-sector viruses that infect the boot sector of floppy disks
and hard drives, a portion of the disk containing a small program in charge of loading the
operating system of the computer. A third and nowadays prevailing strain is formed by the
macro viruses. These viruses are independent of the platform’s hardware and infect data files,
such as documents produced with spreadsheets or word processors. They are coded using the
macro instructions that are appended in the document, instructions used to perform a set of
automatic actions, such as formatting the documents or typing long sequences of characters. In
addition, with the ever more efficient deployment of antivirus software, more harmful viruses
combining together the properties of the main strains have been developed.
Noticeably, however, the nowadays dominant and most aggressive type of cyber organisms
is represented by the worms family. Worms are actually viruses infecting the computer with
mechanisms similar to usual viruses and making a particularly effective use of the e-mail for
infecting new computers. In fact, by using the instructions of some commercial mail software
applications, worms are capable of sending themselves to all the e-addresses found in the
address-book of the person receiving the infected mail. This possibility renders worms the
most effective viruses, especially in terms of the velocity at which they can propagate starting
from a single infection.
The spreading of computer viruses has been studied for long years, in close analogy with
the models developed for the study of the transmission of biological diseases (for a review see
Refs. [25, 26]). In this biological framework, the key point is the description of the epidemic
process in terms of individuals and their interactions. In this simplified formalism, individuals
can only exist in a discrete set of states, such as susceptible (or healthy), infected (and ready
to spread the disease), immune, dead (or removed), etc. On the other hand, the interactions
among individuals are schematized in the structure of the contacts along which the epidemics
can propagate. Within this formalism, the system can be described as a network or graph [27],
in which the nodes represent the individuals and the links are the connections along which the
epidemics propagates.
Standard epidemiological models usually consider homogeneous networks, which are those
that have a connectivity distribution peaked at an average connectivity
hki, and decaying ex-
ponentially fast for
k ≪ hki and k ≫ hki. A typical example of deterministic homogeneous

6
1
Epidemics and immunization in scale-free networks
network is the standard hypercubic lattice, while among the random homogeneous network we
can count the Erd ¨os-R´enyi model [28] and the Watts-Strogatz model [29]. On the other hand,
as we shall see in the following, computer viruses and worms spread in environments char-
acterized by scale-free connectivities. This will lead to the failure of the standard epidemic
picture and will naturally introduce the scale-free connectivity as an essential ingredient for
the understanding of computer viruses.
1.3
Epidemic spreading in homogeneous networks
The simplest epidemiological model one can consider is the susceptible-infected-susceptible
(SIS) model [2, 3]. In the SIS model, individuals can only exist in two discrete states, namely,
susceptible and infected. These states completely neglect the details of the infection mecha-
nism within each individual. The disease transmission is also described in an effective way.
At each time step, each susceptible node is infected with probability
ν if it is connected to
one or more infected nodes. At the same time, infected nodes are cured and become again
susceptible with probability
δ, defining an effective spreading rate
λ =
ν
δ
.
(1.2)
Without lack of generality, we set can set
δ = 1, since it only affects at the definition of the
time scale of the disease propagation. Individuals thus run stochastically through the cycle
susceptible
→ infected → susceptible,
and hence the name of the model. The SIS model does not take into account the possibility
of individuals removal due to death or acquired immunization which would lead to the so-
called susceptible-infected-removed (SIR) model [2, 3]. It is mainly used as a paradigmatic
model for the study of infectious disease leading to an endemic state with a stationary and
constant value for the density of infected individuals, i.e. the degree to which the infection is
widespread in the population. The SIS has been adopted in the modeling of computer viruses
and worms since, also in the presence of antiviruses, computer immunization statistically
depends upon the user concerns in not skipping the antivirus control when opening e-mail
attachments or new files.
The analytical study of the SIS model can be undertaken in terms of a dynamical mean-
field (MF) theory. For homogeneous networks, in which the connectivity fluctuations are very
small, we can approach the MF theory by means of a reaction equation for the total prevalence
ρ(t), defined as the density of infected nodes present at time t. That is, we can consider all the
nodes as equivalent, irrespective of their corresponding connectivity. The reaction equation
for
ρ(t) can be written as
∂
t
ρ(t) = −ρ(t) + λ hki ρ(t) [1 − ρ(t)] .
(1.3)
The MF character of this equation stems from the fact that we have neglected the density
correlations among the different nodes. In Eq. (1.3) we have also ignored all higher order
corrections in
ρ(t), since we are interested in the onset of the infection close to the point
ρ(t) ≪ 1. The first term on the right-hand-side in Eq. (1.3) considers infected nodes becoming
1.3
Epidemic spreading in homogeneous networks
7
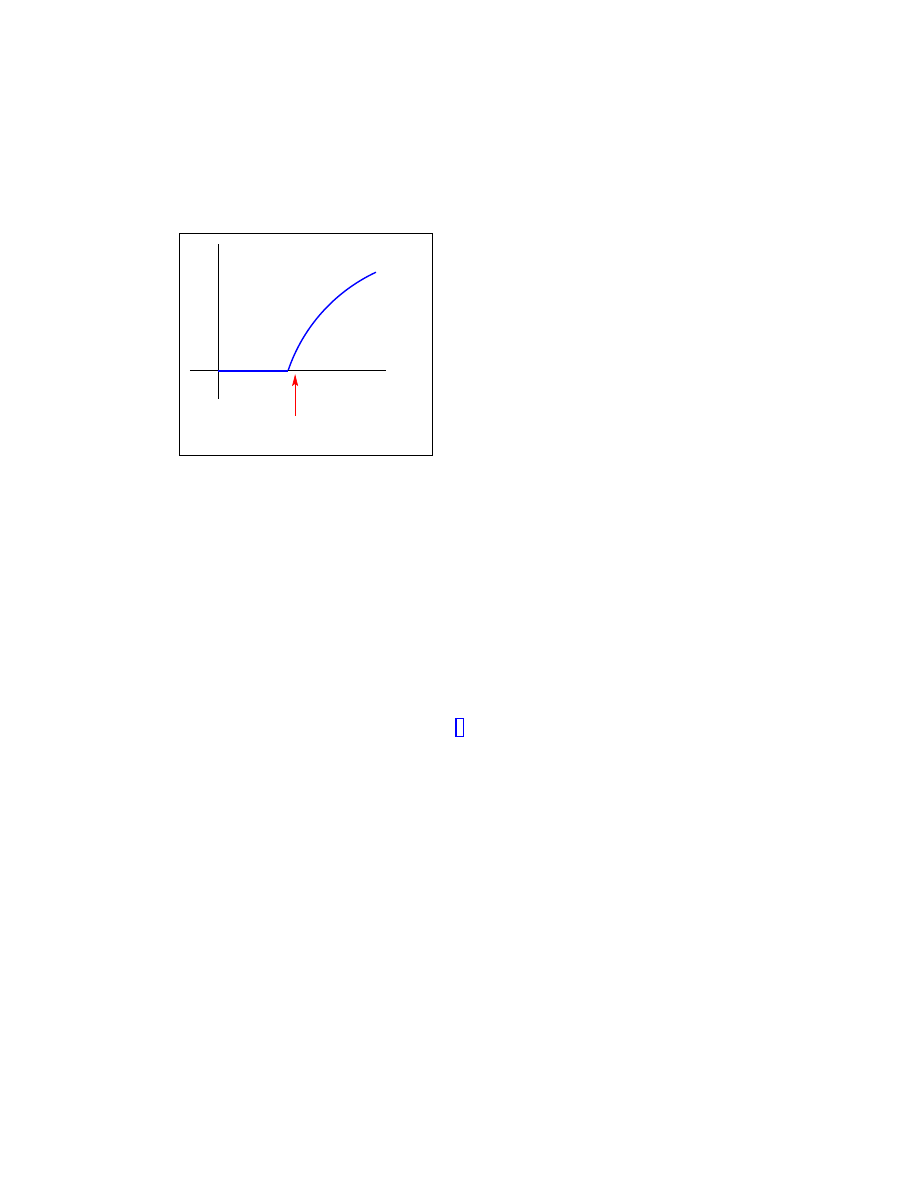
λ
c
ρ
λ
Absorbing phase
Active phase
Computer viruses?
Healthy state
Infected state
Figure 1.1: Schematic phase diagram for the SIS model in homogeneous networks. The epi-
demic threshold
λ
c
separates an active or infected phase, with finite prevalence, from an ab-
sorbing or healthy phase, with null prevalence. The very small prevalence and long lifetimes
observed in computer virus data are only compatible with a value of
λ infinitesimally close to
the epidemic threshold.
healthy with unit rate. The second term represents the average density of newly infected nodes
generated by each active node. This is proportional to the infection spreading rate,
λ, to the
number of links emanating from each node, and to the probability that a given link points to a
healthy node,
[1 − ρ(t)]. In the homogeneous networks we are considering here, connectivity
has only very small fluctuations (
k
2
∼ hki) and as a first approximation we have considered
that each node has the same number of links,
k ≃ hki. This is equivalent to an homogeneity
assumption for the system’s connectivity. In writing this last term of the equation we are
also assuming the homogeneous mixing hypothesis [3], which asserts that the force of the
infection (the per capita rate of acquisition of the disease for the susceptible individuals) is
proportional to the density of infected individuals
ρ(t). The homogeneous mixing hypothesis
is indeed equivalent to a mean-field treatment of the model, in which one assumes that the rate
of contacts between infectious and susceptibles is constant, and independent of any possible
source of heterogeneity present in the system. Another implicit assumption of this model is
that the time scale of the disease is much smaller than the lifespan of individuals; therefore we
do not include in the equations terms accounting for the birth or natural death of individuals.
After imposing the stationarity condition
∂
t
ρ(t) = 0, we obtain the equation, valid for the
behavior of the system at large times,
ρ [−1 + λ hki (1 − ρ)] = 0
(1.4)
for the steady state density
ρ of infected nodes. This equation defines an epidemic threshold
λ
c
= hki
−
1
, and yields:
ρ
=
0
if
λ < λ
c
,
(1.5)
ρ
=
(λ − λ
c
)/λ
if
λ ≥ λ
c
.
(1.6)
8
1
Epidemics and immunization in scale-free networks
The most significant prediction of this model is the presence of a nonzero epidemic thresh-
old
λ
c
λ is above the threshold, λ ≥ λ
c
, the infection spreads and be-
comes persistent. Below the threshold,
λ < λ
c
, the infection dies exponentially fast. From the
point of view of nonequilibrium phase transitions, the SIS model exhibits an absorbing-state
phase transition [30] at the threshold
λ
c
, separating an active or infected phase, with finite
prevalence, from an absorbing or healthy phase, with null prevalence. A qualitative picture of
the phase diagram of this transition is depicted in Figure 1.1. It is easy to recognize that the
SIS model is a generalization of the contact process model, widely studied in this context as
the paradigmatic example of an absorbing-state phase transitions to a unique absorbing state
[30].
To summarize, the main prediction of the SIS model in homogeneous networks is the
presence of a positive epidemic threshold, proportional to the inverse of the average number
of neighbors of every node,
hki, below which the epidemics always dies, and endemic states
are impossible.
1.4
Real data analysis
The statistical properties of computer virus data have been analyzed by several authors, in
close analogy with the classical epidemiology of biological diseases [1, 2, 3]. Within this
framework, studies have focused specially in the measurement of the virus prevalence, defined
as the average fraction of computers infected with respect to the total number of computers
present. From these studies [24, 31, 26] two main conclusions have been drawn. First, viruses
which are able to survive in order to produce a significant outbreak usually reach an endemic
or metastable steady state, with a stationary prevalence. The second empirical observation is
that these endemic viruses do attain in general a very small average prevalence, that can be of
the order of one out of
1000 computers or less.
More recently, other studies [15] have focused in the dynamics of the spreading process,
measuring the surviving probability of homogeneous groups of viruses, classified according to
their infection mechanism (strains). In these studies one considers the total number of viruses
of a given strain that are born and die within a given observation window. The surviving
probability
P
s
(t) of the strain is defined as the fraction of viruses still alive at time t after their
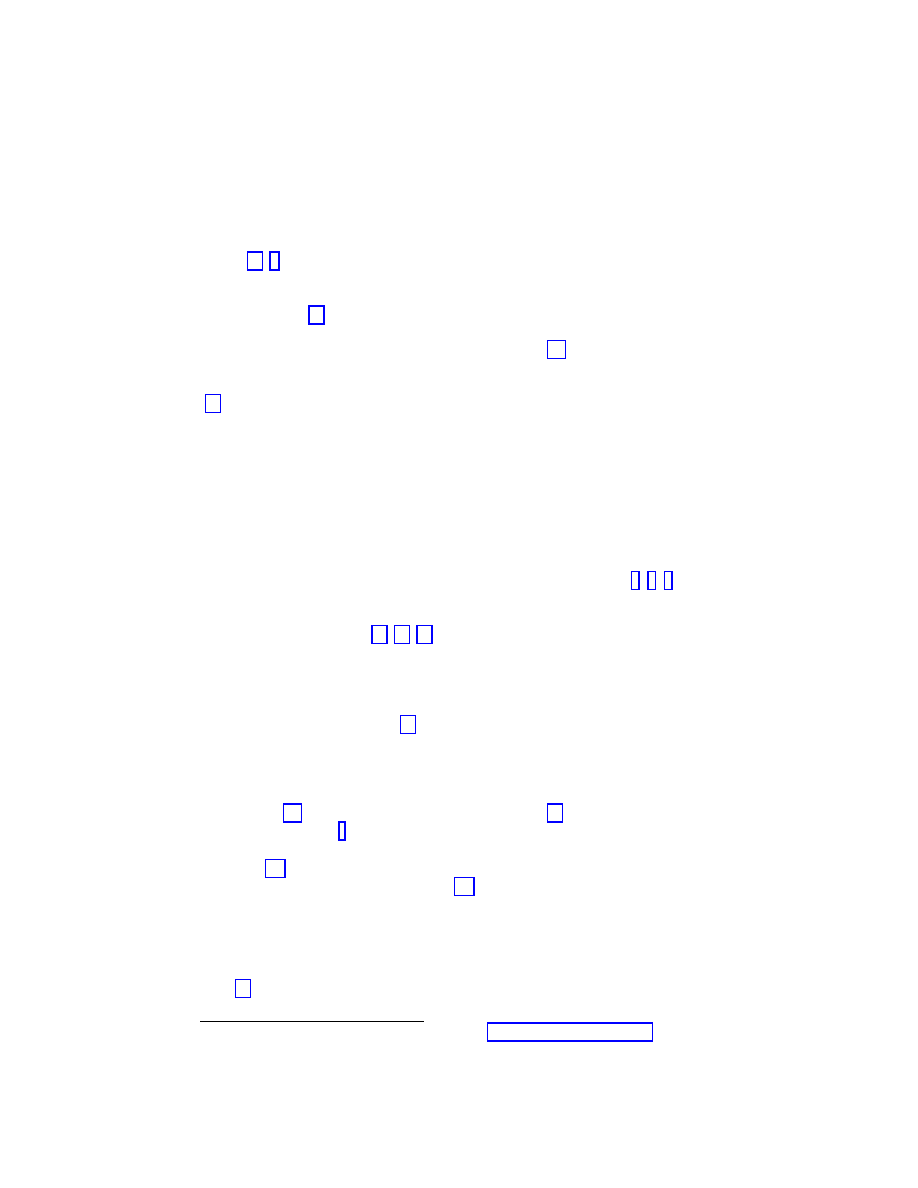
birth. Figure 1.2 reproduces the results reported in Ref. [15], obtained from prevalence data
from the Virus Bulletin
in the period February 1996 to March 2000, covering a time interval
of 50 months.
Figure 1.2 shows that the surviving probability suffers a sharp drop in the first two months
of a virus’ life. On the other hand, Figure 1.2 also shows for larger times a clean exponential
tail,
P
s
(t) ∼ exp(−t/τ ),
(1.7)
where
τ represents the characteristic life-time of the virus strain. The numerical fit of the
data [15] yields
τ ≃ 14 months for boot and macro viruses and τ ≃ 6 − 9 months for file
viruses.
1
Virus prevalence data publicly available at the web site
.
1.4
Real data analysis
9
0
10
20
30
t (months)
10
−2
10
−1
10
0
P
s
(t)
boot
file
macro
τ
= 14 months
τ
= 7 months
Figure 1.2: Surviving probability for the three main strands of computer viruses. After a sharp
initial drop, it is clear the presence of an exponential decay, with an associated characteristic
time
τ that depends on the given strand.
When comparing the theoretical picture delivered by the SIS model on homogeneous net-
works with the behavior observed in real computer viruses, one is faced with an unexpected
and paradoxical conclusion. First of all, the extremely low prevalence shown by endemic
viruses is only compatible with the phase diagram sketched in Figure 1.1 in the very unlikely
chance that all surviving viruses are constructed such that their respective spreading rate
λ
is tuned infinitesimally close to
λ
c
, above the epidemic threshold. On the other hand, the
characteristic life times observed in the analysis of the surviving probability of the different
virus strains are impressively large if compared with the interval in which anti-virus software
is available on the market (usually within days or weeks after the first incident report) and
corresponds to the occurrence of metastable endemic states. Such a long lifetime on the scale
of the typical spread/recovery rates would suggest an effective spreading rate larger than the
epidemic threshold, which is in contradiction with the always low prevalence levels of com-
puter viruses but in the case of an unrealistic tuning of all viruses to the system epidemic
threshold. In summary, the comparison with the known experimental data points out that the
view obtained so far with the modeling of computer viruses is very instructive, but fails to
represent, even at a qualitative level, the nature of the real phenomenon. The explanation of
this discrepancy has been claimed to be one of the most important open problems in computer
virus epidemiology [32].
The key point to elucidating the riddle posed by computer viruses resides in the capacity
of many of them to propagate via data exchange with communication protocols (FTP, e-mails,
etc.) [24]. Viruses will spread preferentially to computers which are highly connected to
the outer world and are thus proportionally exchanging more data and information. It is thus
rather intuitive to consider the scale-free Internet connectivity as the effective one on which
the spreading occurs. For instance, this is the case of natural computer viruses which spread
on the topology identified by routers and servers [7, 8, 9]. Apart from the Internet, scale-free
10
1
Epidemics and immunization in scale-free networks
properties emerge also in the world-wide-web [4, 33] and in social networks [34]. The fact that
all virus strains show the same statistical features indicates that very likely all of them spread
on scale-free connectivity patterns. Further and strong support for this conclusion comes from
the recent study of a social network of e-mail exchange within a community of users [35],
which was proven to have a scale-free connectivity, with an exponent close to
2. This finding
has an immediate repercussion on the modeling of worms, whose spreading environment is in
fact given by this kind of network.
The conclusion from the above arguments is that computer viruses spread in a scale-free
network, in which, even though the average connectivity is well defined, the connectivity
fluctuations are unbounded; i.e. there is always a finite probability that a node has a number
of neighbors much larger than the average value. These fluctuations in the connectivity are
the key difference with respect to the epidemic models discussed in homogeneous graphs, and
they must be included in a correct characterization of the system.
1.5
Epidemic spreading in scale-free networks
In order to fully take into account connectivity fluctuations in a analytical description of the
SIS model, we have to relax the homogeneity assumption used for homogeneous networks,
and work instead with the relative density
ρ
k
(t) of infected nodes with given connectivity k;
i.e. the probability that a node with
k links is infected. The dynamical mean-field equations
can thus be written as [15, 16]
dρ
k
(t)
dt
= −ρ
k
(t) + λk [1 − ρ
k
(t)] Θ[{ρ
k
(t)}],
(1.8)
where also in this case we have considered a unitary recovery rate and neglected higher order
terms (
ρ
k
(t) ≪ 1). The creation term considers the probability that a node with k links
is healthy
[1 − ρ
k
(t)] and gets the infection via a connected node. The probability of this
last event is proportional to the infection rate
λ, the real number of connections k, and the
probability
Θ[{ρ
k
(t)}] that any given link points to an infected node. We make the assumption
that
Θ is a function of the partial densities of infected nodes {ρ
k
(t)}. In the steady (endemic)
state, the
ρ
k
are functions of
λ. Thus, the probability Θ becomes also an implicit function of
the spreading rate, and by imposing the stationarity condition
∂
t
ρ
k
(t) = 0, we obtain
ρ
k
=
kλΘ(λ)
1 + kλΘ(λ)
.
(1.9)
This set of equations show that the higher the node connectivity, the higher the probability to
be in an infected state. This inhomogeneity must be taken into account in the computation
of
Θ(λ). The exact calculation of Θ for a general network is a very difficult task. However,
we can exactly compute its value for the case of a random SF network, in which there are no
correlations among the connectivities of the different nodes [15, 16]. Indeed, the probability
that a link points to a node with
s connections is equal to sP (s)/ hki, which yields an average
probability of a link pointing to an infected node
Θ(λ) =
1
hki
X
k
kP (k)ρ
k
.
(1.10)
1.5
Epidemic spreading in scale-free networks
11
Since
ρ
k
is on its turn a function of
Θ(λ), we obtain a self-consistency equation that allows
to find
Θ(λ) and an explicit form for Eq. (1.9). Finally, we can evaluate the order parameter
(persistence)
ρ using the relation
ρ =
X
k
P (k)ρ
k
.
(1.11)
The self-consistent Eqs. (1.9) and (1.10) can be approximately solved, in the limit of small
Θ, for any scale-free connectivity distribution [16]. However, we can very easily calculate
the epidemic threshold by just noticing that
λ
c
is the value of
λ above which it is possible
to obtain a nonzero solution for
Θ. In fact, from Eqs. (1.9) and (1.10), we obtain the self-
consistent relation
Θ =
1
hki
X
k
kP (k)
λkΘ
1 + λkΘ
,
(1.12)
where
Θ is now a function of λ alone [15, 16]. The solution Θ = 0 is always satisfying the
consistency equation. A non-zero stationary prevalence (
ρ
k
6= 0) is obtained when the right-
hand-side and the left-hand-side of Eq. (1.12), expressed as function of
Θ, cross in the interval
0 < Θ ≤ 1, allowing a nontrivial solution. It is easy to realize that this corresponds to the
inequality
d
dΘ
1
hki
X
k
kP (k)
λkΘ
1 + λkΘ
!
Θ=0
≥ 1
(1.13)
being satisfied. The value of
λ yielding the equality in Eq. (1.13) defines the critical epidemic
threshold
λ
c
, that is given by
P
k
kP (k)λ
c
k
hki
=
k
2
hki
λ
c
= 1
⇒
λ
c
=
hki
hk
2
i
.
(1.14)
This results implies that in SF networks with connectivity exponent
2 < γ ≤ 3, for which
k
2
→ ∞ in the limit of a network of infinite size, we have λ
c
= 0.
1.5.1
Analytic solution for the Barab´asi-Albert network
In order to discuss in detail a specific example, it is simpler to consider a toy model of SF
network, which is easy to generate for simulation purposes and shows the correct connectivity
properties. The paradigmatic example of SF network is the Barab´asi and Albert (BA) model
[4, 36, 5]. The construction of the BA graph starts from a small number
m
0
of disconnected
nodes; every time step a new vertex is added, with
m links that are connected to an old node i
with probability
Π(k
i
) =
k
i
P
j
k
j
,
(1.15)

12
1
Epidemics and immunization in scale-free networks
where
k
i
is the connectivity of the
i-th node. This algorithm implements the so-called “rich-
get-richer” paradigm [4], that implies that highly connected nodes have always larger chances
to become even more connected. The networks generated this way have a connectivity distri-
bution
P (k) ∼ k
−
3
.
In the explicit calculations for the BA model, we use a continuous
k approximation that
allows the practical substitution of series with integrals [4]. The full connectivity distri-
bution is thus given by
P (k) = 2m
2
k
−
3
. By noticing that the average connectivity is
hki =
R
∞
m
kP (k)dk = 2m, Eq. (1.10) gives
Θ(λ) = mλΘ(λ)
Z
∞
m
1
k
dk
1 + kλΘ(λ)
= mλΘ(λ) log
1 +
1
mλΘ(λ)
,
(1.16)
which yields the solution
Θ(λ) =
e
−
1
/mλ
λm
(1 − e
−
1
/mλ
)
−
1
.
(1.17)
In order to find the behavior of the density of infected nodes we have to solve Eq. (1.11), that
reads as
ρ = 2m
2
λΘ(λ)
Z
∞
m
1
k
2
dk
1 + kλΘ(λ)
= 2m
2
λΘ(λ)
1
m
+ λΘ(λ) log
1 +
1
mλΘ(λ)
.
(1.18)
By substituting the obtained expression for
Θ(λ) we find at lowest order in λ
ρ ∼ 2e
−
1
/mλ
(1.19)
This result shows the absence of any epidemic threshold or critical point in the model; i.e.,
λ
c
= 0, in agreement with the result from Eq. (1.14) for a scale-free network with
k
2
= ∞.
Numerical simulations of the SIS model performed on a BA network confirm the analytical
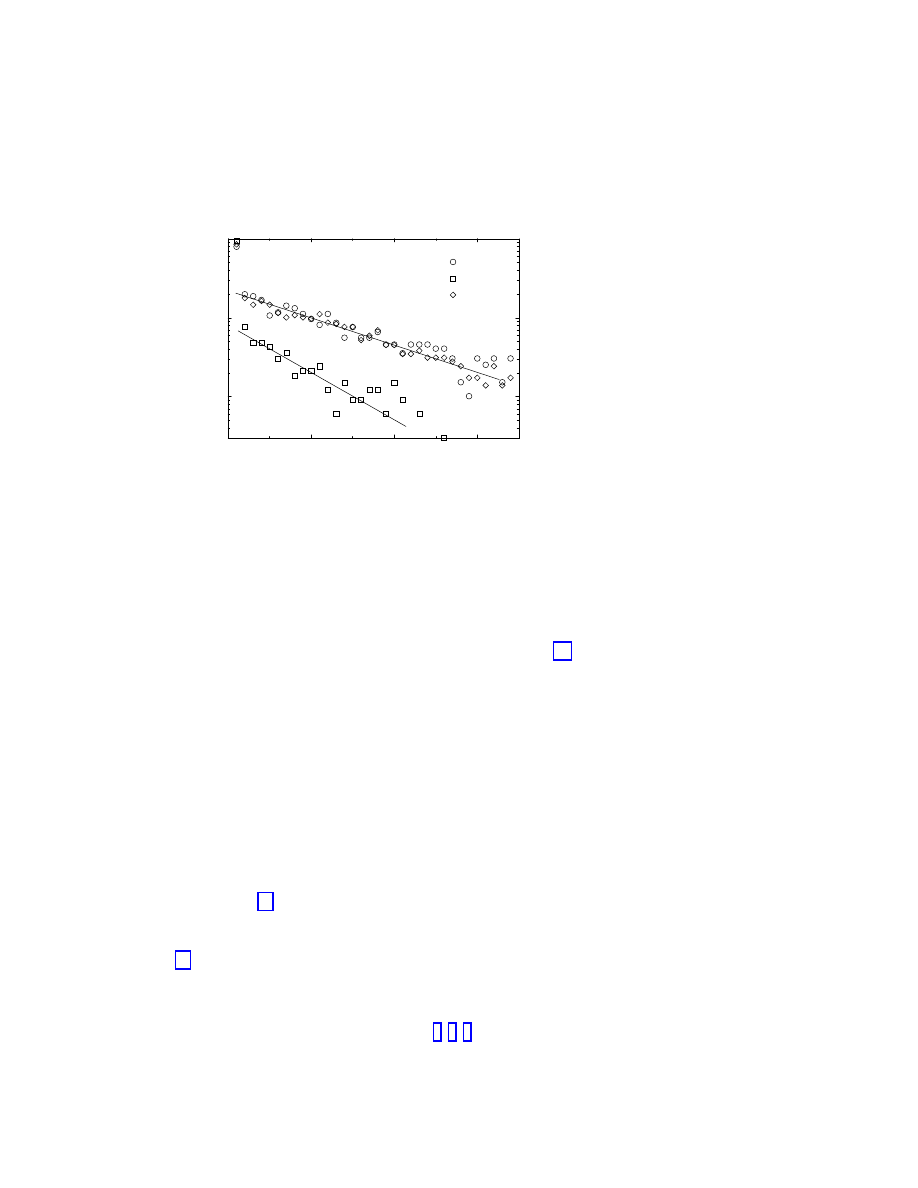
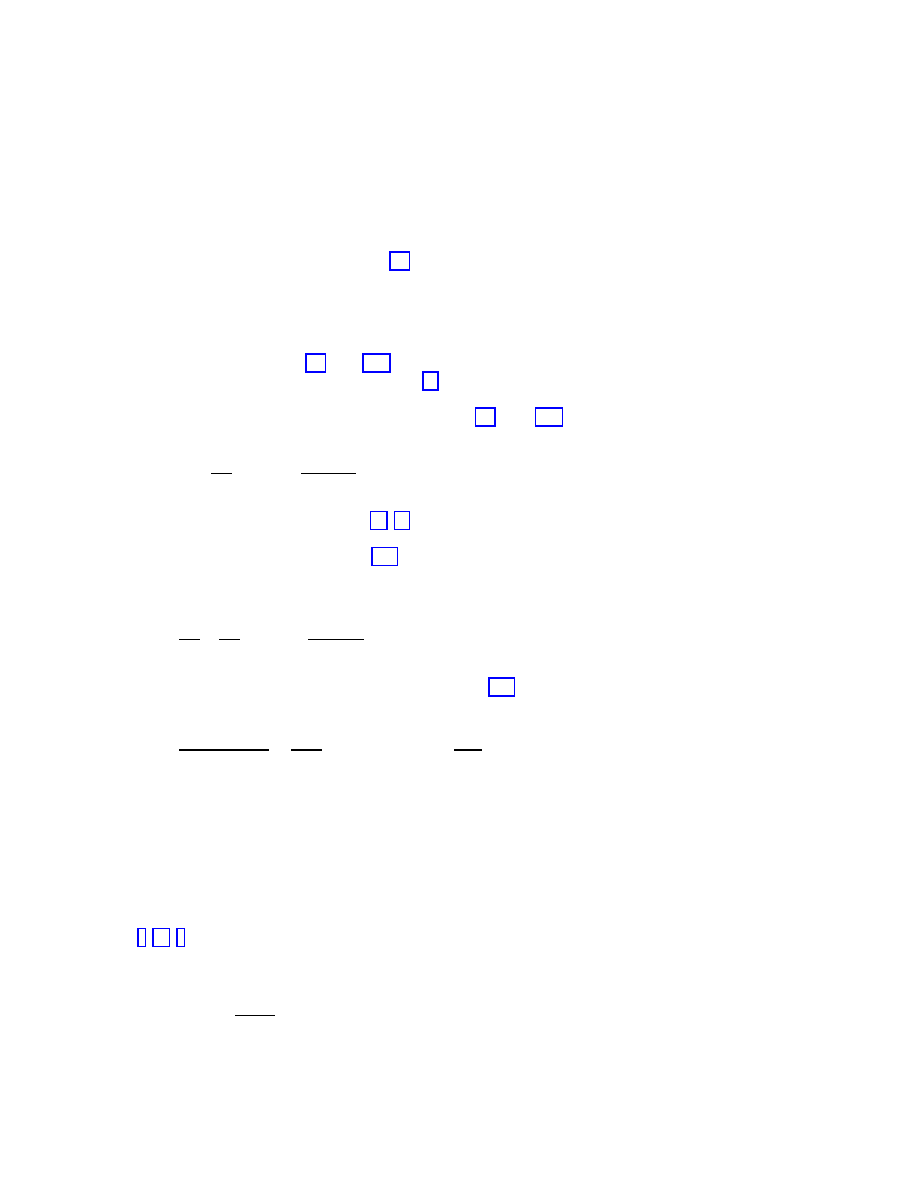
picture extracted from the mean-field analysis. Figure 1.3 shows the total prevalence
ρ in
the steady state as a function of the spreading rate
λ [16]. As we can observe, it approaches
zero in a continuous and smooth way, compatible with the presence of a vanishing epidemic
threshold (see for comparison the behavior expected for a homogeneous network, also drawn
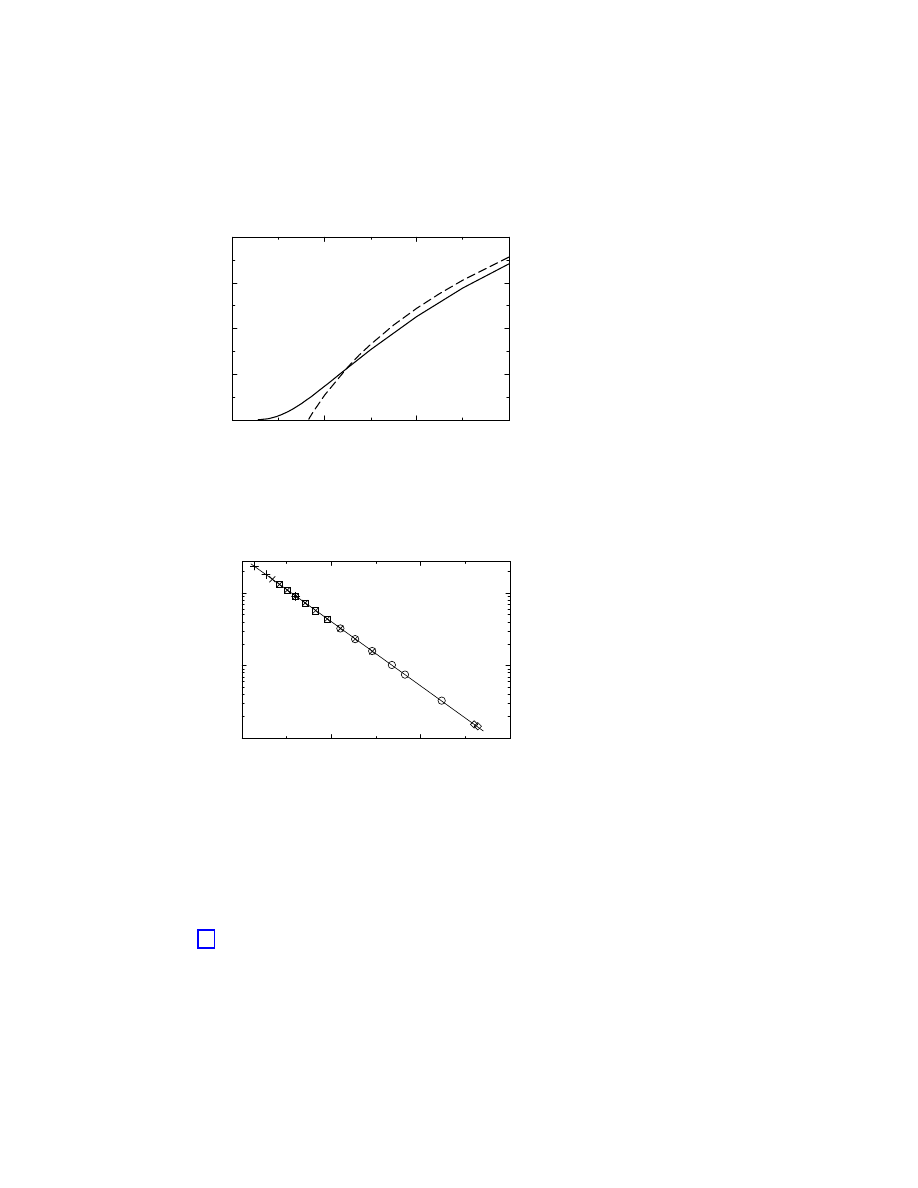
in Figure 1.3). On the other hand, Figure 1.4 represents
ρ in a semilogarithmic plot as a
function of
1/λ, which shows that ρ ∼ exp(−C/λ), where C is a constant independent of the
size
N of the network.
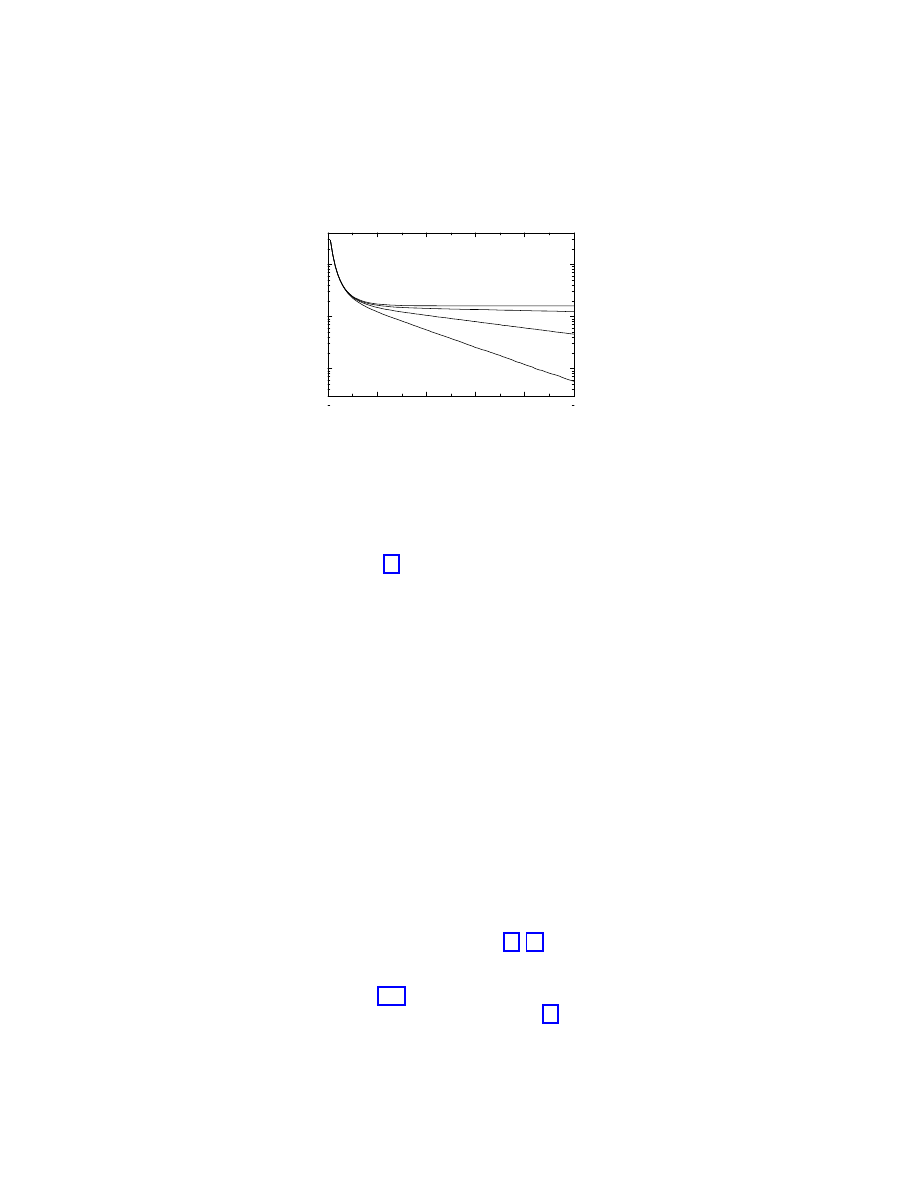
The spreading dynamical properties of the model can also be studied by means of numer-
ical simulations [16]. For example, the surviving probability
P
s
(t) for a fixed value of λ and
different network sizes
N is represented in Figure 1.5. In this case, we recover an exponential
behavior in time, that has its origin in the finite size of the network. In fact, for any finite
system, the epidemic will eventually die out because there is a finite probability that all in-
dividuals cure the infection at the same time. This probability is decreasing with the system
size and the lifetime is infinite only in the thermodynamic limit
N → ∞. However, the life-
time becomes virtually infinite (the metastable state has a lifetime too long for our observation
window) for large enough sizes that depend upon the spreading rate
λ. This is a well-known
1.5
Epidemic spreading in scale-free networks
13
0.0
0.2
0.4
0.6
0.0
0.1
0.2
0.3
0.4
Figure 1.3: Total prevalence
ρ for the SIS model in a BA network (full line) as a function of the
spreading rate
λ, compared with the theoretical prediction for a homogeneous network (dashed
line).
7
12
17
22
10
−4
10
−3
10
−2
1=
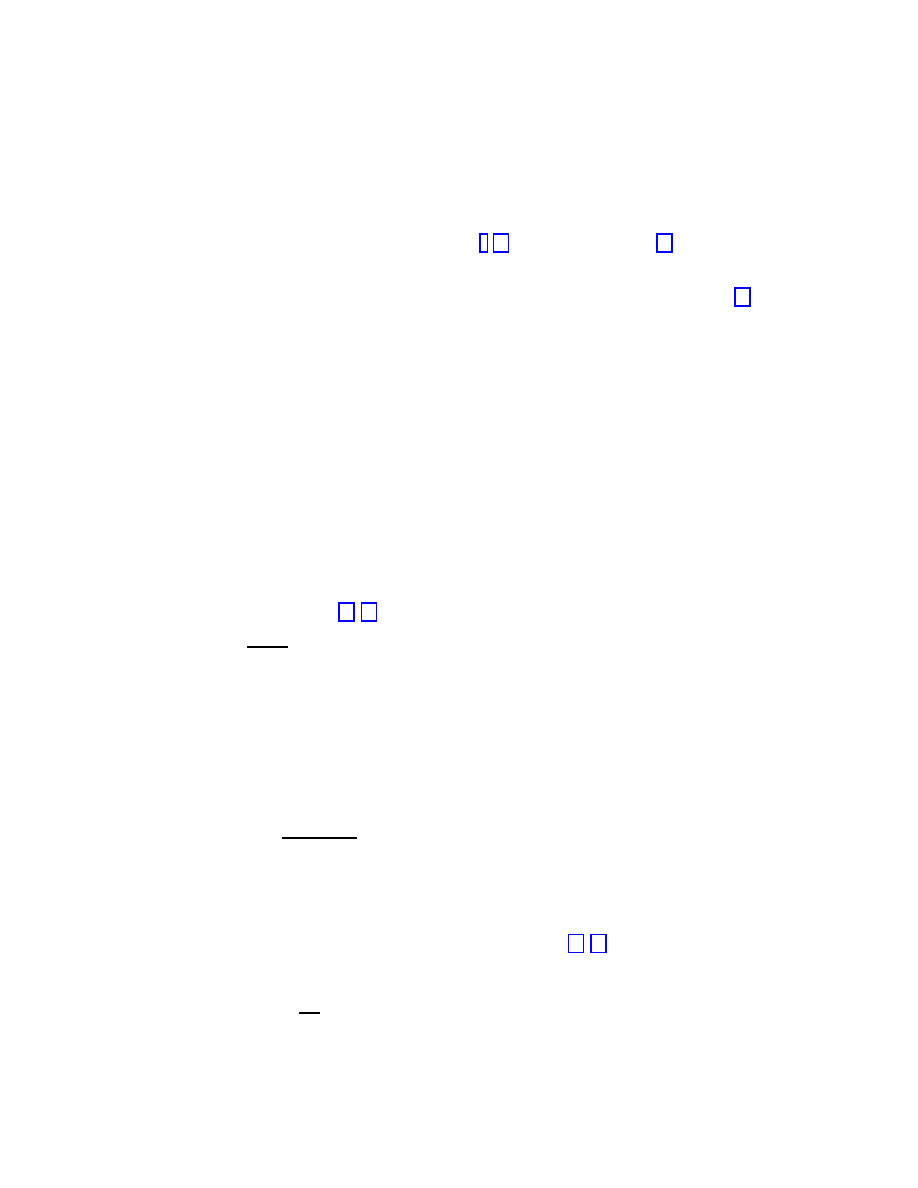
Figure 1.4: Persistence
ρ as a function of 1/λ for BA networks of different sizes: N = 10
5
(
+), N = 5 × 10
5
(2), N = 10
6
(×), N = 5 × 10
6
(◦), and N = 8.5 × 10
6
(3). The linear
behavior on the semi-logarithmic scale proves the stretched exponential behavior predicted for
the persistence. The full line is a fit to the form
ρ ∼ exp(−C/λ).
feature of the survival probability in finite size absorbing-state systems poised above the crit-
ical point [30]. In our case, this picture is confirmed by numerical simulations that show that
the average lifetime of the survival probability is increasing with the network size for all the
values of
λ.
The outcome of the analysis presented in this section is that the SIS model in a BA scale-
free network, with connectivity distribution
P (k) ∼ k
−
γ
and connectivity exponent
γ = 3,
yields the absence of any epidemic threshold or critical point,
λ
c
= 0. It is worth remarking
14
1
Epidemics and immunization in scale-free networks
0
20
40
60
80
100
10
−3
10
−2
10
−1
t
P
s
(t)
Figure 1.5: Surviving probability
P
s
(t) as a function of time in supercritical spreading ex-
periments in the BA network.
Spreading rate
λ = 0.065. Network sizes ranging from
N = 6.25 × 10
3
to
N = 5 × 10
5
(bottom to top).
that the present framework can be generalized to networks with
2 < γ ≤ 3, recovering
qualitatively the same results [16]. Only for
γ > 4, epidemics on SF networks have the same
properties as on homogeneous networks. The emerging picture for epidemic spreading in
scale-free networks emphasizes the role of topology in epidemic modeling. In particular, the
absence of epidemic threshold and the associated critical behavior in a wide range of scale-free
networks provide an unexpected result that radically changes many standard conclusions on
epidemic spreading. This indicates that infections can proliferate on these scale-free networks
whatever spreading rates they may have. These very bad news are, however, balanced by the
exponentially small prevalence for a wide range of spreading rates (
λ ≪ 1). This picture
fits perfectly with the observations from real data, and solve the long-standing mystery of the
generalized low prevalence of computer viruses without assuming any global tuning of the
spreading rates. In addition, the model explains successfully the exponential time decay of the
virus surviving probability, with an average lifetime of viral strains that appears to be related
to an effective spreading rate and the network size.
1.5.2
Finite size scale-free networks
Real systems are actually made up by a finite number of individuals which is far from the ther-
modynamic limit. This finite population introduces a maximum connectivity
k
c
, depending
on
N , which has the effect of restoring a bound in the connectivity fluctuations, inducing in
this way an effective nonzero threshold. More generally, we can consider bounded scale-free
networks in which the connectivity distribution has the form
P (k) ∼ k
−
γ
f (k/k
c
), where the
function
f (x) decreases very rapidly for x > 1 [37, 38]. The cut-off k
c
can be due to the
finite size of the network or to the presence of constraints limiting the addition of new links
in an otherwise infinite networks. In both cases,
k
2
assumes a finite value in bounded SF
networks, defining from Eq. (1.14) an effective nonzero threshold due to finite size effects as
usually encountered in nonequilibrium phase transitions [30]. This epidemic threshold, how-
ever, is not an intrinsic quantity as in homogeneous systems and it vanishes for a increasing
1.5
Epidemic spreading in scale-free networks
15
10
2
10
3
10
4
10
−2
10
−1
10
0
k
=m
(
k
)
=
H
=
2:8
=
2:5
=
2:2
Figure 1.6: Ratio between the effective epidemic threshold in bounded SF networks with expo-
nential cut-off
k
c
and the intrinsic epidemic threshold of homogeneous networks with the same
average connectivity, for different values of
γ.
network size or connectivity cut-off. Explicit calculations can be performed for the SIS model
[39] in SF networks with exponentially bounded connectivity,
P (k) ∼ k
−
γ
exp(−k/k
c
), ob-
taining that the effective nonzero epidemic threshold
λ
c
(k
c
) induced by the cut-off k
c
behaves
as
λ
c
(k
c
) ≃ (k
c
/m)
γ−3
,
(1.20)
where
m is the smallest connectivity in the graph. The limit γ → 3, on the other hand, cor-
responds to a logarithmic divergence, yielding at leading order
λ
c
(k
c
) ≃ (m ln(k
c
/m))
−
1
.
In all cases we have that the epidemic threshold vanishes when increasing the characteristic
cut-off. It is thus interesting to compare the intrinsic epidemic threshold obtained in homo-
geneous networks with negligible fluctuations and the nonzero effective threshold of bounded
SF networks. The intrinsic epidemic threshold of homogeneous networks with constant node
connectivity
hki is given by λ
H
c
= hki
−
1
[2]. In Fig. 1.6 we report the ratio obtained by using
the full expression for
λ
c
(k
c
). It is striking to observe that, even with relatively small cut-offs
(
k
c
∼ 10
2
− 10
3
), for
γ ≈ 2.5 the effective epidemic threshold of finite size SF networks
is smaller by a factor close to
1/10 than the intrinsic threshold obtained on homogeneous
networks. This implies that the SF networks weakness to epidemic agents is also present
in finite-size and connectivity-bounded networks. Using the homogeneity assumption in the
case of SF networks will lead to a serious over-estimate of the epidemic threshold even for
relatively small networks.

16
1
Epidemics and immunization in scale-free networks
1.6
Immunization of scale-free networks
As we have seen in Section 1.5, epidemic processes in SF networks do not possess, in the limit
of an infinitely large network, an epidemic threshold below which diseases cannot set into an
endemic state. SF networks are in this sense very prone to the spreading and persistence of
infections, whatever virulence (parametrized by the spreading rate
λ) the infective agent might
possess. In view of this weakness, it becomes a major task to find optimal immunization
strategies oriented to minimize the risk of epidemic outbreaks in SF networks.
1.6.1
Uniform immunization
The simplest immunization procedure one can consider consists in the random introduction of
immune individuals in the population [3], in order to get a uniform immunization density. In
this case, for a fixed spreading rate
λ, the relevant control parameter in the density of immune
nodes present in the network, the immunity
g. At the mean-field level, the presence of a
uniform immunity will have the effect of reducing the spreading rate
λ by a factor 1 − g; i.e.
the probability of finding and infecting a susceptible and nonimmune node will be
λ(1 − g).
For homogeneous networks we can easily see that, for a constant
λ, the stationary prevalence
is given in this case by
ρ
g
=
0
if
g > g
c
,
(1.21)
ρ
g
=
(g
c
− g)/(1 − g)
if
g ≤ g
c
,
(1.22)
where
g
c
is the critical immunization value above which the density of infected individuals in
the stationary state is null and depends on
λ as
g
c
= 1 −
λ
c
λ
.
(1.23)
Thus, for a uniform immunization level larger than
g
c
, the network is completely protected
and no large epidemic outbreaks are possible. On the contrary, uniform immunization strate-
gies on SF networks are totally ineffective. The presence of uniform immunization is able to
locally depress the infection’s prevalence for any value of
λ, but it does so too slowly, and it
is impossible to find any critical fraction of immunized individuals that ensures the infection
eradication. After a moment’s reflection, one can convince oneself of the reason of this fail-
ure: With the uniform immunization strategy we are giving the same weight to very connected
nodes (with the largest infection potential) and to nodes with a very small connectivity (which
are relatively safe). Due to the large fluctuations in the connectivity, heavily connected nodes,
which are statistically very significant, can overcome the effect of the immunization and main-
tain the endemic state. On the other hand, the absence of an epidemic threshold (
λ
c
= 0) in
the thermodynamic limit implies that whatever rescaling
λ → λ(1 − g) of the spreading rate
does not eradicate the infection except the case
g = 1. Indeed, by inserting Eq. (1.14) into
Eq. (1.23) we have that the immunization threshold is given by
1 − g
c
=
1
λ
hki
hk
2
i
.
(1.24)
1.6
Immunization of scale-free networks
17
In SF networks with
k
2
→ ∞ only a complete immunization of the network (i.e. g
c
= 1)
ensures an infection-free stationary state. The fact that uniform immunization strategies are
less effective has been noted in several cases of spatial heterogeneity [3]. In SF networks we
face a limiting case due to the extremely high (virtually infinite) heterogeneity in the connec-
tivity properties. Specifically, it follows from Eq. (1.19) that the SIS model on the BA network
shows for
g ≃ 1 and any λ the prevalence
ρ
g
≃ 2 exp[−1/mλ(1 − g)].
(1.25)
In other words, the infection always reaches an endemic state if the network size is large
enough (see Fig. 1.7(a)). This fact points out the absence of an immunization threshold; SF
networks are weak in face of infections, also after massive uniform vaccination campaigns.
1.6.2
Targeted immunization
We have seen in Section 1.6.1 that the very peculiar nature of SF networks hinders the ef-
ficiency of naive uniform immunization strategies. However, we can take advantage of the
heterogeneity of SF networks, by devising an immunization strategy that takes into account
the inherent hierarchy in the network’s nodes. In fact, it has been shown that SF networks
posses a noticeable resilience to random connection failures [40, 41, 42], which implies that
the network can resist a high level of damage (disconnected links), without loosing its global
connectivity properties; i.e. the possibility to find a connected path between almost any two
nodes in the system. At the same time, SF networks are strongly affected by selective damage;
if a few of the most connected nodes are removed, the network suffers a dramatic reduction of
its ability to carry information [40, 41, 42]. Applying this argument to the case of epidemic
spreading, we can devise a targeted immunization scheme in which we progressively make
immune the most highly connected nodes, i.e., the ones more likely to spread the disease.
While this strategy is the simplest solution to the optimal immunization problem in heteroge-
neous populations [3], its efficiency is comparable to the uniform strategies in homogeneous
networks with finite connectivity variance. In SF networks, on the contrary, it produces an ar-
resting increase of the network tolerance to infections at the price of a tiny fraction of immune
individuals.
We can make an approximate calculation of the immunization threshold in the case of
a random SF network [20]. Let us consider the situation in which a fraction
g of the indi-
viduals with the highest connectivity have been successfully immunized. This corresponds,
in the limit of a large network, to the introduction an upper cut-off
k
t
—which is obviously
an implicit function of the immunization
g—, such that all nodes with connectivity k > k
t
are immune. The introduction of immune nodes implies at the same time the elimination of
all the links emanating from them, which translates, in a mean-field approximation, into a
probability
p(g) of deleting any link in the network. This elimination of links yields a new
connectivity distribution, for which all moments can be computed. Recalling Eq. (1.14), we
can then compute the critical fraction
g
c
of immune individuals needed to eradicate the infec-
tion. An explicit calculation for the BA network [20] yields the approximate solution for the
immunization threshold in the case of targeted immunization as
g
c
≃ exp(−2/mλ).
(1.26)
18
1
Epidemics and immunization in scale-free networks
0.0
0.2
0.4
0.6
0.8
0.0
0.2
0.4
0.6
0.8
1.0
Uniform Immunization
Targeted Immunization
a)
g
g
=
o
g
'
0:16
1.0
2.0
3.0
4.0
5.0
6.0
10
−3
10
−2
10
−1
Uniform Immunization
b)
(1
g
)
1
g
=
o
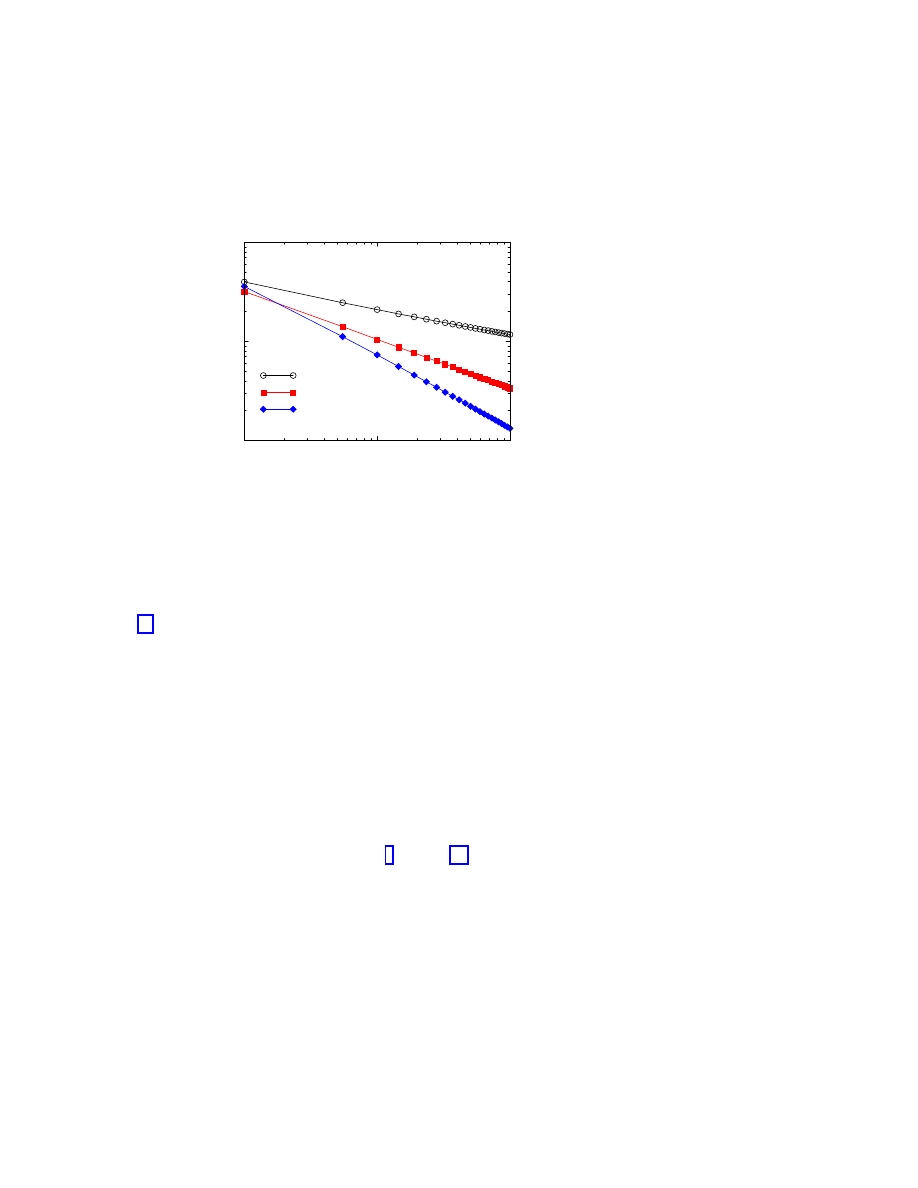
Figure 1.7: a) Reduced prevalence
ρ
g
/ρ
0
from computer simulations of the SIS model in the
BA network with uniform and targeted immunization, at a fixed spreading rate
λ = 0.25. A
linear extrapolation from the largest values of
g yields an estimate of the threshold g
c
≃ 0.16
in BA networks with targeted immunization. b) Check of the predicted functional dependence
ρ
g
∼ exp(−1/mλ(1 − g)) for the SIS model in the BA network with uniform immunization.
This clearly indicates that the targeted immunization program is extremely convenient in SF
networks where the critical immunization is exponentially small in a wide range of spreading
rates
λ.
In order to assess the efficiency of the targeted immunization scheme we show in Fig. 1.7
the results from numerical simulations of the SIS model on BA networks, together with the
results from simulations with uniform immunization [20]. In particular the plot shows the
reduced prevalence
ρ
g
/ρ
0
, where
ρ
0
is the prevalence in the nonimmunized network, as a
function of the fraction of immunized nodes
g, at a fixed spreading rate λ = 0.25. Fig. 1.7(a)
indicates that, for uniform immunization, the prevalence decays slowly when increasing
g,
and will be effectively null only for
g = 1, as predicted by Eq. (1.25). In fact, the plot in
Fig. 1.7(b) recovers the theoretical predicted behavior Eq. (1.25). On the other hand, for the
targeted immunization, the prevalence shows a very sharp drop and exhibits the onset of an
immunization threshold above which the system in infection-free. A linear regression from
the largest values of
g yields an approximate estimation g
c
≃ 0.16, that definitely proves that
SF networks are very sensitive to the targeted immunization of a very small fraction of the
most connected nodes.
This result can be readily extended to SF networks with arbitrary
γ values, and it is also
possible to devise alternative immunization schemes which take advantage of the SF connec-
tivity patterns in order to achieve a high level of tolerance to infections [20]. Other strategies
have been put forward in Ref. [21] by proposing to cure with proportionally higher rates the
most connected nodes. Also in this case it is possible to reintroduce a threshold in the network
with this hub-biased policy for the administered cures.
The present results indicate that the SF networks’ susceptibility to epidemic spreading is
reflected also in an intrinsic difficulty in protecting them with local—uniform—immunization.

1.7
Conclusions
19
On a global level, uniform immunization policies are not satisfactory and only targeted im-
munization strategies successfully lower the vulnerability of SF networks. This evidence rad-
ically changes the usual perspective of the regular epidemiological framework. Spreading
of infectious or polluting agents on SF networks, such as food or social webs, might be con-
trasted only by a careful choice of the immunization procedure. In particular, these procedures
should rely on the identification of the most connected individuals. The protection of just a
tiny fraction of these individuals raises dramatically the tolerance to infections of the whole
population. The computer virus case is once again providing support to this picture. Despite
deployment of antivirus software is timely and capillary, viruses’ lifetimes are extremely long;
in other words, very high levels of immunization are not able to eradicate the epidemic. In the
standard epidemic framework this would be possible only in the case of very high spreading
rate for the virus that is in contradiction with the always small prevalence of epidemic out-
breaks. These empirical findings are, however, in good agreement with the picture obtained
for the immunization of SF networks. In fact, the antivirus deployment is not eradicating the
epidemics on the global scale since it is alike to a random immunization process where file
scanning and antivirus updating are statistically left to the good will of users and system man-
agers. Needless to say, from the point of view of the single user, antiviruses are extremely
important, being the only way to ensure local protection for the computer.
1.7
Conclusions
The topology of the network has a great influence in the overall behavior of epidemic spread-
ing. The connectivity fluctuations of the network play a major role by strongly enhancing the
infection’s incidence. This issue assumes a particular relevance in the case of SF networks
that exhibit connectivity fluctuations diverging with the increasing size
N of the web. Here
we have reviewed the new epidemiological framework obtained in population networks char-
acterized by a scale-free connectivity pattern. SF networks are very weak in face of infections,
presenting an effective epidemic threshold that is vanishing in the limit
N → ∞. In an infi-
nite population this corresponds to the absence of any epidemic threshold below which major
epidemic outbreaks are impossible. SF networks’ susceptibility to epidemic spreading is re-
flected also in an intrinsic difficulty in protecting them with local—uniform—immunization
policies. Only targeted immunization procedures achieve the desired lowering of epidemic
outbreaks and prevalence.
The present picture qualitatively fits the observations from real data of computer virus
spreading, and could solve the long standing problem of the generalized low prevalence and
long lifetime of computer viruses without assuming any global tuning of the spreading rates.
Moreover, recent findings on the web of human sexual contacts [12] prompt that the presented
results could have potentially interesting implications also in the case of human sexual disease
control.
In order to illustrate the new features of epidemic spreading in SF networks, we used the
SIS model. It is important to stress, however, that the analysis on SF networks of different
models, such as the SIR model, confirm the presented epidemiological picture [17, 18, 19].
Yet, many other ingredients concerning the infection mechanisms should be considered in a
more realistic representation of real epidemics [3, 2]. In addition, simple rules defining the

20
1
Epidemics and immunization in scale-free networks
temporal patterns of the networks, such as the frequency of forming new connections, the
actual time that a connection exists, or different types of connections, should be included in
the modeling. These dynamical features are highly valuable experimental inputs which are
necessary ingredients in the use of complex networks theory in epidemic modeling.
Acknowledgements
This work has been partially supported by the European Network Contract No. ERBFM-
RXCT980183 and by the European Commission - Fet Open project COSIN IST-2001-33555.
R.P.-S. acknowledges financial support from the Ministerio de Ciencia y Tecnolog´ıa (Spain).
References
[1] N. T. J. Bailey, The mathematical theory of infectious diseases, (Griffin, London, 1975).
2nd edition.
[2] O. Diekmann and J.A.P Heesterbeek, Mathematical epidemiology of infectious diseases:
model building, analysis and interpretation, (John Wiley & Sons, New York, 2000).
[3] R. M. Anderson and R. M. May, Infectious diseases in humans, (Oxford University
Press, Oxford, 1992).
[4] A.-L. Barab´asi and R. Albert. Emergence of scaling in random networks. Science 286,
509–511 (1999).
[5] S. N. Dorogovtsev, J.F.F. Mendes, and A. N. Samukhin. Structure of growing networks
with preferential linking. Phys. Rev. Lett. 85, 4633–4636 (2000).
[6] R. Albert and A.-L. Barab´asi. Statistical mechanics of complex networks. Rev. Mod.
Phys. 74, 47–97 (2002).
[7] M. Faloutsos, P. Faloutsos, and C. Faloutsos. On power-law relationship of the Internet
topology. Comput. Commun. Rev. 29, 251–263 (1999).
[8] G. Caldarelli, R. Marchetti, and L. Pietronero. The fractal properties of Internet. Euro-
phys. Lett. 52, 386 (2000).
[9] R. Pastor-Satorras, A. V´azquez, and A. Vespignani. Dynamical and correlation proper-
ties of the Internet. Phys. Rev. Lett. 87, 258701 (2001).
[10] S.-H. Yook, H. Jeong, and A.-L. Barab´asi. Modeling the Internet’s large-scale topology,
(2001). e-print cond-mat/0107417.
[11] K.-I. Goh, B. Kahng, and D. Kim. Fluctuation-driven dynamics of the internet topology.
Phys. Rev. Lett 88, 108701 (2002).
[12] F. Liljeros, C. R. Edling, L. A. N. Amaral, H. E. Stanley, and Y. Aberg. The web of
human sexual contacts. Nature 411, 907–908 (2001).
[13] G. Abramson and M. Kuperman. Small world effect in an epidemiological model. Phys.
Rev. Lett. 86, 2909–2912 (2001).
[14] C. Moore and M. E. J. Newman. Epidemics and percolation in small-world networks.
Phys. Rev. E 61, 5678 (2000).

References
21
[15] R. Pastor-Satorras and A. Vespignani. Epidemic spreading in scale-free networks. Phys.
Rev. Lett. 86, 3200–3203 (2001).
[16] R. Pastor-Satorras and A. Vespignani. Epidemic dynamics and endemic states in com-
plex networks. Phys. Rev. E 63, 066117 (2001).
[17] R. M. May and A. L. Lloyd. Infection dynamics on scale-free networks. Phys. Rev. E
64, 066112 (2001).
[18] Y. Moreno, R. Pastor-Satorras, and A. Vespignani. Epidemic outbreaks in complex het-
erogeneous networks. Eur. Phys. J. B 26, 521–529 (2002).
[19] M. E. J. Newman. Exact solutions of epidemic models on networks, (2001). e-print
[20] R. Pastor-Satorras and A. Vespignani. Immunization of complex networks. Phys. Rev. E
65, 036104 (2001).
[21] Z. Dezs¨o and A.-L. Barab´asi. Halting viruses in scale-free networks, (2001). e-print
[22] S. M. Bellovin. Packets found on an Internet. Comput. Commun. Rev. 23, 26–31 (1993).
[23] C. D. Harley, R. Slade, D. Harley, E. H. Spafford, and U E. Gattiker, Viruses Revealed,
(McGraw-Hill, New York, 2001).
[24] J. O. Kephart, G. B. Sorkin, D. M. Chess, and S. R. White. Fighting computer viruses.
Scientific American 277(5), 56–61 November (1997).
[25] J. O. Kephart and S. R. White. Directed-graph epidemiological models of computer
viruses. In Proceedings of the 1991 IEEE computer society symposium on research in
security and privacy (SSP ’91), 343–361 (IEEE, Washington - Brussels - Tokyo, 1991).
[26] J. O. Kephart, S. R. White, and D. M. Chess. Computers and epidemiology. IEEE
Spectrum 30, 20–26 (1993).
[27] G. Chartrand and L. Lesniak, Graphs & digraphs, (Wadsworth & Brooks/Cole, Menlo
Park, 1986).
[28] P. Erd ¨os and P. R´enyi. On the evolution of random graphs. Publ. Math. Inst. Hung. Acad.
Sci. 5, 17–60 (1960).
[29] D. J. Watts and S. H. Strogatz. Collective dynamics of ‘small-world’ networks. Nature
393, 440–442 (1998).
[30] J. Marro and R. Dickman, Nonequilibrium phase transitions in lattice models, (Cam-
bridge University Press, Cambridge, 1999).
[31] J. O. Kephart and S. R. White. Measuring and modeling computer virus prevalence.
In Proceedings of the 1993 IEEE computer society symposium on security and privacy
(SSP ’93), 2–15 (IEEE, Washington - Brussels - Tokyo, 1993).
[32] S.
R.
White.
Open
problems
in
computer
virus
research.
Virus
Bulletin
Conference,
Munich,
October
(1998).
Available
on-line
at
http://www.av.ibm.com/ScientificPapers/White/Problems/Problems.html.
[33] R. Albert, H. Jeong, and A.-L. Barab´asi. Diameter of the world-wide web. Nature 401,
130–131 (1999).
[34] S. Wasserman and K. Faust, Social network analysis, (Cambridge University Press, Cam-
bridge, 1994).

22
1
Epidemics and immunization in scale-free networks
[35] H. Ebel, L.-I. Mielsch, and S. Bornholdt. Scale-free topology of e-mail networks, (2002).
e-print cond-mat/0201476.
[36] A.-L. Barab´asi, R. Albert, and H. Jeong. Mean-field theory for scale-free random net-
works. Physica A 272, 173–187 (1999).
[37] L. A. N. Amaral, A. Scala, M. Barth´el´emy, and H. E. Stanley. Classes of small-world
networks. Proc. Natl. Acad. Sci. USA 97, 11149–11152 (2000).
[38] S. N. Dorogovtsev and J. F. F. Mendes. Evolution of networks. Advances in Physics 51,
1079–1187 (2002).
[39] R. Pastor-Satorras and A. Vespignani. Epidemic dynamics in finite size scale-free net-
works. Phys. Rev. E 65, 035108 (2002).
[40] R. A. Albert, H. Jeong, and A.-L. Barab´asi. Error and attack tolerance of complex
networks. Nature 406, 378–382 (2000).
[41] D. S. Callaway, M. E. J. Newman, S. H. Strogatz, and D. J. Watts. Network robustness
and fragility: percolation on random graphs. Phys. Rev. Lett. 85, 5468–5471 (2000).
[42] R. Cohen, K. Erez, D. ben Avraham, and S. Havlin. Breakdown of the Internet under
intentional attack. Phys. Rev. Lett. 86, 3682–3685 (2001).
Wyszukiwarka
Podobne podstrony:
Epidemic Profiles and Defense of Scale Free Networks
Halting viruses in scale free networks
2016 Energy scaling and reduction in controling complex network Chen
Infection dynamics on scale free networks
Mobile Multimedia In Context To Atm Transport And Gsm Gprs Mobile Access Networks
ties, leaders and time in teams strong interference about network structure effect on teamt vialibil
Queuing theory based models for studying intrusion evolution and elimination in computer networks
integration and radiality measuring the extent of an individuals connectedness and reachability in a
Networking, Innovation, and Performance in
Worm Epidemics in High Speed Networks
Degradable Polymers and Plastics in Landfill Sites
Estimation of Dietary Pb and Cd Intake from Pb and Cd in blood and urine
Aftershock Protect Yourself and Profit in the Next Global Financial Meltdown
General Government Expenditure and Revenue in 2005 tcm90 41888
A Guide to the Law and Courts in the Empire
D Stuart Ritual and History in the Stucco Inscription from Temple XIX at Palenque
Exile and Pain In Three Elegiac Poems
A picnic table is a project you?n buy all the material for and build in a?y
Economic and Political?velopment in Zimbabwe
więcej podobnych podstron