
“Big Profit Patterns Using Candlestick
Signals And Gaps”
How To Make A Living Trading The Markets By Mastering
Easy To Learn Techniques Hardly Anyone Else Knows About
A Candlestick Forum publication – Years of Candlestick Analysis made
available in concise formats. Information that when learned and
understood will revolutionize and discipline your investment thinking.
Copyright @ by Stephen W. Bigalow 2002
Published by The Candlestick Forum LLC
All rights reserved.

Table of Contents
Powerful Implications of Gaps……………………………………… 3
Gaps at the Bottom…………………………………………………… 5
Measuring Gaps……………………………………………………… 13
Gaps at the Top………………………………………………………. 14
Selling Gaps…..………………………………………………………. 18
Gapping Plays...………………………………………………………. 21
Dumpling Tops and Fry Pan Bottoms………………………………. 23
San-Ku – Three Gaps Up……………………………………………. 27
Breakouts……..………………………………………………………. 31
The J-Hook Pattern..…………………………………………………. 34
Island Reversals………………………………………………………. 39
Bad News Gaps.………………………………………………………. 41
Kicker Signals…………………………………………………………. 45
Summary………………………………………………………………. 50
2

Powerful
Implications of Gaps
How Do They Produce Profits With Candlesticks?
Gaps (Ku) are called windows (Mado) in Japanese Candlestick analysis. A gap or
window is one of the most misunderstood technical messages. Most investment experts
advise not to buy after a gap. This is true only about ten percent of the time. The other
90% of the time, the gaps will reveal powerful high profit trades. Candlestick signals,
correlated with the appearance of gaps, provide valuable profit-making set-ups.
What is the best investment you can make? Simple! Learning investment techniques that
make you independent of having to rely on any other investment consultation. You can
easily learn and quickly master common sense analysis that will dramatically improve
your returns for the rest of your life. You will feel confident in every trade you put on. No
more “hoping” that a trade will move in your direction. The unique built-in forces
encompassed in the candlestick signals and the strength of a move revealed by the
existence of a gap produce powerful trade factors. You can rest easy! Obtaining the
knowledge that this combination of signals reveals will produce consistent and strong
profits.
These are not “hidden” secret signals or newly discovered formulas that are just now
being exposed to the investment world. These are a combination of widely known but
little used investment techniques. Candlestick signals obviously have a statistical basis to
them or they would not still be in existence after all these centuries. Gaps have very
powerful implications. Combining the information of the two produces investment
returns that very few investors take the time to exploit.
Dissecting the implications of a gap/window makes its appearance easy to understand.
Once you understand why a gap occurs at different points in a trend, taking advantage of
what the gaps reveal becomes highly profitable. Where a gap occurs is important. The
ramification of a gap in a chart pattern is an important aspect to Japanese Candlestick
analysis. Some traders make a living trading strictly off of gaps.
Consider what a window or gap represents. In a rising market, it illustrates a price
opening higher than any of the previous day’s trading range. (For illustration in this book,
the “day” will be the representative time frame.) What does this mean in reality? During
the non-market hours, something made owning this stock tremendously desirable. So
desirable that the order imbalance opens the price well above the prior day’s body as well
3
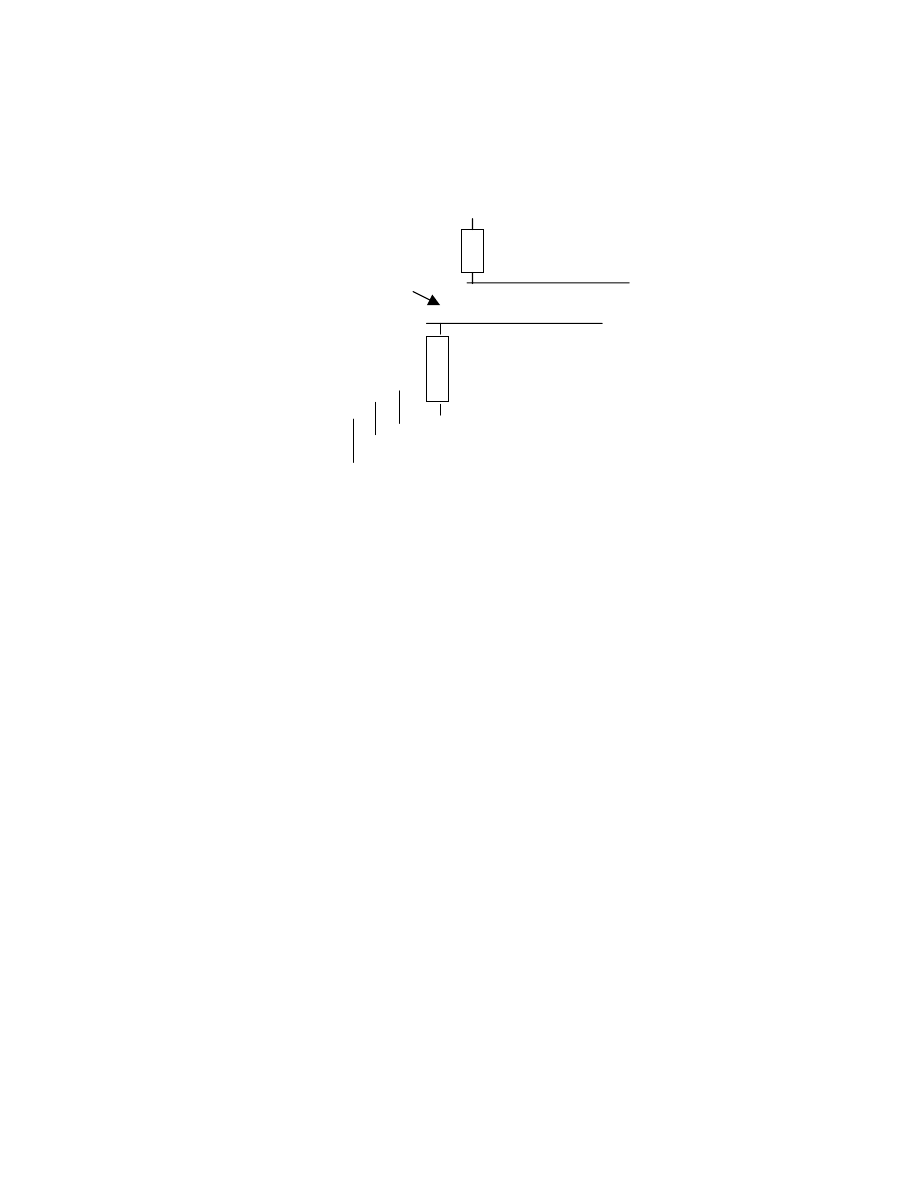
as the high of the previous day’s trading range. As seen in Figure 1, note the space
between the high of the previous day and the low of the following day.
Figure 1 – Illustration of a gap.
Gap
Witnessing a gap or window at the beginning of a new trend produces profitable
opportunities. Seeing the gap formed at the beginning of the trend reveals that upon a
reversal of direction, the buyers have stepped in with a great amount of zeal. A common
scenario is witnessing a prolonged downtrend. A Candlestick signal appears, a Doji or
Harami, Hammer, or any other signal that would indicate that the selling has stopped.
What is required to verify that the downtrend has stopped is more buying the next day.
This can be more solidly verified if the next day has a gap up move.
Many investors are apprehensive about buying a stock that has popped up from the
previous days close. A risky situation! Yet a Candlestick investor has been forewarned
that the trend is going to change, using a signal as that alert. A gap up illustrates that the
force of buying in the new upward trend is going to be strong. The enthusiasm shown by
the buyers trying to get into the stock demonstrates that the new trend should have a
strong move to it. Use that gap as a strength indicator.
Gaps occur in many different places and forms. Some are easy to see, some are harder to
recognize. This book will take you through the different situations where a gap has
appeared. Each situation will be explained in detail, (1) to give you a full understanding
of what is occurring during the move and (2) to provide a visual illustration to become
familiar with the formation, making it easy to recognize. This allows the Candlestick
investor to spot an investment situation as it is developing.
4
Gaps at the Bottom
Knowing that a gap represents an enthusiasm for getting into or out of a stock position
creates the forewarning that a strong profit potential has occurred. Where is the best place
to see rampant enthusiasm? At that point you are buying near the bottom. Obviously,
seeing a potential Candlestick “buy” signal at the bottom of an extended downtrend is a
great place to buy. In keeping with the concepts taught in Candlestick analysis, we want
to be buying stocks that are already oversold to reduce the downside risk. What is better
to see is the evidence that buyers are very anxious to get into the stock.
Reiterating the basics of finding the perfect trades, as found in Mr. Bigalow’s book
“Profitable Candlestick Trading”, having all the stars in alignment makes for better
probabilities of producing a profit. Consider the Housing construction industry mid-
September 2001. The indexes were bottoming out after the 9/11 debacle.
The Housing stocks indicated the best evidence of capital inflow. The initial move to the
upside was evident with a large number of good signals found in those stocks after doing
a scan of the charts. Investors were really liking the residential home builders. This is
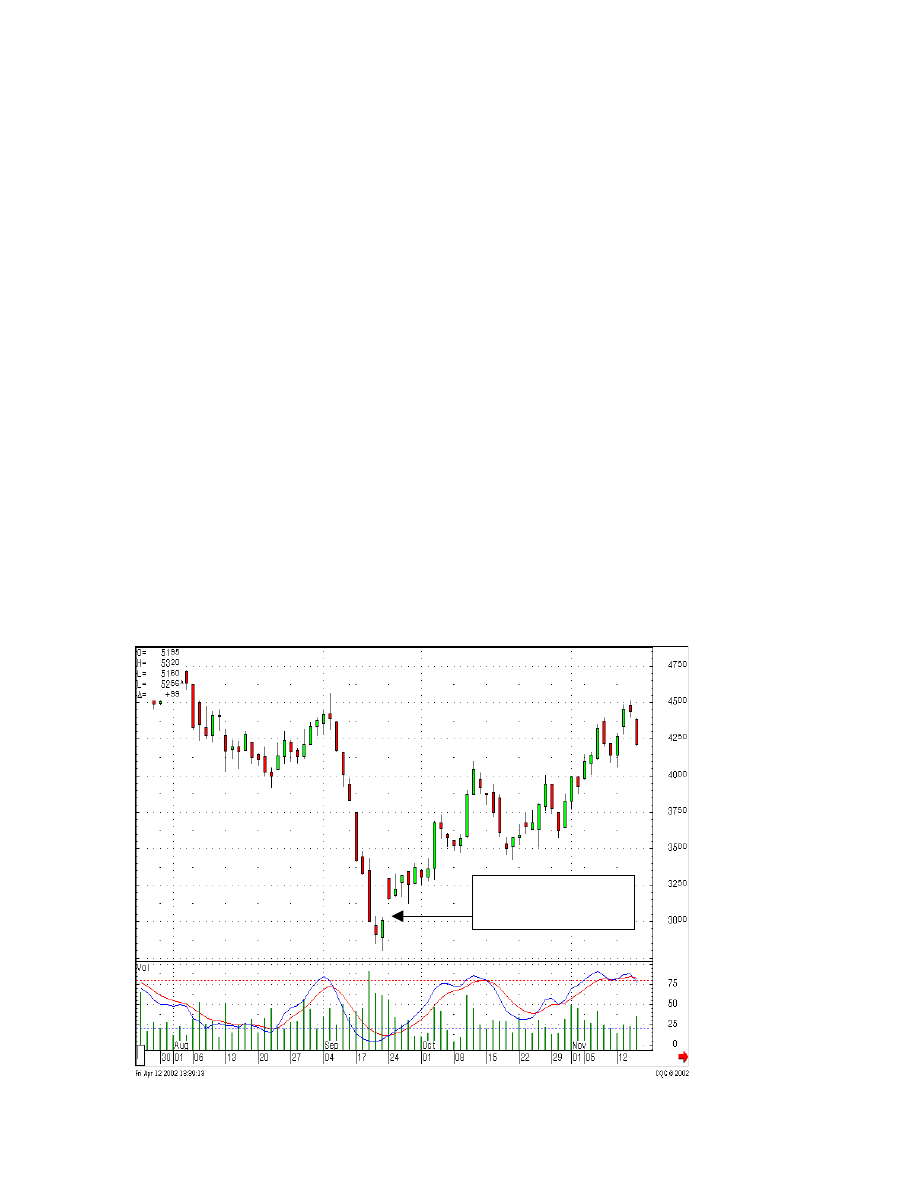
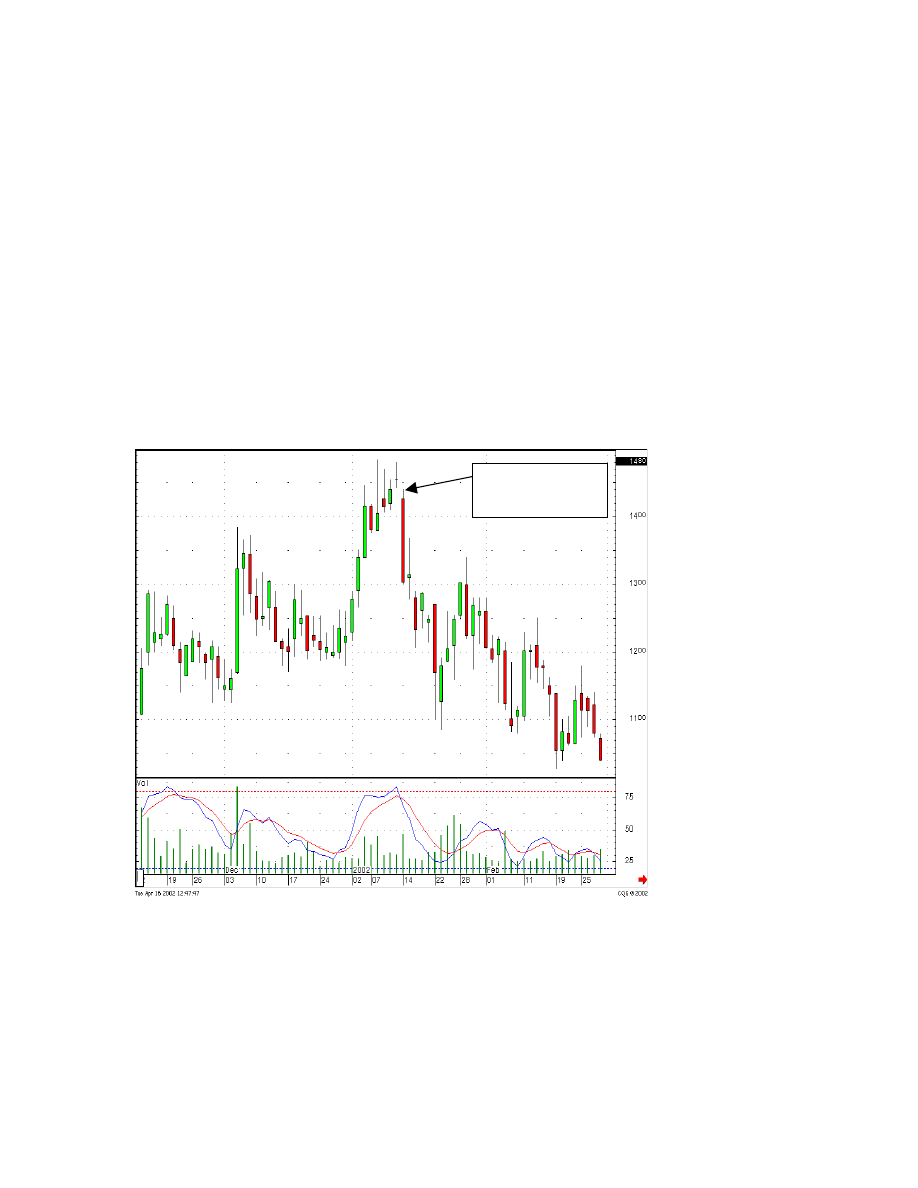
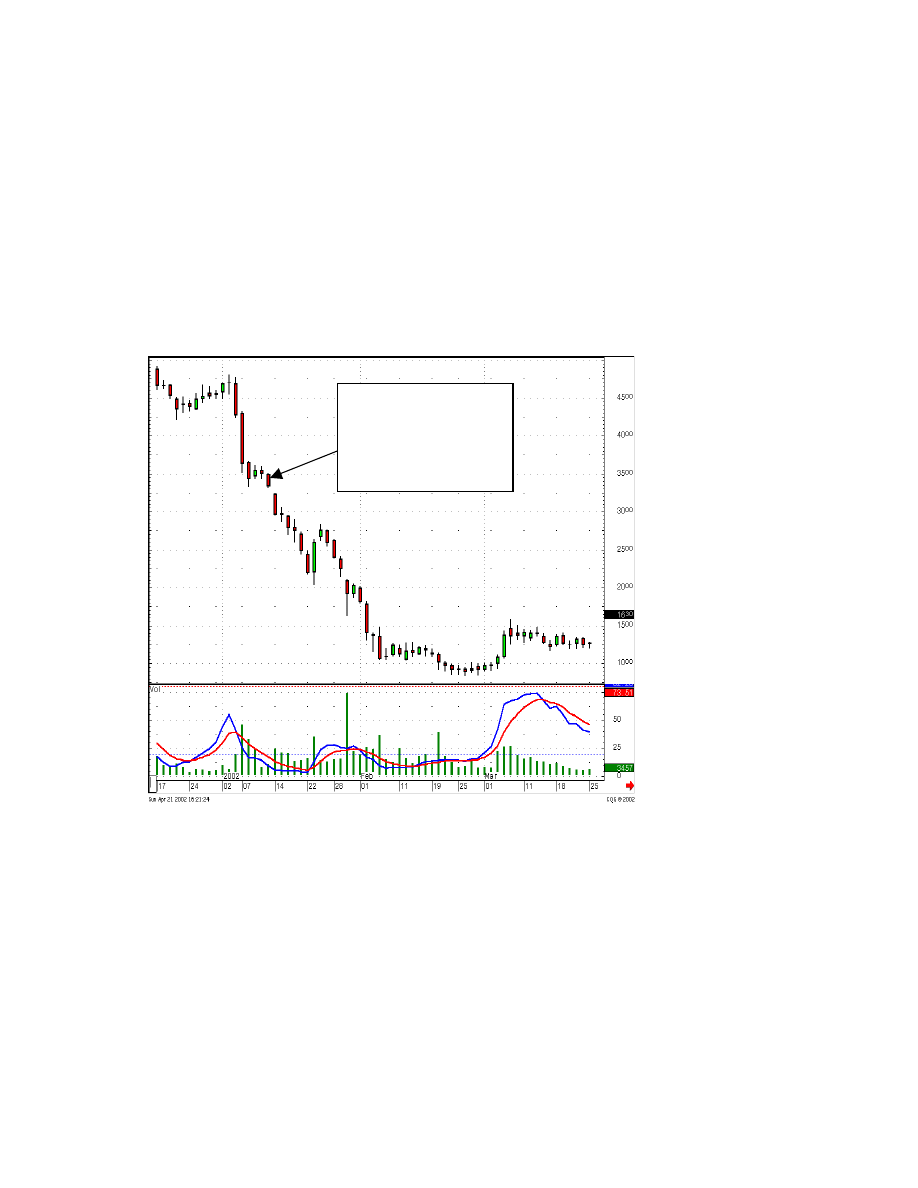
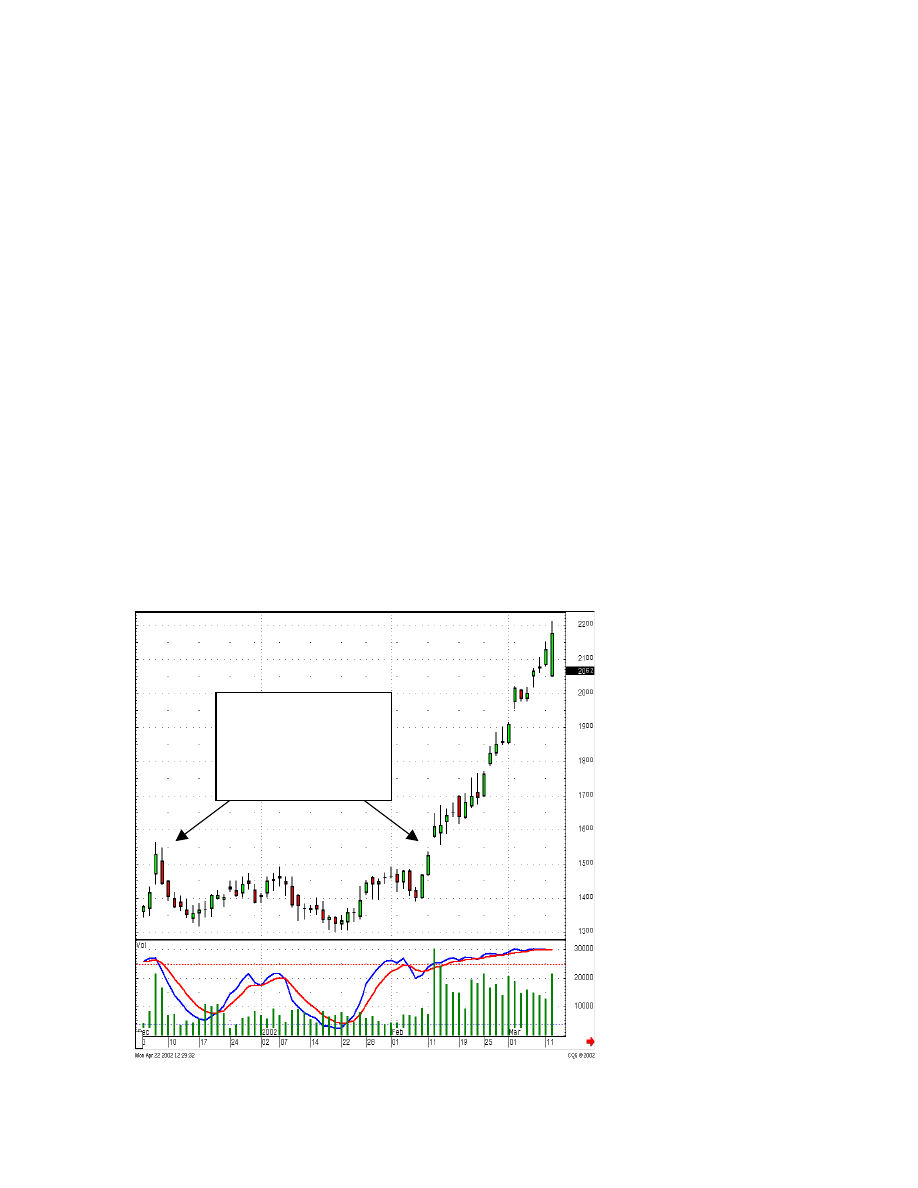
clearly seen in Figure 2 - CTX, Centex Corp. It gapped up the same day, illustrating that
buyers were coming into this stock with a vengeance. The initial gap is very important. It
will indicate how strong the new move will be.
Figure 2 - Centex Corp.
A gap up after a Bullish
Engulfing signal, a strong
change in investor sentiment
5
Upon witnessing a gap up, an individual signal, such as the dark candle in the above chart
after the gap up, has less relevance. When a large gap occurs, it is not unusual to see
immediate selling as the traders take their quick profits. The overall message is that the
bulls are in strong. The next few days demonstrated that the price was not going to back
off, the new trend had started.
The long-term investor, after analyzing the monthly chart, could have established a
position, with the knowledge that funds were flowing into this sector with much more
enthusiasm than other sectors, which could have been just rising with the overall tide. A
great indication for where to position your funds!
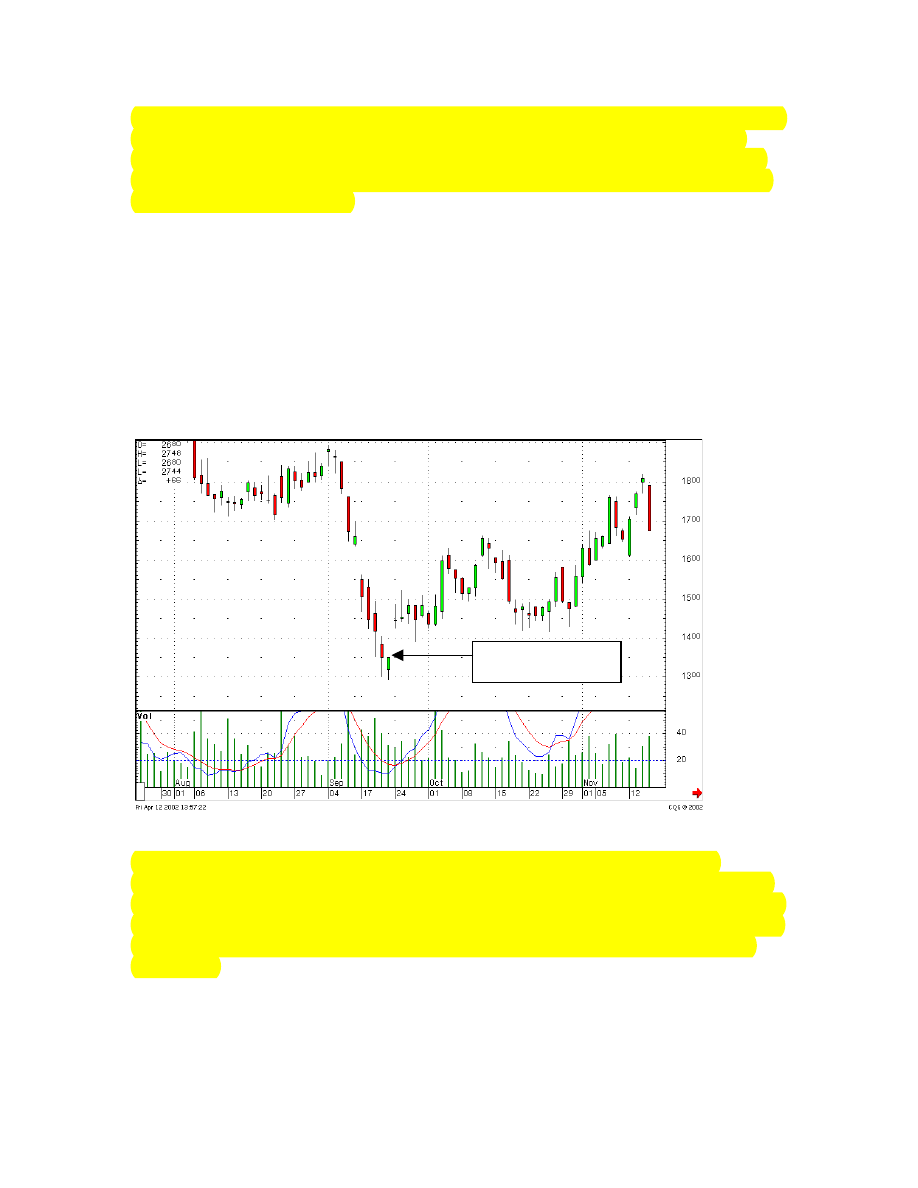
Figure 3 - TOL, Toll Brothers Inc. is another example of the gap up after a Candlestick
buy signal, indicating that the investors were coming into this stock with vigor. The result
was eventually returns of 80 - 100% in a four or five month time frame.
Meeting Line followed by
a gap up
Figure 3 - Toll Brothers Inc.
For the trader, seeing a Candlestick “buy” signal followed by a gap up, when the
stochastics are in the oversold range, makes for an extremely attractive trade. Notice the
Doji formed on the day of the gap up. Logic tells you that the bulls are buying. The bears,
who were happy to be selling at lower prices a couple of days ago, are more happier to be
selling at these levels. Thus a Doji. The major indication is that the trend has changed
vigorously.
6
Figure 4 - Cross Media Marketing
Note the small Hammer
type formation just before
the gap up. The light
candle after the gap up
said buyers were still
aggressive
A Doji/Harami followed
by a gap up and a long
light candle is a visually
obvious illustration that
the trend had changed.
Note in Figure 4 - XMM, Cross Media Marketing, after Doji/Haramis, one on November
5
th
, another on December 18, 2001, that the gap up the next day clearly indicated the
trend had stopped. The resulting trades produced 28.5% and 49.3% respectively.
Probabilities demonstrate that a gap up is going to preclude an advance in price under
these circumstances.
Unofficially, statistics illustrate an 80% and better probability that a trade will be
successful when stochastics are oversold, a Candlestick “buy” signal appears, and the
price gaps up.
(The Candlestick Forum will offer our years of statistical figures as
“unofficial.” Even though over fifteen years of observations and studies have been
involved, no formal data gathering programs have been fully operated. However,
currently the Candlestick Forum is involved with two university studies to quantify signal
results. This is an extensive program endeavor. Results of these studies will be released to
Candlestick Forum subscribers upon completion.)
Having this statistic as part of an investor’s arsenal of knowledge creates opportunities to
extract large gains out of the markets. The risk factor remains extremely low when
participating in these trade set-ups.
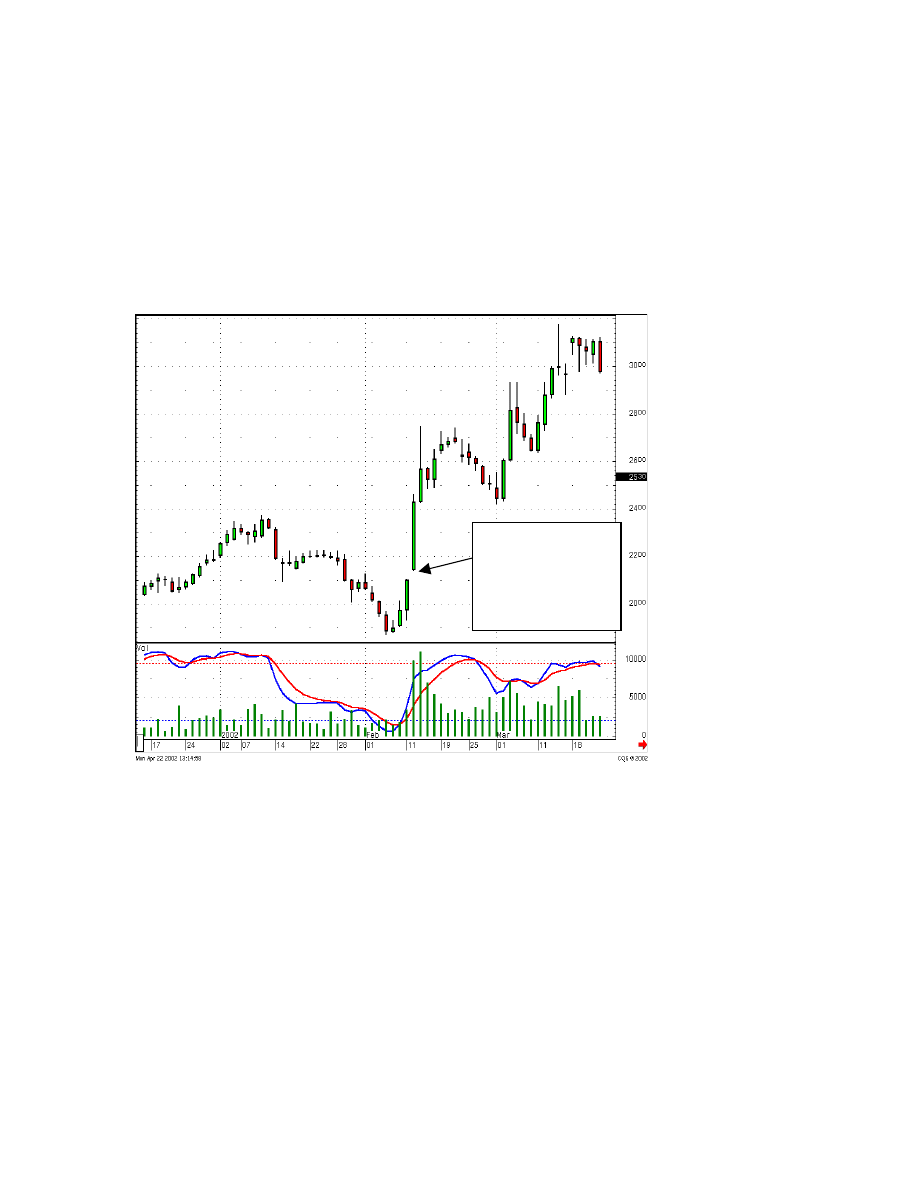
Note in Figure 5 - SPF, Standard Pacific Corp., gaps up the day after a Harami stops the
current downtrend, 4/25/01. The gap initiates a move that sends this price to a higher
level to stay. The following day gaps up significantly, consolidates for a few days and
then gaps up again. The second and third gaps are considered “measuring gaps”. These
types of gaps will be explained later in this book. The important aspect from this chart is
the initial gap up, revealing that the buying was overwhelming the selling.
7
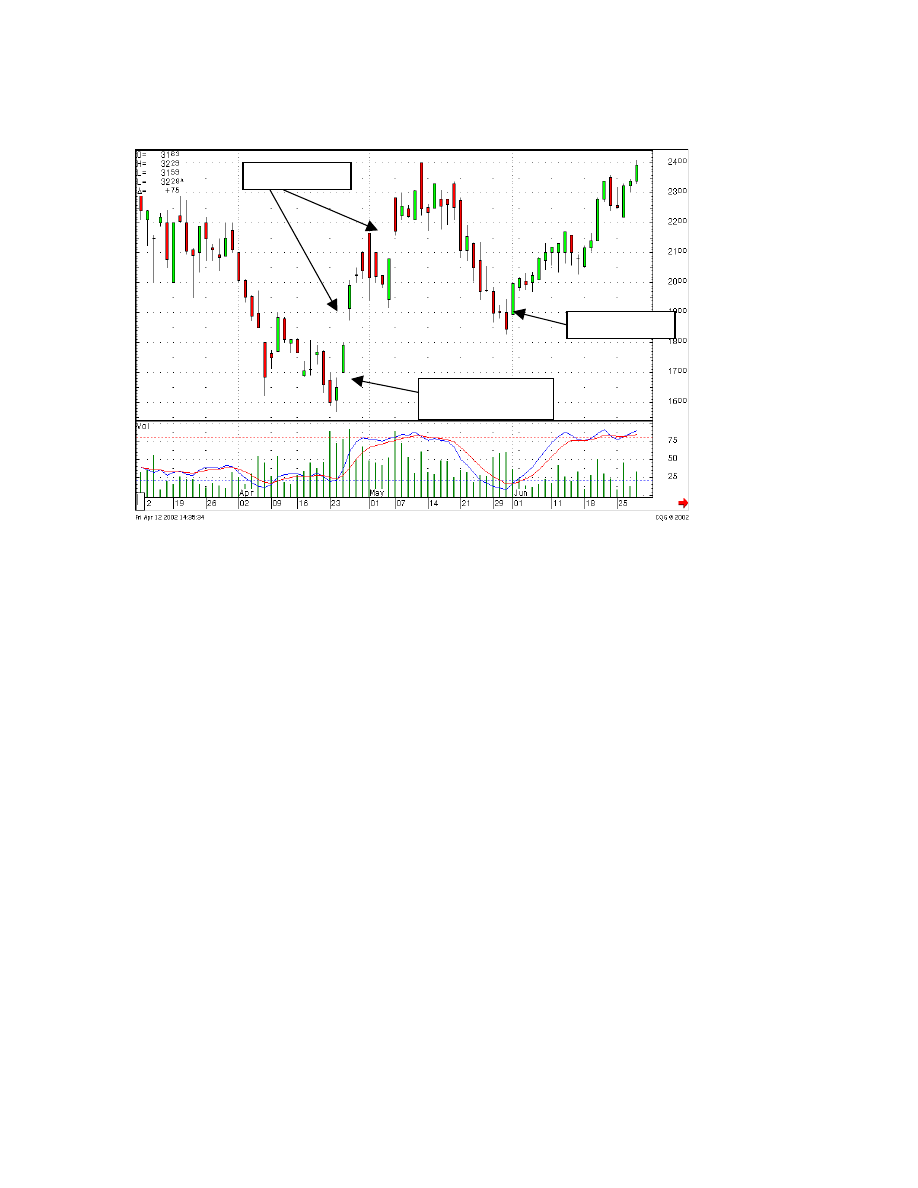
Figure 5 – Standard Pacific Corp.
Measuring Gaps
Kicker Signal
Note the gap up after a
Harami
Many investors are afraid to buy after a gap up. The rationale being that they don’t like
paying up for a stock that may have already moved 3%, 5%, 10% already that day.
Witnessing a Candlestick “buy” signal prior to the gap up provides a basis for
aggressively buying the stock. If it is at the bottom of a trend, that 3%, 5%, 10% initial
move may just be the beginning of a 25% move or a major trend that can last for months.
Huge gains can be made by finding and knowing the significance of a candlestick signal.
Figure 6 - XMSR, XM Satellite, has signs of bottoming in early April, 2001. The Homing
Pigeon, a form of Harami, shows the selling has stopped. A small Hammer, then a
Doji/Hammer should be evidence that the sellers are losing strength. The Doji/Hammer
should produce an alert that there is major indecision going on at this point. Watch for a
strong open the next day.
8
Figure 6 – XM Satellite
A Homing Pigeon followed
by a small Hammer, then a
gap up reveals strong
buyers.
The bigger the gap up, the more powerful the new trend will be. This was evidenced by
another small gap up a few days later. Traders may have gotten out at the $8.00 range,
still a good return. The longer-term investor should have gotten out at the $16.00 area.
The $12.00 area could have been scary, but notice that after a gap up at $12.25, the lower
close still didn’t come into the last white body’s range. The next black candle also didn’t
close in the white candle’s range. Profit taking. The bears could not move the price back
to the big white candle’s trading range. The bulls took note of this and came back strong
after their confidence was built back up. This moved prices to the next level. When prices
gapped higher at the $16.00 range, then gapped down from that level, the selling was
picking up strength. If the position was not liquidated then, it would have been logical to
do so a few days later when a new high was not reached and an Evening Star formation
was seen. Getting out at $15.50 around 5/23 would have produced a very nice 300% plus
profit for a little under two months time.
That is what you use Candlestick analysis for. Getting rid of the losing trades quickly.
Finding and exploiting the maximum gains from the good trades. Finding! An important
element. The gaps produce the opportunities.
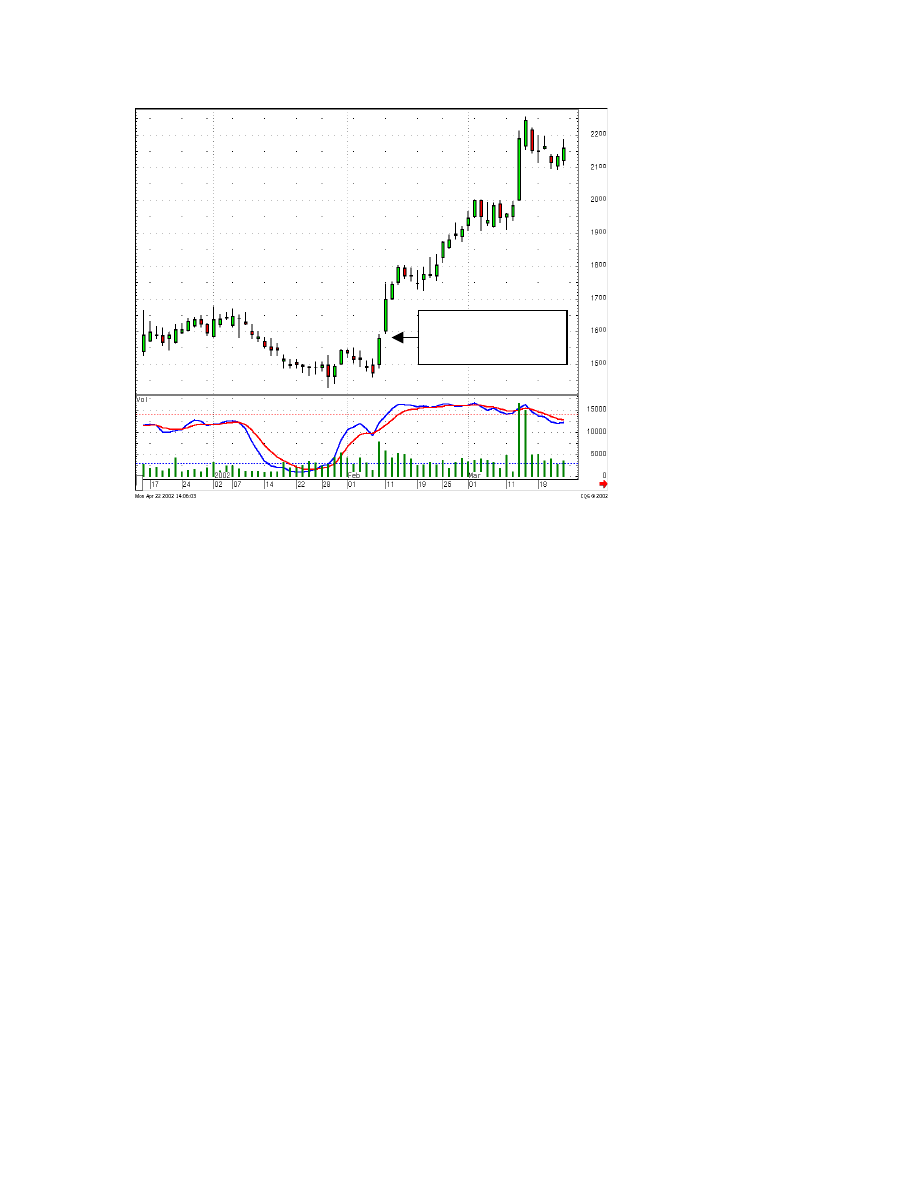
Coach Inc., Figure 7, illustrates when a trend is starting out strong. Late April, 2001
shows bottoming, a couple of Dojis appearing. If investors had been observing these
signals, they would want to see bullish signals confirming the reversal. The gap open to
$26.00 would have the Candlestick investor getting in on the open. Over the next 7
9
trading days, the trader could have realized a 27% gain. The long-term investor would
have more than doubled those gains over the next few months.
Figure 7 - Coach Inc.
A Hammer, then a big gap up
with stochastics at the bottom
makes for a big profit trade
The Morning Star signal is an obvious visual reversal signal. A more potent signal is the
Abandoned Baby signal. This is formed by the sellers gapping down a price at the bottom
of a trend, trading through a day of indecision with the bulls, then the bulls taking over
the next day, gapping prices back up and moving them higher. The bigger that gap, the
more powerful the next up move.
As seen in Figure 8 - MERQ, Mercury Interactive Corp. during the early days of April,
2001, had a day where prices gapped down at the end of the downtrend. The weak sellers
finally give up and get out at the bottom. They are met with bargain hunting bulls. The
trading that day forms a Spinning Top, a day of indecision, almost like that of a Doji.
10
ersal.
The gap down open on the
Spinning Top Day and the Gap up
to form a long green candle forms
an Abandoned Baby, a very
strong bullish rev
Figure 8 – Mercury Interactive Corp.
Quite often you will witness a big volume day during this three-day period. It is most
effective if it occurs on the indecision day, showing an inordinate amount of stock
moving from the weak traders to the strong traders. The big volume day can still occur
on any of those days. What is most important is to see this big amount of stock change
hands at this bottom period.
When the stock price gaps back up after the indecision day, this illustrates the sellers are
now finished and the bulls have taken control. Again, measuring gaps are seen in this
example, creating the opportunity for the trader to make 73% in about two weeks.
Example after example can be given on how a gap up at the bottom can produce big
profit opportunities. But just as gaps tell you something as they occur at the bottom
moving back to the upside, they are just as informative for preparing the investor to see
when a downtrend is ready to reverse.
Reviewing some of the observations that Candlestick analysis reveals, as found in
“Profitable Candlestick Trading”, the Japanese could not only identify when a reversal
was occurring, they could describe the trading environment that would anticipate the
reversal. For example, using candlestick formations, it was clearly obvious that after an
extended downtrend, the fear and panic would start to exaggerate. The daily trading range
would expand as more investors panicked and liquidated their positions. This series of
events would forewarn the Candlestick investor that the bottom was getting near, and to
11

be vigilant for a buy signal. The most informative signal at the bottom of one of these
declines is the gap.
For example, a stock has been in a downtrend for weeks. The talking heads on the
financial stations are all expressing their opinions about how this company/industry is in
the trash can. There is no reason to own this stock. Finally the last holdouts cannot stand
the pain of owning that stock anymore. They get out at any cost. The price gaps down the
next morning. Once this gap is spotted, a variety of profitable trading procedures can be
put in place.
What can happen from this point? The price has gapped down after weeks of a lengthy
decline. If it is a mild gap down, the price may keep declining. You may start seeing a
dramatic increase in volume. The price is showing another big down day. However, the
aggressive Candlestick investor realizes that the gap down was a blow-off signal. Upon
seeing the price decline finally hit bottom and appear to stabilize, the aggressive investor
can start to accumulate stock. Knowing that the gap was part of the panic selling gives
the candlestick investor the confidence to step in when there is still panic in the air.
If the gap down is severe, the panic may all be built into the opening price. A severe gap
down open after an extended downtrend may be a good opportunity time to buy. Watch
how the stock price reacts after the open. If it appears to be stabilizing at the open level,
with a little downside move that seems to be immediately bought up, it is time to start
establishing a position. At the end of that day, you want to see a white candle, a close
much higher than the open. This illustrates that all the sellers have been washed out. The
buyers have taken over. This is the advantage that Candlesticks have over other charting
techniques. It is much easier to see what is happening in a stock price when the color of
the bodies can be viewed. A stock price that opens down and continues to go lower has a
completely different strategy. The purchase of that position may be a few days or weeks
down the road.
12
Measuring Gaps
A gap that occurs well after the beginning of a trend reversal, where stochastics are still
in the midrange of an uptrend, has different implications. How do you distinguish
whether a gap is a potential measuring gap? Evaluate where the stochastics are in the
trend. If they are still relatively low, the trend has more room to create another gap before
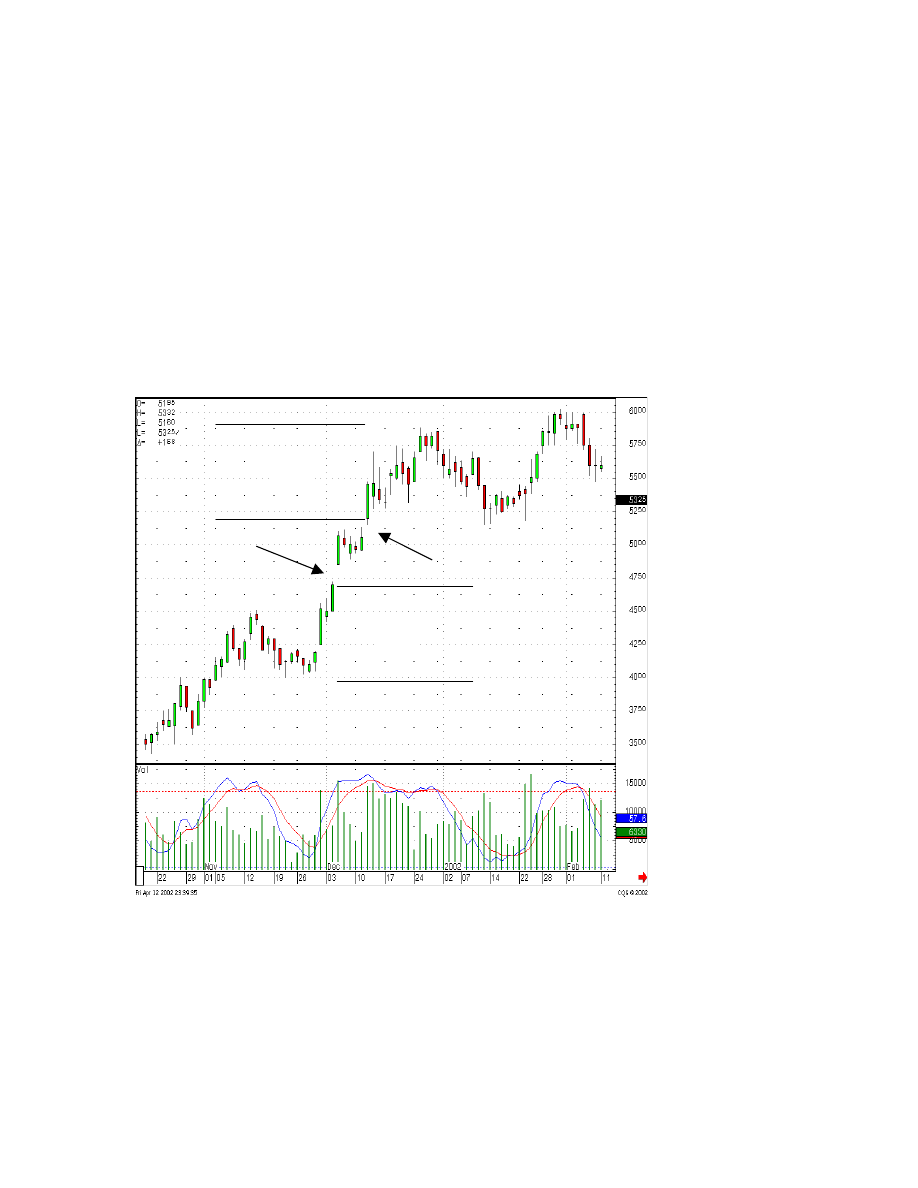
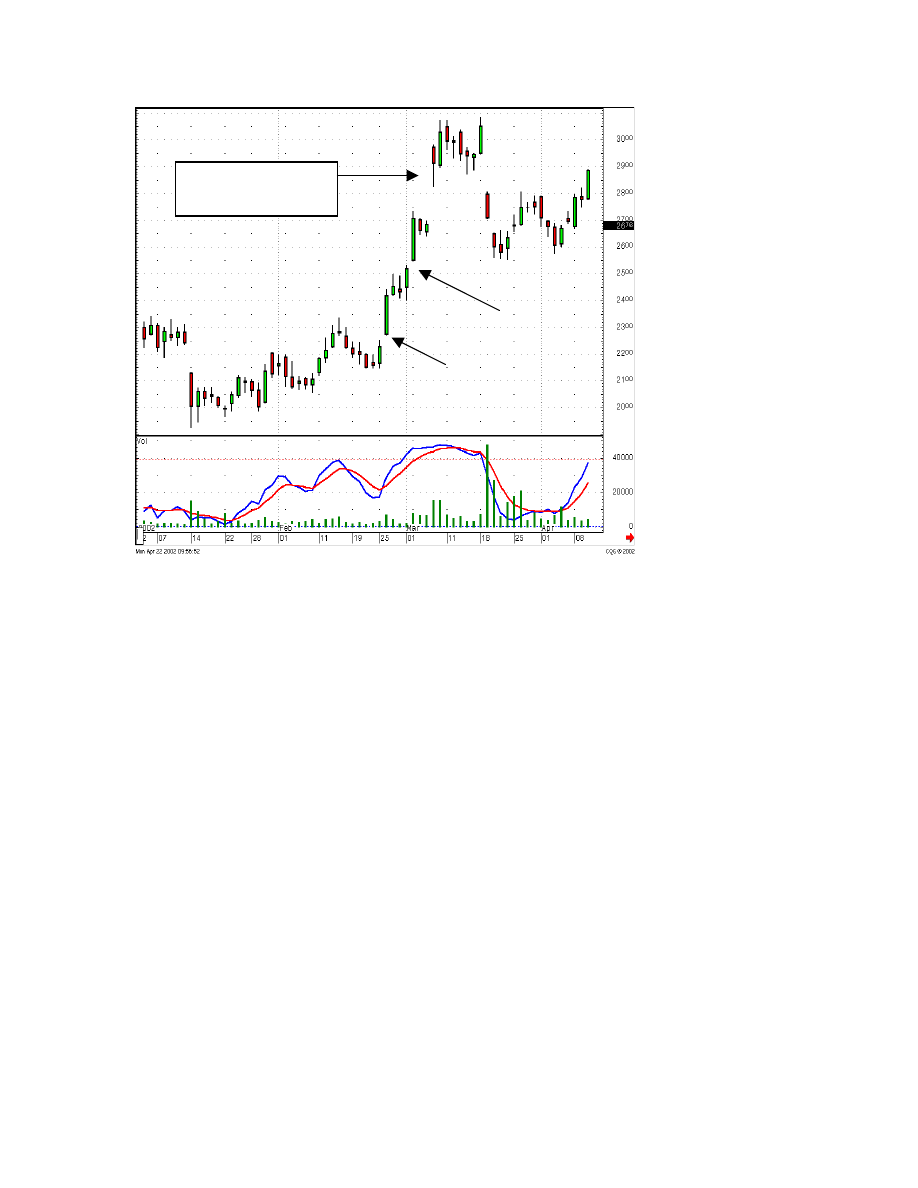
getting to the overbought area. Note in the CTX chart, Figure 9 - Centex, how the trend
started with a small gap up. The next few days, another gap forms, in the midrange of this
trend. The bears could not push prices back down through that gap over the next few
days.
Figure 9 – Centex
A
B
Eventually the bulls gapped up the price again. Notice that the beginning of the trend up
to the first gap [B] is about the same price movement as the move after the second gap to
the top of the trend [A]. This simple measurement gives the gaps their name. The telling
ingredient is the fact that the bears could not push prices back down through the first
measuring gap. That factor gives the bulls renewed confidence and they step back in. The
next day they gap it up again due to not being afraid of the bear camp.
13

Gaps At The Top
The gap that appears at the top of a trend is the one that provides the ominous
information. Remembering the mental state of most investors, the enthusiasm builds as
the trend continues over a period of time. Each day the price continues up, the more
investors become convinced that the price is going to go through the roof. The “talking
heads” on the financial stations start to show their prowess. They come up with a
multitude of reasons why the price had already moved and will continue to move into the
rosy future.
With all this enthusiasm around, the stock price gaps up. Unfortunately, this is usually the
top. Fortunately, Candlestick investors recognize that. They can put on exit strategies that
will capture a good portion of the price move at the top. Consider the different
possibilities that can happen when witnessing the gap up at the top of a sustained uptrend.
Most of the time the gap will represent the exhaustion of the trend, thus called an
Exhaustion Gap. Or it could be the start of a Three Rising Windows formation. Or big
news, a buyout or a huge contract is about to be announced.
What are the best ways to participate in the new potential, if there is any, at the same time
knowing that the probabilities are that the top is in? A few simple stop-loss procedures
can allow you to comfortably let the price move and benefit from the maximum potential.
Hopefully, in the description of the gaps occurring at the exuberance of an extended
trend, you have already experienced a substantial gain in the position. Any gap up is
adding to an already big gain. Probabilities dictate that this is the top. Possibilities could
include more upside gains.
Upon a slight to medium gap up, the Candlestick investor should put their stop at the
close of the previous day. The thinking being that if the price gapped up, indicating that
the top is in, and the price came back down through the close of the previous day, the
buying was not sustained. If so, the stop closed the position at the level of the highest
close in that trend.
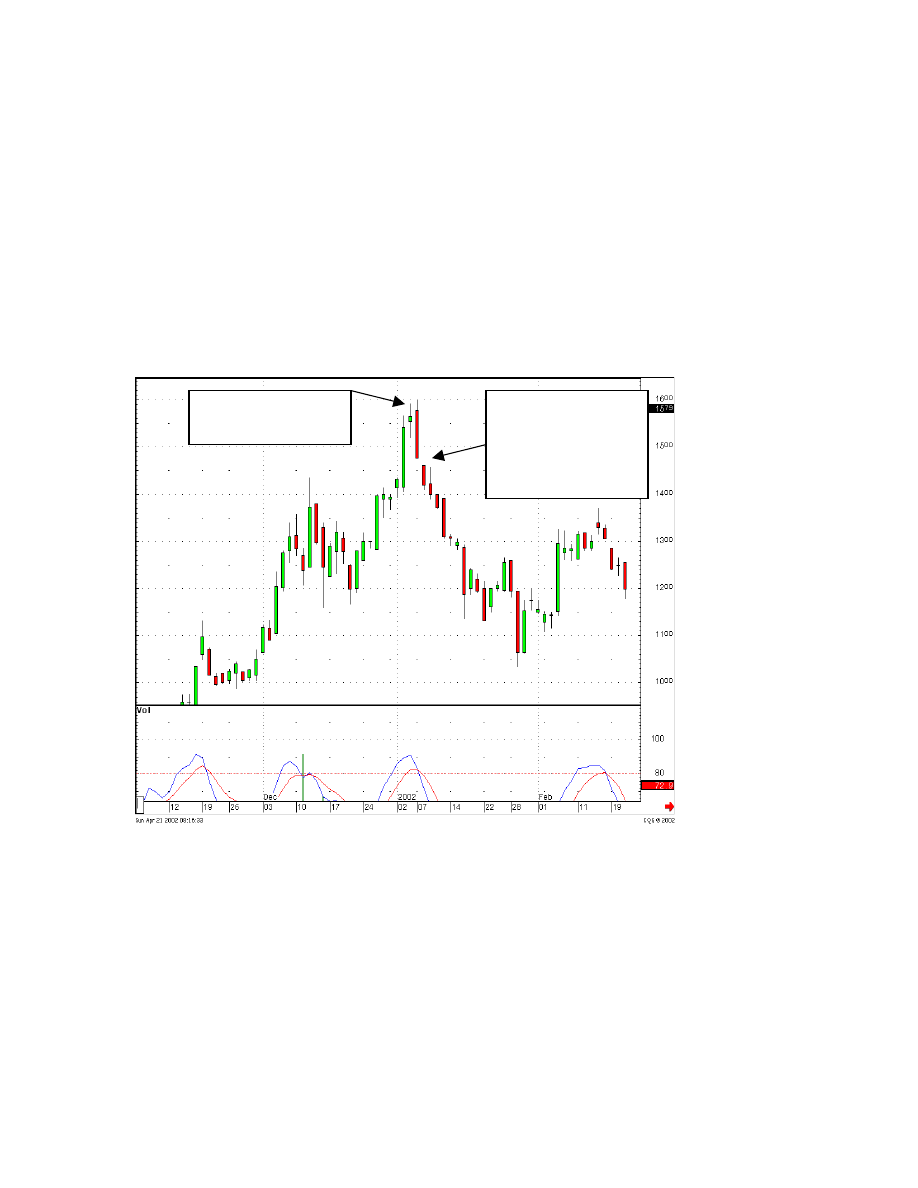
Look at Figure 10 - NXTP, Nextel Partners Inc. If you had bought the stock the day after
the Harami signal, showing that the selling had stopped, the open may not have been the
strength wanted to show that the buyers were stepping in. After the price opened lower
the next day, not showing resumed buying, a good spot to put the “buy stop” would be at
the closing price of the previous day. The thinking being that if the price, after opening
lower, came up through the closing price of the previous day, then the buyers were still
around. Buying price = $4.50.
After a few weeks, the price starts to accelerate and finally they gap it up. News was
probably looking very rosy at this point. Now the Candlestick investor is prepared.
Knowing that a gap up at the top indicates that the top is near, they can implement
strategies to maximize profits. Most investors will know that their position is up almost
14
100% in three weeks. That is not the type of move that will be missed by most. Upon
seeing the bigger price days and volume picking up, the Candlestick investor will be
ready for any sell signals that appear.
When the gap open appears, a number of strategies can be put in place. First, a stop loss
can be put at the closing price of the previous day. If prices start falling off immediately
and come down through the previous day’s close, then the bears have taken control. You
are out at the high close of the uptrend. In this case, as the price moves up, it would be
safe to put a stop at the open price.
Hanging
Man
Shooting
Star
Harami
Figure 10 – Nextel Partners Inc.
A fundamental change might be in progress. The same rationale as putting a stop loss at
the previous day’s open, if the price comes back down to and/or through that level, the
sellers probably have taken over control. Otherwise, if the stock price continues higher, it
may stay in a strong spike move for the next few days. Knowing that the stochastics are
now well into the overbought area, and the price was running up after a gap, selling one
half of the position would be a prudent move. Probabilities say that this is near the top.
There is always the low percentage possibility that new dynamics are coming into the
stock price, an announcement of a new huge contract or a possible buyout offer,
something new and different from the dynamic that ran the price up to these levels in the
first place. A surge of buying may create a “Three Rising Windows” pattern, moving
prices to much higher levels. The probabilities of this occurring at the top of a trend are
15
very small but feasible. Moving the stop losses up to each close or next day’s open price
maximizes the potential profits from that trade.
As seen in NXTP, a Shooting Star formed, definitely a sell signal. If the price opened
lower the next day, the position should be liquidated immediately. That is what the
Shooting Star is telling you, that the sellers are showing up. The next day opened higher
and stayed up all day. Things still look good. However a Hanging Man formation appears
the next day. This is where the Candlestick investor should be thinking, “a Shooting Star,
a sell signal, now a Hanging Man, another sell signal, be ready to get out.” The next day
after the Hanging Man, a lower open should have instigated the liquidation of any
remaining position. At worst, the average selling price should have been in the $8.10
area. The gap was the alert signal that positions should be liquidated. This trade produced
an 80% return over three weeks. Now go find another bottom signal.
Figure 11 – Omnivision Technologies Inc.
Gap open at a new
high, above the
previous day’s
trading range
Figure 11 - OMVI, Omnivision Technologies Inc. demonstrates a gap open at the top
with absolutely no follow through. This is when having a stop at the previous day’s close
will be the best exit. Whether the position was established at the breakout gap or the Tri-
Star pattern, the profits were substantial. Being prepared for the gap up was the profit
maximization technique.
If the gap up is substantial, after a long uptrend, it might be prudent to liquidate one half
of the position immediately. The remaining position would have a stop placed at the
16
previous day’s close. If the price pulled back to the previous close, again it would be
apparent that the sellers had stepped in after the gap up. The method locked in a price
above the highest closing price of the trend.
Illustrated in Figure 12 – MGAM, Multimedia Games Inc., the end of the up move was
foretold by a large green candle forming after a run up, then a gap up follows. This
should have alerted Candlestick investors to start profit taking. It produced a good 33%
profit in a just over a week. Now go find a low risk bottoming trade again.
A gap up this substantial
would warrant liquidating at
least half of the position.
Two Hammers followed by a
white candle should have been
the entry point
Figure 12 – Multimedia Games Inc.
If the gap is up substantially, and it continues higher, put the stop at the open price level.
On any of the scenarios described, the price moving back to the stops would more than
likely create signals that warranted liquidating the trade, forming Shooting Stars, Dark
Clouds, Meeting Lines or Bearish Engulfing patterns. In any case, sellers were making
themselves known. It is time to take profits in a high-risk area and find low-risk buy
signals at the bottom of a trend.
17
Selling Gaps
Now turn the tables over. The same enthusiasm demonstrated by a gap to the upside is
just as pertinent for sellers on the downside. A gap down illustrates the desire for
investors to get out of a stock very quickly.
Identifying clear Candlestick “sell” signals
prepares the investor for potential reversals. The Doji at the top, Dark Clouds, Bearish
Engulfing patterns are obvious signals to be prepared for further downmoves. The Doji is
the best signal to witness a trend reversal.
The Doji should stand out at the top of a trend just like a blinking billboard. Note the Doji
at the top of the ISSI, Integrated Silicon Solution chart, Figure 13. The Candlestick
investor would have already been prepared upon seeing that a Doji was forming that day
as the close was getting near. At worst, the position should have been liquidated when the
pre-market indications showed a weak open.
A Doji at the top
followed by a gap
down
Figure 13 – Integrated Silicon Solutions
The existence of the gap down demonstrates an urgency to get out of this position. Being
prepared for this event prevented giving back a major portion of profits.
Illustrated in the ASTSF chart, Ase Test Limited Ord Shr, Figure 14, the gap down
confirms the downtrend a day later after the appearance of the Doji. A clear Evening Star
signal requires the black candle after the Doji to close more than half-way down the
18
previous large white candle. In this case, it closed right at the midpoint, still leaving some
doubt as to whether the uptrend is truly over. The gap down the following day confirms
that the sellers are now in control.
Knowing the simple description of the signals gives the candlestick investor that extra
head start in preparing to take profits or go short. Utilizing the statistical probabilities of
what the signals convey allows the mental, as well as the actual preparedness. The ease of
identifying a gap, and knowing what messages a gap conveys, instigates the investor to
change the position status immediately.
Figure 14 - Ace Test Limited Ord. Shrs.
A Doji at the top of the
trend was the warning
The gap down, more
than ½ way down the
previous big bullish
candle confirms the
selling
These are examples that demonstrate the obvious benefits of what the windows /gaps
portray. However, there are many more situations where they provide important
investment decision-making aspects.
For example, review the Toll Brothers chart, Figure 15, April of 1999. Notice how the
initial gap acted as a support level. In the weeks after the gap up the price would come
back to the top of the gap but would not close lower. As long as the gap was not filled,
the uptrend stayed intact. This is a good rule of thumb. If a gap cannot be filled, the
predominant trend will continue. The Japanese term for filling a gap is anaume.
19
Knowing that a gap will act as a support or resistance level gives the Candlestick investor
time to prepare when one of these levels is approached. The condition of the Stochastics
and the potential set up of another reversal signal informs the investor as to whether that
gap is going to act as a support or if the gap will be filled. This may be occurring at a
time when no other technical indicators are present in that price area. Note how the gap
acts as a support level in the Toll Brothers chart. Each time price dipped to this level, the
buyers stepped in and would not let the price fill the gap. This should obviously become a
support consideration.
Figure 15 - Toll Brothers Inc.
20
Gapping Plays
As always, there are exceptions to all rules. The Gapping Plays are those exceptions. As
previously discussed, the gap at the top of a trend is the exhaustion gap. The same is said
for the gap at the bottom of a trend. The appearance of those gaps is either the last gasp
exhilaration (at the top) or the last gasp panic (at the bottom). However, the Gapping
Plays represent a different set of circumstances at the top or bottom.
After a strong run up, it is not unusual to see a price back off and consolidate before the
next leg up in a rally. This could be in the form of a back off in price or a backing off
from further advance. The latter is a period of the price trading flat at the high end of the
previous uptrend. After the flat trading period, a new burst of buying, causing a gap up,
illustrates that the buyers have not been discouraged. This new buying is evident by the
gap up. As a gap expresses enthusiasm, this is usually the reinstatement of the previous
move, taking prices up to a new level.
As seen in Figure 16 - ITG, Investment Technology, the gap up after prices had stayed
flat and at the top end of the last large white candle, for about a month and a half, finally
convinced buyers that the sellers were not around. The gap up should have alerted the
Candlestick investor that prices should be moving up to a new level. This becomes a
High Level Gapping Play.
Figure 16 - Investment Technology
The trading remains
near the top of the last
run up, sellers don’t
seem to be present
21
The same is true for a declining trend. After a significant downtrend, prices level out.
Once the sellers are convinced that there are no buyers around to move the price up, they
can sell again with confidence. This confidence is seen in the gapping down of price. At
that point, much lower prices can be expected.
As seen in Figure 17 - PCSA, Airgate PCS, after the price dropped dramatically, the
buyers and sellers have a few days of indecision. The prices remain flat for three or four
days. But after the sellers realize that the buyers are not strong enough to get the prices to
move back up, they get out with force. This is known as a Low Price Gapping Play.
Figure 17 - Airgate PCS
After a severe drop
down, the price trades
flat for a few days, then
a gap down shows more
downside
22
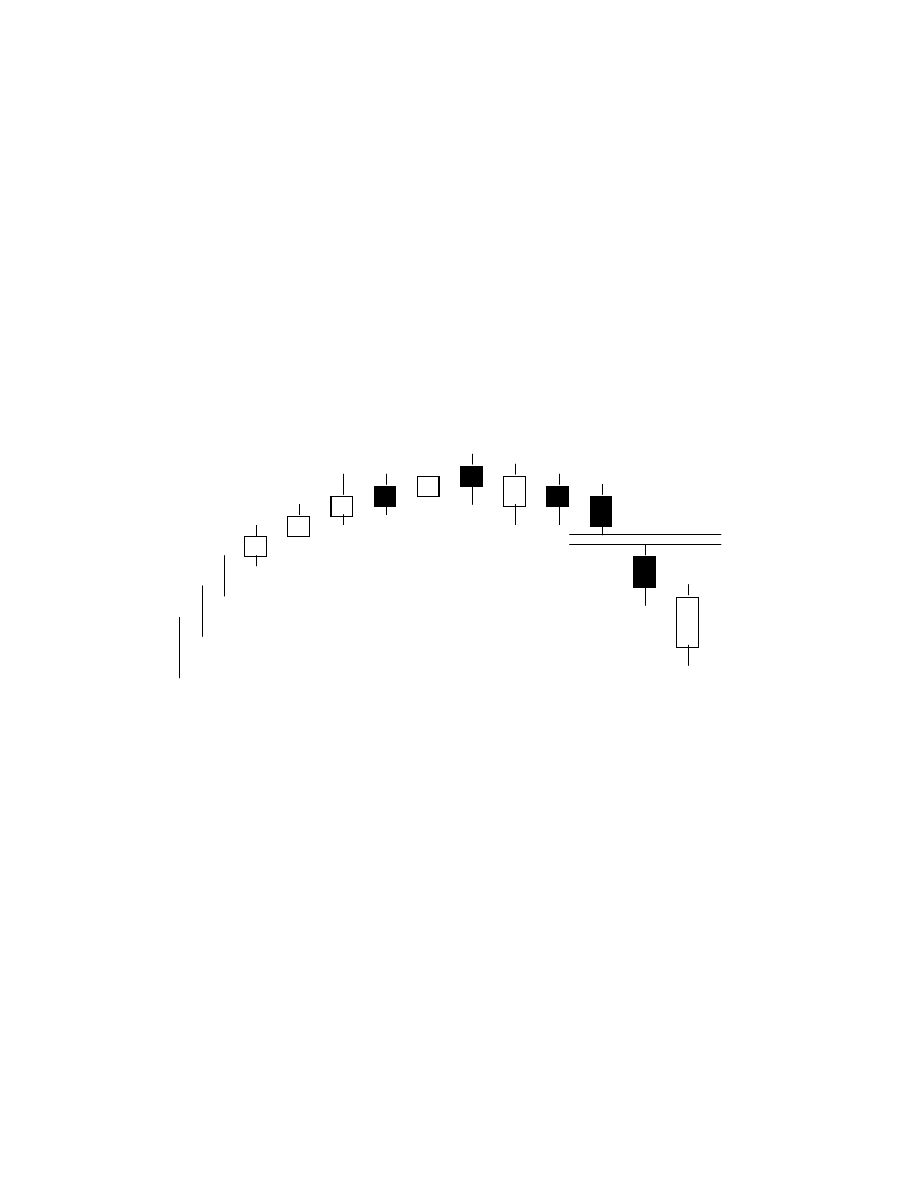
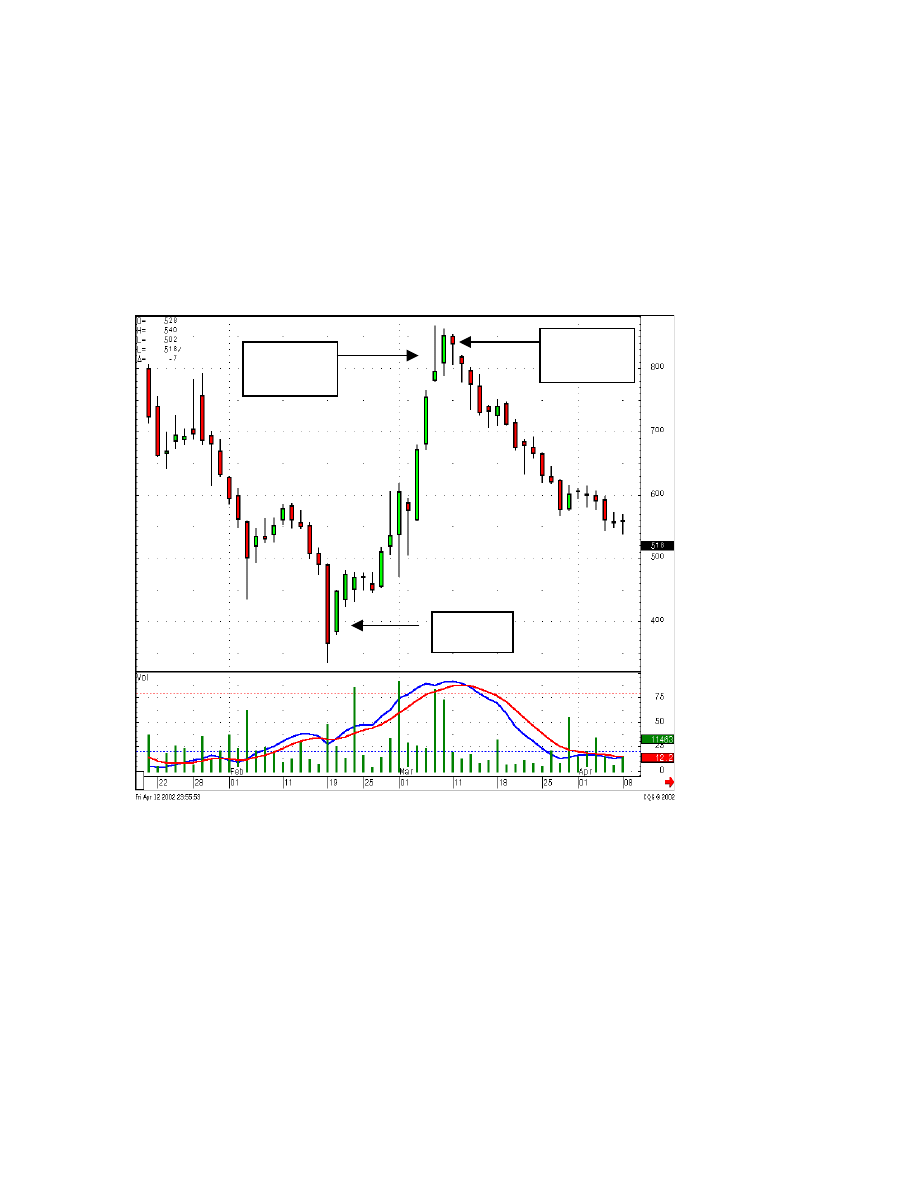
Dumpling Tops and Fry Pan Bottoms
Sometimes a gap or window is required to demonstrate that the price move is picking up
steam. Otherwise, the move may not create any signs that a move is forming. The best
illustration is the Dumpling Top. The slow curvature of the top would not attract any
attention. However, being prepared for a gap down allows the investor to make profits
that otherwise would just blend into the trend with no great expediency needed.
Figure 18 illustrates the Dumpling Top. The Gap is the crucial sign in this pattern. Once
the gap occurs, the downtrend should prevail for a number of days. Prior to the gap, there
is so little price volatility, nobody would be interested in what was occurring in this
stock. The Candlestick investor gets a forewarning of a profitable trade.
Figure 18 - Dumpling Top.
Gap
23
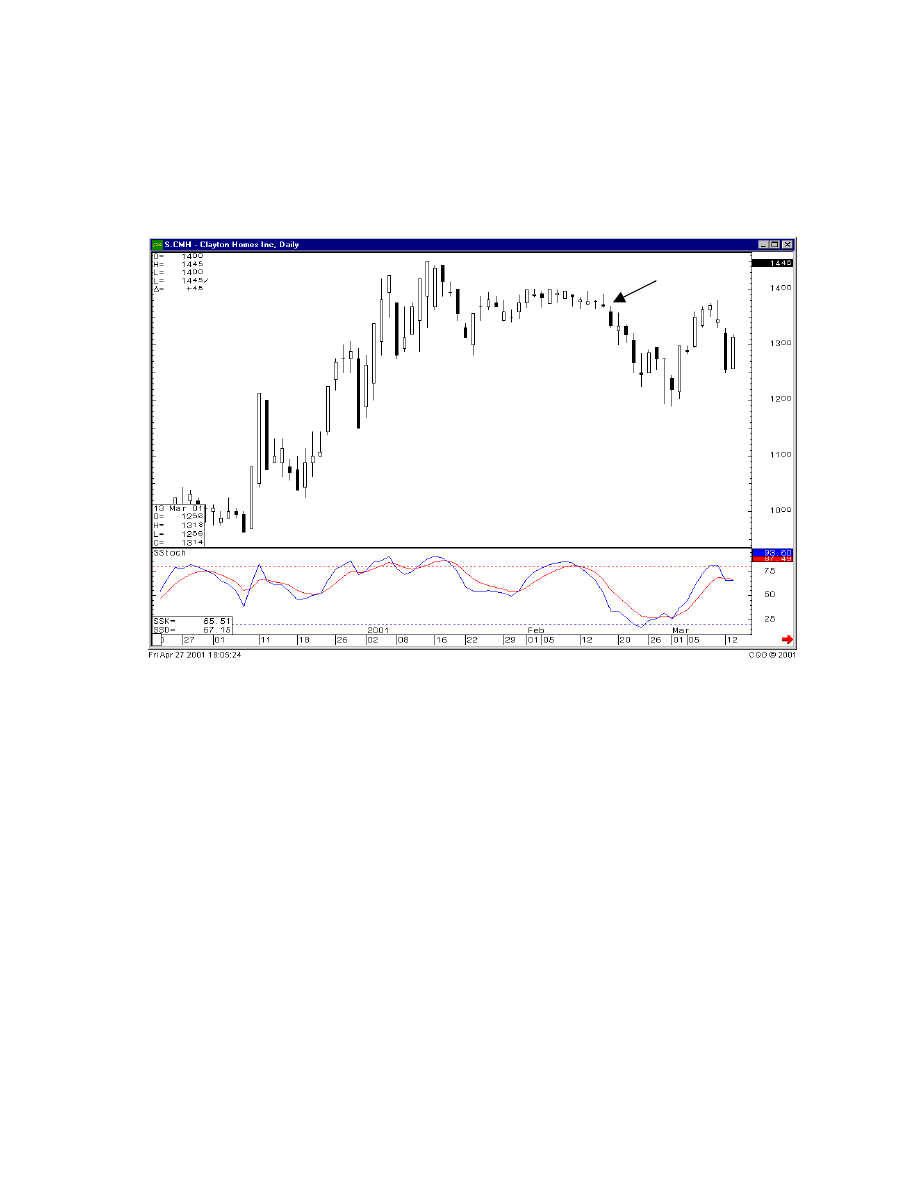
Note in Figure 19 - CMH, Clayton Homes, Inc., that the trading became listless until the
gap down instigated a sell off.
Figure 19 - Clayton Homes, Inc.
Note the lack of daily
volatility prior to the
price breaking down
Just as the gap down is the main initiative for expecting the downtrend after the
Dumpling Top, the same is true for expecting an up-move after a Fry Pan Bottom. The
Fry Pan Bottom gets its name from the slow gradual curve made at the bottom of a trend.
This provides a lot of time for the sentiment to change from bearish back to bullish.
24
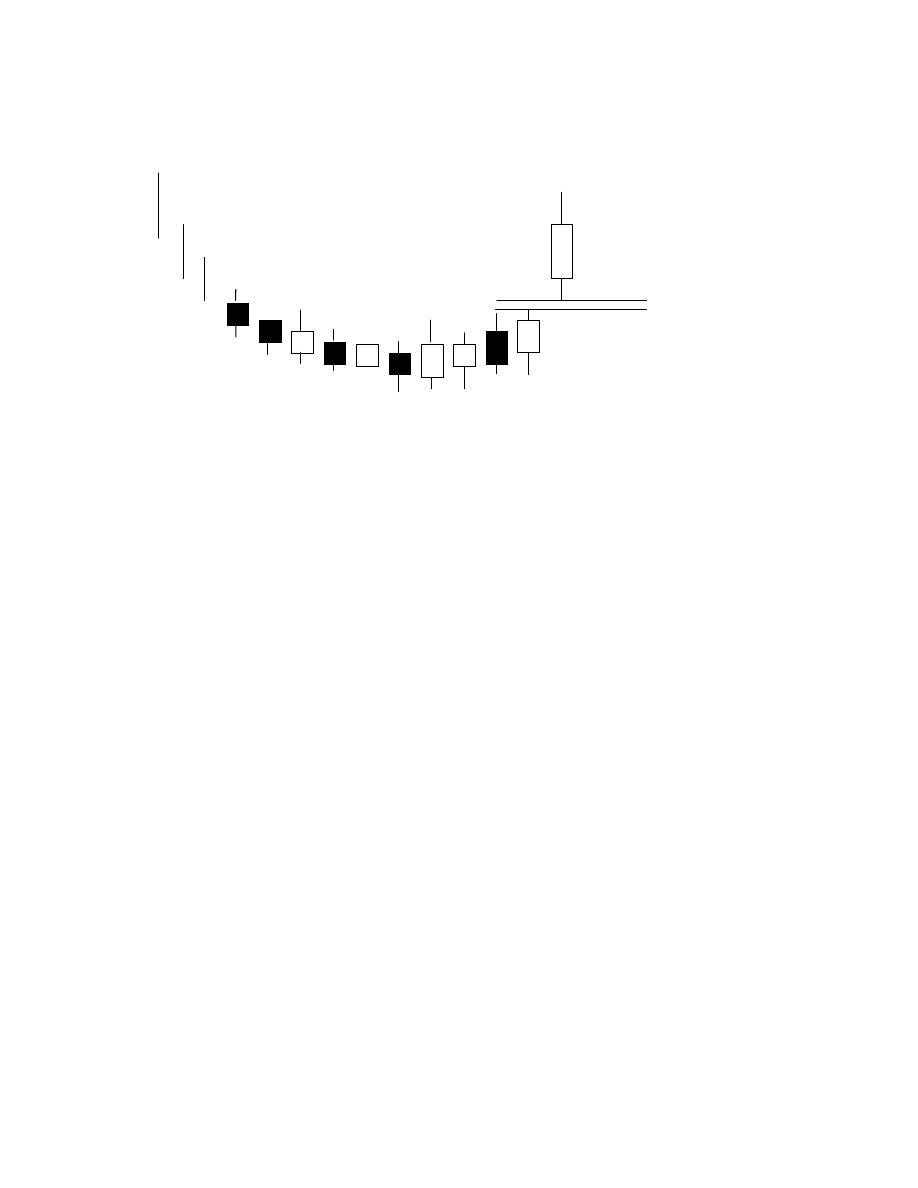
Figure 20 - Fry Pan Bottom.
Gap
As the change becomes more bullish, the bulls feel more confident that all the selling is
gone. This leads to some exuberance into getting back into the position. Upon witnessing
this gap up, the Candlestick investor should be willing to commit funds as fast as
possible. It usually signifies the beginning of a new trend.
Note in the New Focus Inc. chart, Figure 21, how the bottom slowly curved back up as
the selling diminished and the buyers began to build confidence. The small gap up on the
ascending side of the Fry Pan alerts the investor that the buying is now getting more
enthusiastic. This is the spot that a Candlestick investor wants to commit funds to grab
some of the 100% gain over the next few weeks.
Having the foresight that the slow curving moves are not just dull market conditions
creates an opportunity for the Candlestick investor to be ready for that telltale gap. Once
the gap appears, putting money into that trade maximizes the returns by being in the trade
as it is now moving.
25
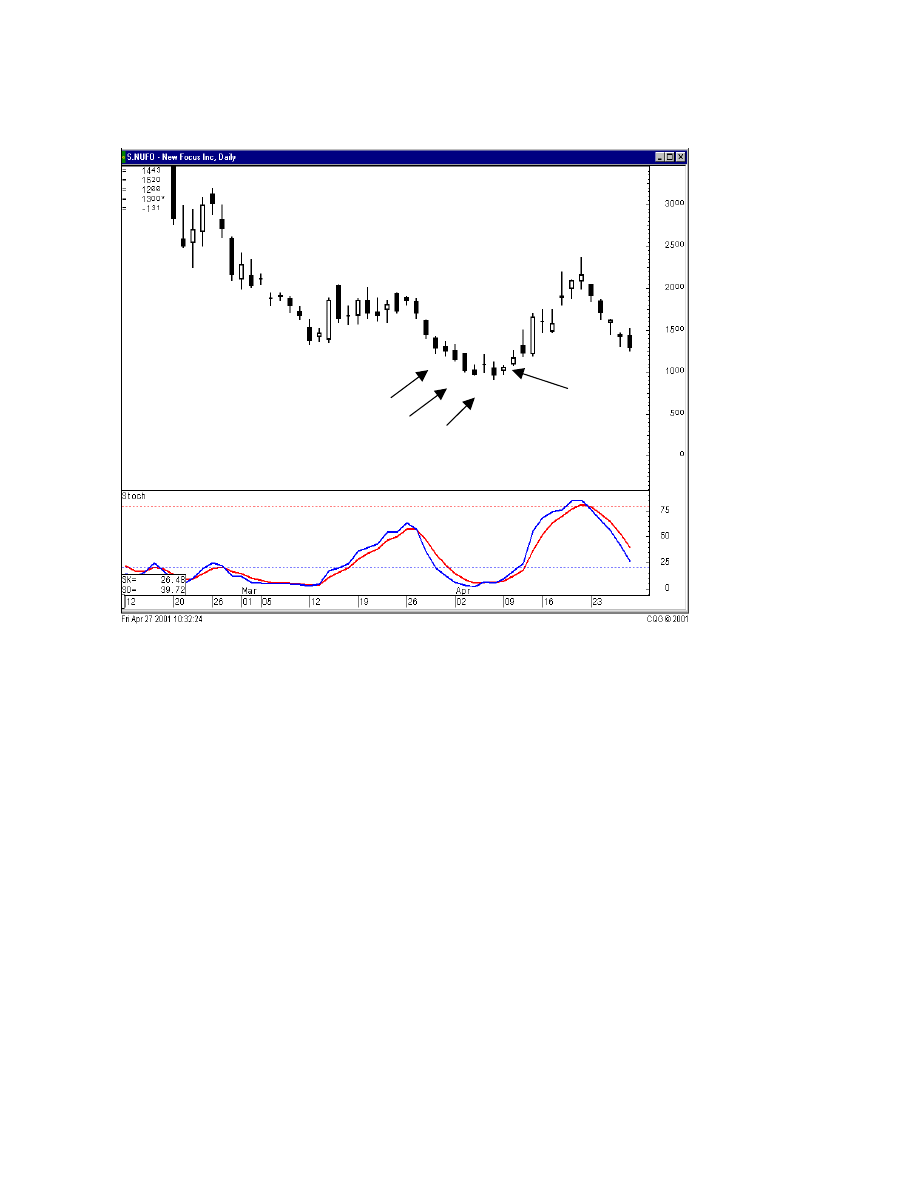
Figure 21 - New Focus Inc.
As witnessed in both the Dumpling Top and the Fry Pan Bottom, the gap is the alert that
the trend has started, and started with more force behind it than what had been witnessed
prior to the gap. Having the foresight to recognize the forming of a Dumpling Top and a
Fry Pan Bottom creates the opportunity to get into a position that is able to produce
profits immediately. The appearance of the gap is the best spot to exploit the new strength
in a move.
26

San-Ku - Three Gaps Up
As mentioned in Japanese candlestick analysis, the number three plays a very relevant
part of the investment doctrine. Many of the signals and formations consist of a group of
three individual signals. It has become a deeply rooted number for the Japanese
investment community whether applied to Candlestick analysis or not. This creates a
highly profitable investment strategy when applied to Gaps or Windows.
San-ku provides the best opportunities for buying and selling at the optimal points in
time. After observing the bottoming signals, the first gap (ku) indicates that the buyers
have entered the position with force. The second gap indicates further enthusiasm for
getting into a stock position. This should have a mixture of short covering involved. The
third gap is the result of the bears finally realizing that this is too forceful for them to
keep holding short positions, they cover along with the later buyers. Upon seeing the
third gap up, the Japanese recommend that the position be closed out, take the profits.
This is due to the price having probably reached the overbought area well before it
should. The presence of three gaps up probably has resulted in very good profits over a
very short period. The same parameters will occur in the opposite direction, in a declining
price move.
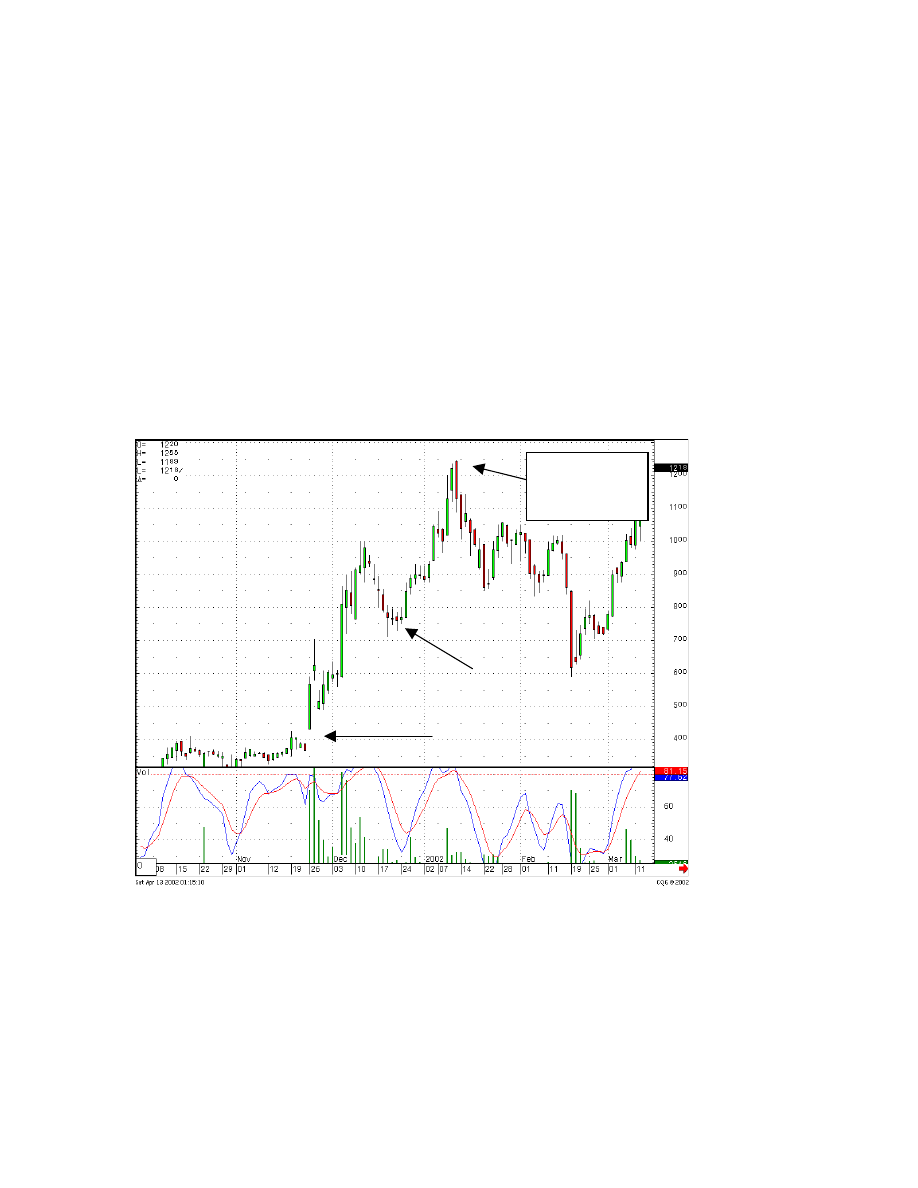
Note in Figure 22 - URI, United Rental Inc., how the first gap demonstrated that the
reversal picked up a lot of strength, buyers gapped up the price and it closed at a high for
many months. A few more days of buyers showed that the price was not going to back
off. This led to another gap up, probably the shorts deciding that the trend is now firmly
against them. After a couple of more days of no real weakness, the price gapped up again.
Panic short covering? Also the Japanese rule suggests, sell after the third gap up. In this
case, selling on the close of the third gap up day would have gotten you most of the gains
possible from this trade. There was a day or two that you could have gotten a few
percentage gains more, but why risk it? The Japanese have watched these moves for
hundreds of years. Why try to squeak out a few more percentage points profit? 28% in
the couple of weeks should be plush enough. Go on and find another trade that is starting
at the bottom.
27
3
rd
gap up is usually
the time to sell
Figure 22 - United Rental Inc.
The same dynamics can be seen in the Ingersoll-Rand Ltd. Chart. In Figure 23, the first
gap broke out prices above the recent high, the second gap still shows strong buying and
the close of the third gap up day is as good a spot to take profits as any.
28
Figure 23 - Ingersoll-Rand Ltd.
The 3
rd
gap was
the time to take
profits
One more illustration shows the factors at work in a San-ku formation. Note in the
Maytag Corp. stock price in Figure 24, the initial gap up should have prepared the
Candlestick investor for the possibility of the exhaustion gap. However, this stock price
opened and steadily moved higher, not affecting any stops. As it closed near its high for
the day, a white Maruboza, a bullish continuation pattern, should have now alerted the
Candlestick investor that the buyers were still around in force. The second gap up now
makes the investor aware that a San-ku may be in the making. As evidenced in the last
two examples, selling after the third gap up, although more lengthy a period than the
previous examples, would have captured a great majority of the potential of this move.
29
Figure 24 - Maytag Corp.
Again, the close of the
trading day after the
3
rd
gap up would have
captured a vast
majority of the profits
in this move.
Having the knowledge of what should occur after gaps provides that extra advantage.
Most investors are leery of gaps because they don’t understand all the ramifications gaps
introduce. This allows the Candlestick investor to exploit market moves because the
majority of the investment community does not understand how to use them. The San-ku
formation can get investors in when many investors would be afraid to chase a gap up or
gap down. It also gets the Candlestick investor out at the appropriate time where other
investors would hold too long and not get the best return on investment.
30
Breakouts
As revealing as the gaps are for alerting when a major run-up is about to occur, it is even
more beneficial to know when the gap is about ready to occur. There are particular
patterns that forewarn when a gap is likely to occur. And when they do, it means that a
whole new trading area is going to be reached. Having this forewarning permits the
investor to be ready to get into the trade at the optimal time and have the funds available
to take advantage of the profitable move that it initiates.
Note how the gap up at a level that had not been breached for a couple of months now
indicates the buyers not being apprehensive about buying above the past highs. This
easily reveals that the price is going to new levels.
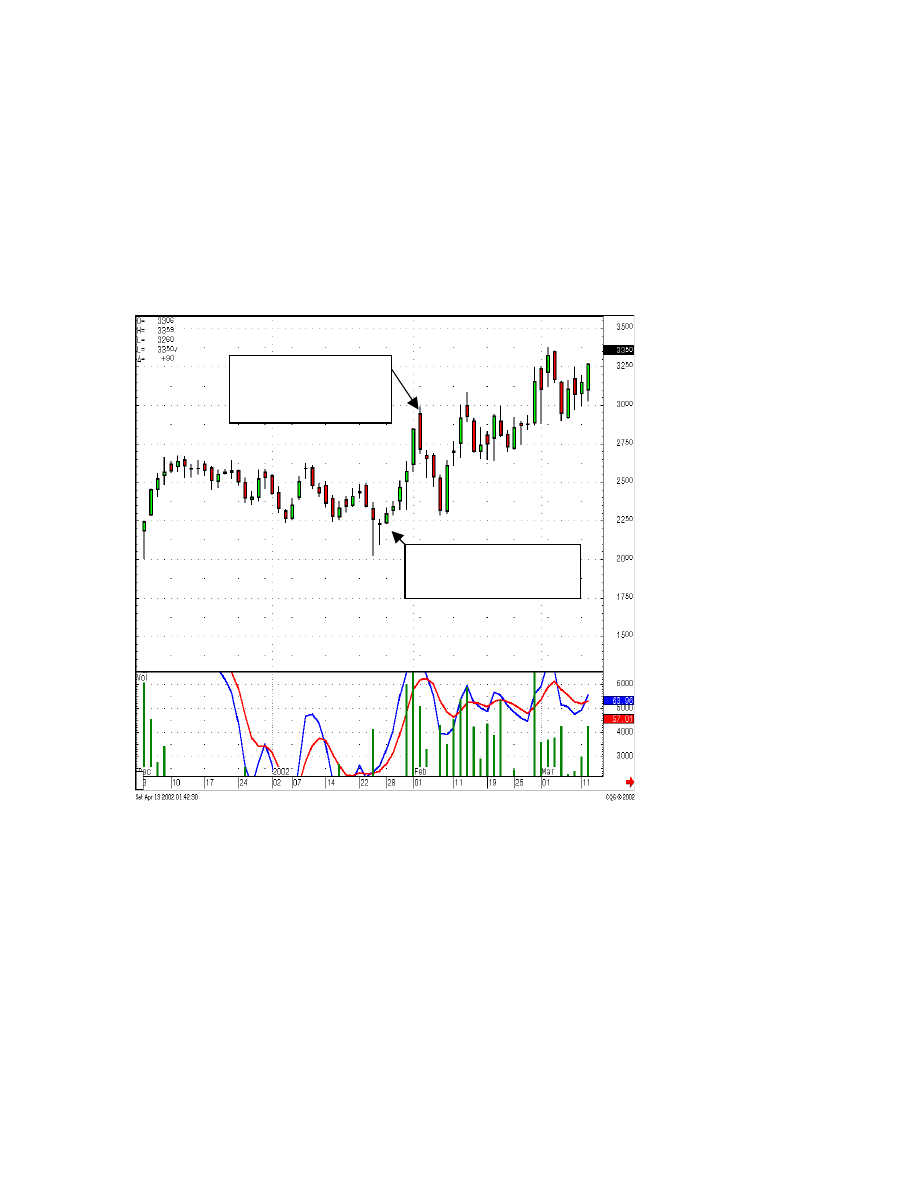
Notice the breakout in Figure 25 - DCN, Dana Corp. DCN starts its major run once it
broke out of a trading range over the past two months. The gap is the alert. The gap up at
this important level is a profitable transaction. In this example, volume had a great
increase once the new trading levels were reached. Stochastics stayed up near the
overbought range but they do indicate that they are pointing up when this new move
starts. The protective stops, placed on a gap up day near the highs, would not have been
affected with the price continuing higher.
Figure 25 - Dana Corp.
A gap up at an obvious
past high means the
buyers are not afraid of
these levels, a new
buying force is present.
31
The Prepaid Legal chart, Figure 26, is a chart that one could anticipate a gap occurring.
The best entry level was the confirmed Inverted Hammer pattern with volume
dramatically increasing over the next few days. As the price came back up towards the
trading area of $22.00, it was feasible that if the price broke that level, it could head much
higher. The appearance of the gap should have been an immediate indication that buying
was coming into the stock. The long bullish candle would have revealed that the old
trading levels were now being disregarded, new buying dynamics were in the stock price.
Note the stochastics have
a lot of juice left as prices
come up near the recent
trading levels.
Figure 26 - Prepaid Legal PPD
32
A very slight gap up
but it shows force
Figure 27 - Cooper Tire Company
Despite the very small gap in the price rise of Cooper Tire’s stock move, it still indicated
strong buying even after a strong up day. The fact that the buying after the gap up took
prices to new highs would have alerted the Candlestick investor that a new level should
be reached.
All of the above examples had chart set-ups that would leave room for anticipating that a
gap up could occur. All illustrate that when a gap up is noticed, new buying strength is
involved, moving prices up to much higher prices.
33
The J-Hook Pattern
The J-Hook Pattern is another example of being alerted when a gap up could occur. The
J-Hook Pattern occurs after a trend has had a fairly strong run up. It backs off for a
period, most likely profit taking. The stochastics do not get back down to oversold, they
start leveling out and curl back up near the 50 area. As the price stabilizes and starts back
up, the previous high becomes the logical target. This is the prime time to look for a gap
up. The buyers, who saw the price have a strong move, then see it pull back, are now
seeing it stabilize and try to move higher again. Once they become convinced that the
sellers have been exhausted, the buyers will come back into the stock with confidence.
This new confidence, the appearance of a gap, could be strong enough to breach the
recent high and take prices up to new levels.
Notice that the
stochastics only came
down to the 50 level
before starting back up.
A gap up that gave good
indication that they would
run the prices much higher.
Then a gap as it broke out
of the previous trading
area.
Figure 28 - D.R. Horton Inc.
D.R. Horton Inc. is an example of gaps playing an important part in recognizing when the
next run-up will occur. Once the initial run up had run its course, the consolidation period
or the hook area didn’t allow the stochastics to get down to the oversold area before
turning back up.
The J-Hook Pattern is also a function of what the markets are doing in general. It is not
unusual for the price of a stock to rise with the markets, pull back with the markets, then
resume its uptrend when the market starts heading up again. But these stocks usually act
with greater volatility than the market in general.
34

Identifying the J-Hook Pattern requires a minor amount of previous visualization. After
seeing a major run-up in a stock price, then witnessing “sell” signals, makes for a good
profit taking period. However, if an uptrend has been reasonably strong, without many
zigs and zags, it is definitely profitable to keep monitoring that stock after the pullback
has started. Depending on market conditions, considering that the stock is selling off but
that the markets in general are still holding their own, it is worthwhile to check the
progress of that stock for the next week or so.
After the “sell” signal and seeing that the stochastics have turned back down, the
potential for a J-Hook Pattern to form is always there. About the third or fourth day,
investigate to see if the stochastics are showing signs of leveling out. This may be
occurring when the stochastics are in the 50 area. If so, watch for Candlestick buy signals
forming. The signals will usually be smaller in size compared to a full-fledged bottoming
signal. For instance, a series of small Hammers may form for a few days at the same
price area. This starts to flatten the trajectory of the stochastics. After this stabilization
period, a small Bullish Engulfing pattern may appear. Buying in at this time produces two
possible profit potentials. First, it is likely that the price is now going up to test the recent
highs. This may be a 4%, 8%, or 10% move in itself. The second potential profit is
breaking through the recent high and having a strong run up. A gap up at or near the
previous highs indicates that the buyers are not concerned about the recent high acting as
a resistance level.
Review the Tiffany & Co. chart, Figure 28a. After an extended uptrend, the stock ran into
selling (profit taking) at the $30.00 area. It pulled back to about $27.50 when buying
seemed to start supporting the price. It became evident that the selling had waned. As the
pullback flattens out, it appears as if the buyers are starting to step backing at around
$28.00. Buying at these levels gives the investor the potential to make $2.00, or about 7%
profit over a three or four day period. As can be seen in this example, once the price got
back to the highs, the stochastics had some juice left in them. At this point, watching the
market direction in general should have been built into the decision of whether to
liquidate or hold. If the market movement was stable to upward, then holding at the
resistance level of the previous high would be warranted.
The gap up to a new trading range was evidence that the sellers were not going to stand in
the way. Unless something severe is taking place when the gap up occurs, such as a
severe drop in the market or a surprise announcement about the company or the industry,
anticipate seeing the buyers continue to move the price higher.
35
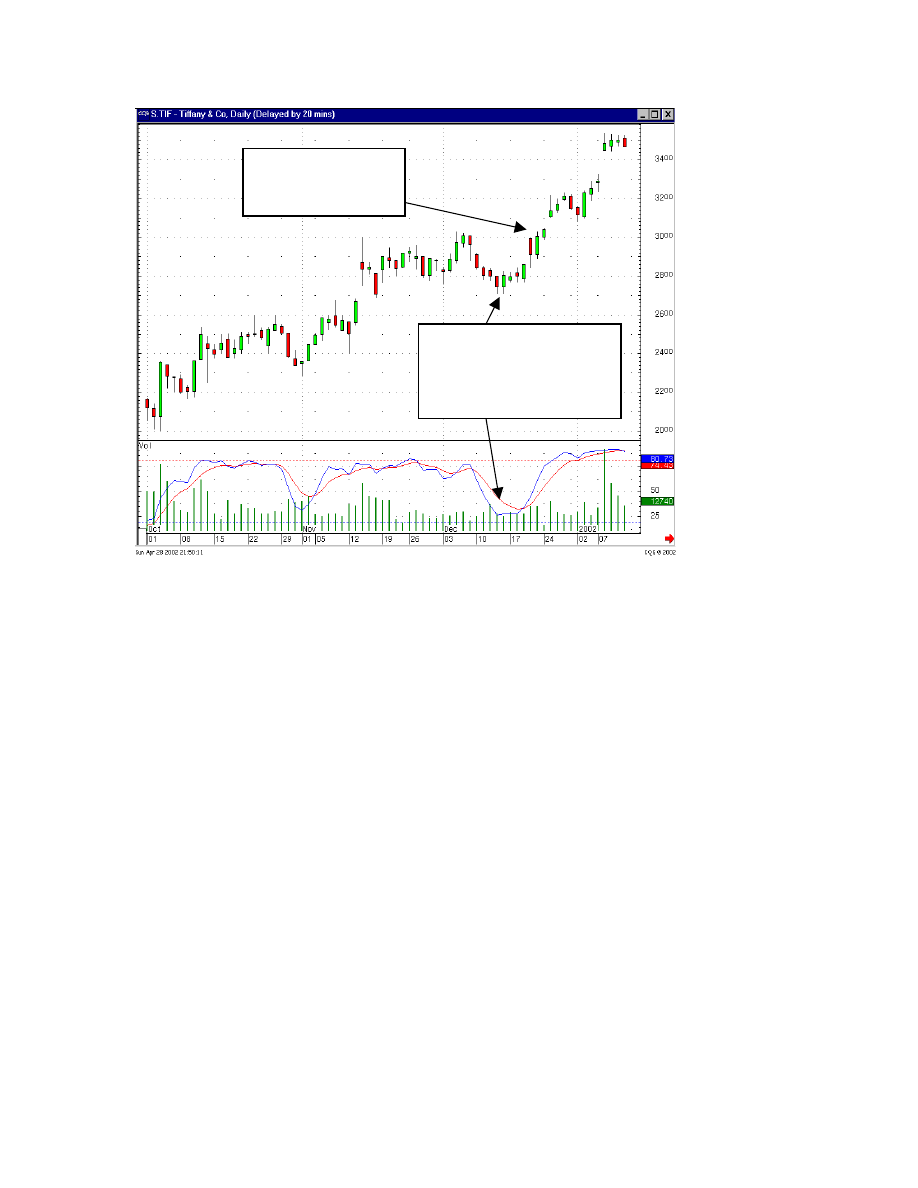
The gap up from the past
high shows new buying
strength
Note the flattening of the
trend and the stochastics
before they are in the
oversold range.
Figure 28a - Tiffany & Co.
The J-Hook does not have to be a complete retracement to the recent highs to have a gap
effect the break out. Note in the Monaco Coach Corp. chart, Figure 28b, how the gap up
occurred prior to actually getting to the previous high.
36
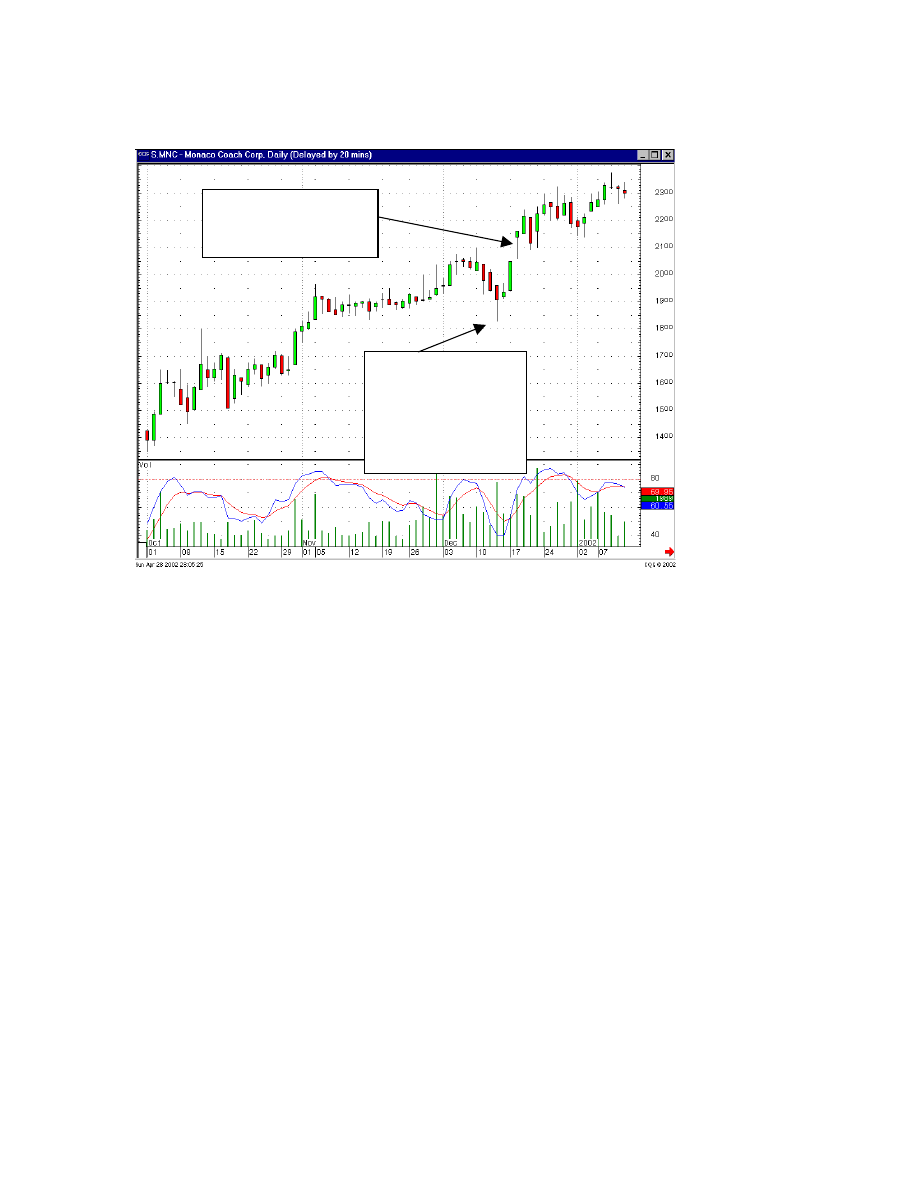
Figure 28b - Monaco Coach Corp.
This gap was well above the
recent high
This J-Hook pullback
is more pronounced
with a Hammer
showing the quick
bottom, then followed
by buying.
Hopefully the Candlestick investor would have been in the position after the Hammer
signal. The gap up to new highs simply indicates that the high was not going to act as a
lid on the price, giving buyers new impetus to take prices even higher.
37
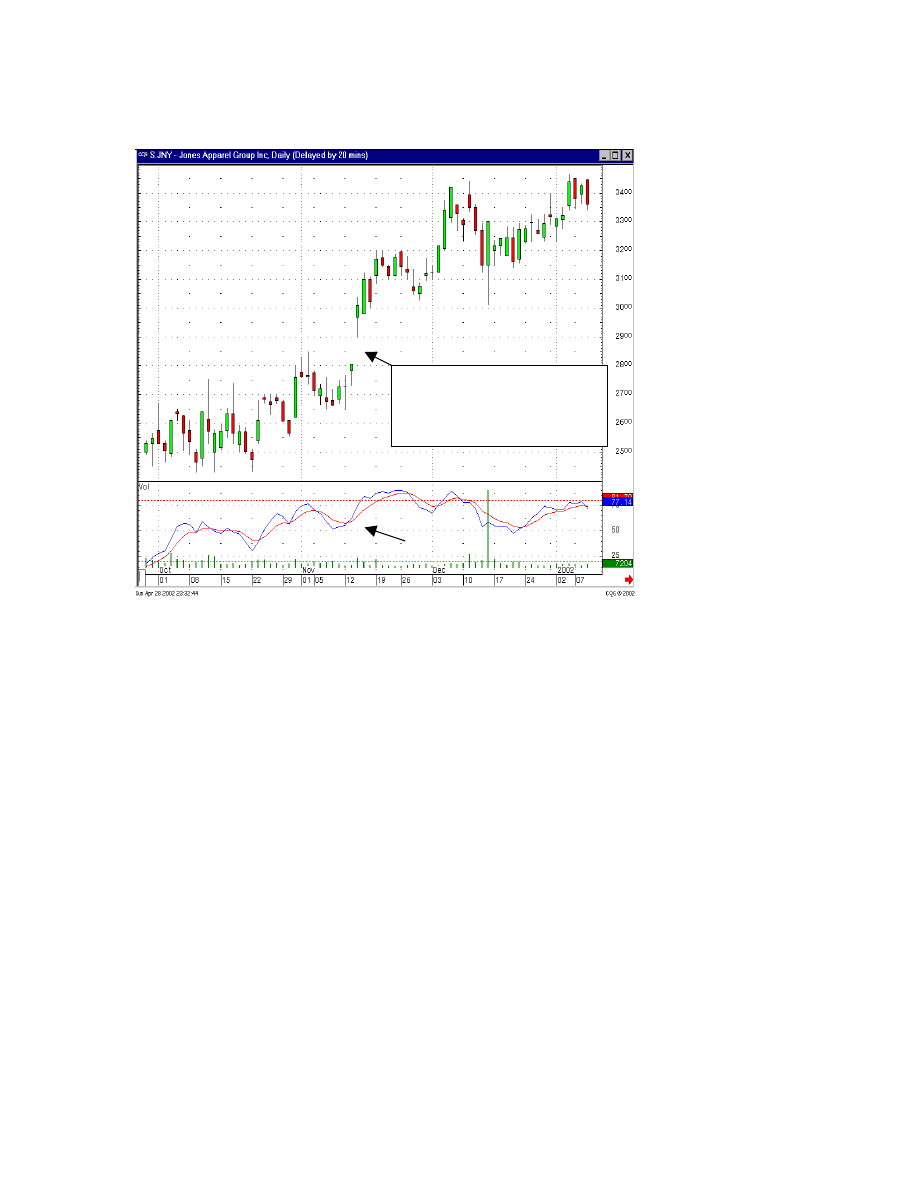
Figure 28c - Jones Apparel Group
ing
The trend pullback was quickly slowed
with a couple of inverted Hammers.
The gap demonstrated new buy
Jones Apparel Group, Figure 28c, provides an obvious visual depiction of the prices
gapping up at the previous high. The alert investor would have been in near the $26.75
level, upon seeing the Inverted Hammers slowing down the pullback.
Participating in the J-Hook Pattern usually requires being familiar with the price
movement of a stock. It is difficult to write a search program that would encompass all
the parameters describing a J-Hook Pattern. The easiest method for locating this pattern is
to watch for an extended uptrend that is now in a pullback. The aggressive trader will
want to get in as the pullback levels out. The more conservative investor will want to get
in upon seeing a gap up as the trend is heading back up, especially if the previous high is
within a reasonable range.
Being educated in Candlestick signals produces the extra advantage that other trading
methods do not provide. This additional knowledge rewards you by illuminating
profitable trade set-ups. You gain the benefits of always having profit potential that other
investors cannot see. You can be racking up profits when the majority of investors are
just getting what the market will give them. Even in difficult markets, you will be able to
generate profits.
38
Island Reversals
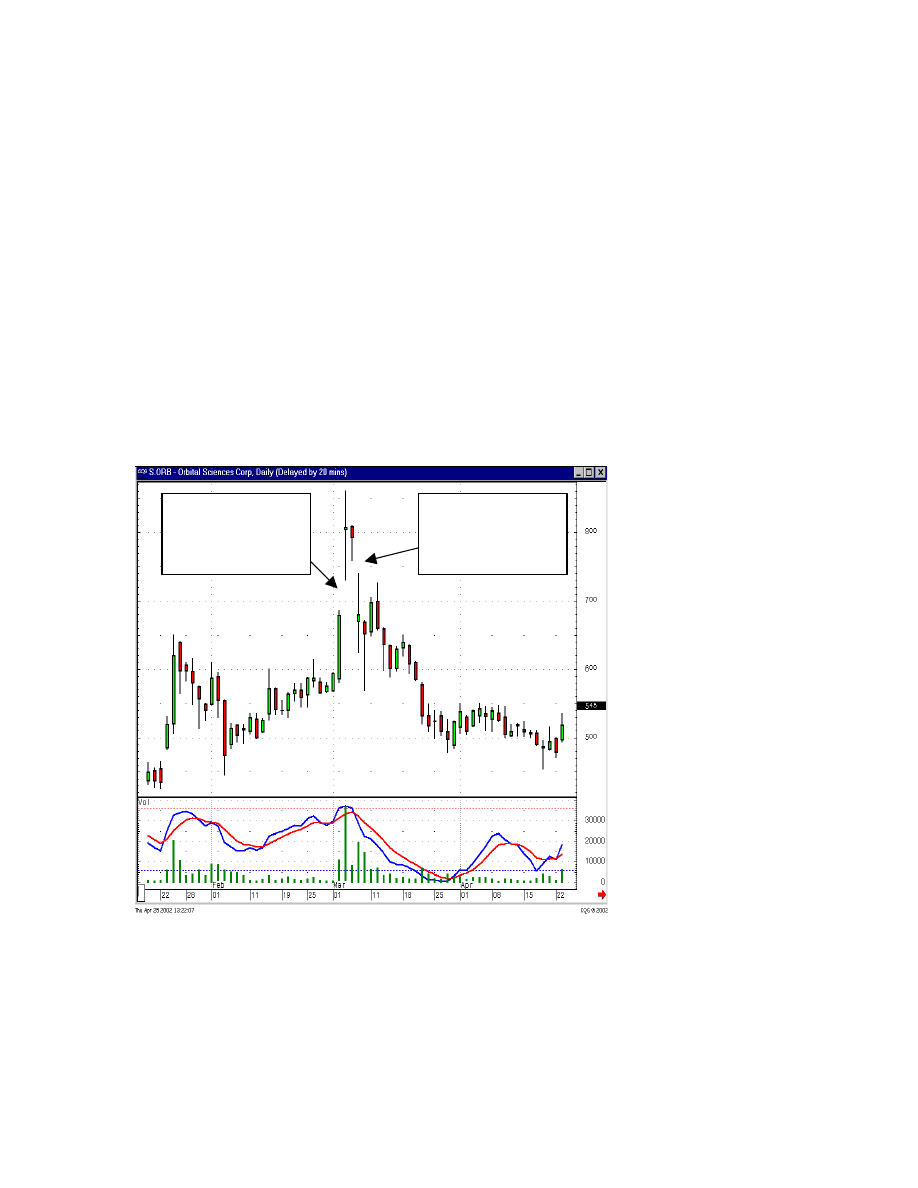
An easy-to-see, obvious reversal is the Island Reversal. It provides a dramatic reversal in
that the enthusiasm that sent a price in a particular direction is countered with the same
enthusiasm going the other way. In the example of Orbital Sciences Corp. ORB,
Figure 29, the up-trend can be easily seen. At the top, after the buying enthusiasm created
a long bullish candle, the price gaps up away from the previous trading. This really
demonstrates that the enthusiasm had reached an apex.
But upon inspecting the formation that it made, a long-legged Doji, the Candlestick
investor should have been alerted to the indecision that was illustrated during this gap up.
The following day did not show any evidence that the buyers were still present. This
would have been further warning that the blow off top was in place. Finally the gap back
down illustrates the great enthusiasm to get back out of the stock. This is an Island
Reversal, usually very accurate and powerful.
Exuberance gapped
prices up after a big up
day, but the Doji
indecision once it got to
those levels
showed
Exuberance was
demonstrated in getting
back out, leaving an
island reversal
Figure 29 - Orbital Sciences Corp.
39
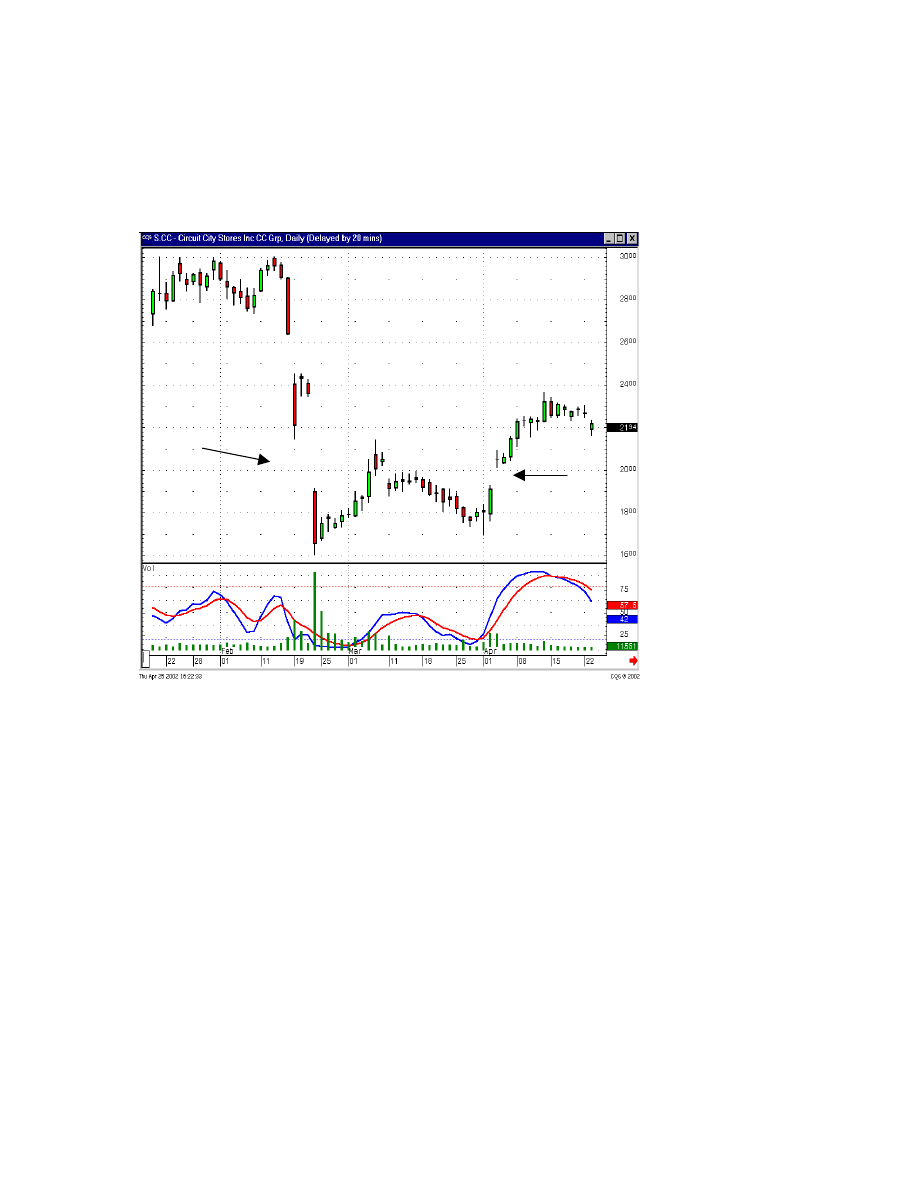
An Island Reversal doesn’t have to be a quick move. Note in the Circuit City chart,
Figure 30, how the gap down was countered with a gap up over six weeks afterwards.
This formation indicates to the long-term investor that a new long-term trend has started.
The gaps on both sides of the bottom trading area make the Island Reversal an easy-to-
see situation.
Figure 30 – Circuit City
As long as the gaps remain unfilled, the trend should remain up.
40

Bad News Gaps
The ultimate poop trade! You just recently bought a position because of a very good
bullish signal. All confirmation is positive, it moves up nicely the first day. THEN, the
dreaded news! The company issues an earnings warning, the SEC announces a surprise
audit, a contract gets cancelled. Whatever the news, the price drops 20%, 30% or greater.
The question is, “What to do now?” Do you sell the stock, take a loss and move on? Do
you trade it at the new levels? Do you hold and/or buy more at these levels? What is the
best course of action?
Traders and long-term investors will have completely different outlooks. The trader
bought the stock a few days back, due to specific parameters for making that trade. He
should consider liquidating the trade immediately and move his money to better
probabilities. The reason for putting on the trade, for a short-term trade, has completely
disappeared after the massive down move. The longer-term investor has a few more
analytical options. They may want to hold the position because the candlestick
formations indicate that the price will move back up or liquidate because the Candlestick
signal shows further decline. Reading the signals becomes an important element in
knowing what to do in a “bad news” situation.
A “bad news” gap down has a multitude of possibilities after the move. The prior trend
gives you valuable information on how to react to the move. Of course, the news is going
to be a surprise or there wouldn’t be the gap down. Analyzing the trend prior to the move
gives you a good idea of how much of a surprise the announcement or news bulletin is.
For example, IBM, Figure 30, recently reported lower earning expectations. The price
gapped down. However, you have to analyze whether this news was a complete surprise
or whether the gradual decline in the stock price was anticipating the coming news. As
can be seen in the IBM chart, the price had been declining
41
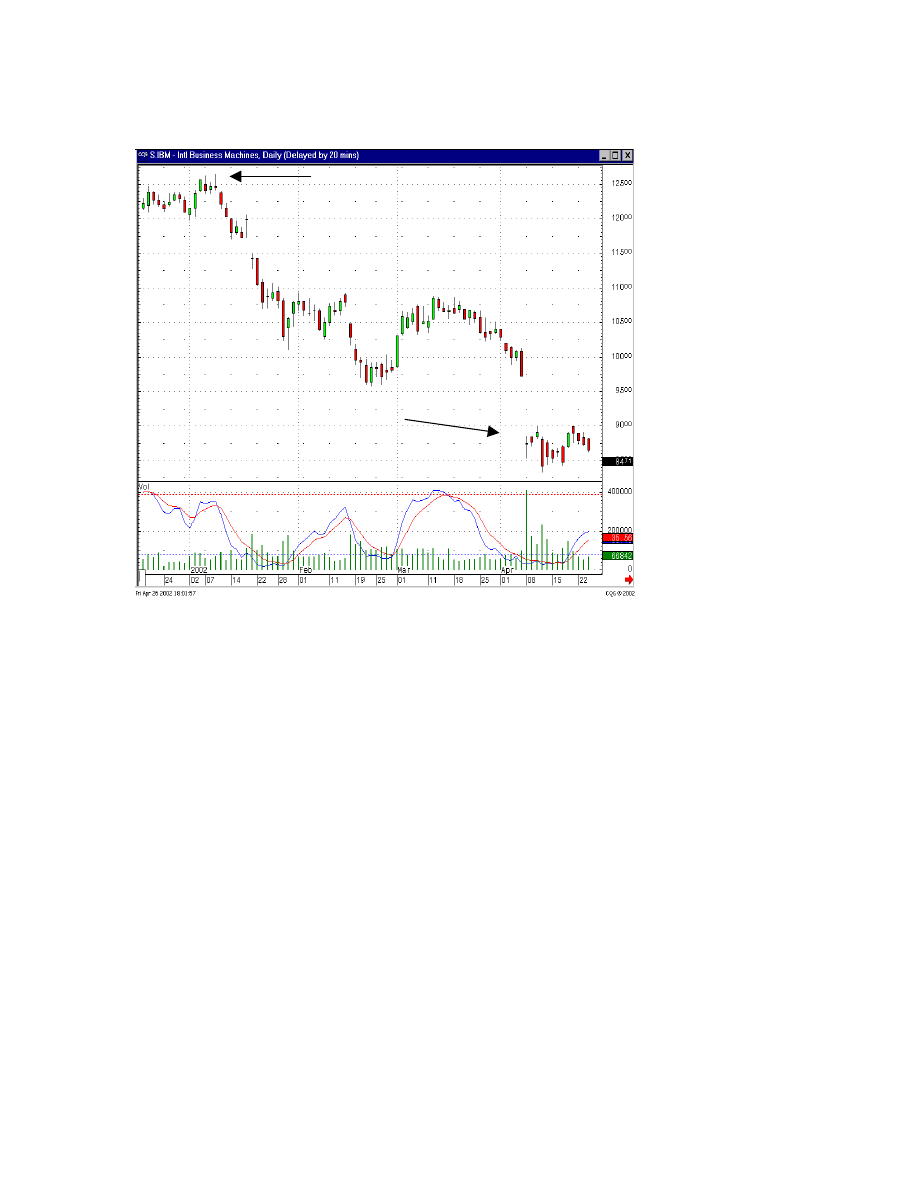
Figure 30 - IBM
for three months before the actual news was announced. The smart money was selling
from the very top, months ahead of time. It was the diehards who held on until the bad
news was reported. As the chart shows, the final gap down produced a long legged Doji,
indicating massive indecision. From that point the buyers and the sellers held the price
relatively stable for the next few weeks. This now becomes one of the few times that a
technical analysis has to revert back to fundamental input. Unless you believe that the
markets in general are ready for a severe downtrend, consider what the chart is telling
you. The price of IBM stock was reduced from $125.00 per share down to $87.00 per
share. The last down move produced a Doji. The price has not moved from that level for
two weeks.
Now let’s look at the fundamental input. IBM, a major U.S. company, well respected,
known to have excellent management. And like any other quality company, it has made
marketing or production mistakes from time to time through the years. The
announcement made that knocked the price down, whether it was a earnings warning,
shutting down a product line or whatever, the factors that were announced as the result of
the problem did not surprise company management. They knew that there were problems
well before the news announcement. Being intelligent business people, the management
of IBM was aware of the problems and had been working on the solutions months before
they had to announce. When the announcement was made, probably many strides had
been already taken to correct whatever problems caused the price to drop. For the long
term investor, it would not be unusual to see the price of IBM move back up to at least
42

the level where it last gapped down, approximately $100. This still provides a 15%
return.
You can chart your own course through common sense analysis. Watching for a
Candlestick “buy” signal gives you the edge. IBM is not going out of business. Who was
buying at these levels when everybody was selling? The smart money! Are the
professional analysts of Wall Street recommending to buy at these levels? Probably not!
But watch the price move from $85.00 back up to $95.00, then you will see the brave
million dollar analysts say it is time to buy. Practical hands-on analysis, being able to see
the “buy” signals for yourself, will keep you ahead of the crowd.
BKS, Barnes and Noble, Figure 31, has a completely different scenario. Notice it was in
an uptrend, just about ready to break out to new highs when it had bad news reported.
With the trend being up prior to the announcement, it appears that the announcement
came as a complete surprise. This should imply that if you are in the position, get out
immediately. There will be no telling what the reaction will be. In this case, the sellers
continued to sell on the big down day after the announcement.
Being out of the position now gives you a better perspective as to what the news will do
to the longer-term trend. It took only the next day to see a Doji to be prepared to get back
into the stock. For the longer-term investor, this becomes a good place to start building
another position. The buyers start becoming evident on the next day after the Doji. A
purchase at this level creates a relatively safe trade. A stop at the lows is a logical point
for getting out. The rationale being that if those levels did not support, the sellers were
still in control.
43
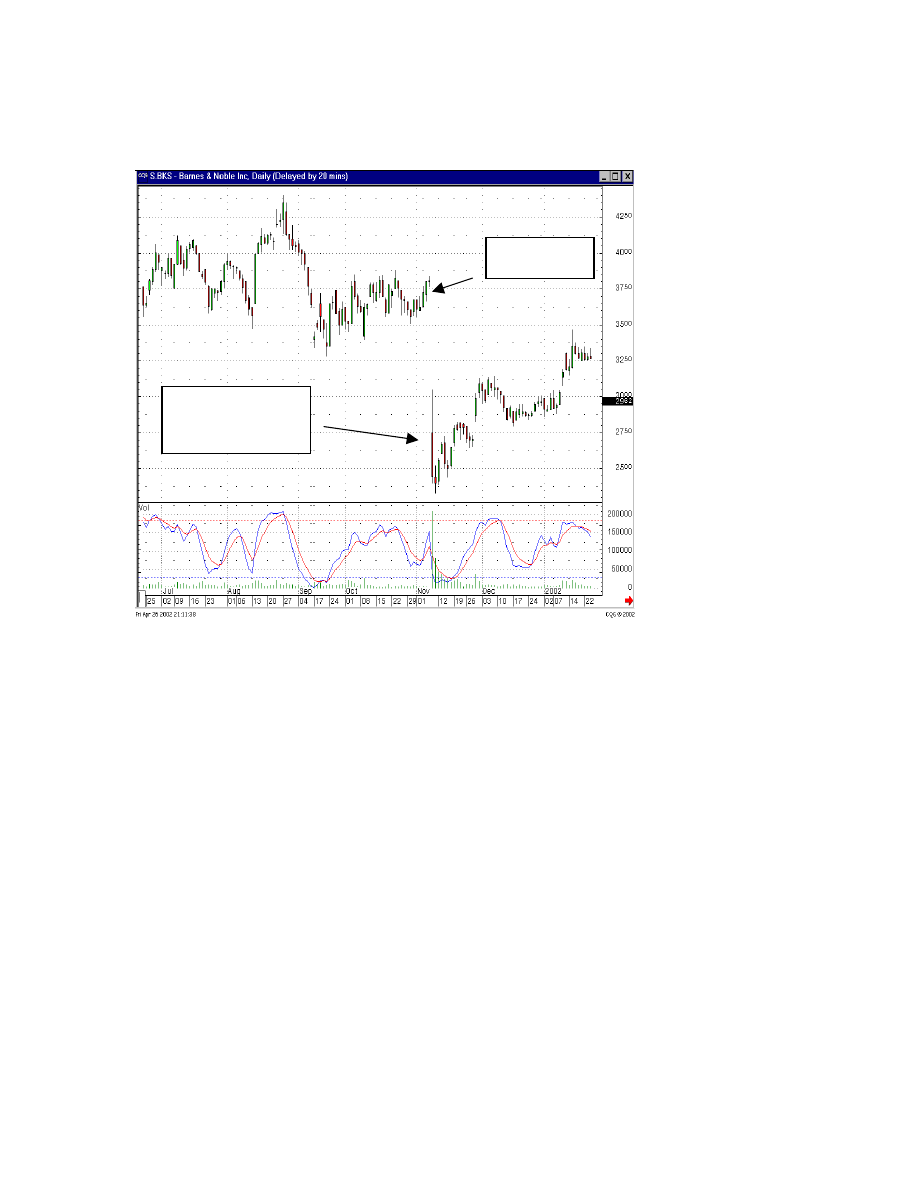
Figure 31, BKS Barnes & Noble
In an uptrend
Sellers continue to
sell even after the
big gap down
On major gap down days, major being a 20% down move or more, there is always the
initial 30 minutes of churning. The traders who were short start buying to cover, while
the sellers are unloading. After that period, the buyers or the sellers will start to
overwhelm the other side. This is where an immense amount of information will be
revealed. If the price starts acting weaker, the news still had sellers participating. If the
price starts up, that would indicate that the news scared out the weak holders and did so at
the level where the buyers felt it was oversold, and they stepped in immediately to buy
the bargain. This should reveal to the Candlestick investor that the white candle forming
represents a buying level. Hold on to the position for awhile. It is not unusual after a
major gap down to see the price move back up to the area from where it gapped down.
This would occur over a six to twelve week period. Still not a bad return, 20% to 30%,
over that time frame.
44

Kicker Signals
The Kicker Signal is one of the most powerful Candlestick signals. This is due to the
signal having a gap built into it. In some cases the gap is very obvious. In other cases the
gap is not always recognized by investors.
As described in Mr. Bigalow’s book “Profitable Candlestick Trading”, the Kicker Signal
dramatically illustrates investor sentiment has changed. This is usually the result of a
major news announcement occurring overnight. The result of this signal is highly
predictable. The trend is now going to go in the opposite direction. And with enough
force to make it always a worthwhile trade.
The description of a Kicker Signal is that the first day of the signal opens and then
proceeds to trade in a specific direction for the rest of the day. The second day opens at
the same level as the open of the previous day. It then proceeds to trade in the opposite
direction of the previous day. On charts other that Candlesticks, it is difficult to see that
there was a definite change of investor sentiment. The two different-colored bodies of the
Candles make it clear the opposite camp has taken over between the bulls and the bears.
The gap when the candles open at the same level is not always recognized in this chart
pattern. The fact that the open on the second day is back at the open of the previous day
means it has already moved from where the price closed that day back up to the open.
The bullish signal is very clear in the Cigna Corporation chart, Figure 29. Not only is the
direction completely reversed, it gapped up with enough strength so that there should be
no doubt that the trend is not going to go higher.
This will also elicit the “chasing a stock” response from most investors. If you know what
this type of move represents, you should have no fear of buying at those higher prices.
45
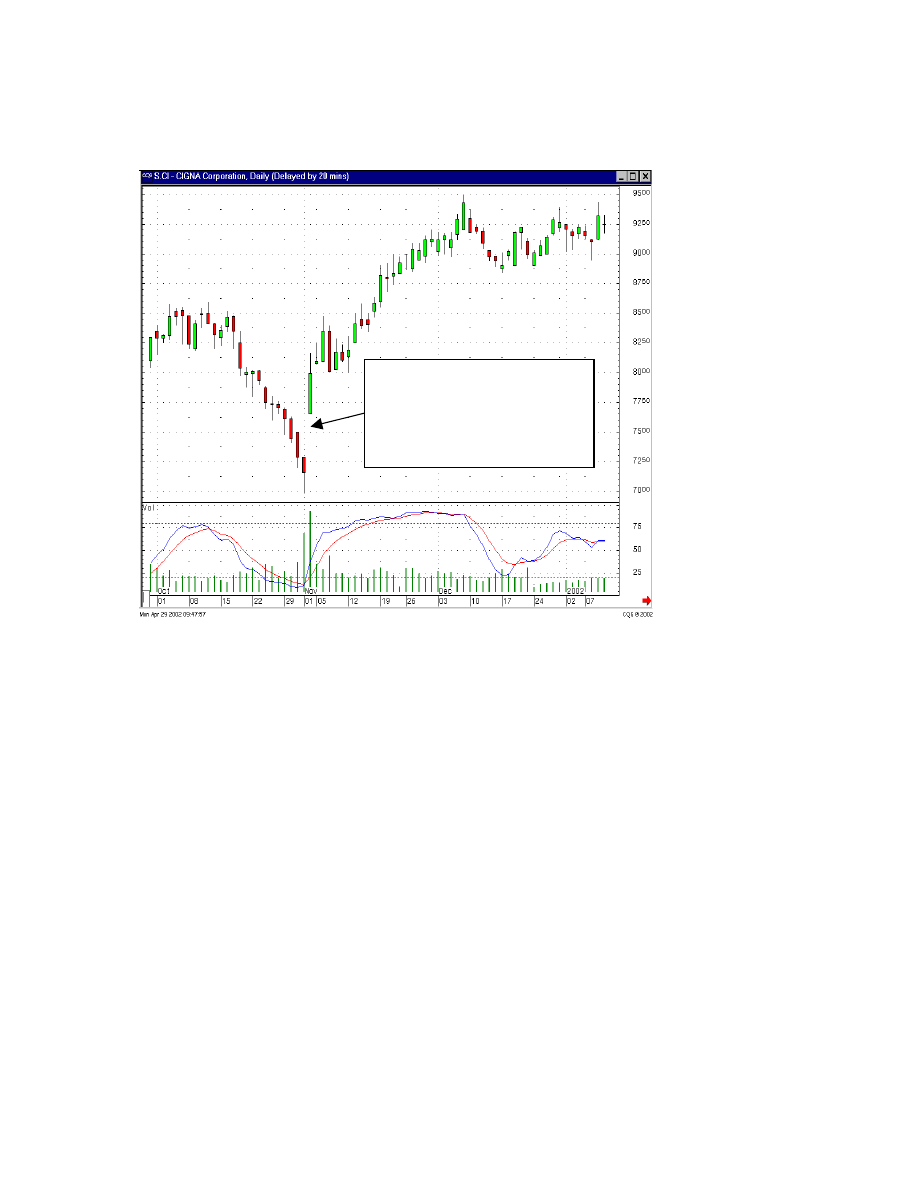
Figure 29 - Cigna Corporation
Whatever the news was, it not only
reversed the trend, the gap away from the
same open showed dramatic change of
investor sentiment.
The visual interpretation of the chart is clear. The trend was definitely down. The news
announcement was apparently completely unexpected and very favorable for the
company. Will prices go straight up after a Kicker Signal? Not necessarily, but it is
advisable to sit through whatever waffling may occur after the signal. The signal itself
depicts a strong change in investor sentiment. Sometimes that change of trend may have
to sop up the opposite stock before the trend gets to proceed.
46
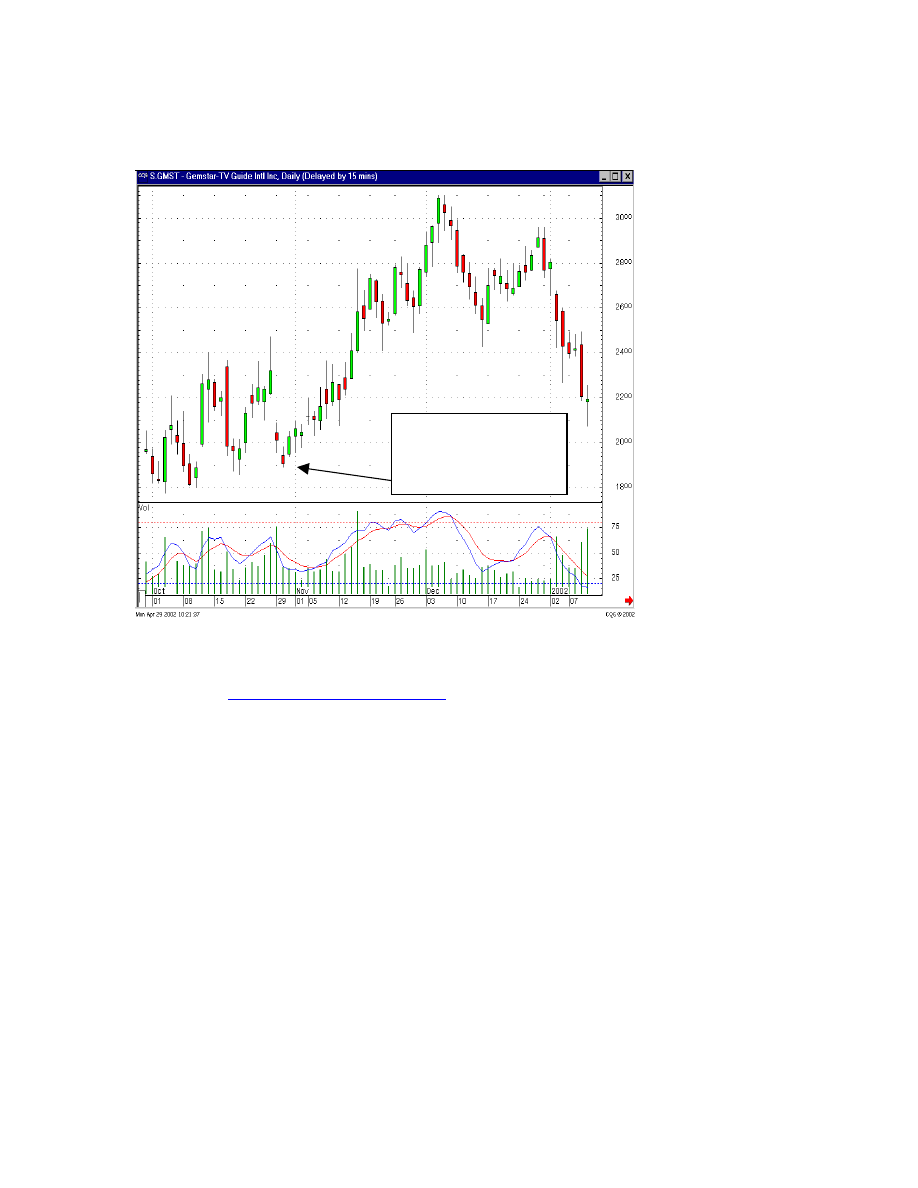
Figure 30 - Gemstar TV Guide Intl. Inc.
A less obvious Kicker
Signal, but as seen, it did
change the direction of
the trend
The observant investor can easily locate the Kicker Signal. TC2000 has very easy search
programs that can be formulated and implemented. (See how to subscribe to TCNet on
our website,
) The trader would be well-advised to search
for Kicker Signal formations every day.
As seen in the Gemstar TV Guide Intl. Inc. chart, Figure 31, the Kicker Signal, although
small, did change the trend direction. As professed by the Japanese about the Doji,
always pay attention when you see it. The same should be said for the Kicker Signal,
always take notice of this formation.
Note in Figure 32 – ISIL, Intersil Corporation, had a close semblance to a Kicker Signal.
Despite the open not being at the exact identical open, the fact that the price gapped back
up to almost the same opening price was warranted by the strong buying through the
remainder of the day.
47
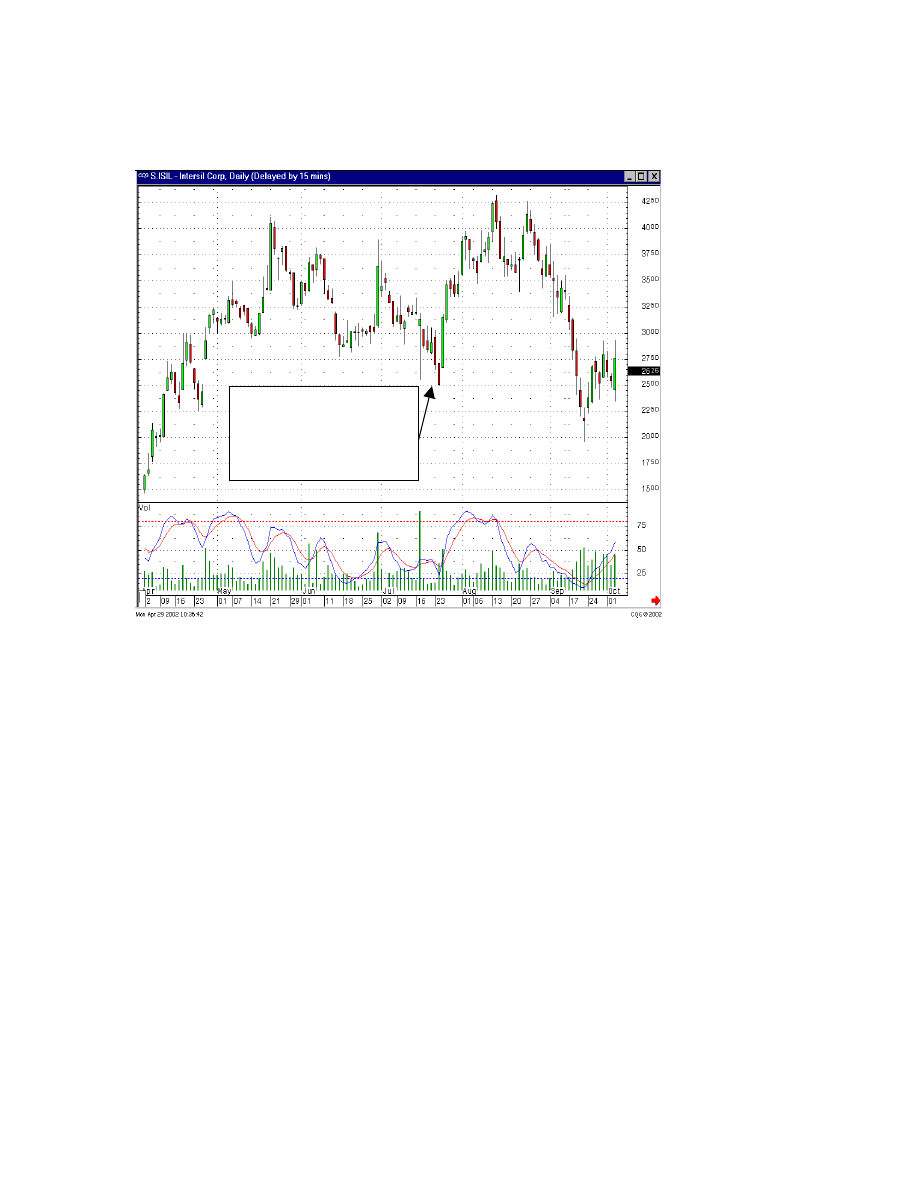
Figure 32 - Intersil Corporation
Not a pure Kicker, the
opens were not quite even,
but the effect would have
been obvious at the end of
the day.
48
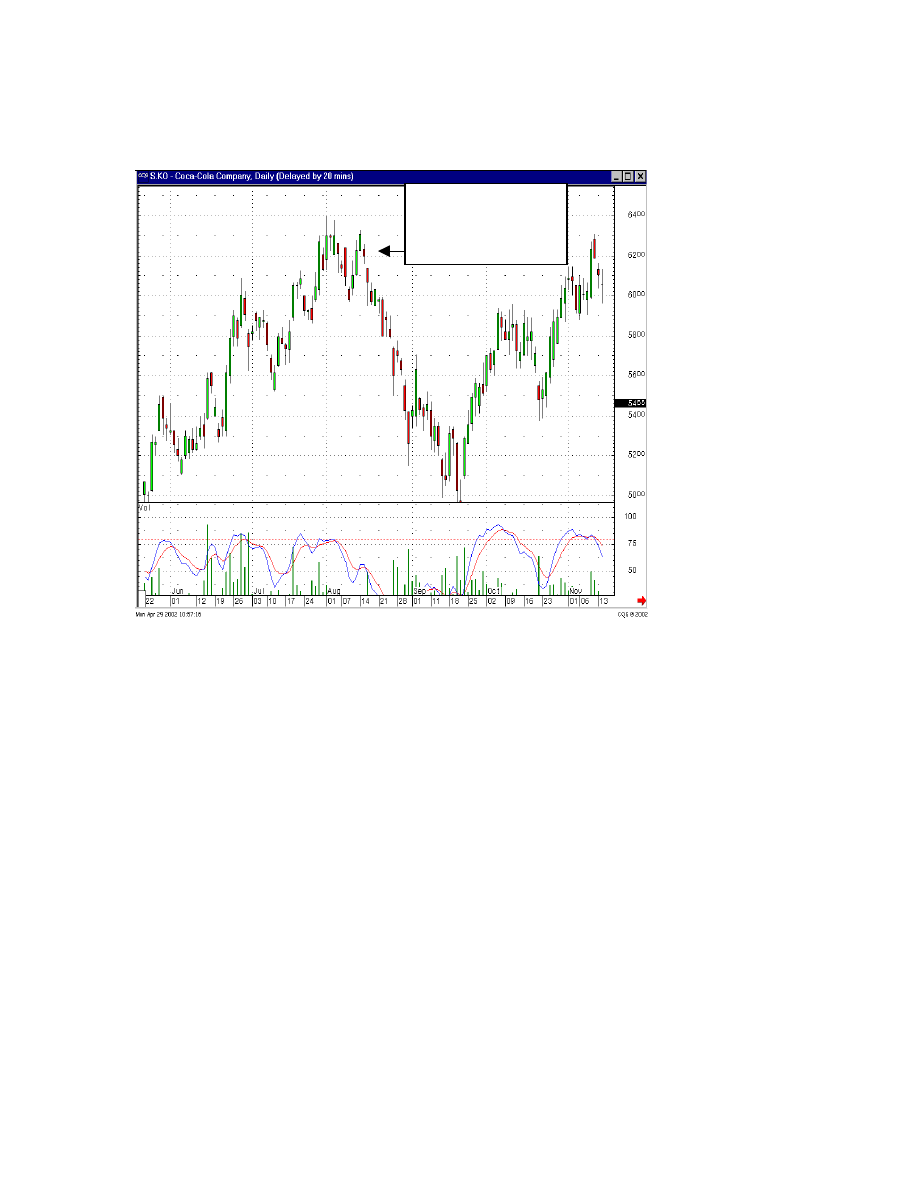
Figure 33 - Coca-Cola Corporation
A sell kicker is just as
effective. It indicates a
rush to get out of a
stock
The Kicker Signal is as effective to show inordinate selling as it does buying. Note in
Figure 33, Coca-Cola, the signal is formed by the gap down from the previous close to
open at that candle’s open and go the other way. Again, this would not be as clearly
defined on a Western Bar chart. The opposite colors and the opposite direction are better
seen on the Candlestick chart.
Kicker Signals do not occur very often. But when they do, they will add great value to
your portfolio. Having the faith that a gap in the opposite direction is not something to be
afraid of but something to be exploited will multiply your earnings many fold. The fact
that a price has already moved 5%, 10%, 15% in the other direction should not be a
reason to refuse to get into a position. The move should be the impetus for getting into
the position. The trend changed and moved dramatically in the other direction for a
reason. Buy the stock. Get rid of the investment psychology that you want to buy the
position if it pulls back to let you in. That is the exact opposite of why you want to get
into a position. Buy the position because you saw that the buyers are in with full force.
You want to be in that run.
49

Summary
Gaps have always played an important part in technical analysis. The movement away
from the previous trading range signifies an extraordinary shift in investor sentiment.
This shift can be more in the same direction as well as a complete reversal of the existing
trend. Most important is that a gap has many ramifications. As illustrated in the book,
gaps identify the force that can start a strong rally, or it can signify that final gasp of
enthusiasm. The Japanese observed these movements over hundreds of years and
accurately identified the results when combined with the signals.
With today’s computer capabilities, it is easy to do searches that specifically track
gapping situations. Investing in these situations alone can make for a high-profit trading
program. Putting the probabilities heavily in our favor, using Candlestick signals to
identify a direction and a gap demonstrating inordinate force, will provide a source of
profitable trades that no investment advisor is capable of doing. Most investors search
years for an advisor, broker, newsletter, or guru that will lead them to consistently
profitable trades. The well-versed Candlestick investor has a constant treasure trove for
generating big profits. These are not hidden secrets. Yet, the combination of these
investment tools have not been utilized by most investors. Having the backup of centuries
of actual participation in this profitable combination takes the guesswork out of
investment decisions.
The Candlestick Forum,
, distinguishes itself from other
Candlestick sites by enlightening investors to the actual implementation of profitable
Candlestick trading strategies. Our soon to be published “Formulas for Major Signals
Using TC2000” will describe how to develop your own search programs using the
effective TC2000 search software. When able to do your own searches, the formulation
of gap searches will put you in charts that have a strong move capability.
Isn’t that the foremost purpose for your investment plan, finding the best possible places
to put your funds? Remember, these signals, formations, and philosophy are not the
results of some quick, thrown-together back-tested investment program. The investment
concepts portrayed in this book are the results of hundreds of years of visual observations
confirmed with actual profitable experience. Once you have observed the results of a gap
up discovered by your search, you will lose past thought processes such as “it is not wise
to chase a stock”. A gap up is the indication that a new trend may be starting when it
occurs at the bottom. It also warns the investor when the exhaustion buying is occurring,
showing the end of the trend.
You can exploit profits that the common investor will shy away from. You will find
profitable trades that most investors do not fully understand. Your wealth will be
multiplied by common sense placement of funds, the same opportunities that the rest of
the investment community has been advised to avoid. You have this knowledge. Use it. If
you are a member of the Candlestick Forum, utilize the expertise of the staff. If you have
50

51
questions about a particular trade or formation, e-mail us. Why experiment when you can
learn directly from decades of experience?
Good Investing!
Stephen W. Bigalow
Document Outline
- “Big Profit Patterns Using Candlestick Signals An
- Table of Contents
- Measuring Gaps
- Gaps At The Top
- Gapping Plays
Wyszukiwarka
Podobne podstrony:
big profits from a very dirty business
Toys How many using There is and There are Worksheet
Cisco Press Configuring the PIX Firewall and VPN Clients Using PPTP, MPPE and IPSec
[15]Reactive oxygen species, cell signaling, and cell injury
11 4 2 7 Lab Managing?vice Configuration Files Using TFTP, Flash, and USB
big profits from a very dirty business
93ZJ Secc 8J Turn Signals and Hazard Warning Flashes
Toys Using How Many and I Have Survey Worksheet 2
Preparation of garlic powder with high allicin content by using combined microwave–vacuum and vacuum
Using Formal Grammar and Genetic Operators to Evolve Malware
96ZJ 8J TURN SIGNAL AND HAZARD WARNING SYSTEMS
Toys How many using There is and There are Worksheet
Survey using actions can and cant worksheet
20th Lecture Little Known Poker Tips That Bring Big Profit
STM 12 6 Pyrotechnic distress signals and line throwing apparatus
Become An Affiliate Marketing Master How To Earn BIG Profits Online Even If You Have NO Products, N
więcej podobnych podstron