
Aviation Human Factors Division
AHFD
Institute of Aviation
University of Illinois
at Urbana-Champaign
1 Airport Road
Savoy, Illinois 61874
Human Error and General Aviation
Accidents: A Comprehensive, Fine-Grained
Analysis Using HFACS
Douglas A. Wiegmann
(University of Illinois)
Scott A. Shappell, Albert Boquet,
Cristy Detwiler, Kali Holcomb,
and Troy Faaborg
(FAA Civil Aerospace Medical Institute)
Final Technical Report AHFD-05-08/FAA-05-03
May 2005
Prepared for
Federal Aviation Administration
Atlantic City International Airport, NJ
Contract DOT 02-G-011

1
HUMAN ERROR AND GENERAL AVIATION ACCIDENTS:
A COMPREHENSIVE, FINE-GRAINED ANALYSIS USING HFACS
Douglas A. Wiegmann, Ph.D.
1
, Scott A. Shappell, Ph.D.
2
, Albert Boquet, Ph.D.
2
,
Cristy Detwiler, B.S.
2
, Kali Holcomb, A.A.
2
, and Troy Faaborg, M.S.
2
1
University of Illinois Institute of Aviation Savoy, IL
2
Civil Aerospace Medical Institute Oklahoma City, OK
The Human Factors Analysis and Classification System (HFACS) is a theoretically based tool
for investigating and analyzing human error associated with accidents and incidents. Previous
research performed at both at the University of Illinois and the Civil Aerospace Medical
Institute (CAMI) have been highly successful and have shown that HFACS can be reliably
used to analyze the underlying human causes of both commercial and general aviation (GA)
accidents. these analyses have helped identify general trends in the types of human factors
issues and aircrew errors that have contributed to civil aviation accidents. The next step is to
identify the exact nature of the human errors identified. The purpose of this research effort,
therefore, was to address these questions by performing a fine-grained HFACS analysis of the
individual human causal factors associated with GA accidents and to assist in the generation
of intervention programs. This report details those findings and offers an approach for
developing interventions to address them.
INTRODUCTION
It is generally accepted that like most accidents,
those in aviation do not happen in isolation. Rather,
they are the result of a chain of events often
culminating with the unsafe acts of aircrew. Indeed,
from Heinrich’s (Heinrich, Peterson, & Roos, 1931)
axioms of industrial safety, to Bird’s (1974) “Domino
theory” and Reason’s (1990) “Swiss cheese” model
of human error, a sequential theory of accident
causation has been consistently embraced by most in
the field of human error. Particularly useful in this
regard has been Reason’s (1990) description of active
and latent failures within the context of his “Swiss
cheese” model of human error.
In his model, Reason describes four levels of
human failure, each one influencing the next. To hear
Reason and others describe it, organizational
influences often lead to instances of unsafe
supervision which in turn lead to preconditions for
unsafe acts and ultimately the unsafe acts of
operators. It is this latter level, the unsafe acts of
operators, that most accident investigations are
focused upon.
Unfortunately, while Reason’s seminal work
forever changed the way aviation and other accident
investigators view human error; it was largely
theoretical and did not provide the level of detail
necessary to apply it in the real world. It wasn’t until
Shappell and Wiegmann, (2000, 2001) developed a
comprehensive human error framework - the Human
Factors Analysis and Classification System
(HFACS), that Reason’s ideas were folded into the
applied setting.
HFACS
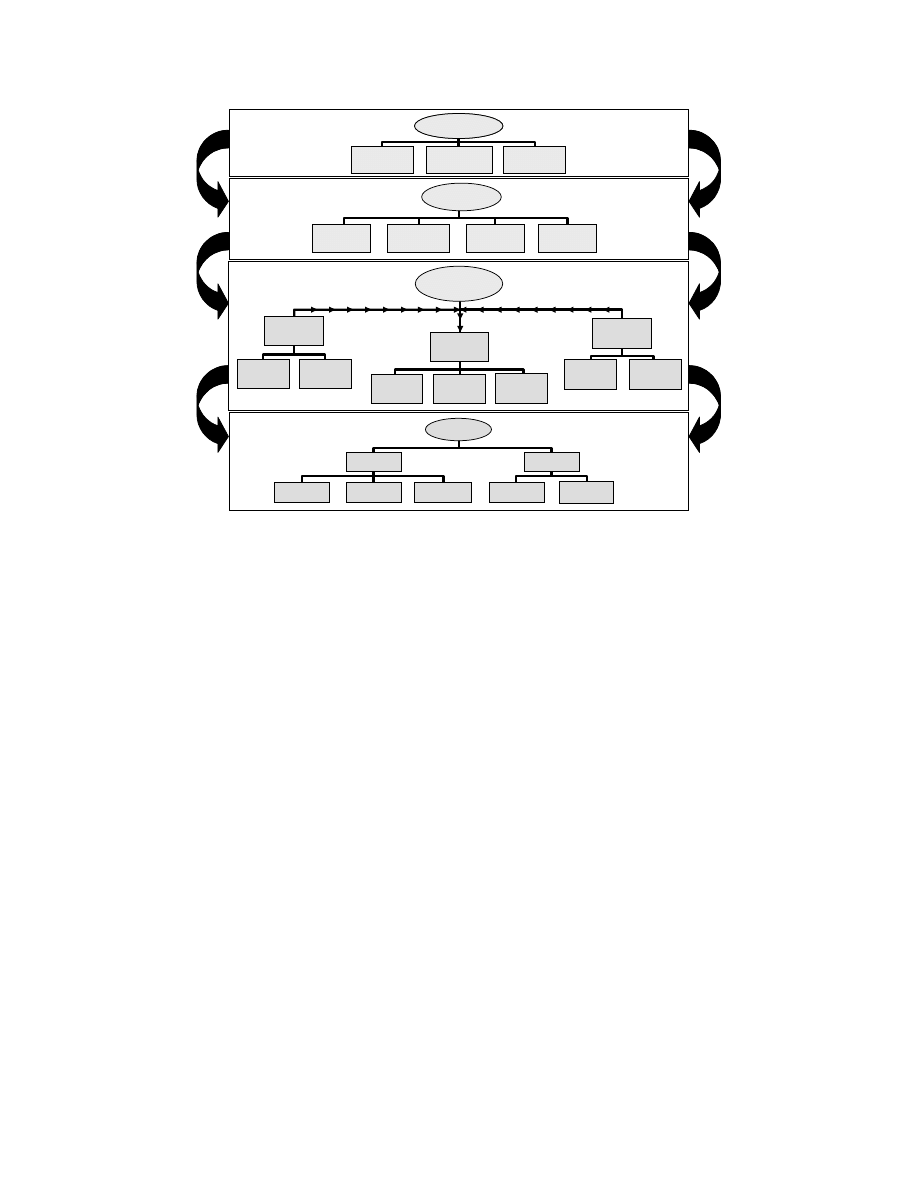
The entire HFACS framework includes a total of
19 causal categories within Reason’s (1990) four
levels of human failure (Figure 1). While in many
ways, all of the causal categories are equally
important; particularly germane to any examination
of GA accident data are the unsafe acts of aircrew.
For that reason, we have elected to restrict this
analysis to only those causal categories associated
with the unsafe acts of GA aircrew. A complete
description of all 19 HFACS causal categories is
available elsewhere (Wiegmann & Shappell, 2003).
2
Errors
UNSAFE
ACTS
Errors
Perceptual
Errors
Skill-Based
Errors
Decision
Errors
Exceptional
Routine
Violations
Inadequate
Supervision
Planned
Inappropriate
Operations
Failed to
Correct
Problem
Supervisory
Violations
UNSAFE
SUPERVISION
Resource
Management
Organizational
Climate
Organizational
Process
ORGANIZATIONAL
INFLUENCES
PRECONDITIONS
FOR
UNSAFE ACTS
Condition of
Operators
Physical/
Mental
Limitations
Adverse
Mental
States
Technological
Environment
Physical
Environment
Personnel
Readiness
Crew Resource
Management
Personnel
Factors
Adverse
Physiological
States
Environmental
Factors
Figure 1. The HFACS framework
Unsafe Acts of Operators
In general, the unsafe acts of operators (in the
case of aviation, the aircrew) can be loosely classified
as either errors or violations (Reason, 1990). Errors
represent the mental or physical activities of
individuals that fail to achieve their intended
outcome. Not surprising, given the fact that human
beings by their very nature make errors, these unsafe
acts dominate most accident databases. Violations on
the other hand, are much less common and refer to
the willful disregard for the rules and regulations that
govern the safety of flight.
Errors
Within HFACS, the category of errors was
expanded to include three basic error types (decision,
skill-based, and perceptual errors).
Decision Errors. Decision-making and decision
errors have been studied, debated, and reported
extensively in the literature. In general, however,
decision errors can be grouped into one of three
categories: procedural errors, poor choices, and
problem solving errors. Procedural decision errors
(Orasanu, 1993) or rule-based mistakes as referred to
by Rasmussen (1982) occur during highly structured
tasks of the sorts, if X, then do Y. Aviation is highly
structured, and consequently, much of pilot decision-
making is procedural. That is, there are very explicit
procedures to be performed at virtually all phases of
flight. Unfortunately, on occasion these procedures
are either misapplied or inappropriate for the
circumstances often culminating in an accident.
However, even in aviation, not all situations have
corresponding procedures to manage them.
Therefore, many situations require that a choice be
made among multiple response options. This is
particularly true when there is insufficient
experience, time, or other outside pressures that may
preclude a correct decision. Put simply, sometimes
we chose well, and sometimes we do not. The
resultant choice decision errors (Orasanu, 1993), or
knowledge-based mistakes (Rasmussen, 1982), have
been of particular interest to aviation psychologists
over the last several decades.
Finally, there are instances when a problem is not
well understood, and formal procedures and response
options are not available. In effect, aircrew find
themselves where they have not been before and
textbook answers are nowhere to be found. It is
during these times that the invention of a novel
solution is required. Unfortunately, individuals in
these situations must resort to slow and effortful
reasoning processes; a luxury rarely afforded in an
aviation emergency – particularly in general aviation.

3
Skill-based Errors.
Skill-based behavior within
the context of aviation is best described as “stick-
and-rudder” and other basic flight skills that occur
without significant conscious thought. As a result,
these skill-based actions are particularly vulnerable to
failures of attention and/or memory. In fact, attention
failures have been linked to many skill-based errors
such as the breakdown in visual scan patterns,
inadvertent activation of controls, and the
misordering of steps in procedures. Likewise,
memory failures such as omitted items in a checklist,
place losing, or forgotten intentions have adversely
impacted the unsuspecting aircrew.
Equally compelling yet not always considered by
investigators is the manner or technique one uses
when flying an aircraft. Regardless of one’s training,
experience, and educational background, pilots vary
greatly in the way in which they control their aircraft.
Arguably, such techniques are as much an overt
expression of ones personality as they are a factor of
innate ability and aptitude. More important however,
these techniques can interfere with the safety of flight
or may exacerbate seemingly minor emergencies
experienced in the air.
Perceptual Errors. While decision and skill-based
errors have dominated most accident databases and
have therefore been included in most error
frameworks, perceptual errors have received
comparatively less attention. No less important,
perceptual errors occur when sensory input is
degraded or “unusual,” as is often the case when
flying at night, in the weather, or in other visually
impoverished conditions. Faced with acting on
inadequate information, aircrew run the risk of
misjudging distances, altitude, and decent rates, as
well as responding incorrectly to a variety of
visual/vestibular illusions.
It is important to note, however, that it is not the
illusion or disorientation that is classified as a
perceptual error. Rather, it is the pilot’s erroneous
response to the illusion or disorientation that is
captured here. For example, many pilots have
experienced spatial disorientation when flying in
IMC. In instances such as these, pilots are taught to
rely on their primary instruments, rather than their
senses when controlling the aircraft. Still, some pilots
fail to monitor their instruments when flying in
adverse weather or at night, choosing instead to fly
using fallible cues from their senses. Tragically,
many of these aircrew and others who have been
fooled by visual/vestibular illusions have wound up
on the wrong end of the accident investigation.
Violations
By definition, errors occur while aircrews are
behaving within the rules and regulations
implemented by an organization. In contrast,
violations represent the willful disregard for the rules
and regulations that govern safe flight and,
fortunately, occur much less frequently (Shappell &
Wiegmann, 1995).
Routine Violations. While there are many ways to
distinguish between types of violations, two distinct
forms have been identified, based on their etiology.
The first, routine violations, tend to be habitual by
nature and are often tolerated by the governing
authority (Reason, 1990). Consider, for example, the
individual who drives consistently 5-10 mph faster
than allowed by law or someone who routinely flies
in marginal weather when authorized for VMC only.
While both certainly violate governing regulations,
many drivers or pilots do the same thing.
Furthermore, people who drive 64 mph in a 55-mph
zone, almost always drive 64 in a 55-mph zone. That
is, they routinely violate the speed limit.
Often referred to as “bending the rules,” these
violations are often tolerated and, in effect,
sanctioned by authority (i.e., you’re not likely to get a
traffic citation until you exceed the posted speed limit
by more than 10 mph). If, however, local authorities
started handing out traffic citations for exceeding the
speed limit on the highway by 9 mph or less, then it
is less likely that individuals would violate the rules.
By definition then, if a routine violation is identified,
investigators must look further up the causal chain to
identify those individuals in authority who are not
enforcing the rules.
Exceptional Violations. In contrast, exceptional
violations appear as isolated departures from
authority, not necessarily characteristic of an
individual’s behavior nor condoned by management
(Reason, 1990). For example, an isolated instance of
driving 105 mph in a 55 mph zone is considered an
exceptional violation. Likewise, flying under a bridge
or engaging in other particularly dangerous and
prohibited maneuvers would constitute an
exceptional violation. However, it is important to
note that, while most exceptional violations are
indefensible, they are not considered exceptional
because of their extreme nature. Rather, they are
considered exceptional because they are neither
typical of the individual nor condoned by authority.
Unfortunately, the unexpected nature of exceptional
violations makes them particularly difficult to predict
and problematic for organizations to manage.

4
PURPOSE
The HFACS framework was originally developed
for the U.S. Navy and Marine Corps as an accident
investigation and data analysis tool (Shappell &
Wiegmann, 2000, 2001; Wiegmann & Shappell,
2003). Since its development, other organizations
such as the FAA have explored the use of HFACS as
a complement to preexisting systems within civil
aviation in an attempt to capitalize on gains realized
by the military. These initial attempts, performed at
both the University of Illinois and the Civil
Aerospace Medical Institute (CAMI) have been
highly successful and have shown that HFACS can
be reliably and effectively used to analyze the
underlying human causes of both commercial and
general aviation accidents (Wiegmann & Shappell,
2003). Furthermore, these analyses have helped
identify general trends in the types of human factors
issues and aircrew errors that have contributed to
civil aviation accidents (Shappell & Wiegmann,
2003; Wiegmann & Shappell, 2001).
Indeed, the FAA’s General Aviation &
Commercial Division (AFS-800) within the Flight
Standards Service and the Small Airplane Directorate
(ACE-100) have acknowledged the added value and
insights gleaned from these HFACS analyses.
Likewise, HFACS was cited by the Aeronautical
Decision Making (ADM) Joint Safety Analysis Team
(JSAT) and the General Aviation Data Improvement
Team (GADIT) as particularly useful in identifying
the human error component of aviation accidents.
To date, however, these initial analyses using
HFACS have only been performed on a limited set of
accident data within the context of civil aviation.
Furthermore, these analyses have generally been
performed at a global level, leaving several questions
unanswered concerning the underlying nature and
prevalence of different error types. As a result, AFS-
800, ACE-100, the ADM JSAT, and the GADIT
committees have directly requested that additional
analyses be done to answer specific questions about
the exact nature of the human errors identified,
particularly within the context of GA. Those specific
questions include:
Question 1: Which unsafe acts are associated
with the largest percentage of accidents across
the entire decade of the 1990’s (the 11 years
from 1990 through 2000)? The answer to this
question will provide insight into the types of
human errors associated with GA accidents from
a global perspective.
Question 2: Have the percentage of accidents
associated with each unsafe act changed over
the years? This question addresses whether any
interventions implemented over the past 11 years
have been successful in reducing accidents
caused by specific types of human error. It also
provides information as to whether any particular
error form has been increasing in occurrence and
would therefore pose serious safety concerns in
the future if not addressed today.
Question 3: Does the pattern of unsafe acts
differ across fatal and non-fatal accidents?
Previous research in other aviation venues (e.g.,
military aviation) has shown that violations of
the rules tend to be associated with a larger
portion of fatal accidents (Wiegmann &
Shappell, 1996). Will this same pattern exist in
GA accidents, or will other errors more readily
distinguish fatal from non-fatal accidents? This
question also directly addresses Objective 2 of
the FAA Flight Plan that states, “Reduce the
number of fatal accidents in general aviation.”
Question 4: Do the patterns of unsafe acts for
fatal and non-fatal accidents differ across years?
Similar to question two, this question addresses
any increasing or decreasing trends in the
specific types of errors across the years,
particular as they relate to accident severity.
Question 5: How often is each error type the
“primary” or seminal cause of an accident?
Answers to the previous questions will highlight
how often a particular error type is associated
with GA accidents. What they do not answer is
how often each type of error (e.g., skill-based) is
the “initiating” error or simply the
“consequence” of another error form (e.g.,
decision errors). To answer this question, we will
examine the seminal unsafe act associated with
each accident. Seminal events in this study were
defined as the first human error cited within the
sequence of events in an accident. Ultimately,
information regarding seminal errors will help
safety managers within the FAA to refine and/or
target intervention strategies so that they can
have a greater impact on GA safety.
Question 6: Do seminal unsafe acts differ across
years? Similar to questions 2 and 4, answers to
this question will provide insight into potential
trends that will impact efforts aimed at reducing
accidents and incidents among GA.
Question 7: Do seminal unsafe acts differ as a
function of accident severity (fatal vs. non-fatal).
Like question 3, an answer to this question could
indicate which seminal errors are most important
for preventing fatal aviation accidents.

5
Question 8: What are the exact types of errors
committed within each error category? Just
knowing that certain types of errors (e.g., skill-
based errors) are of major concern, typically
does not provide enough detail to do anything
about it. What we would like to know, for
example, is what exactly are the skill-based
errors we should focus our safety programs on?
A more fine-grained analysis of the specific
types of errors within each unsafe act causal
category will be conducted to answer this
question.
Question 9: Do the types of errors committed
within each error category differ across accident
severity? Like question 3 and 7, the answer to
this question could indicate which specific type
of error within each category poses the greatest
threat to safety.
Question 10: Do the types of errors committed
within each error category differ between
seminal vs. non-seminal unsafe acts? This
question addresses whether there are differences
in the specific types of errors within each
category that are more likely to initiate the
sequence of events. After all, a given causal
factor may be the most frequently cited error
form, but may not be the most frequently cited
initiating event. If the goal is to intervene before
the accident chain of events is set in motion, this
question will shed light on where to focus safety
resources.
Ultimately, answers to these questions will
provide us with an unprecedented glimpse into the
face of human error within general aviation. The
results of these analyses can then be used to map
intervention strategies onto different error categories,
which will enable safety professionals to determine
plausible prevention programs for reducing GA
accidents. Essentially, this project represents the next
step in the development of a larger civil aviation
safety program whose ultimate goal is to reduce the
aviation accident rate through systematic, data-driven
intervention strategies and the objective evaluation of
intervention programs.
METHOD
Data
General aviation accident data from calendar
years 1990-2000 was obtained from databases
maintained by the National Transportation Safety
Board (NTSB) and the FAA’s National Aviation
Safety Data Analysis Center (NASDAC). For
analysis purposes, we selected only accident reports
that were classified “final” at the time this report was
written. The NTSB reports two levels of
investigation: factual and final. The factual
investigation is a preliminary report that only
includes demographic information associated with
the accident such as the location of the accident and
severity of injuries but no causal factors. Only the
final report that contains the causal factors associated
with the accident was of interest in this study.
We further eliminated from consideration those
accidents that were classified as having
“undetermined causes,” and those that were attributed
to sabotage, suicide, or criminal activity (e.g., stolen
aircraft). When the data were parsed in this manner,
we were left with only those GA “accidents” for
which causal factors had been “determined” and
released by the NTSB.
The data was culled further to include only those
accidents that involved powered GA aircraft (i.e.,
airplanes, helicopters, and gyrocopters), thereby
excluding blimps, balloons, gliders, and ultra-light
aircraft from the analysis. Although the latter is
arguably a powered aircraft, ultra-lights were
considered sufficiently different from other powered
aircraft to warrant exclusion. Finally, since we were
interested in aircrew error, we excluded accidents in
which no aircrew-related unsafe act was considered
causal or contributory to the accident. In the end,
14,436 accidents involving over 25,000 aircrew
causal factors were included and submitted to further
analyses using the HFACS framework.
Causal Factor Classification using HFACS
Seven GA pilots were recruited from the
Oklahoma City area as subject matter experts
(SMEs). All were certified flight instructors with a
minimum of 1,000 flight hours in GA aircraft at the
time they were recruited.
Each pilot was provided roughly 16 hours of
training on the HFACS framework, which included
didactic lecture and practice (with feedback) applying
the HFACS framework to accident reports. After
training, the seven GA pilot-raters were randomly
assigned accidents so at least two separate pilot-raters
analyzed each accident independently.
Using narrative and tabular data obtained from
both the NTSB and the FAA NASDAC, the pilot-
raters were instructed to classify each human causal
factor identified by the NTSB using the HFACS
framework. Note, however, that only those causal
and contributory factors identified by the NTSB were
classified. That is, the pilot-raters were instructed not
to introduce additional casual factors that were not
identified by the original investigation. To do so
would be presumptuous and only infuse additional

6
opinion, conjecture, and guesswork into the analysis
process.
After our pilot-raters made their initial
classifications of the human causal factors (i.e., skill-
based error, decision-error, etc.), the two independent
ratings were compared. Where disagreements existed,
the corresponding pilot-raters were called into the
laboratory to reconcile their differences and the
consensus classification was included in the database
for further analysis. Overall, pilot-raters agreed on
the classification of causal factors within the HFACS
framework more than 85% of the time, an excellent
level of agreement considering that this was, in
effect, a decision-making task.
Human Factors Quality Assurance
The data used in this study were drawn from
NTSB investigation reports that are often highly
technical in nature, requiring a fundamental
understanding of specific terms, flight conditions,
and the overall domain of aviation to be effectively
classified and coded. As aviation SMEs, the pilot-
coders were able to clearly understand each
component of the investigation reports studied.
What's more, the pilot-coders represent the end users
of improved error analysis methods for conducting
accident investigations (i.e., aviation experts typically
investigate aviation accidents). Therefore, they were
considered the appropriate personnel for conducting
the overall HFACS analysis of the GA accident
reports.
General aviation pilots, however, are not SMEs
in the domains of psychology or human factors, and
therefore, they may not fully understand the
theoretical underpinnings associated with the various
error types within the HFACS framework. Hence,
pilots might classify human error data somewhat
differently than SMEs in human factors. Still, pilots
in this study were trained on HFACS, which did give
them some level of expertise when assessing human
error. In fact, an earlier study addressed this issue by
comparing the coded database of a commercial pilot
rater to that of a psychologist and found the data to be
reliable (Wiegmann & Shappell, 2001b).
Nonetheless, to be doubly sure that the pilot
coders had grasped the psychological aspects
underlying human error and HFACS, three additional
SMEs with expertise in human factors/aviation
psychology examined each HFACS classification that
the pilot SMEs had assigned to a given human cause
factor. Essentially, the human factors SMEs were
ensuring that the pilots understood the error analysis
process and did not code causal factors like spatial
disorientation as a decision error, or exhibit any other
such blatant misunderstandings of the HFACS model.
To aid in the process, descriptive statistics were used
to identify outliers in the data, after which the
corresponding NTSB report was obtained. The
reports were then independently reviewed by a
minimum of two human factors (HF) SMEs for
agreement with the previous codes. After the HF
SMEs came to a consensus, the codes were either
changed in the database or left as the pilot SMEs
originally coded them. In the end, less than 4% of all
causal factors were modified during the human
factors quality assurance process.
RESULTS
The results of this research project will be
presented in a manner that addresses each of the
specific questions raised earlier. Each section will
begin by restating the question of interest, followed
by a description of the findings pertaining to it.
Question 1: Which unsafe acts are associated with
the largest percentage of accidents?
The GA data were initially examined to determine
the extent to which each HFACS causal category
contributed to GA accidents, overall. To accomplish
this, the frequency and percentage of GA accidents
associated with each HFACS causal category were
calculated. However, to avoid over-representation by
any single accident, each causal category was
counted a maximum of one time per accident. For
example, regardless of whether a give accident was
associated with one or more skill-based errors, the
presence of a skill-based error for that accident was
only counted once. In this way, the count acted as an
indicator of the presence or absence of a particular
HFACS causal category for a given accident.
The data were calculated in this manner with the
knowledge that most aviation accidents are
associated with multiple causal factors, including, on
occasion, multiple instances of the same HFACS
causal category. However, only by analyzing the data
in this way could a true representation of the
percentage of accidents associated with each causal
category be obtained.
The number and percentage of accidents
associated with at least one instance of a particular
HFACS causal category can be found in Figure 2,
with one notable exception – routine and exceptional
violations. As with post-hoc data examined in other
venues (e.g., the U.S. Navy/Marine Corps, U.S.
Army, U.S. Air Force, etc.) it proved too difficult to
differentiate between routine and exceptional
violations using narrative data obtained from the
NTSB and NASDAC. As a result, the pilot-raters
were instructed to use the parent causal category of
7
“violations,” rather than distinguish between the two
types.
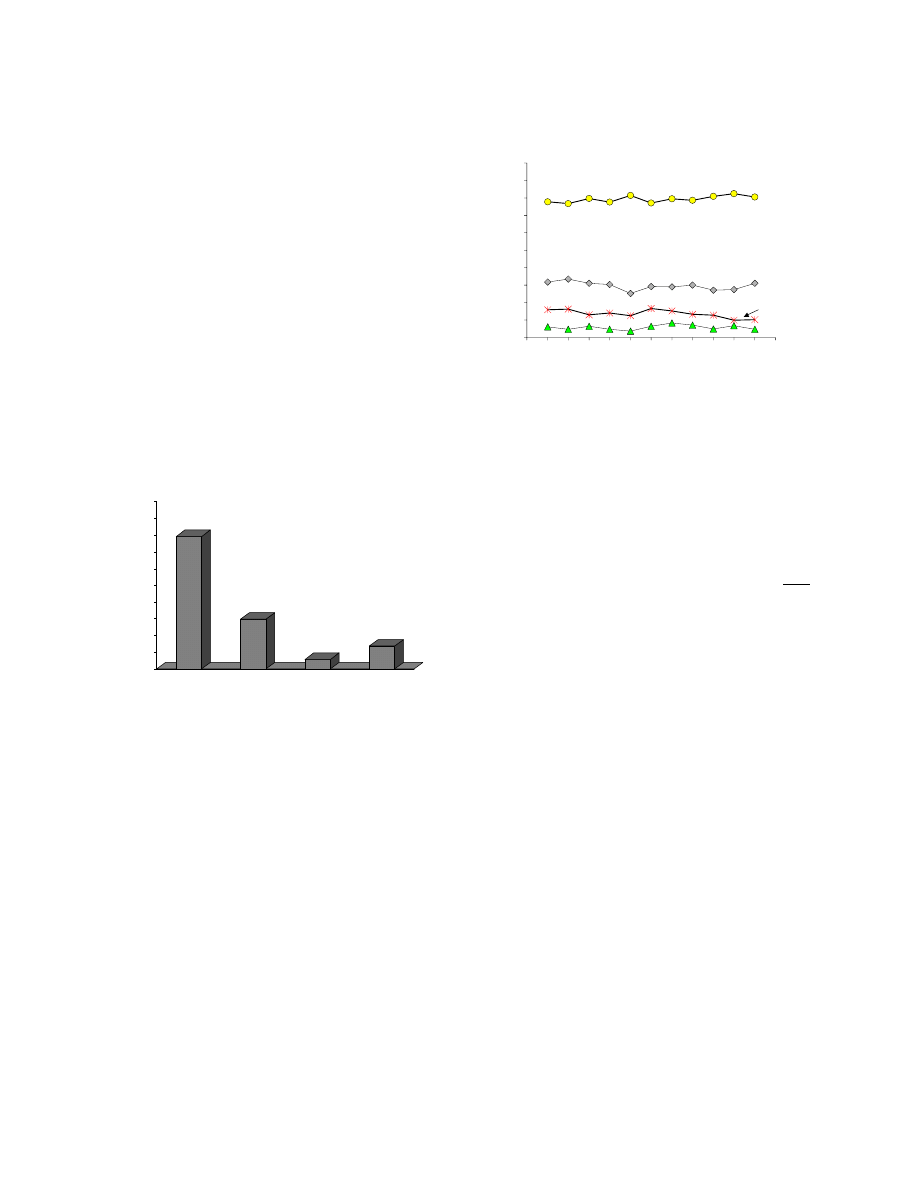
The overall analysis of GA accidents revealed a
picture of human error within GA that was not
possible before the development of HFACS (see
Figure 2). Specifically, the data indicate that skill-
based errors were associated with the largest portion
of GA accidents (79.2% of the 14,436 GA accidents),
followed by decision errors (29.7%), violations
(13.7%), and perceptual errors (5.7%). Note that
many of the accidents were associated with multiple
HFACS causal categories. In other words, an
accident could have been associated with a skill-
based error, decision error, perceptual error, and
violation, or any other combination. Therefore,
percentages of accidents do not total 100%.
Additionally, each accident may be associated with
multiple instances of the same type of unsafe act.
However, as stated previously, the findings presented
here are for those accidents that involve at least one
instance of a particular unsafe act category.
0
10
20
30
40
50
60
70
80
90
100
Skill-based
Error
Decision
Error
Perceptual
Error
Violation
P
ercen
ta
ge o
f Ac
ci
d
en
ts
Figure 2. Percentage of aircrew-related accidents by
unsafe act category.
Question 2: Have the percentage of accidents
associated with each unsafe act changed over the
years?
Analysis of the data on a year-by-year basis
reveals that the proportion of accidents associated
with at least one instance of each unsafe act category
remained relatively unchanged over the 11-year
period examined in this study (Figure 3). This would
seem to suggest that safety efforts directed at GA
over the last several years have had little affect on
any specific type of human error. If anything, there
may have been a general, across-the-board effect,
although this seems unlikely given the safety
initiatives employed. The only exceptions seemed to
be a small dip in the percentage of accidents
associated with decision errors in 1994, and a gradual
decline in violations observed from 1991 to 1994 and
then again from 1995 to 2000. With decision errors
however, the trend quickly re-established itself at
levels consistent with the overall average.
0
10
20
30
40
50
60
70
80
90
100
90
91
92
93
94
95
96
97
98
99
'00
Skill-based
Errors
Perceptual
Errors
Decision
Errors
Violations
P
e
rc
entage
o
f Ac
c
iden
ts
Year
Percentages do not add up to 100%
Figure 3. Percentage of unsafe act accidents by error
category by year.
Question 3: Does the pattern of unsafe acts differ
across fatal and non-fatal accidents?
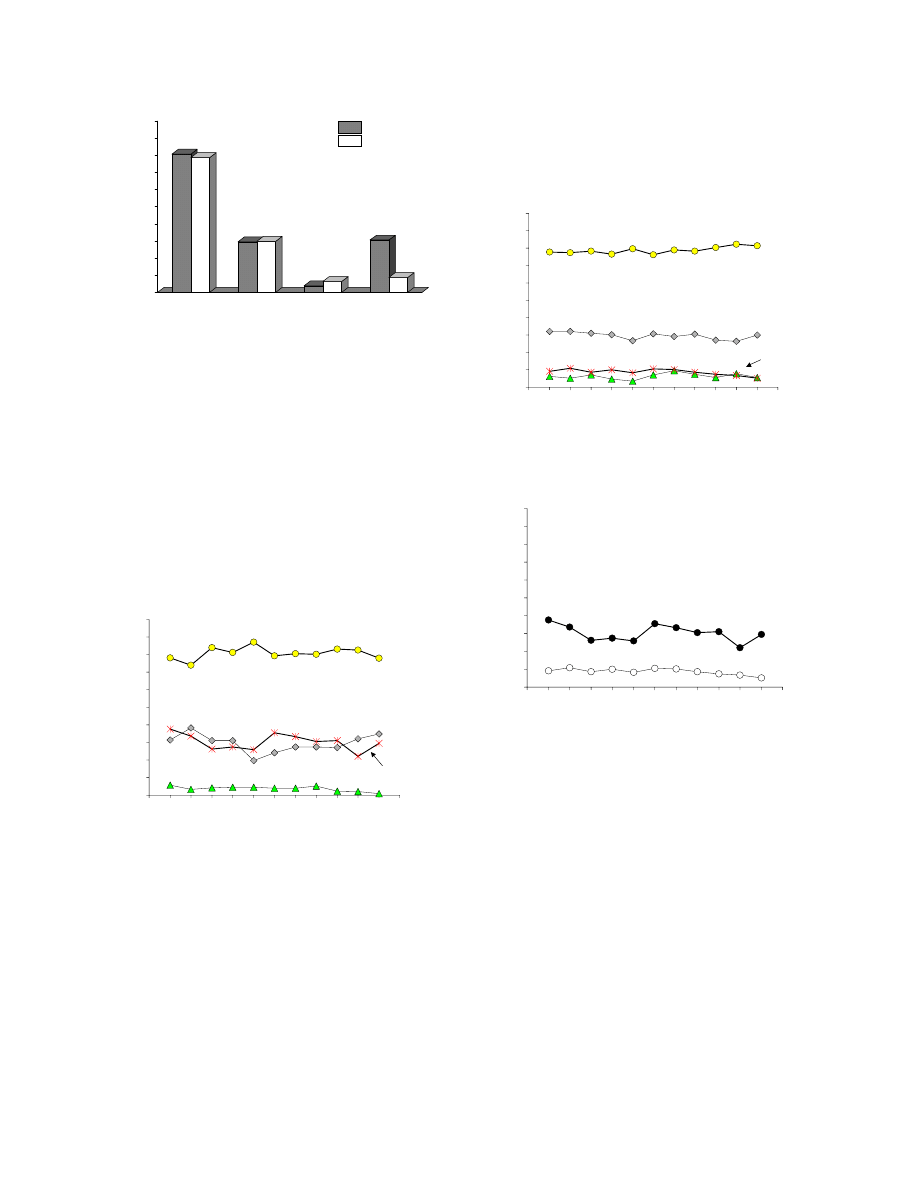
Figure 4 presents the percentage of fatal (n =
3,256) and non-fatal (n = 11,180) accidents
associated with each type of unsafe act. From the
graph in Figure 4, some important observations can
be made. For instance, it may surprise some that
skill-based errors, not decision errors, were the
number-one type of human error associated with fatal
GA accidents. In fact, fatal accidents associated with
skill-based errors (averaging roughly 80.6% across
the years of the study) more than doubled the
percentage of accidents seen with decision errors
(29.5%) and the willful violation of the rules
(30.5%). Even perceptual errors, the focus of a great
deal of interest over the years, were associated with
less than 4% of all fatal accidents. In fact, the
proportion of accidents associated with skill-based
errors was greater than the three other error forms
combined.
Upon closer examination, it appears that the
percentage of fatal and non-fatal accidents with skill-
based, decision, and perceptual errors was relatively
equal (see Figure 4). However, as expected, the
proportion of accidents associated with violations
was considerably higher for fatal than non-fatal
accidents. In fact, using a common estimate of risk
(known as the odds ratio), fatal accidents were
greater than four times more likely to be associated
with violations than non-fatal accidents (odds ratio =
4.547; 95% confidence interval = 4.11 to 5.021,
Mantel-Haenszel test for homogeneity = 1002.358,
p<.001).
Put simply, if a violation of the rules results
in an accident, the pilot is more likely to die or kill
someone else than to get up and walk away.
8
0
10
20
30
40
50
60
70
80
90
100
Skill-based
Error
Decision
Error
Perceptual
Error
Violation
P
ercen
tag
e o
f A
ccid
en
ts
Fatal
Non-Fatal
Figure 4. Percentage of fatal and non-fatal GA
accidents associated with each unsafe act.
Question 4: Do the patterns of unsafe acts for fatal
and non-fatal accidents differ across years?
As with the overall analysis, an examination of
the 3,256 fatal accidents on a year-by-year basis
revealed that the proportion of accidents associated
with at least one instance of each unsafe act category
remained relatively unchanged over the 11-year
period examined in the study (Figure 5). As before,
there appears to have been a slight downward trend in
both decision errors and violations during the early
part of the 1990’s. However, these trends reversed
direction and generally increased during the later half
of the decade.
0
10
20
30
40
50
60
70
80
90
100
90
91
92
93
94
95
96
97
98
99
'00
Skill-based
Errors
Perceptual
Errors
Decision
Errors
Violations
P
ercen
ta
g
e
o
f Ac
ci
d
e
n
ts
Year
Percentages do not add up to 100%
Figure 5. Percentage of fatal GA accidents associated
with each unsafe act.
While this is certainly important information,
some may wonder how these findings compare with
the 11,180 non-fatal accidents. As can be seen in
Figure 6, the above results were strikingly similar to
those associated with fatalities. Again, the trends
across the years were relatively flat, and as with non-
fatal accidents, skill-based errors were associated
with more non-fatal accidents than any other error
form, followed by decision errors. The percentage of
non-fatal accidents associated with violations and
perceptual errors were relatively equal across the
years. In fact, the only real difference in the pattern
of human error seen with fatal and non-fatal GA
accidents was with the percentage of accidents
attributable, in part, to violations of the rules and
regulations of the safety of flight (Figure 7).
0
10
20
30
40
50
60
70
80
90
100
90
91
92
93
94
95
96
97
98
99
'00
Skill-based
Errors
Perceptual
Errors
Decision
Errors
Violations
P
er
cen
tage o
f
A
ccid
en
ts
Year
Percentages do not add up to 100%
Figure 6. Percentage of non-fatal GA accidents
associated with each unsafe act.
0
10
20
30
40
50
60
70
80
90
100
90
91
92
93
94
95
96
97
98
99
'00
Non-Fatal
Fatal
P
ercen
ta
g
e o
f A
cc
id
en
ts
Year
Percentages do not add up to 100%
Figure 7. Percentage of fatal (closed circles) and non-
fatal (open circles) GA accidents associated with
violations.
Question 5: How often is each error type the
“primary” cause of an accident?
The previous analyses have indicated that, overall,
roughly 80% of GA accidents are associated with
skill-based errors. More important however, is how
often skill-based errors are the “initiating” error or
simply the “consequence” of another type of error,
such as decision errors. Consider, for instance, a pilot
who knowingly takes off into a forecasted
thunderstorm without an instrument rating. Such a
choice would be considered a decision error within
the HFACS framework. Later in the flight, the pilot
may be faced with either turning around or flying
through the weather (flying in instrument
meteorological conditions – IMC) when he/she is
9
authorized for only visual flight rules (VFR) flight. If
the pilot willfully penetrates IMC, a violation would
be committed. This might lead to spatial
disorientation (adverse physiological state), which in
turn might lead to a misperception in the aircraft’s
attitude (perceptual error), and ultimately the loss of
control of the aircraft (skill-based error) and an
accident. Given such a scenario, some would argue
that the first error in the chain of events is more
important than the skill-based error committed well
down the error chain.
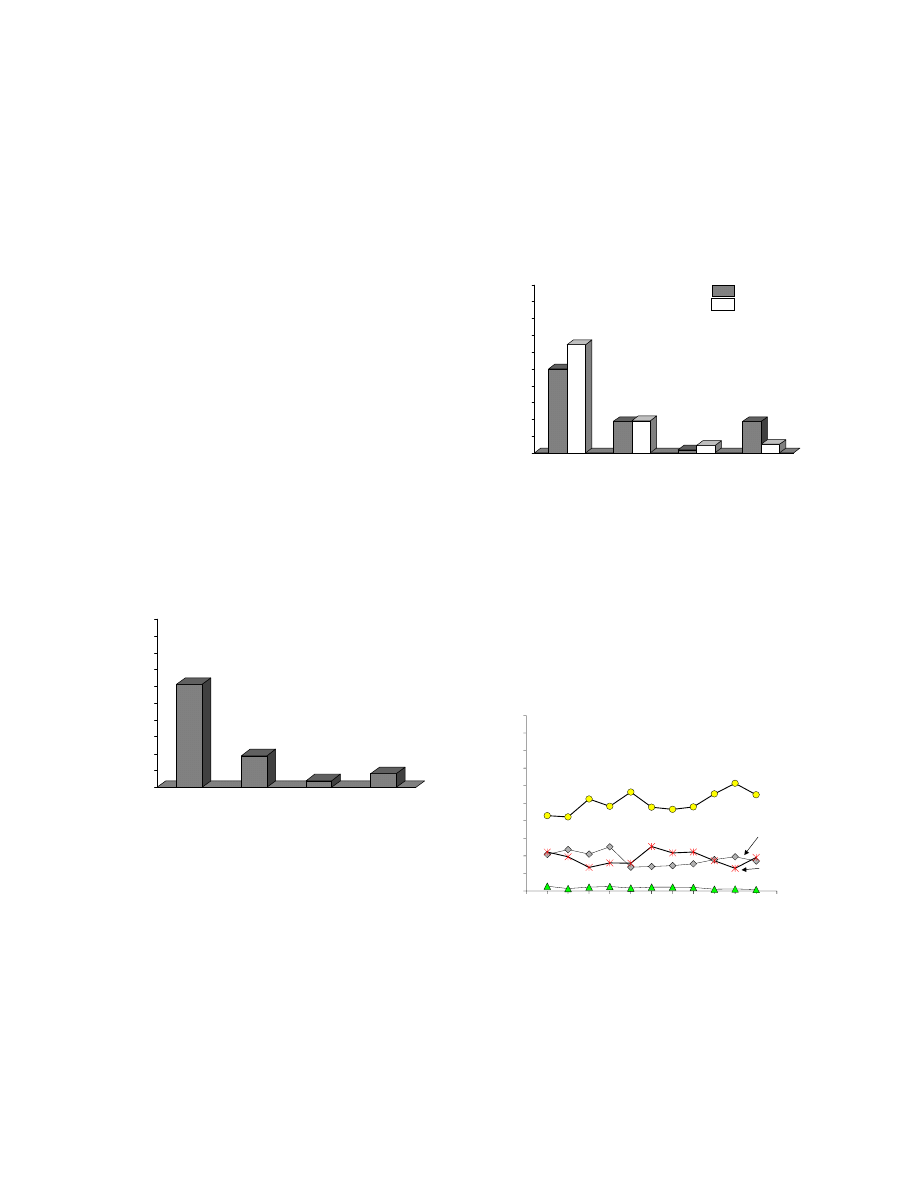
To resolve this potential issue, we examined the
seminal unsafe act associated with each accident, the
results of which are presented in Figure 8. As can be
seen from the figure, the pattern of unsafe acts was
similar to that seen in the overall analysis above (see
figure 2). The only difference is that these
percentages will add up to 100%, since there can only
be one “seminal” human causal factor, which
changes the percentages slightly. Still, nearly 61% (n
= 8,838) of all accidents began with a skill-based
error. In contrast, roughly 19% (n = 2,729) began
with a decision error, 8% (n = 1,180) began with a
violation and only 4% (n = 564) began with a
perceptual error. The remaining 8% (n = 1,125) were
associated with a seminal event other than an unsafe
act (e.g., a precondition for an unsafe act, such as an
adverse physiological state).
0
10
20
30
40
50
60
70
80
90
100
Skill-based
Error
Decision
Error
Perceptual
Error
Violation
P
e
rc
en
tag
e
o
f Ac
c
id
en
ts
Figure 8. Percentage of accidents in which each
unsafe act was the first (seminal) human error in the
accident sequence.
Questions 6 & 7: Do seminal unsafe acts differ
across years or as a function of accident severity
(fatal vs. non-fatal).
Let’s begin with accident severity. As depicted in
Figure 9, seminal skill-based errors were associated
with the largest proportion of both fatal and non-fatal
accidents. However, the percentage of non-fatal
accidents associated with seminal skill-based errors
was somewhat higher than for fatal accidents. In
contrast, seminal violations continued to be
associated with a much larger percentage of fatal
accidents than non-fatal accidents. Percentages of
fatal and non-fatal accidents associated with seminal
decision errors were equivalent as they were for
perceptual errors. Worth noting, the latter (perceptual
errors) were practically non-existent for both fatal
and non-fatal accidents. This finding was not
surprising given that most perceptual errors occur
later in the chain of events after an individual has
committed a violation or following a decision error.
0
10
20
30
40
50
60
70
80
90
100
Skill-based
Error
Decision
Error
Perceptual
Error
Violation
P
erc
en
ta
g
e
o
f A
cci
d
en
ts
Fatal
Non-Fatal
Figure 9. Percentage of fatal accidents associated
with each seminal error category across years.
Figures 10 and 11 illustrate the percentage of fatal
and non-fatal accidents associated with each seminal
error across the 11-year period examined in this
study. In general, the patterns of errors across the
years were virtually the same as those observed for
the overall error trends (see Figures 5 and 6 above).
That is, skill-based errors were consistently the most
frequent cause of both fatal and non-fatal accidents,
followed by decision errors, violations, and
perceptual errors.
0
10
20
30
40
50
60
70
80
90
100
90
91
92
93
94
95
96
97
98
99
'00
Skill-based
Errors
Perceptual
Errors
Decision
Errors
Violations
P
ercen
ta
g
e
o
f Ac
ci
d
e
n
ts
Year
Figure 10. Percentage of fatal accidents associated
with each seminal error category across years.
What differences did occur between fatal and
non-fatal seminal errors (i.e., skill-based and
violations) remained relatively constant across the
years of this study (Figure 12). Furthermore, the
differences were in opposite directions with a higher
percentage of fatal than non-fatal accidents
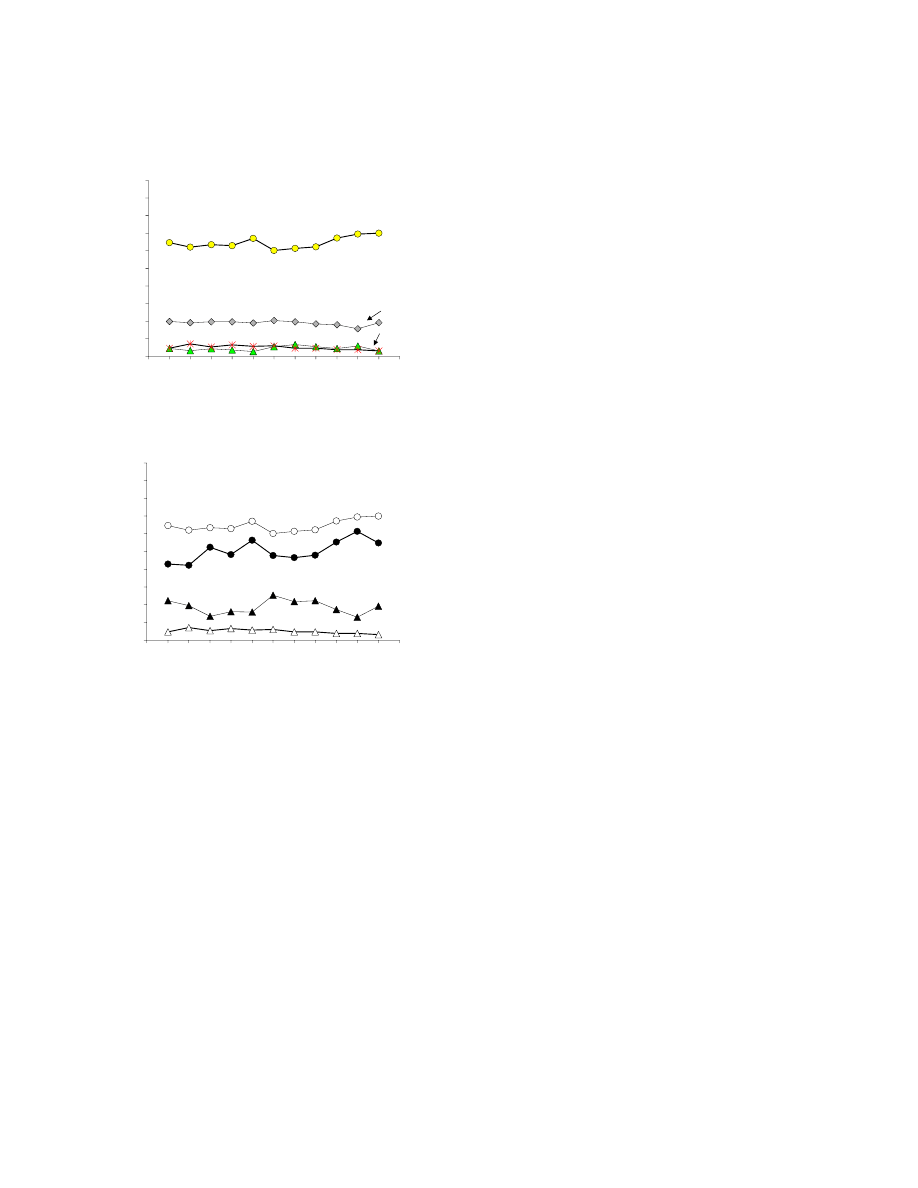
10
associated with violations and a higher percentage of
non-fatal than fatal accidents associated with skill-
based errors.
0
10
20
30
40
50
60
70
80
90
100
90
91
92
93
94
95
96
97
98
99
'00
Skill-based
Errors
Perceptual
Errors
Decision
Errors
Violations
P
er
cen
ta
g
e o
f
Ac
ci
d
en
ts
Year
Figure 11: Percentage of non-fatal accidents
associated with each seminal error category across
years.
0
10
20
30
40
50
60
70
80
90
100
90
91
92
93
94
95
96
97
98
99
'00
Violations
Non-Fatal
Violations
Fatal
P
erc
en
ta
g
e o
f A
cci
d
e
n
ts
Year
Skill-based
Non-Fatal
Skill-based
Fatal
Figure 12: Percentage of fatal (filled symbols) and
non-fatal (open symbols) accidents associated with
skill-based errors (circles) and violations (triangles)
across years.
Questions 8, 9, and 10: What are the exact types of
errors committed within each error category
(question 8) and do these types of errors committed
within each error category differ across accident
severity (question 9) or seminal events
(question10)?
Just knowing that skill-based errors (or any other
type of error) are a major concern does not provide
safety professionals sufficient detail to do anything
about it. What is needed is a fine-grained analysis of
the specific types of errors within each HFACS
causal category, so that targeted interventions can be
developed. With this in mind, we compared each
HFACS classification with the NTSB’s causal factor
designation.
Contained within the NTSB database are three
codes (subject, modifier, and person code) associated
with each cause/factor for a given accident. For
instance, an accident cause may be stated as “VFR
flight into IMC” (subject), “continued” (modifier),
“pilot in command” (person code). Another might be
classified as “directional control” (subject), “not
maintained” (modifier), “copilot/second pilot”
(person code).
Because all causal factors identified in this
analysis involved aircrew, we did not need to
differentiate the person code. Of the two remaining
codes, the subject code provided the most
information. Although the modifier code provided
additional clarity, including it at this time would have
left us with a list of potential human causal factors
well beyond the scope of this study (the list of
subject-modifier combinations far exceeds 500).
Consequently, we restricted our initial analysis to
only the subject codes.
Of note, many of the NTSB subject codes were
similar with only subtle semantic or behavioral
differences among them (e.g., stall, stall/mush,
stall/spin, and tailplane stall). Where similarities
occurred among NTSB causal factors, the
descriptions were grouped according to their similar
nature. This reduced the number of unsafe act
exemplars to a manageable number.
To aid in the presentation of the data, we will
examine the fine-grained analysis for each type of
unsafe act separately. Included in the results will be
the “top 5” human causal factors overall, across
accident severity, and seminal events.
Skill-based errors. The most frequently occurring
human error categories within skill-based errors are
presented in Table 1. As can be seen, nearly 12% of
all skill-based errors involve errors in maintaining
direction control, followed by airspeed (10.63%),
stall/spin (7.77%), aircraft control (7.62%) and errors
associated with compensating for wind conditions
(6.18%). Together, these five cause factors accounted
for nearly one half of all the skill-based errors in the
database. For clarification, “directional control”
typically refers to control of the aircraft on the
ground while “aircraft control” refers to control of
the aircraft in-flight.
The types and frequencies of skill-based errors
coded as fatal/non fatal and seminal events are also
shown in Table 1. As can be seen from this table, the
percentage of skill-based errors involving stall/spin,
airspeed, and aircraft control were greater for fatal
than non-fatal accidents. In fact, causal factors such
as directional control and compensation for wind
conditions were rarely associated with fatal accidents.
This pattern was similar whether one compared fatal

11
and non-fatal accidents overall, or only within
accidents in which a skill-based error was the seminal
event.
Such findings make sense when one considers
that errors leading to a stall/spin, as well as airspeed
and control of the aircraft in the air typically happen
at altitude making survival less likely. In contrast,
errors controlling the aircraft on the ground (such as
ground loops) and compensation for winds (typically
seen during cross-wind landings), while dangerous,
don’t necessarily result in fatalities.
Decision Errors. Table 2 presents the most
frequently occurring decision errors. Improper in-
flight planning tops the list, contributing to roughly
18% of all decision errors. Errors categorized as in-
flight planning refer to planning or plan revision
performed after the aircraft has taken off, and are
often studied as plan continuation errors (Orasanu,
1993; Burian, Orasanu, & Hitt, 2000; Wiegmann,
Goh, & O’Hare, 2002; Muthard & Wickens, 2003).
The remaining decision errors, such as preflight
planning/decision errors (8.94%), fuel management
(8.73%), poor selection of terrain for takeoff/landing
(7.85%), and go-around decision (6.03), all occurred
at approximately the same frequencies. Combined,
these five causal categories accounted for roughly
half (49.89%) of all decision errors in the database. It
should be noted, individual factors related to
weather-related decision making did not reach the top
list (e.g., weather evaluation, flight into adverse
weather, and inadvertent VFR flight into IMC).
However, when combined, they did constitute a
significant portion of the factors related to decision-
making (6%).
Table 2 also presents the types and frequencies of
decision errors for fatal/non fatal and seminal events.
As indicated, the categories in-flight planning and
planning/decision making on the ground tended to be
associated more often with fatal than non-fatal
accidents. Whereas the categories unsuitable terrain,
go around, and fuel management were associated
more often with non-fatal accidents. This pattern was
generally consistent for the overall data, as well as
within seminal events.
Perceptual errors. A review of accident causes
and factors coded as perceptual errors revealed that
misjudging distance was most common, accounting
for over a quarter of all perceptual errors (26.4%; see
Table 3). The next highest was flare (22.5%),
followed by misperceiving altitude (11.4%),
misjudging clearance (7.0%) and visual/aural
perception (5.1%). Together these errors accounted
for a total of nearly three quarters of all perceptual
errors in the database.
The types and frequencies of perceptual errors as
they occurred within fatal/non-fatal accidents are also
shown in Table 3. As can be seen from this table,
there is very little difference in the percentage of fatal
and non-fatal accidents associated with any particular
type of perceptual error. The only exception appears
to be perceptual errors related to performing the flare,
which in most cases are associated more with non-
fatal than fatal accidents.
One may wonder why spatial disorientation did
not make the top 5 of the perceptual error list. Spatial
disorientation, although it often leads to perceptual
errors (e.g., misjudging altitude/attitude) is not
considered an error. Rather, it is considered a
physiological state that cannot be controlled by the
individual. That is, you are either disoriented or you
are not and more important, not every instance of
spatial disorientation leads to a perceptual error (e.g.,
Type 1 – recognized spatial disorientation otherwise
referred to as the “leans”).
That being said, our SMEs classified instances of
spatial disorientation within the HFACS category of
adverse physiological states. Unfortunately, NTSB
investigators did not typically code spatial
disorientation (an adverse physiological state) and
misjudging aircraft attitude (perceptual error) when
reporting the causes/factors associated with an
accident. Hence, perceptual errors were under-
reported here. For completeness, there were 279
accidents out of the 14,436 we examined (1.9 %)
associated with spatial disorientation, of which all but
34 involved fatalities.
Violations. The top five violations are presented in
Table 4. Analysis of the fundamental types of unsafe
acts that are included within the violations categories
reveals that the most common violation involved
visual flight rules (VFR) flight into instrument
meteorological conditions (IMC) (15.5%) and not
following known procedures or directives (10.9%).
The remaining top violations included operating
aircraft with known deficiencies (9.9%), performing
hazardous maneuvers, such as low altitude flight or
buzzing (8.7%), and flight into adverse weather
(8.5%). Together, these five variables accounted for
over half of all violations in the database.
The types and frequencies of violations for
fatal/non-fatal and seminal events are also presented
in Table 4. As indicated, the categories VFR flight
into IMC, hazardous maneuver, and flight into known
adverse weather were much more likely to be fatal
than non-fatal, both overall and for seminal events
only. This pattern is consistent with the observation
that accidents involving violations of the rules are, in
general, more likely to be fatal.

12
Table 1: Five Most Frequent Skill-based Error Categories for Fatal and Non-fatal Accidents.
ERROR CATEGORY
OVERALL
SEMINAL
Frequency (%)
Fatal Non-fatal Total
Frequency (%)
Fatal Non-fatal Total
Directional Control
20 (0.50)
2018 (15.2)
2038 (11.8)
9 (0.57)
1326 (17.5)
1335 (14.6)
Airspeed
713 (17.9)
1127 (8.5)
1840 (10.6)
302 (19.2)
605 (8.0)
907 (9.9)
Stall/Spin
592 (14.9)
753 (5.7)
1345 (7.7)
84 (5.3)
144 (1.9)
228 (2.5)
Aircraft Control
654 (16.5)
665 (5.0)
1319 (7.6)
311 (19.8)
429 (5.7)
740 (8.1)
Compensation for winds
23 (0.6)
1046 (6.2)
1069 (6.2)
12 (0.8
859 (11.4)
871 (9.5)
Table 2: Five Most Frequent Decision Error Categories for Fatal and Non-fatal Accidents.
ERROR CATEGORY
OVERALL
SEMINAL
Frequency (%)
Fatal Non-fatal Total
Frequency (%)
Fatal Non-fatal Total
Inflight Planning
268 (22.9)
683 (17.0)
951 (18.3)
133 (22.6)
427 (19.8)
560 (20.4)
Planning/Decision-making on the Ground
115 (9.8)
349 (8.7)
464 (8.9)
89 (15.1)
284 (13.1)
373 (13.6)
Fuel Management
40 (3.4)
413 (10.3)
453 (8.7)
20 (3.4)
252 (11.7)
272 (9.9)
Unsuitable Terrain Selection
16 (1.4)
391 (9.8)
407 (7.8)
5 (.85)
284 (13.1)
289 (10.5)
Go Around
22 (1.9)
291 (7.3)
313 (6.0)
5 (.85)
70 (3.2)
75 (2.7)
Table 3: Five Most Frequent Perceptual Error Categories for Fatal and Non-fatal Accidents.
ERROR CATEGORY
OVERALL
SEMINAL
Frequency (%)
Fatal Non-fatal Total
Frequency (%)
Fatal Non-fatal Total
Distance
26 (17.8)
233 (27.7)
259 (26.4)
23 (33.8)
135 (26.5)
158 (27.4)
Flare
5 (3.4)
217 (25.8)
222 (22.5)
4 (5.9)
163 (32.0)
167 (28.9)
Altitude
22 (15.1)
91 (10.8)
113 (11.4)
9 (13.2)
51 (10.0)
60 (10.4)
Clearance
18 (12.3)
51 (6.1)
69 (7.0)
14 (20.6)
41 (8.1)
55 (9.5)
Visual/Aural Perception
15 (9.6)
36 (4.2)
50 (5.1)
3 (4.4)
5 (1.0)
8 (1.4)
Table 4: Five Most Frequent Violations for Fatal and Non-fatal Accidents.
ERROR CATEGORY
OVERALL
SEMINAL
Frequency (%)
Fatal Non-fatal Total
Frequency (%)
Fatal Non-fatal Total
VFR Flight into IMC
305 (25.8)
53 (4.7)
358 (15.5)
182 (30.5)
29 (5.2)
211 (25.8)
Procedures/Directives Not Followed
75 (6.3)
176 (15.6)
251 (10.9)
37 (6.2)
109 (19.6)
146 (12.7)
Operating Aircraft with Known Deficiencies
61 (5.2)
168 (14.9)
229 (9.9)
27 (4.5)
97 (17.4)
124 (10.8)
Hazardous Maneuver
154 (13.0)
47 (4.2)
201 (8.7)
83 (13.9)
24 (13.9)
107 (9.3)
Flight into Known Adverse Weather
135 (11.4)
61 (5.4)
196 (8.5)
85 (14.3)
41 (7.4)
126 (10.9)
DISCUSSION
The present study of GA accidents examined
literally thousands of unsafe acts committed by
pilots, perhaps suggesting that, correspondingly,
there are literally thousands of unique ways to crash
an airplane. The results of this study, however,
demonstrate that accidents that may appear to be
unique on their surface can be reliably grouped based
upon underlying cognitive mechanisms of pilot
errors. By applying HFACS, a theoretically based
model of human error, we were able to highlight
several human error trends and identify the categories
of unsafe acts that contribute to both fatal and non-
fatal GA accidents.
While there are many ways to describe the data,
perhaps the best way is to discuss the findings in the
order of their relative contributions to the accidents
examined, beginning with skill-based errors.

13
Skill-based Errors
By far, skill-based errors were the most common
type of error in the accident database as nearly 80%
of all GA accidents were associated with at least one
skill-based error. Of these, roughly half were the first
human causal factor in the chain of events.
The most common skill-based errors among the
over 17,000 identified in this study included: control
or handling of the aircraft on the ground and in the
air, improperly maintaining airspeed, the occurrence
of a stall or spin, and compensating for wind.
Notably, these skill-based errors occurred more often
than any other error category across all types of
unsafe acts – not just the skill-based error category.
These findings are not without precedent in
aviation. In fact, our previous work has shown that
skill-based errors are the most prevalent form of
aircrew error in commercial and military aviation
accidents as well (Wiegmann & Shappell, 1997;
Wiegmann & Shappell, 1999; Wiegmann &
Shappell, 2001a; Wiegmann & Shappell, 2001b).
Still, the percentages reported here were generally
higher than those found in our other investigations,
suggesting that skill-based errors are even more
prevalent in GA than in other domains.
So, what caused these skill-based errors in the
first place? Historically, these types of errors are
often attributed to failures of the pilot to monitor
crucial flight parameters, a fundamental aspect of
cockpit task management (Funk, 1991). For instance,
if a pilot is interrupted or distracted by a situation or
event, they can quickly become sidetracked from the
primary task of flying the airplane. Ultimately, these
intrusions, uncertainties, and general distractions may
keep the pilot from effectively monitoring the
aircraft’s airspeed and altitude as well as other
parameters critical to the flight. As a result, a skill-
based error is committed which may lead to an
incident/accident.
Another possibility is that the lower levels of
experience and training obtained by GA pilots may
account for the larger proportion of accidents
involving skill-based errors than those previously
observed in military and commercial aviation.
Presumably, GA pilots fly less frequently than their
military or commercial counterparts, such that
recency of experience is less. Herein lies the rub.
According to models by Reason (1990) and
Rasmussen (1982), skill-based errors, by definition,
occur during the execution of highly routine events.
Furthermore, once a particular skill is developed, it
must be maintained through repetition and
experience. Given that many GA pilots fly less and
typically participate in less recurrent training than
commercial and military pilots it stands to reason that
their proficiency would be less. In turn, this lack of
proficiency may explain the increase in skill-based
errors evident in the accident data.
Indeed, one can imagine a situation where
increased workload in-flight (e.g., while flying in
IMC or adverse weather) quickly overcomes an
inexperienced pilot and diminishes his or her capacity
to monitor altitude, fuel state, visual clearance,
communication, or directional control. The
inattention that results from a high workload situation
could manifest as failing to monitor critical flight
instruments, the failure to accomplish required in-
flight checklist items, or the gradual, inadvertent loss
of airspeed, all of which would appear as skill-based
errors in the present study.
The real question is how do you go about
reducing skill-based errors. Perhaps the obvious
answer is through experience and effective training.
In that way, pilots are able to increase their
familiarity with the rules governing flight and
increase their knowledge of all aspects of their
domain, improve their overall proficiency, and
become less prone to attention lapses or memory
slips due to high workload. However, that may not be
the only answer. Other proposed ways to manage
pilot workload include detailed checklists (Degani &
Wiener, 1993), automation such as auditory
reminders of critical tasks (Norman, 1988), and task
or workload management training (Wiener, Kanki, &
Helmreich, 1993). Whether these or any other
interventions can be effectively integrated into the
GA environment remains to be determined.
Violations
Violations are the classic glass half empty, glass
half full conundrum. On the one hand, GA accidents
associated with at least one violation were present in
“only” 14% of the data (i.e., glass half full). On the
other hand, GA accidents associated with violations
were second only to skill-based errors when fatalities
were involved (glass half empty). The latter is of
more concern to the FAA.
As stated previously, this finding indicates that if
a pilot breaks a rule that results in an accident, he or
she is much more likely to perish than if the accident
was due to some other non-rule breaking action.
These results are similar to those observed in the
military and commercial aviation domains (Shappell
& Wiegmann, 2001b; Wiegmann & Shappell, 2001a;
Wiegmann & Shappell, 2001b).
Many of the violations cited in the database
involved weather related factors, including VFR

14
flight into IMC. The question still remains, however,
as to why a pilot would willfully fly into such
dangerous weather conditions. Goh and Wiegmann
(2002), along with O’Hare and Smitheram (1995)
found that social pressures often contribute to
continued flight into adverse weather. For example,
Goh and Wiegmann report that GA accidents
resulting from VFR flight into IMC were more likely
to have passengers on board than other types of
accidents. Furthermore, in a study of weather related
decision-making, Holbrook, Orasanu, and McCoy
(2003) identified that “systemic pressures” to fly,
such as those from passengers or other pilots, may
“contribute to pilots’ decisions to continue flight
despite cues suggesting they should do otherwise” (p.
581). Further analysis is needed, however, to
determine the extent to which these factors contribute
to accidents within the present database.
Beyond social pressures previously addressed,
O’Hare and his colleagues (O’Hare & Owen, 1999;
O’Hare & Smitheram, 1995) have explored this
question by investigating how pilots frame the
situation of continuing or discontinuing flight into
adverse weather. They found that pilots who framed
diverting from a flight plan as a loss (e.g., loss of
time, economic loss, or expense of effort) tend to
continue flight into adverse weather; whereas those
who frame a diverting decision as a gain (e.g., in
personal safety) tend to divert more.
Some research (i.e., O’Hare, 1990; Goh &
Wiegmann, 2002) suggests that pilot overconfidence
and a limited appreciation of the risks involved with
flight into adverse weather may also contribute to
weather-related violations. Other researchers contend
that there are GA pilots who “simply do not mind
taking risks and yet who also either lack the
experience to assess those risks, or perhaps have just
enough experience to overestimate their own
abilities” (Knecht, Harris, & Shappell, 2003; p. 673).
While the percentage of accidents involving
violations shows no appreciable decline over the
years studied, the simplest way to reduce the
occurrence of violations is through continually and
consistently enforcing the rules. Unfortunately,
simply enforcing rules more effectively is extremely
difficult within GA due to its organizational
structure. Since it is often not clear exactly whose
authority GA pilots fly under (as compared with
military and commercial pilots), it becomes very
difficult to police the GA system.
As a result, other interventions have been
proposed to reduce the occurrence of violations, such
as the education of GA pilots on the extent of the real
risks of violating established rules and regulations.
Another proposal involves simulator training of
difficult tasks such as emergencies or risky situations
to directly demonstrate the hazards associated with
violating rules (Knecht et al., 2003).
While many cases of flight into adverse weather
are rightfully coded as violations, there are many that
may not represent a willful departure from
established procedures, and are instead the result of
the misdiagnosis of weather conditions, improper
planning, or a decision not to use preflight briefing
service information. These errors represent a
breakdown in the decision-making process, and are
thus captured within the next category to be
addressed - decision errors.
Decision Errors
Decision errors were present in roughly 30% of
all accidents, which is also consistent with
proportions observed within other aviation domains
(O’Hare et al., 1994; Murray, 1997; Shappell &
Wiegmann, 2001a; Wiegmann & Shappell, 2001a;
Wiegmann & Shappell, 2001b). Percentages were
roughly equivalent for both fatal and non-fatal
accidents, even when only seminal decision errors
were examined.
Deeper analysis of decision errors reveals that
xx% of decisions generally involved in-flight
planning, as well as real-time weather evaluation.
Recently, Burian, Orasanu, and Hitt (2000) found
that 28% of accidents involving weather events
involved plan continuation errors, and suggest that
pilots with less experience may “not trust what their
eyes are telling them and so proceed on blindly” (p.
25). Wiegmann, Goh, and O’Hare (2002) also studied
the occurrence of plan continuation errors of VFR
flight into IMC and present findings that suggest that
under certain conditions these errors are more often
attributable to poor situation assessment (early stages
of information processing) than to motivational
judgment. In either case, however, proper planning,
both in the air and on the ground, is a critical
component of flight safety.
Proposals for ways of improving pilots’ decision
making abilities often involve training in aeronautical
decision making. In a study of weather related
decision making, Wiggins & O’Hare (2003) state that
novices may lack a full understanding of the
significance of some weather related cues during
inflight decision making. By examining techniques
used by expert pilots to assess situations and solve
problems is leading to the development of better
training methods. For example, Wiggins and O’Hare
(2001) recently developed a program for the FAA
that uses static weather images and short video clips

15
to help teach pilots how to more effectively identify
critical weather cues. Based on initial evaluations, the
computer based training program shows positive
effects on aeronautical decision making.
Another method of assisting in pilot decision
making is the implementation of planning aids.
Layton, Smith, and McCoy (1994) evaluated the
effectiveness of three different planning aid
(cooperative) systems and demonstrate that different
system design concepts can strongly influence the
cognitive processes and resultant performance.
Through their findings, the researchers recommend
further research into better information displays,
geographical interfaces of alternative route
manipulation, access to more complete and accurate
weather and traffic information, and optimization
technologies to assist users in generating alternative
plans. Other researchers also encourage further study
of the improved design of displays that present
critical data such as weather, traffic, and other
environmental information (Wickens & Hollands,
2000).
Finally, scenario-based training has been shown to
be an affect technique for improving decision-making
in a variety of domains. The training method involves
embedding decision-making tasks within a “real
world” context, similar to those in an operation
context. This is in contrast to traditional training
methods that compartmentalize or modularize
training, teaching decision strategies in isolation or
independently from a particular context. Indeed,
AFS-800 has recently introduced the FAA/Industry
Training Standards (FITS) program aimed at
improving GA flight training through of scenario-
based training and other technologies. While the
program is currently focusing on “personal or
professionally flown single-pilot aircraft for
transportation with new technologies,” (Glista, 2003)
there is no reason to believe that FITS will not
benefit the light-sport and recreational pilots as well.
Perceptual Errors
As hypothesized, perceptual errors contribute to
the smallest percentage of accidents within the
present analysis (5.7%), a percentage that is much
lower than that found in military research (Wiegmann
& Shappell, 2001b). Given the non-tactical, non-
aerobatic, and often non-instrument dependent nature
of GA flight, spatial disorientation and difficulties in
perception are expected to occur at a lower frequency
than is found within military aviation, particularly
within the dynamic domains of fighter, tactical,
aerobatic, or night operating aircraft.
Due to the relatively small numbers of perceptual
errors coded within the general aviation accidents
studied, it is difficult to substantiate prospective
perception error trends or tendencies. It is clear that
errors involving misjudging information comprise the
majority of perceptual errors (xx%) and represent
misperception as opposed to non-detection.
Analogous to decision errors made in the presence of
correct and adequate information, misperception
errors are disheartening as pilots inaccurately code or
improperly process accurate cues from the
environment. The misjudging of altitude, distance, or
descent comprises a large proportion of the
perceptual errors cited within the present database.
Much like skill-based errors, these perceptual errors
may be because of degraded skills due to lack of
recency, experience, or training. However, in
addition to training and practice, other interventions,
such as improve displays may improve the vertical
nature of pilots’ perceptions. For example, such
technologies as radar altimeters, angle-of-attack
indicators, or other such displays may ultimately
reduce perceptual errors and related accidents.
Additional Issues
As previously described, the present study
examined only those causes or contributing factors
that were classified as unsafe acts by the aircrew.
There are a number of other accident cause factors
that involve humans that are not unsafe acts. For
example, communication errors are an example of a
human factor that were not considered to be unsafe
acts within HFACS. Rather, the category of crew
resource management (CRM) captures errors of
communication between pilots and their crew, other
pilots, and air traffic controllers, and is classified as
“preconditions for unsafe acts” within HFACS
(Shappell & Wiegmann, 2001a). Similarly, spatial
disorientation is a factor that should not appear
within the present data as it in itself is not an unsafe
act, but an adverse physiological state.
Misperceptions, visual illusions, and other forms of
spatial disorientation are noticeably (but not entirely)
absent from the current data, but set the stage for
factors that are captured within the categories of
unsafe acts. Examples of these resultant factors
include not maintaining proper airspeed, failure to
maintain altitude, or the occurrence of a stall or spin.
Many other potentially important human-factors
related accident causes are also captured within other
levels of analysis, such as fatigue, alcohol use, self
medication (use of over-the-counter medications),
workload, medical history, and work environment.
While important human factors, these are also not
considered to be unsafe acts and were not examined
within the present study.

16
All this being said, however, such causal factors
were rarely cited in the NTSB database. In fact,
analysis of all seminal events indicated that less than
8% off all seminal cause factors were anything other
than an unsafe act by the aircrew. So, although we
can all agree that such factors as spatial
disorientation, self-medication, poor CRM are all
important issues (and HFACS does account for these
as pre-conditions), they were virtually non-existent in
the database. Such limited information concerning
pre-conditions for unsafe acts does result in only a
partial picture of the entire sequence of events that
contributed to the unsafe acts of aircrew. However,
the present study does represent the most
comprehensive human error analysis of GA data ever
to be conducted and does provide useful information
for understanding the immediate causes of accidents.
Furthermore, such absence of critical pre-conditions
in the database clearly indicates a need to improve
the accident investigation process so that more in
depth information concerning the causes of aircrew
error can be identified. Indeed, HFACS provides one
effective tool for improving this process (Shappell &
Wiegmann, 2003).
CONCLUSION AND RECOMMENDATIONS
The high level of safety currently achieved
aviation operations should not obscure the fact
presented here that many aviation accidents are
preventable. It is important to realize that safety
measures and defenses currently in place in GA may
be inadequate, circumvented, or perhaps ignored, and
that the intervention strategies aimed at reducing the
occurrence or consequences of human error may not
been as effective as possible.
The results of the present study point to several
ways to reduce the rate of GA fatalities. Skill-based
errors can be strategically targeted through
implementation of automation systems, improved
checklists, and workload management training.
Further recommendations to improve GA flight
safety include improved training on the effect of risk,
violations, and aeronautical decision making, as well
as the improvement of display design, the use of
automation systems to reduce pilot workload, and
simulator training of difficult or risky situations.
Through application of the results of the present
study, continued research into the human error causes
of accidents, and continued progress applying human
error theory to existing databases, further
improvements can be made to an already impressive
aviation safety record.
However, these are only a few safety
recommendations for addressing the variety of
human errors identified in this study. In fact, there
may be several more and far better solutions that
have yet to be identified. Unfortunately, most
interventions tend to be bore sited on a single type of
error or event, rather than considering the entire
realm of errors within the accident data. Furthermore,
intervention programs also tend to focus on a single
type of intervention (e.g., engineering or training
fixes) rather than exploring the gamut of other viable
possibilities. What is needed now is method for
generating comprehensive interventions that mapped
onto the specific error categories identified by the
present HFACS analysis (see Figure 11).
However, HFIX does not stop at simply
identifying interventions. Rather, the model guides
safety professionals when evaluating the potential
efficacy of intervention strategies. For instance, as
illustrated in Figure 6, other factors that need to be
considered before implementing any intervention are
cost, feasibility, and acceptability. All of these, and
others, are captured during the process of applying
the HFIX methodology.
Decision
Errors
Skill-based
Errors
Perceptual
Errors
Violations
Organizational/
Administrative
Human/
Crew
Technology/
Engineering
Task/
Mission
Operational/
Physical
Environment
Figure 11. The Human Factors Intervention Matrix
(HFIX).
The systematic application of HFACS to the
analysis of human errors, coupled with the
methodical utilization of HFIX (once fully
developed) to generate intervention solutions, should
ensure that the aviation industry’s personnel and
monetary resources are utilized wisely. This should
occur because such efforts will be needs-based and
data-driven. Furthermore, together these tools will
allow the true effectiveness of intervention programs
to be objectively and impartially evaluated so that
they can be either modified or reinforced to improve
system performance. Only then can any great strides
in improving the GA accident rate be achieved.
REFERENCES
Bird, F. (1974). Management guide to loss control.
Atlanta, GA: Institute Press.

17
Burian, B., Orasanu, J., & Hitt, J. (2000). Weather-
related decision errors: differences across flight
types. Proceedings of the XIVth triennial
Congress of the International Ergonomics
Association/44
th
annual meeting of the Human
Factors and Ergonomics Society (pp. 22-24).
Santa Monica, CA: Human Factors and
Ergonomics Society.
Degani, A., & Wiener, E.L. (1993). Cockpit
checklists: Concepts, design, and use. Human
Factors, 35(4), 345-360.
Funk, K.H. (1991). Cockpit task management:
Preliminary definitions, normative theory, error
taxonomy, and design recommendations. The
International Journal of Aviation Psychology,
1(4), 271-285.
Glista, T. (2003). FAA/Industry Training Standards
(FITS): Times(and training requirements are a
changing). FAA Aviation News, 42(4), 1-6.
Goh, J., & Wiegmann, D.A. (2002). Human error
analysis of accidents involving visual flight rules
flight into adverse weather. Aviation, Space, and
Environmental Medicine, 78(8), 817-822.
Heinrich, H., Petersen, D., & Roos, N. (1931).
Industrial accident prevention: A safety
management approach (1
st
ed.). New York, NY:
McGraw-Hill.
Holbrook, J.B., Orasanu, J.M., & McCoy, C.E.,
(2003). Weather-related decision making by
aviators in Alaska. Proceedings of the 12
th
International Symposium on Aviation Psychology.
Knecht, W., Harris, H., & Shappell, S. (2003).
Effects of visibility, cloud ceiling and financial
incentive on general aviation voluntary takeoff
into adverse weather. Proceedings of the 12
th
International Symposium on Aviation Psychology.
Layton, C., Smith, P.J., & McCoy, E. (1994). Design
of a cooperative problem-solving system for en-
route flight planning: An empirical evaluation.
Human Factors, 36(1), 94-119.
Muthard, E.K., & Wickens, C.D. (2003). Factors that
mediate flight plan monitoring and errors in plan
revision: Planning under automated and high
workload conditions. Proceedings of the 12
th
International Symposium on Aviation Psychology.
Murray, S.R. (1997). Deliberate decision making by
aircraft pilots: A simple reminder to avoid
decision making under panic. The International
Journal of Aviation Psychology, 7(1), 83-100.
Norman, D.A. (1988). The Psychology of Everyday
Things. New York: Basic Books.
O’Hare, D. (1990). Pilots’ perception of risks and
hazards in general aviation. Aviation, Space, and
Environmental Medicine, 61, 599-603.
O’Hare, D., & Owen, D. (1999). Continued VFR into
IMC: An empirical investigation of the possible
causes: Final report on preliminary study.
Unpublished manuscript. University of Otago,
Dunedin, New Zealand.
O’Hare, D., & Smitheram, T. (1995). “Pressing on”
into deteriorating conditions: An application of
behavioral decision theory to pilot decision
making. International Journal of Aviation
Psychology, 5, 351-370.
Orasanu, J. M. (1993). Decision-making in the
cockpit. In E. L. Wiener, B. G. Kanki, and R. L.
Helmreich (Eds.), Cockpit resource management
(pp. 137-172). San Diego, CA: Academic Press.
Rasmussen, J. (1982). Human errors: A taxonomy for
describing human malfunction in industrial
installations. Journal of Occupational Accidents,
4, 311-333.
Reason, J. (1990). Human Error. New York:
Cambridge University Press.
Shappell, S. & Wiegmann, D. (1997). A human error
approach to accident investigation: The Taxonomy
of Unsafe Operations. The International Journal
of Aviation Psychology, 7, 269-291.
Shappell, S. & Wiegmann, D. (2000). The Human
Factors Analysis and Classification System
(HFACS). Federal Aviation Administration, Office
of Aviation Medicine Report No. DOT/FAA/AM-
00/7. Office of Aviation Medicine: Washington,
DC.
Shappell, S. & Wiegmann, D. (2001). Applying
Reason: the human factors analysis and
classification system (HFACS). Human Factors
and Aerospace Safety, 1, 59-86.
Shappell, S. & Wiegmann, D. (2003). A human error
analysis of general aviation controlled flight into
terrain (CFIT) accidents occurring between 1990-
1998. Office of Aerospace Medicine Technical
Report No. DOT/FAA/AM-03/4. Office of
Aerospace Medicine: Washington, DC.
Wiegmann, D.A., Goh, J. & O’Hare, D. (2002). The
role of situation assessment and flight experience
in pilots’ decisions to continue visual flight rules
flight into adverse weather. Human Factors,
44(2), 189-197.

18
Wiegmann, D.A., & Shappell, S.A. (2001a).
Applying the human factors analysis and
classification system (HFACS) to the analysis of
commercial aviation accident data. Paper
presented at the 11
th
International Symposium on
Aviation Psychology.
Wiegmann, D. & Shappell, S. (2001b). Human error
analysis of commercial aviation accidents:
Application of the Human Factors Analysis and
Classification System (HFACS). Aviation, Space
and Environmental Medicine, 72, 1006-1016.
Wiegmann, D.A., & Shappell, S.A. (2001c). Human
error perspectives in aviation. International
Journal of Aviation Psychology, 11(4), 341-357.
Wiegmann, D. & Shappell, S. (2003). A human error
approach to aviation accident analysis: The
human factors analysis and classification system.
Burlington, VT: Ashgate Publishing Ltd.
Wiener, E.L., Kanki, B.G., & Helmreich, R.L. (Eds.)
(1993). Cockpit Resource Management. San
Diego, CA: Academic Press.
Wiggins, M., & O’Hare, D. (2003). Expert and
novice pilot perceptions of static in-flight images
of weather. The International Journal of Aviation
Psychology, 13(2), 173-187.
Document Outline
- INTRODUCTION
- Decision Errors. Decision-making and decision errors have be
- However, even in aviation, not all situations have correspon
- ERROR CATEGORY
- Directional Control
- Airspeed
- Stall/Spin
- Aircraft Control
- Compensation for winds
- ERROR CATEGORY
- Inflight Planning
- Planning/Decision-making on the Ground
- Fuel Management
- Unsuitable Terrain Selection
- Go Around
- ERROR CATEGORY
- Distance
- Flare
- Altitude
- Clearance
- Visual/Aural Perception
- ERROR CATEGORY
- VFR Flight into IMC
- Procedures/Directives Not Followed
- Operating Aircraft with Known Deficiencies
- Hazardous Maneuver
- Flight into Known Adverse Weather
- REFERENCES
Wyszukiwarka
Podobne podstrony:
General Aviation Accidents Trends
Local and general anaesthetics Nieznany
Comparison of Human Language and Animal Communication
SHSBC419 ARCBreaks and Generailities
Human Papillomavirus and Cervical Cancer Knowledge health beliefs and preventive practicies
Human Relations and Social Responsibility
Marxism, the Resource Mobilization Theory, and General?ono
Musculoskeletal Sonography,Part 1, Introduction and General Principles leido
HUMAN RIGHTS AND THEIR IMPORTANCE goood
Introduction to Differential Geometry and General Relativity
Chater N , Oaksford M Human rationality and the psychology of
HANDOUT ERROR and?EDBACK TAXONOMY
Local and general anaesthetics Nieznany
William Pelfrey Billy, Alfred, and General Motors, The Story of Two Unique Men, a Legendary Company
sapiens 422 2 2 geoarchaeology where human social and earth sciences meet with technology
Einstein A Relativity the special and general theory (free web version, Methuen, 1920) (115s)
Einstein, Special and General Relativity
A1 3 CARVALHO, João M S (2013) The Crucial Role of Internal Communication Audit to Improve Internal
więcej podobnych podstron