
Turkish J. Eng. Env. Sci.
28 (2004) , 297 – 305.
c
T ¨UB˙ITAK
Anaerobic Treatability of Sanitary Landfill Leachate in a Fluidized
Bed Reactor
Hakkı G ¨
ULS
¸EN, Mustafa TURAN
˙Istanbul Technical University, Department of Environmental Engineering,
˙Istanbul-TURKEY
e-mail: mturan@ ins.itu.edu.tr
Received 17.06.2004
Abstract
The treatability of leachate from Odayeri Sanitary Landfill, located in the European part of ˙Istanbul, in
an anaerobic fluidized bed reactor (AFBR) was investigated. The experiments were performed in a pilot-
scale fluidized bed reactor having an inner diameter of 10 cm, a height of 165 cm and an effective volume of
13 l. The reactor medium was a typical filter sand having an arithmetic mean diameter of 0.5 mm and a fixed
bed height of 70 cm. The AFBR experiments were carried out by increasing gradually the organic loading
rate (OLR) from 2.5 to 37 kg COD/m
3
per day in 8 operating steps. During the 240 days of operation, the
feed rate (Q
f
) and the hydraulic retention time (HRT) were 13 l/day and 1 day, respectively. The measured
variables were chemical oxygen demand (COD), alkalinity, pH, volatile and suspended solids, ammonia,
and gas rates. Ammonia removal efficiency appeared to be very low. However, ammonia inhibition has
not occured during the study. COD removal increased from 80% to 90 % with increasing organic loading
rates and the AFBR attained steady state conditions with a COD removal of 90% after 80 days. A good
biogas production yield (Y
gas
) was obtained; 0.50-0.52 l of biogas per g COD
rem
with a methane (CH
4
)
content of 75%. The attached biomass concentration (X
att
) comprised about 90% of the total biomass
concentration and showed an increase throughout the bed in the range of 3 to 38%. The mean attached
biomass concentration also increased up to 70,000 mg/l in the last 2 months (for days 164-220).
Key words: Anaerobic treatability, Biogas production, Fluidized bed reactor, Landfill leachate, Organic
loading, Process efficiency.
Introduction
The leachate generated from a landfill site containing
organic, inorganic and heavy metal compounds has a
complex mixture with a foul odor. The flow rate and
the composition of the sanitary landfill leachate vary
depending on the site, season and age of the landfill
(Knox and Jones, 1979). Leachates from young land-
fills can be characterized as high-strength wastewa-
ters with 400-13,000 mg/l BOD
5,
10,000-60,000 mg/l
COD, pH of 5-6 and several toxic/hazardous compo-
nents (Ehrig, 1989). The advantages of fluidized bed
processes are the accumulation of a large amount
of biomass on the support media (up to 30,000
mg/l), including high organic loading rates (40-60
kg COD/m
3
per day), a high specific surface area
(2000-3000 m
2
/m
3
), short retention times (1.5-3 h)
and mixing characteristics (Iza, 1991; Turan and Oz-
turk, 1996; Buffi`ere et al., 1998; Ozturk, 1999; Tu-
ran, 2000).
Several
investigators
have
reported
on
leachate treatment methods including coagulation-
flocculation (Amokrane et al., 1997), the electro-
Fenton method (Gau and Chang, 1996), anaerobic
sequencing batch reactor and anaerobic hybrid bed
filter (Wu et al., 1988; Inanc et al., 2000; Timur et
al., 2000; Loukidou and Zouboulis, 2001), anaer-
obic fluidized bed reactor (Gulsen et al., 2002)
and upflow sludge blanket reactor (Ozturk et al.,
1999). Landfill leachate was treated in upflow hy-
297
G ¨
ULS
¸EN, TURAN
brid (sludge-bed/fixed-bed) anaerobic reactors un-
der methanogenic digestion with COD removal ef-
ficiencies of 81–97% (Nedwell and Reynolds, 1996).
Landfill leachate from 2 young municipal landfill
sites were effectively treated in anaerobic sequencing
batch reactors, an anaerobic hybrid bed filter and an
upflow sludge blanket reactor, at mesophilic condi-
tions at variable influent CODs of 9000-25,000 mg/l
(Timur et al., 2000).
This paper presents treatability of sanitary land-
fill leachate in an anaerobic fluidized bed reactor
(AFBR). Leachate treatment experiments were car-
ried out by increasing gradually the organic loading
rate in 8 operating steps. Bed expansion characteris-
tics, ammonia and COD removal efficiencies, biogas
production and biomass development in the reactor
were evaluated.
Materials and Methods
Experimental design
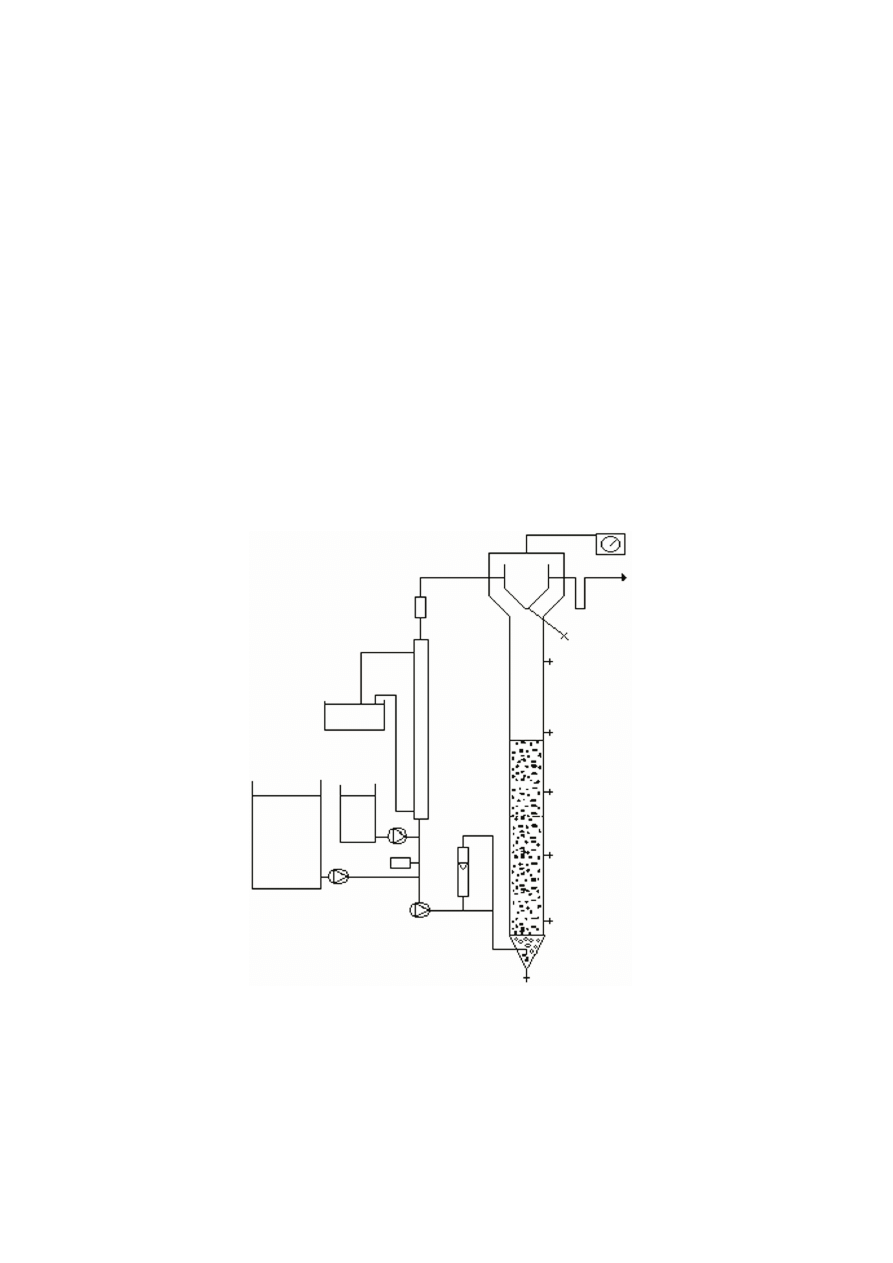
A pilot-scale fluidized bed reactor with an inner di-
ameter of 100 mm, a height of 1.65 m and an effective
volume (V) of 13 l was used. The reactor was filled
with a support medium of 0.5 mm diameter sand
(sieve size of 30/35) to provide a fixed bed height
of 70 cm. The upper settling section was 35 cm
high and had a diameter of 30 cm (Figure 1). While
peristaltic pumps were used for continuous leachate
feeding, the combined feed and recycle flows were
pumped to the reactor by a cone-shaped feed dis-
tributor (20
◦
included-angle cone) with filled plastic
balls at the bottom of the reactor.
The landfill leachate used were obtained from a
municipal landfill site located in the European part
of ˙Istanbul, the Odayeri Landfill, which has been in
operation since 1995 and also has characteristics of
young leachate (Table 1). The leachate was collected
in a 200 m
3
holding tank at the lowest side of the
landfill and the samples were taken from the landfill
once every week and diluted with tap water. The
inoculum used was maintained from a yeast wastew-
ater treatment plant. In addition, ortho-phosphoric
acid was added to the feed leachate to maintain the
ratio of KOI/ N/P at 500/7/1.
Nutrient Feed
Tank
Leachate
Feed
Tank
Pump
Flow
Meter
Fluidization
Column
Recycle
Pump
Plastic Balls
Heat
Exchange
Thermometer
Settler
Gas Meter
Final Effluent
Figure 1. Schematic diagram of a pilot-scale anaerobic fluidized bed reactor.
298

G ¨
ULS
¸EN, TURAN
Table 1. Characteristics of landfill leachate using in the
experimental study.
Parameter
Concentrations
pH
7.5 - 8
COD, mg/l
10,000 - 50,000
SS, mg/l
37,500 - 46,000
TDS, mg/l
17,000 - 35,700
TKN, mg/l
1630 - 2750
NH
3
-N, mg/l
1030 - 2350
PO
4
-P
6.8 - 16.2
Alkalinity, mg CaCO
3
/l
11,500 - 18,900
During the AFBR leachate treatment, the or-
ganic loading rate (OLR) was increased from 2.5 to
37 kg COD/m
3
per day while the feed rate (Q
f
) and
the hydraulic retention time (HRT) were 13 l/day
and 1 day, respectively (Table 2). While the recy-
cle pumps operated at rates of 400 l/h, the superfi-
cial velocity (U) was about 1.42 cm/s. Temperature
was controlled at 35
◦
C in the mesophilic condition
by passing the circulation water through a heat ex-
changer. Reactor pH was also controlled at about 7
while dynamic viscosity of the fluid was kept at 0.73
x 10
−2
g /(cm/s) (at 35
◦
C).
Sampling and analysis
The reactor pH and temperature were controlled us-
ing a WTW pH 330 Model pH meter and a Julabo
LC4 F Mode temperature controller, respectively. A
Ritter TG 05 gas meter was employed for biogas
production measurements. The influent and efflu-
ent COD, temperature, pH, alkalinity, ammonia, sus-
pended solids and total volatile acids concentrations
were determined in accordance with Standard Meth-
ods (1999). The expanded bed sample (bioparticles
and leachate) was collected at 2 heights (30 and 75
cm from base) via the sampling ports of the column.
These samples were dried at 105
◦
C for 24 h in a ce-
ramic evaporating dish and then muffled at 550
◦
C
for 1 h. The difference between these weights rep-
resents the total biomass concentration (X
tot
), mea-
sured volatile solids. The effluent volatile solids con-
centration (X
sus
) in the leachate was also measured.
The attached biomass concentration (X
att
) was cal-
culated as the difference between the total biomass
concentration and the suspended biomass concentra-
tion in the bed sample.
Results and Discussion
Bed expansion characteristics
Biological fluidized bed reactors have 2 types of bed
expansion; the first is due to an increase in the super-
ficial velocity and the second is due to the microbial
growth in the bed. The Richardson-Zaki correlation
(Richardson and Zaki, 1954) is widely used to de-
scribe the expansion characteristics of fluidized beds
and is given as
U/U
i
= ε
n
(1)
The minimum fluidization velocity (U
mf
) and the
bed expansion ratio (E
b
) can be calculated as follows:
U
mf
> U
i
ε
s
(2)
E
b
= (L
− L
s
)/L
s
= (ε
− ε
s
)/(1
− ε)
(3)
where U is the superficial (upflow) velocity, U
i
=
0.91U
o
ψ
−0.400
, the intercept velocity, U
o
is the ter-
Table 2. Treatment performance and operating data of the AFBR.
Time from
OLR
Feed rate
HRT
COD
Q
gas
Y
gas
start-up (day)
kgCOD/m
3
(1/day)
(day)
(mg/l)
(1/day)
(l/gCOD
rem
)
per day)
Inf.
Eff.
E(%)
0-30
2.5
13
1
2520
430
83
13,8
0.508
31-55
4.5
13
1
4490
535
88
26
0.506
56-80
8
13
1
8130
825
90
49
0.516
81-106
12
13
1
12,010
1210
90
73
0.520
107-128
18
13
1
18,015
2000
89
108
0.518
129-163
27
13
1
27,025
3050
89
163
0.523
164-220
37
13
1
37,010
6750
82
203
0.516
221-240
20
13
1
20,020
2150
89
120
0.516
299
G ¨
ULS
¸EN, TURAN
minal settling velocity, ψ is the particle sphericity, n
is the bed expansion coefficient and ε and ε
s
are the
fluidized bed and fixed bed porosities, respectively
(Turan, 1986, 1992).
The minimum fluidization velocity was calculated
using Eq. (2) and the data given by Turan (1992)
as U
mf
> U
i
ε
n
s
= 8.1 cm/s x 0.468
3.4
= 0.61 cm/s.
Since the recycle pump was operated at a flow rate
of 400 l/h, the upflow (superficial) velocity was 1.42
cm/s. Using Eq.(1), the expanded bed porosity was
obtained as ε = (1.42/ 8.1)
1/3.4
= 0.6. Initial or
non-biological bed expansion ratio can be calculated
from Eq. (3) as E
b
(%) = (0.6-0.468)/(1-0.6)
× 100
= 33%. In addition, expansion indices for biologi-
cal fluidized beds were considerably larger than that
for a bed containing uniform clean spherical particles
(Ro and Neethling, 1994). In this study, we used the
term fluidized bed reactor, since the term expanded
bed is generally used for bed expansions of less than
20% (Denac and Dunn, 1988).
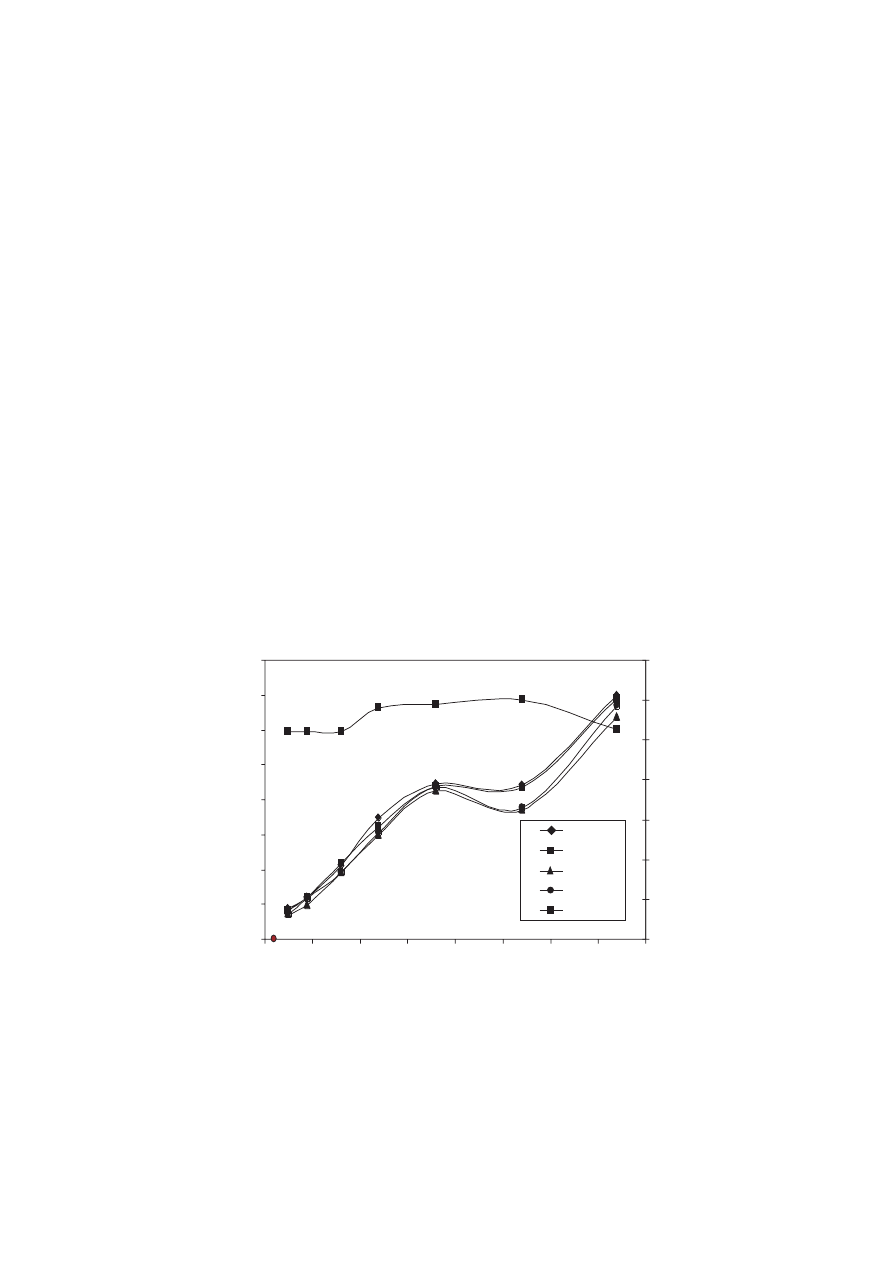
Evaluation of nitrogen content
The leachate samples were taken from the landfill
once every week and high strength leachate was di-
luted with dechlorinated tap water to obtain the pro-
posed COD concentrations to detect the reactor per-
formance at different organic loading rates. The to-
tal suspended solids (TSS) and the total dissolved
solids (TDS) values showed an increase with increas-
ing organic loading rates (OLRs). High organic loads
of leachate indicated high concentrations of ammo-
nia in the feeding of the reactor. Influent and ef-
fluent ammonia (NH
3
-N) concentrations also varied
between 145 and 1275 mg/l and 140 and 1340 mg/l,
respectively. Although ammonia removal efficiency
appeared to be very low, ammonia inhibition did not
occur during the operation. Similarly, total Kjehdahl
nitrogen (TKN) showed little difference between in-
fluent and effluent, varying between 175 and 1400
mg/l and 165 and 1380 mg/l. The influent pH also
varied between 7.6 and 8 values (Figure 2).
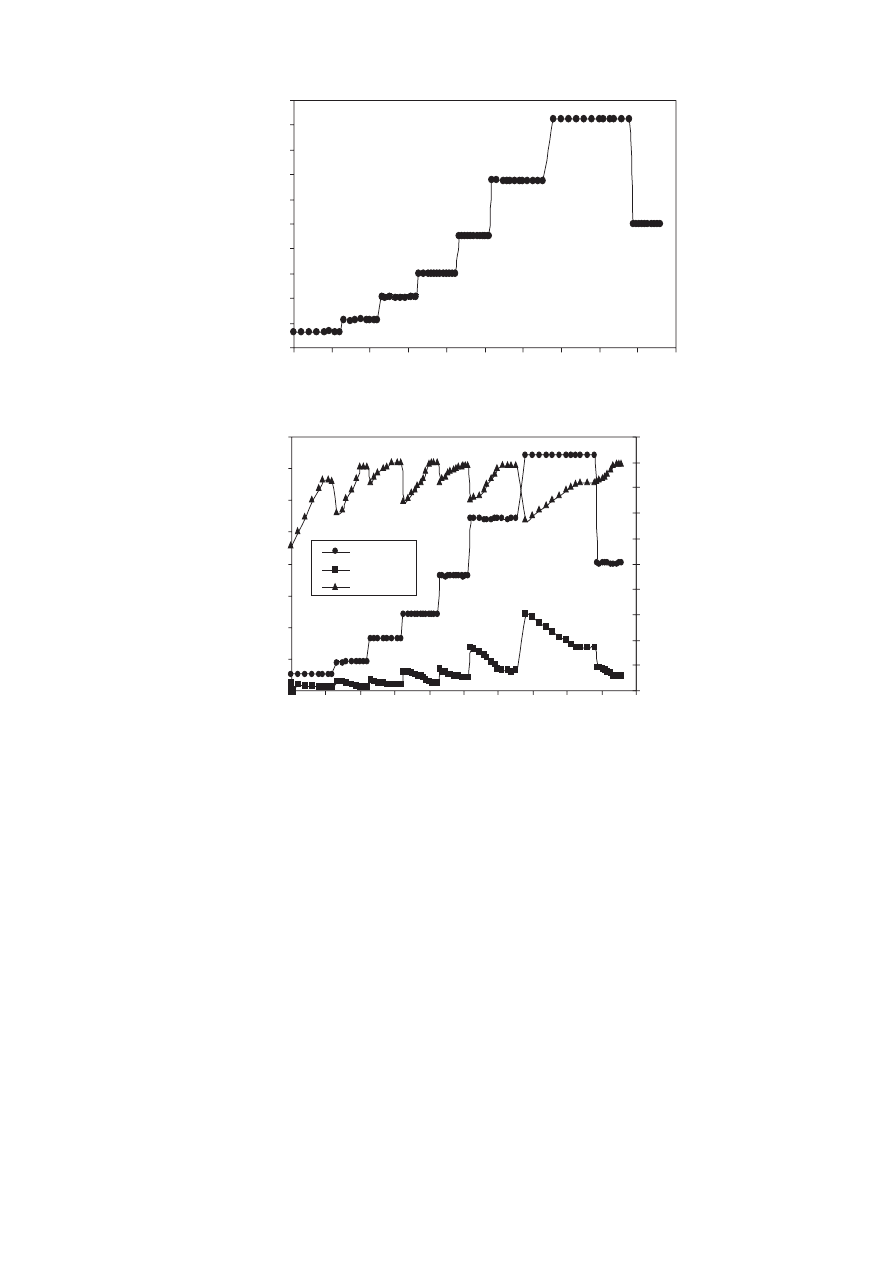
COD removal efficiency
The influent chemical oxygen demands (CODs) were
2500, 4500, 8000, 12,000, 18,000, 27,000, 37,000 and
20,000 mg/l while the OLRs were 2.5; 4.5; 8; 12; 18;
27; 37 and 20 kg COD/m
3
per day, respectively, dur-
ing the study (Figures 3 and 4). On the other hand,
the COD removal efficiency in each step showed a de-
crease at the beginning but arrived at a stable con-
dition in approximately 3 weeks. In addition, the
effluent COD values varied as 430, 535, 825, 1210,
2000, 3050, 6750 ve 2150 mg/l during the 240 days
of operation (Figure 4). As shown in Figure 4, the
COD removal of between 83 and 88% showed little
variation as the OLR was increased within the range
2.5 to 4.5 kg COD/ m
3
per day. Then the COD
removal remained at 89-90% while the OLRs were
0
200
400
600
800
1000
1200
1400
1600
0
5
10
15
20
25
30
35
40
OLR, kgCOD/m
3
per day
Nitrogen concentration, mg/l
5
5.5
6
6.5
7
7.5
8
8.5
Ef
fluent pH
TKNinf
TKNeff
NH3-Ninf
NH3-Neff
pH
Figure 2. Ammonia nitrogen, TKN and pH versus organic loading.
300
G ¨
ULS
¸EN, TURAN
0
4
8
12
16
20
24
28
32
36
40
0
25
50
75
100
125
150
175
200
225
250
Time, days
Or
ganic loading rates,
kg COD/m
3
per day
Figure 3. Variation of organic loading rates versus operation time.
0
5000
10,000
15,000
20,000
25,000
30,000
35,000
40,000
0
25
50
75
100
125
150
175
200
225
250
Time, days
COD, mg/l
0
10
20
30
40
50
60
70
80
90
100
COD removal, %
CODinf
CODeff
Efficiency
Figure 4. Variation of COD removal related to influent COD values.
between 8 and 27 kg COD/m
3
per day. Although
the COD removal decreased to 82% at an OLR of
37 kg COD/m
3
per day, increasing loading rates
did not hinder the COD removal efficiency of the
AFBR. Consequently, the AFBR system attained
steady state conditions on approximately day 80 and
effective organic loading range was 4 to 30 kg COD/
m
3
per day.
Biogas production
The AFBR system was operated in a closed cycle
and biogas production appeared in 10 days. Bio-
gas production increased continuously as 13.8; 26;
49; 73; 108; 163 and 203 l/day during the operation
while the loading increased in the range of 2.5 to 37
kg COD/m
3
per day. However, this production de-
creased to 120 l/day when OLR was reduced to 20
kg COD/ m
3
per day. The relationship between the
biogas production rate (Q
gas
) and the removed COD
per day (B
r
, kg COD
rem
/day) is presented in Fig-
ure 5. The average biogas production yield (Y
gas
)
was 0.515 l of gas/g COD
rem
. As seen in Figure
6, at high OLRs, the performance of anaerobic flu-
idized bed reactor is particularly sensitive to gas ef-
fervescence effects (Diez Blanco et al., 1995; Buffi`ere
et al.,1998). The fractions of CH
4
and CO
2
in the
gases within the reactor were maintained at an effec-
301

G ¨
ULS
¸EN, TURAN
tive level of about 75% and 25%, respectively. Thus,
methane yield was found at about 0.39 l of CH
4
/g
COD
rem.
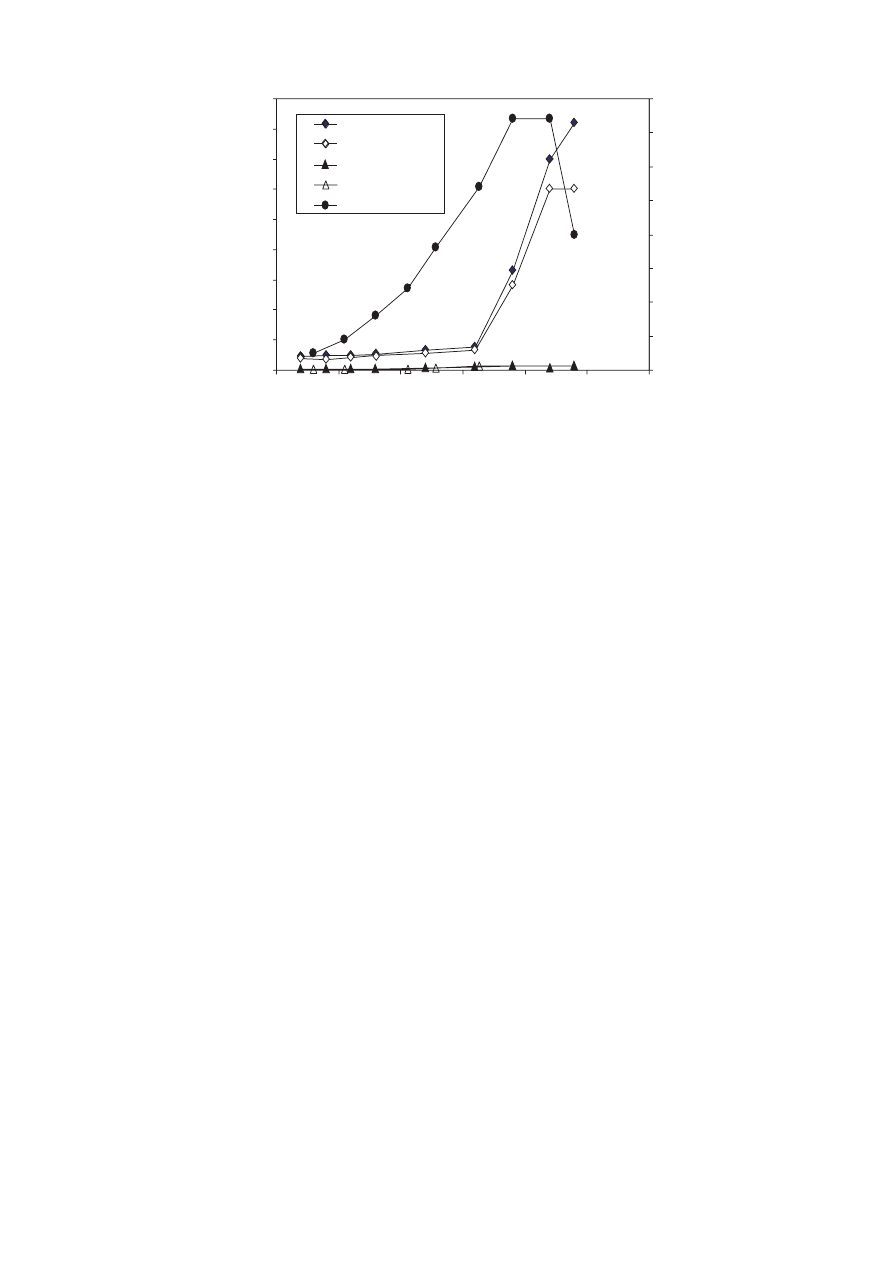
Biomass development
The expanded bed sample (bioparticles and leachate)
was collected at 2 heights (30 and 75 cm from base)
via the sampling ports of the column. These samples
were dried at 105
◦
C for 24 h in a ceramic evaporat-
ing dish and then muffled at 550
◦
C for 1 h. The
difference of these weights per reactor volume would
yield the total biomass concentration (X
tot
), mea-
sured volatile solids in the bed sample. Increased or-
ganic loading generally caused an increased biofilm
attachment on the support media of the AFBR.
0
50
100
150
200
250
0
0.1
0.2
0.3
0.4
0.5
Br, kgCODrem/day
Qgas, l/day
y = 519.36x - 0.2757
R
2
= 0,9999
Figure 5. Relationship between biogas production and removed COD.
0
50
100
150
200
250
0
5
10
15
20
25
30
35
40
Qgas, l/day
y = 5.621x + 3.836
R = 0.994
OLR, kgCOD/m
3
per day
Figure 6. Relationship between biogas production and organic loading.
302
G ¨
ULS
¸EN, TURAN
0
10,000
20,000
30,000
40,000
50,000
60,000
70,000
80,000
90,000
0
50
100
150
200
250
300
Time, days
Biomass Concentration, mg/l
0
5
10
15
20
25
30
35
40
Xatt-75 cm height
Xatt-30 cm height
Xsus-75 cm height
Xsus-30 cm height
OLR
OLR, kg COD/m per day
3
Figure 7. Variation of attached and suspended biomass concentrations during the AFBR treatment.
The attached biomass concentration (X
att
) var-
ied in the range of 4035 to 7105 mg/l in days 25 to
163, but then increased very sharply to 70,000 mg/l
in the last 2 months (days 164 to 220), for the the
organic loading of 37 kg COD/m
3
per day (Figure
7). On the other hand, the COD removal efficiency
decreased from 90% to 82%. When organic load-
ing decreased 20 kg COD/m
3
per day, the attached
biomass concentration remained constant at about
70,000 mg/l. This is attributed to the fact that the
COD removal performance of the AFBR is limited by
the concomitant stabilization of both organic loading
and biomass development.
The biofilm thickness on the support particle and
the porosity differ throughout the bed and lighter
bioparticles move to the upper part (Ro and Neeth-
ling, 1994). As a result, the attached biomass con-
centrations in the upper part of the column were
found to be higher than those in the lower part.
This difference varied between 3% and 38 % during
the operation (Figure 7). In addition, the attached
biomass concentration contained more than 90 % of
the total biomass. The suspended biomass concen-
tration (X
sus
) showed an increase between 190 and
1480 mg/l. This increase in the suspended solid con-
centration is evidence of biomass detachment from
support media of the reactor (Stronach et al., 1987;
Turan, 2000).
Conclusions
The AFBR treatment of young landfill leachate was
studied with the salient points summarized below.
Initial or non-biological bed expansion ratio was
33%, while the upflow (superficial) velocity was 1.42
cm/s and the expanded bed porosity was 0.6.
Total suspended solids showed an increase with
increasing OLRs. High organic loads of leachate in-
dicated high concentrations of ammonia in the feed-
ing of the reactor. Although the ammonia removal
efficiency was very low, ammonia inhibition did not
occur.
COD removal efficiency increased up to 90% with
increasing OLRs. In addition, the COD removal de-
creased to 82% at an OLR of 37 kg COD/ m
3
per
day. The AFBR system attained steady state condi-
tions on approximately day 80 and effective organic
loading range was 4 to 30 kg COD/ m
3
per day.
Biogas production also increased with increasing
the loading, and decreased with decreasing loading.
An average biogas production yield (Y
gas
) of 0.515 l
of gas/g COD
rem
was obtained.
The attached biomass concentration was low up
to day 163. Then it increased very sharply to 70,000
mg/l in the last 2 months, while the COD removal
decreased. The COD removal performance of the
AFBR is limited by the concomitant stabilization of
both organic loading and biomass development.
303

G ¨
ULS
¸EN, TURAN
Acknowledgments
The authors wish to acknowledge the financial sup-
port provided by the ITU Research and Development
Center (Project No: 1947) and the Scientific and
Technical Research Council of Turkey (T ¨
UB˙ITAK)
(˙IC
¸ TAG-C
¸005 (10I008)).
Nomenclature
B
r
COD removal rate (kg COD
rem
/day).
COD
chemical oxygen demand (mg/l)
E
COD
removal efficiency (%)
E
b
bed expansion ratio (%)
HRT
hydraulic retention time (day)
n
bed expansion coefficient
OLR
organic loading rate (kg COD/m
3
per day)
Q
f
leachate feed rate (l/day)
Q
gas
biogas production rate (l/day)
U
superficial (upflow) velocity (m/s)
U
o
terminal settling velocity (m/s)
U
mf
minimum fluidization velocity (m/s)
V
effective volume of the reactor (m
3
)
X
biomass concentration (mg/l)
Y
gas
biogas production yield (l of biogas/
gCOD
rem
)
ε
bed porosity
References
Amokrane,
A.,
Comel,
C.
and
Veron,
J.,
“Landfill Leachates Pretreatment by Coagulation-
Flocculation”, Water Res., 31, 2775-2782, 1997.
Buffi`ere, P., Fonade C. and Moletta R., “Mixing
and Phase Hold-Ups Variations Due to Gas Pro-
duction in Anaerobic Fluidized-Bed Digesters: In-
fluence on Reactor Performance.” Biotechnol. Bio-
engng, 60, 36-43, 1998.
Denac, M. and Dunn, I.J., “Packed- and Fluidized-
Bed Biofilm Reactor Performance for Anaerobic
Wastewater Treatment”, Biotechnol. Bioengng., 32,
159-173, 1988.
Diez
Blanco,
V.,
Garcia
Encina,
P.A. and
Fernandez-Blanco, F., “Effect of Biofilm Growth,
Gas and Liquid Velocities on the Expansion of an
Anaerobic Fluidized Bed Reactor (AFBR)”, Water
Res., 29, 1649-1654, 1995.
Ehrig, H.J., 1989., Leachate quality. In: Christesen,
T.H., Cossu, R. and Stegmann, R. (Eds), “Sani-
tary Landfilling: Process, Technology and Environ-
mental Impact”, Academic Press, London, 213-229,
1989.
Gau, S.H. and Chang, F.S., “Improved Fenton
Method to Remove Recalcitrant Organics in Landfill
Leachate”, Water Sci. Technol., 34, 455-462, 1996.
Gulsen, H., Altınbas, M., Alp, K., Turan, M., Oz-
turk, I. and Altın, Z., “Combined Anaerobic Flu-
idized Bed Reactor and Fenton’s Oxidation Treat-
ment of Landfill Leachate”, In: Appropriate Envi-
ronmental and Solid Waste Management and Tech-
nologies for Developing Countries, Kocasoy, G. et
al. (Eds.), Bo˘
gazi¸ci University Library Publication:
˙Istanbul, 923-930, 2002.
Inanc, B., Calli, B. and Saatci, A., “Characteriza-
tion and Anaerobic Treatment of the Sanitary Land-
fill Leachate in ˙Istanbul”, Water Sci. Technol., 41,
223-230, 2000.
Iza, J., “Fluidized Bed Reactors for Anaerobic
Wastewater Treatment”, Water Sci. Technol., 24,
109-132, 1991.
Knox, K. and Jones, P.H., “Complexation Charac-
teristics of Sanitary Landfill Leachates”, Water Res.,
13, 839-846, 1979.
Loukidou, M.X. and Zouboulis, A.I., “Compar-
ison of Two Biological Treatment Processes Us-
ing Attached Growth Biomass for Sanitary Land-
fill Leachate Treatment”, Environ. Pollut.,111, 273-
281, 2001.
Nedwell, D.B. and Reynolds, P.J., “Treatment of
Landfill Leachate by Methanogenic and Sulfate-
Reducing Digestion”, Water Res., 30, 21-28, 1996.
Ozturk, I., “Anaerobic Biotechnology and Its Appli-
cations in Wastewater Treatment”, Water Founda-
tion Publication, Seher Offset, ˙Istanbul, 1999.
Ozturk, I., Altinbas M., Arikan, O. and Demir, A.,
“Anaerobic UASBR Treatment of Young Landfill
Leachate”, Fresen. Environ. Bull., 8, 389-396, 1999.
Richardson, J.F. and Zaki, W.N., “Sedimentation
and Fluidization: Part I.” Trans. Inst. Chem. En-
grg, 32, 35-53, 1954.
Ro, K.S. and Neethling, J.B., “Biological Fluidized
Beds Containing Widely Different Bioparticles.” J
Environ. Engng ASCE, 120, 1416-1426, 1994.
Stronach, S.M., Diaz-Baez, M.C., Rudd, T. and
Lester, J.N., “Factors Affecting Biomass Attach-
ment During Startup and Operation of Anaerobic
Fluidized Beds.” Biotechnol. Bioengng, 30, 611-620,
1987.
Standard Methods for the Examination of Wa-
ter and Wastewater, 20
th
edn, American Public
Health Association/AmericanWater Works Associ-
ation/Water Environment Federation, Washington
DC, 1999.
304

G ¨
ULS
¸EN, TURAN
Timur, H., Ozturk, I, Altınbas, M., Arıkan, O.
and Tuyluoglu, B. S., “Anaerobic Treatability of
Leachate: A Comparative Evaluation for Three Dif-
ferent Reactor Systems”, Water Sci. Technol., 42,
287-292, 2000.
Turan, M. and Ozturk, I., “Longitudinal Dispersion
and Biomass Hold-Up of Anaerobic Fluidized Bed
Reactors” Water Sci. Technol, 34, 461-468, 1996.
Turan, M., Optimum porosity in a backwashed fil-
ter, PhD thesis, ˙Istanbul Tech. Univ., ˙Istanbul,
Turkey, 1986. (in Turkish)
Turan, M., “Velocity Gradient in Filter Backwash-
ing”, J Environ. Engng, ASCE, 118, 776-790,1992.
Turan, M., “Mechanisms of Biofilm Detachment
in an Anaerobic Fluidized Bed Reactor”, Environ.
Technol., 21, 177-183, 2000.
Wu, Y.C., Hao D.J., Ou K.C. and Scholze R.J.,
“Treatment of leachate from solid waste landfill site
using a two-stage anaerobic filter”, Biotechnol. Bio-
engng, 31, 257-266, 1988.
305
Wyszukiwarka
Podobne podstrony:
muh 28 5 2 0406 5
Kosci, kregoslup 28[1][1][1] 10 06 dla studentow
Ch 28 Pelites
PR CYW PR ROP WYKLAD 28
28 Subkultury medialne i internetowe
28 poniedziałek
Psychiatria W4 28 04 2014 Zaburzenia spowodowane substancjami psychoaktywnymi
28 Zjawiska towarzyszące bombardowaniu ciała stałego elektro
2001 08 28
28 Wykłady z Zarządzania Strategicznego
28
MIKROBIOLOGIA JAMY USTNEJ, WYKŁAD 3, 28 03 2013
28 407 pol ed02 2005
000 Alfabetyczny indeks zawodów do KZiS (Dz U 28 08 14,poz 1145)st 22 12 2014
Foliogram nr 28 (II)
28 9 11
03 28 szczegółowy sposób postępowania z olejami odpadowymi
więcej podobnych podstron