Nutrient Metabolism
Glucose-Based Oligosaccharides Exhibit Different In Vitro Fermentation
Patterns and Affect In Vivo Apparent Nutrient Digestibility and Microbial
Populations in Dogs
Elizabeth A. Flickinger, Bryan W. Wolf,* Keith A. Garleb,* JoMay Chow,* Gregory J. Leyer,*
Paul W. Johns* and George C. Fahey, Jr.
1
Division of Nutritional Sciences and Department of Animal Sciences, University of Illinois, Urbana, IL 61801,
and *Ross Products Division, Abbott Laboratories, Columbus, OH 43215
ABSTRACT
To evaluate the potential of indigestible oligosaccharides (OS) to serve as “dietary fiber-like” ingre-
dients, it is necessary to determine their extent of indigestibility. In vitro fermentation characteristics of two novel
OS,
␣-glucooligosaccharides (GOS) and a maltodextrin-like OS (MD), were compared to those of fructooligosac-
charides (FOS), gum arabic (GA), guar gum (GG) and guar hydrolysate (GH). Total short-chain fatty acid (SCFA)
production (
mol/g dry matter) as a result of MD fermentation was higher initially compared with GA (P ⬍ 0.01), but
GA was more extensively fermented at 24 h (P
⬍ 0.01). Total SCFA production for GOS was similar to that for FOS,
GG, GH and GA. In the second experiment, GOS and MD were added at 6% to an enteral formula control diet
(Control) and fed to ileal-cannulated dogs in a 3
⫻ 3 replicated Latin-square design. Ileal digestibility of glucose was
lower (P
⬍ 0.05) and carbohydrate (CHO) numerically lower (P ⫽ 0.08) for both GOS and MD compared with the
Control. Total tract digestibility of CHO and glucose was lower only for MD (P
⬍ 0.01) compared with the Control.
Total fecal weights were higher (P
⬍ 0.01) for both GOS and MD treatments. Fecal concentration of bifidobacteria
was numerically increased by GOS and MD supplementation (P
⫽ 0.13 and 0.23, respectively). Thus, GOS and MD
are indigestible yet fermentable OS, and may act as “dietary fiber-like” ingredients.
J. Nutr. 130: 1267–1273,
2000.
KEY WORDS:
●
oligosaccharides
●
fermentation
●
intestinal microbiota
●
short-chain fatty acids
●
dogs
Many oligosaccharides (OS)
2
are not hydrolyzed in the
small intestine but are fermented rapidly in the lower gastro-
intestinal tract of humans and nonruminant animals. Gibson
and Roberfroid (1995) used the term “prebiotics” for certain
nondigestible OS because they selectively stimulate favorable
endogenous bacterial populations when supplemented in the
diet at low levels. Both the fermentation process and the
proliferation of favorable bacteria caused by OS ingestion can
benefit the host animal. Oligosaccharides are fermented rap-
idly to yield short-chain fatty acids (SCFA), including bu-
tyrate, which is a fuel for colonocytes (Sakata 1987). Favorable
bacterial populations, such as bifidobacteria, can promote
health by inhibiting pathogenic bacteria such as Clostridium
perfringens and Escherichia coli (Araya-Kojima et al. 1995, Gib-
son and Wang 1994).
An
␣-glucooligosaccharide (GOS) was obtained through
enzymatic synthesis from sucrose and maltose to yield a
branched-chain (
␣-1,2, ␣-1,4 and ␣-1,6 linkages) glucose
polymer with an average degree of polymerization of 5. Mal-
todextrin-like glucose-based oligosaccharides (MD) were pro-
duced by heat and enzymatic treatment of cornstarch, creating
a random distribution of
␣- and - (1,4), (1,6), (1,2) and (1,3)
linkages. It has an average molecular weight of 2000.
The objectives of this study were as follows: 1) to determine
the in vitro fermentation characteristics of GOS and MD in
reference to other fermentable oligosaccharides; 2) to deter-
mine the small intestinal digestibility of GOS and MD in
ileal-cannulated dogs; and 3) to determine the effects of GOS
and MD on fecal microbial populations in dogs.
MATERIALS AND METHODS
In vitro experiment
Substrates and donors.
Substrates used in this study were GOS
(Bioecolians, Solabia, Pantin Cedex, France), MD (Fibersol 2E, Ma-
tsutani Chemical Industry, Hyogo, Japan), fructooligosaccharides
(FOS) (NutraFlora, Golden Technologies, Westminister, CO), gum
arabic (GA), guar gum (GG) (TIC Gums, Belcamp, MD), and
hydrolyzed guar gum with 24,000 MW (GH) (Fiberon S, Dainippon,
Japan). Three healthy adult male human donors (average age 30 y;
average weight 78 kg) served as sources of fecal material from which
the inoculum was prepared. The donors consumed a “Western” diet
and no antibiotics in the 3 mo preceding the experiment.
Design.
Substrates were fermented in vitro for 24 h with fresh
human fecal microflora obtained from each of three donors. The
experiment was designed as a randomized complete block with the
1
To whom correspondence should be addressed.
2
Abbreviations used: CHO, carbohydrate; CP, crude protein; DM, dry matter;
FOS, fructooligosaccharide; GA, gum arabic; GG, guar gum; GH, hydrolyzed guar
gum; GOS;
␣-glucooligosaccharide; MD, maltodextrin-like glucose-based oligo-
saccharide; OM, organic matter; OS, oligosaccharide; SCFA, short-chain fatty
acids.
0022-3166/00 $3.00 © 2000 American Society for Nutritional Sciences.
Manuscript received 14 October 1999. Initial review completed 9 December 1999. Revision accepted 1 February 2000.
1267
jn.nutrition.org
Downloaded from

three fecal donors serving as blocks. Treatments were allotted in a 6
⫻ 7 factorial arrangement with six substrates and seven incubation
lengths. Each block by treatment combination was assayed using
duplicate fermentation tubes. Duplicate tubes containing no substrate
also were fermented with each inoculum source and time point to
correct for SCFA not arising from the substrates.
Fermentation.
Aliquots (9 mL) of sterile anaerobic buffer (95%
CO
2
/5% H
2
, pH 6.8) were aseptically transferred into tubes contain-
ing 75 mg substrate. Buffer composition is presented in Table 1. To
maintain anaerobic conditions, the tubes were sealed with butyl
rubber stoppers in an anaerobic (95% CO
2
/5% H
2
) chamber. Sub-
strates were hydrated for
⬃2 h before incubation.
Feces from the three donors were collected in commode specimen
collection systems (Sage Products, Crystal Lake, IL). Immediately
after collection, feces were diluted (1:10 wt/v) with anaerobic fer-
mentation buffer. Substrate and blank tubes were then inoculated
aseptically with 1 mL diluted feces. Tubes were incubated at 37°C,
and 1.0 mL samples were collected at 0, 1.5, 3, 6, 11, 18 and 24 h.
Chemical analyses.
A 1-mL aliquot was removed for immediate
pH determination before centrifuging at 13,000
⫻ g at 22°C for 3
min. The supernatant was stored at
⫺70°C. Acetate, propionate,
butyrate and lactate concentrations in cell-free supernatant were
analyzed by ion exclusion chromatography using a Hewlett Packard
Model HP1090 Liquid Chromatograph equipped with an ION-300
ion exclusion column (30 cm
⫻ 7.8 mm i.d.) (Interaction Chemicals,
Mountain View, CA). The mobile phase consisted of 0.005 mol/L
H
2
SO
4
with a flow rate of 0.3 mL/min and 40°C column temperature.
Statistical analyses.
Data were analyzed as a randomized com-
plete block with fecal donor serving as the block. The model state-
ment included donor, substrate, time and substrate
⫻ time. All
analyses were performed according to the General Linear Models
(GLM) procedure of SAS (1994). Arithmetic means are reported
along with the
SEM
for all treatments. When treatment differences
were detected (P
⬍ 0.05), means were compared by the least signif-
icant difference method (Carmer and Swanson 1973).
In vivo experiment
Animals and diets.
Six purpose-bred adult female dogs (Butler
Farms USA, Clyde, NY) with hound bloodlines and an average
weight of 25.3
⫾ 4.6 kg and age of 3 ⫾ 1.5 y were surgically prepared
with ileal cannulas. Ileal cannulation was conducted according to
Walker et al. (1994). Dogs were housed individually in clean floor
pens (1.2
⫻ 3.1 m) in a temperature-controlled room at the animal
facility of the Edward R. Madigan Laboratory on the University of
Illinois campus. All dogs were allowed free access to water. The
surgical and animal care procedures were approved by the Campus
Laboratory Animal Care Advisory Committee, University of Illinois
at Urbana-Champaign.
Two OS treatments were tested against a control: Enteral Control,
Enteral Control
⫹ GOS (GOS), and Enteral Control ⫹ MD (MD).
An enteral diet was selected as the control because it provided very
highly digestible nutrients for the dogs, allowing a more exact test of
the less digestible OS. The OS were added at the 6% level [dry matter
(DM) basis] to the Control diet, such that they did not replace any
individual dietary component. Diets were reconstituted before feed-
ing by adding 235 g of Enteral Control powder to 835 mL H
2
O, or
249 g of the GOS or MD diets to 825 mL H
2
O.
The chemical composition of the experimental diets is reported in
Table 2. Dietary protein was provided as sodium caseinate, calcium
caseinate and soy protein isolate. Corn oil was used as the sole lipid
source, whereas corn syrup and sucrose comprised the carbohydrate
portion of the diet. On an energy basis, the enteral diets supplied
⬃14% of kJ as protein, 31.5% as fat and 54.5% as carbohydrate.
Experimental design.
Dogs were randomized in a replicated 3
⫻ 3 Latin-square design with 14-d periods. Dogs were offered 1000
mL of the reconstituted diets at 0800 and 2000 h daily to provide
⬃8.37 MJ metabolizable energy/d. The diet adaptation phase con-
sisted of d 1 through 10; d 11 through 14 were used for ileal and fecal
collections. Chromic oxide was used as a digestion marker. On d 6
TABLE 2
Chemical composition of diets fed to ileal cannulated dogs
1,2
Item
Diet
Control
GOS
MD
Dry matter, g/100 g (powder)
96.0
96.0
95.8
Dry matter, g/100 g (enteral solution)
21.9
23.2
23.1
g/100 g dry matter
Organic matter
96.7
96.8
96.9
Crude protein
15.6
15.0
15.2
Fat
14.7
14.9
15.1
Carbohydrate (by difference)
66.4
66.9
66.6
Glucose
28.9
29.1
26.8
1
Control, Enteral Control; GOS, Enteral Control
⫹ 6%
␣-glucooli-
gosaccharide; MD, Enteral Control
⫹ 6% maltodextrin-like glucose-
based oligosaccharide.
2
Protein: 84% caseinate and 16% soy protein isolate; lipid: corn oil;
nonstructural carbohydrate: 70% corn syrup and 30% sucrose. Vita-
mins (unit/L): retinyl palmitate, 2.65 mg; cholecalciferol, 5.3
g; dl-␣-
tocopheryl acetate, 32.3 mg; phylloquinone, 43
g; ascorbic acid C,
159 mg; folic acid, 424
g; thiamine, 1.6 mg; riboflavin, 1.9 mg; vitamin
B-6, 2.2 mg; vitamin B-12, 6.4 mg; niacin, 21.2 mg; choline, 318 mg;
biotin, 318
g; pantothenic acid, 10 mg. Minerals (unit/L): sodium, 846
mg; potassium, 1564 mg; chloride, 1312 mg; calcium, 530 mg; phos-
phorus, 530 mg; magnesium, 212 mg; iodine, 80
g; manganese, 2.7
mg; copper, 1.1 mg; zinc, 12.0 mg; iron, 9.6 mg; selenium, 38
g;
chromium, 53
g; molybdenum, 80 g.
TABLE 1
Composition of buffer used for in vitro fermentation
1
Component
Amount, unit/L
mg
Na
2
CO
3
4000
Cysteine HCl
600
Trypticase
500
Yeast extract
500
(NH
4
)
2
SO
4
480
NaCl
480
K
2
HPO
4
292
KH
2
PO
4
292
MgSO
4
䡠 7H
2
O
100
CaCl
2
䡠 2H
2
O
64
mL
Hemin
1.25
Resazurin
1.0
Short-chain fatty acid mix
2
3.1
Trace mineral solution
3
10.0
Vitamin solution
4
10.0
1
Heat-tolerant portions of the buffer were heated (10 min in an
autoclave) to drive off O
2
and cooled in an anaerobic chamber (95%
CO
2
/5% H
2
) before aliquots were placed in fermentation tubes.
2
Composition (mL/L): acetate, 408; propionate, 144; butyrate, 72;
valerate, 24; isovalerate, 24; isobutyrate, 24; and 2-methylbutyrate, 24.
3
Composition (mg/L): Na
4
EDTA, 500; FeSO
4
䡠 7H
2
O, 200; ZnSO
4
䡠
7H
2
O, 10; MnCl
2
䡠 4H
2
O, 200; H
3
BO
4
, 20; CoCl
2
䡠 6H
2
O, 20; CuCl
2
䡠
2H
2
O, 1; NiCl
2
䡠 6H
2
O, 2; Na
2
MoO
4
䡠 2H
2
O, 3.
4
Composition (g/L of 5 mmol/L HEPES, pH 7.5): biotin, 0.025; folic
acid, 0.025; calcium-
D
-pantothenate, 0.200; nicotinamide, 0.200; ribo-
flavin, 0.200; thiamine-HCl, 0.200; pyridoxine-HCl, 0.200; para-amino-
benzoic acid, 0.025; cyanocobalamin, 0.025; 1,4-napthoquinone,
0.250.
FLICKINGER ET AL.
1268
jn.nutrition.org
Downloaded from
through 14 of each period, dogs were dosed with 0.5 g chromic oxide
in a gelatin capsule at 0800 and 2000 h for a total of 1 g marker/d.
Sampling procedures.
During the collection phase, ileal effluent
and feces were collected for 4 d. Ileal effluent was collected 3 times
per day, with an interval of 4 h between collections. Individual ileal
collections were 1 h in duration. Sampling times on the remaining 3 d
were rotated 1 h from the previous day’s collection time. For example,
on d 1, sampling took place at 0800, 1200 and 1600 h; on d 2, samples
were collected at 0900, 1300 and 1700 h. Ileal samples were obtained
by attaching a Whirlpak bag (Pioneer Container, Cedarburg, WI) to
the cannula barrel and around the cannula hose clamp with a rubber
band. Before attachment of the bag, the interior of the cannula was
scraped clean with a spatula and initial digesta discarded. During
collection of ileal effluent, dogs were encouraged to move around
freely. The use of Elizabethan collars was necessary for some dogs to
deter them from pulling the collection bag from their cannula. Total
feces excreted during the collection phase of each period were col-
lected from the floor of the pen, weighed, composited and frozen at
⫺4°C.
Sample handling.
Ileal samples were frozen at
⫺4°C in their
individual bags. At the end of the experiment, all ileal effluent
samples were composited for each dog for each period, and then
refrozen at
⫺4°C. Ileal effluent then was freeze-dried in a Tri-Philizer
MP microprocessor-controlled lyophilizer (FTS Systems, Stone
Ridge, NY). Feces were dried at 55°C in a forced-air oven. After
drying, both feces and ileal samples were ground through a 2-mm
screen in a Wiley mill (model 4, Thomas Scientific, Swedesboro, NJ).
Diets were analyzed in the unhydrated powdered form.
Freshly voided feces were collected within 15 min of defecation;
individual aliquots were immediately transferred to preweighed
Carey-Blair transport media containers (Meridian Diagnostics, Cin-
cinnati, OH) for subsequent bacterial enumeration. Feces were scored
for each dog during each period according to the following system: 1
⫽ hard, dry pellets, small, hard mass; 2 ⫽ hard, formed, dry stool,
remains firm and soft; 3
⫽ soft, formed, moist, softer than stool that
retains shape; 4
⫽ soft, unformed, stool assumes shape of container,
pudding-like; 5
⫽ watery; liquid that can be poured.
Chemical analyses.
Diets, feces and ileal effluent were analyzed
for DM, organic matter (OM) and ash using AOAC (1984) methods.
Crude protein (CP) was calculated from Kjeldahl N values (AOAC
1984). Total lipid content was determined by acid hydrolysis followed
by ether extraction according to the American Association of Cereal
Chemists (1983) and Budde (1952). Chromium was analyzed accord-
ing to Williams et al. (1962) using an atomic absorption spectropho-
tometer (Model 2380, Perkin-Elmer, Norwalk, CT). Carbohydrate
(CHO) content was calculated as the difference between OM con-
tent and the sum of crude protein and lipid contents. Glucose content
was determined by monosaccharide analysis according to Bourquin et
al. (1990). Monosaccharides were hydrolyzed with H
2
SO
4
and quan-
tified by anion exchange HPLC with pulsed electrochemical detec-
tion. Briefly, 50
L of each neutralized, hydrolyzed sample was in-
jected into an HPLC fitted with a Dionex Carbo-Pac PA-1 column
(250
⫻ 4 mm) (Dionex, Sunnyvale, CA). Individual monosacchar-
ides were eluted with degassed water (1.0 mL/min, ambient temper-
ature) and 300 mmol/L NaOH was added postcolumn. For all labo-
ratory analyses, samples were analyzed in duplicate, and analyses were
repeated if a deviation
⬎ 5% between duplicates occurred.
Total anaerobes, total aerobes, bifidobacteria, lactobacilli and
bacteroides spp. were determined by serial dilution of fecal samples in
anaerobic diluent (Bryant and Burkey 1953) before inoculation onto
respective petri dishes of sterile agar. Total anaerobe and total aerobe
agars were prepared according to Bryant and Robinson (1961) and
Mackie et al. (1978). The selective medium for bifidobacteria (BIM-
25) was prepared using reinforced clostridial agar (BBL Microbiology
Systems, Cockeyville, MD) according to the method described by
Mun˜oa and Pares (1988). Lactobacilli were cultured on Rogosa SL
agar (Difco Laboratories, Detroit, MI). Bacteroides spp. were cultured
on a trypticase yeast extract glucose agar listed in Table 3. Plates were
incubated anaerobically (95% CO
2
/5% H
2
) at 38°C. Colony forming
units were defined as being distinct colonies measuring at least 1 mm
in diameter.
Calculations.
Dry matter (g/d) recovered as ileal effluent or
excreted as feces was calculated by dividing the Cr intake (mg/d) by
ileal or fecal Cr concentrations (mg Cr/g ileal effluent or feces),
respectively. Ileal and fecal nutrient flows were calculated by multi-
plying the DM flow by the concentration of the nutrient in the ileal
or fecal DM. Ileal and total tract nutrient digestibilities were calcu-
lated as nutrient intake (g/d) minus the ileal or fecal nutrient flow
(output, g/d), divided by nutrient intake (g/d).
Statistical analysis.
Data were analyzed by the General Linear
Models procedure of SAS (1994). The experimental design was a
replicated 3
⫻ 3 Latin square. Six sequences of the diets (one
sequence per dog) were used (ABC, CAB, BCA, ACB, BAC, CBA),
where A was Enteral Control, B was Enteral Control
⫹ GOS, and C
was Enteral Control
⫹ MD. Model sums of squares were separated
into treatment, period and animal effects. When significant (P
⬍ 0.05) differences were detected, treatment means were compared
by the least significant difference method of SAS (Carmer and
Swanson 1973).
RESULTS AND DISCUSSION
In vitro experiment
pH values.
In general, pH decreased as time of fermenta-
tion increased (Fig. 1). All substrates had similar pH values
(6.9) at 0 h. Fructooligosaccharide fermentation resulted in
the most rapid decline in pH and the lowest pH values (P
⬍ 0.05) at 3 and 6 h. Conversely, GA had the slowest decline
in pH and the highest pH values (P
⬍ 0.05) at 1.5, 3, 6 and
11 h of fermentation. The pH values for GOS, GH, GG and
MD generally were intermediate to that of FOS and GA
between 0 and 6 h. However, at 24 h, GOS had a numerically
lower pH (P
⫽ 0.18) than FOS and a lower pH (P ⬍ 0.05)
than all other substrates. The pH decline for MD was rapid
from 0 to 3 h, but then was relatively stable. At 24 h, the
TABLE 3
Composition of agar used to enumerate Bacteroides spp.
Component
Amount, unit/L
g
Trypticase
10.0
Yeast extract
5.0
Agar
20.0
mL
Potassium phosphate buffer, 1 mol/L
100.0
TYG salt solution
1
40.0
CaCl
2
solution, 8 g/L
1.0
FeSO
4
, 40 g/L
1.0
Resazurin, 25 g/L
4.0
Hemin solution
2
10.0
Double-distilled H
2
O
828.3
After boiling, saturate with CO
2
, autoclave, cool to 60°C and add:
mL
Vitamin K solution, 40 g/L
1.0
Vitamin B-12 solution, 5.0 g/L
1.0
Gentamicin, filter sterilized, 50 g/L
4.0
Cysteine solution, free base, 0.3 kg/L
1.7
Glucose solution, 0.25 g/L
8.0
1
Composition (g/L): NaHCO
3
, 10.0 g; MgSO
4
䡠 7H
2
O, 0.5 g; NaCl,
2.0 g; double-distilled H
2
O, 1000 mL.
2
Composition: 500 mg hemin dissolved in 10 mL of 1 mol/L NaOH,
then diluted to 500 mL final volume with double-distilled H
2
O.
DIGESTIBILITY OF GLUCOSE-BASED OLIGOSACCHARIDES
1269
jn.nutrition.org
Downloaded from
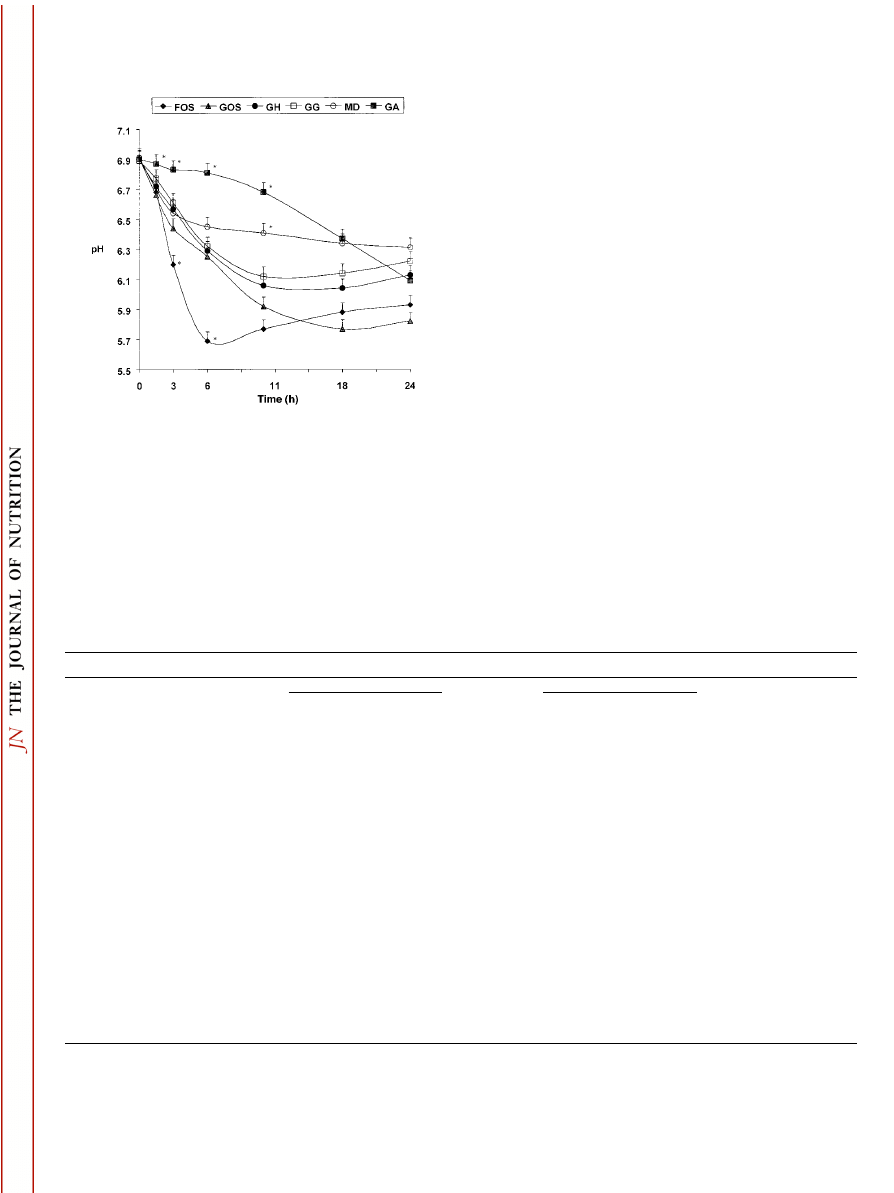
highest (P
⬍ 0.05) pH value was noted for MD (6.31) com-
pared with all other substrates. Overall, the pH declines for
GOS, FOS, GH and GG were not different (P
⫽ 0.35) from
those of MD and GA.
Organic acid production.
Organic acid (acetate
⫹ propi-
onate
⫹ butyrate ⫹ lactate) concentrations increased over
time (Table 4). Fructooligosaccharides resulted in the most
rapid accumulation of organic acids, achieving 93% of total
organic acid production after only 6 h. However, by 11 h, FOS,
GOS, GH and GG had similar concentrations of organic
acids. Gum arabic resulted in the lowest (P
⬍ 0.05) organic
acid concentrations at 11 h, and MD was intermediate. After
24 h of fermentation, GOS resulted in the numerically highest
(P
⫽ 0.15) organic acid concentration, whereas MD had the
lowest (P
⬍ 0.05). Fermentation of GA, GG, GH and FOS
resulted in intermediate organic acid concentrations, which
were not significantly different from values obtained for GOS.
After 6 or 11 h of fermentation, GOS and FOS resulted in
the highest (P
⬍ 0.05) concentrations of acetate. Hydrolyzed
guar gum, GG and MD had intermediate concentrations of
acetate. Gum arabic resulted in the lowest (P
⬍ 0.05) con-
centrations of acetate at 6 and 11 h. At 6 h, propionate
concentration was numerically lowest (P
⫽ 0.11) for GA
compared with all other substrates. At 11 h, propionate con-
centration was highest (P
⬍ 0.05) for GG, and remained
lowest (P
⬍ 0.05) for GA. Fructooligosaccharide and GOS
were intermediate in propionate concentration after 11 h of
fermentation. Butyrate concentrations at 6 or 11 h were nu-
merically highest (P
⫽ 0.23) for FOS and were lowest (P
⬍ 0.05) for GA. At 6 and 11 h, GOS, GH and GG had
intermediate concentrations of butyrate.
In contrast to the 11-h observation, after 24 h of fermen-
tation, the concentration of acetate for GA was greater than
FOS (P
⬍ 0.05) and numerically greater than GOS (P ⫽ 0.10)
FIGURE 1
The pH values of substrates after different times of in
vitro fermentation. Values are means, n
⫽ 6. Asterisks indicate a sig-
nificant difference from all other means at that time, P
⬍ 0.05. FOS,
fructooliogsaccharide; GOS,
␣-glucooligosaccharide; GH, hydrolyzed
guar gum; GG, guar gum; MD, maltodextrin-like glucose-based oligo-
saccharide; GA, gum arabic.
TABLE 4
Acetate, propionate, butyrate and total organic acid accumulation after different hours of in vitro fermentation of substrates
1
Item
Time
FOS
2
GOS
2
GH
2
GG
2
MD
2
GA
2
SEM
3
LSD
4
h
mmol/g/substrate
Acetate
1.5
0.70
0.88
0.66
0.37
0.68
0.06
0.302
0.891
3
2.66
1.96
1.17
0.99
1.52
0.12
6
4.35
3.40
2.05
2.15
2.37
0.19
11
4.33
4.66
3.41
3.22
2.97
0.90
18
4.40
5.22
3.75
3.55
3.78
3.56
24
4.37
5.08
3.68
3.57
4.18
5.34
Propionate
1.5
0.11
0.14
0.13
0.11
0.12
0.01
0.272
0.803
3
0.35
0.33
0.29
0.30
0.25
0.01
6
0.99
0.73
0.72
0.83
0.48
0.08
11
1.17
1.31
1.81
1.94
0.68
0.47
18
1.35
1.78
2.00
2.26
1.10
1.61
24
1.47
2.03
2.03
2.23
2.03
2.35
Butyrate
1.5
0.18
0.22
0.17
0.08
0.17
0.01
0.193
0.570
3
0.59
0.40
0.39
0.26
0.32
0.03
6
1.44
0.62
0.70
0.59
0.36
0.02
11
1.75
1.00
1.33
1.40
0.44
0.05
18
1.77
1.39
1.54
1.48
0.47
0.19
24
1.82
1.39
1.58
1.45
0.54
0.39
Total SCFA
2,5
1.5
1.08
1.37
0.99
0.56
1.02
0.06
0.410
1.211
3
3.97
2.77
1.89
1.55
2.09
0.16
6
7.12
4.75
3.46
3.56
3.20
0.30
11
7.26
6.97
6.54
6.56
4.08
1.42
18
7.51
8.38
7.28
7.29
5.34
5.37
24
7.66
8.49
7.28
7.25
6.01
8.08
1
Values are means of six tubes (3 donors in duplicate).
2
FOS, fructooliogsaccharide; GOS,
␣-glucooligosaccharide; GH, hydrolyzed guar gum; GG, guar gum; MD, maltodextrin-like glucose-based
oligosaccharide; GA, gum arabic; SCFA, short-chain fatty acids.
3
Pooled
SEM
for each short-chain fatty acid.
4
Least significant difference between any two mean values in the same row (P
⬍ 0.05).
5
Acetate
⫹ propionate ⫹ butyrate ⫹ lactate.
FLICKINGER ET AL.
1270
jn.nutrition.org
Downloaded from
(Table 4). The concentration of acetate produced by GOS
remained greater (P
⬍ 0.05) than that of MD, which was
similar to the values for GG, GH and FOS. After 24 h of
incubation, propionate concentration was numerically lowest
(P
⫽ 0.15) for FOS (Table 4). Butyrate accumulation was
greater (P
⬍ 0.05) for FOS, GOS, GH and GG, than for MD
and GA (Table 4) after 18 and 24 h of incubation. The
highest butyrate-producing substrates resulted in
⬃5–35 times
greater values compared with the lowest butyrate-producing
substrates after 11–24 h of fermentation. Relatively little lac-
tate accumulated, and none was detected after 6 h of fermen-
tation (data not shown). Fructooligosaccharides had the high-
est (P
⬍ 0.05) concentrations of lactate at 3 and 6 h of
fermentation. No lactate accumulated as a result of the fer-
mentation of GG or GA.
The more rapid pH decline and organic acid production as
a result of FOS and GOS fermentation indicated that these
two OS were fermented more rapidly than the other substrates
tested in this study. Maltodextrin-like oligosaccharides re-
sulted in the lowest in vitro production of organic acids and
the highest pH at 24 h, indicating some resistance to fermen-
tation. Short-chain fatty acid profiles, in addition to concen-
trations, varied among substrates. Butyrate production was
highest and similar for FOS, GOS, GH and GG. Butyrate is a
major fuel for colonocytes (Roediger 1980) and has been
demonstrated to stimulate epithelial cell proliferation (Sakata
1987). Therefore, substrates that produce high levels of bu-
tyrate, such as FOS, GOS, GG and GH, may provide similar
beneficial effects when included in diets. The rapid in vitro
accumulation of butyrate with FOS fermentation at 6 h indi-
cates that FOS would serve as an excellent source of butyrate
in vivo. On the other hand, the slower rate of fermentation of
GA and MD indicates that they would perhaps provide a
source of fermentable CHO to the more distal part of the large
intestine. A blend of rapidly and slowly fermented carbohy-
drates should result in production of SCFA throughout the
large intestine.
In vivo experiment
Chemical composition.
The chemical composition of the
diets is reported in Table 2. Dry matter, OM, CP, fat, glucose
and CHO content did not differ among diets.
Nutrient intake and apparent digestibility.
Intakes of
DM, OM and CP did not differ (Table 5). Fat intake was lower
(P
⬍ 0.05) for the Control treatment than for either the GOS
or MD treatments due to lower DM intakes. Dogs consuming
either the GOS- or MD-containing diets had greater (P
⬍ 0.05) glucose and numerically greater (P ⫽ 0.09) CHO
intakes compared with the Control diet. This was expected
because GOS and MD were added at 6% “on top” of the
control diet.
Ileal digestibility of DM, OM, CP and fat did not differ
among treatments. Although the overall model was not sig-
nificant (P
⫽ 0.12), ileal digestibility of glucose was signifi-
cantly different (P
⬍ 0.05) due to diet. Ileal glucose digest-
ibility values were 4.6 and 4.8 percentage units lower for both
the GOS- and the MD-containing treatments, respectively,
compared with the Control diet. Diet tended (P
⫽ 0.08) to
reduce ileal digestibility of CHO (5.5 and 4.3 percentage units
lower) compared with the Control diet. These data indicate
that the supplemental OS, GOS and MD resisted hydrolytic
digestion and passed intact into the large intestine. These
results are supported by data of Valette et al. (1993) who
demonstrated that GOS was
⬃20% digested by germfree rats.
Furthermore, Tsuji and Gordon (1998) reported that MD
disappearance was only 10% after four consecutive in vitro
incubations with salivary
␣-amylase, gastric juice, pancreatic
␣-amylase and reconstituted intestinal mucosa, which simu-
lated hydrolytic digestion.
Total tract digestibilities of DM and fat did not differ
among treatments. Crude protein digestibility was lower (P
⬍ 0.05) for dogs consuming the GOS and MD treatments.
The lower values for total tract digestibility of the GOS and
MD diets may be attributed to an increased fecal excretion of
microbial protein. Wolf et al. (1998) proposed that as the
percentage of fermentable carbohydrate increases in the diet,
the amount of microbial mass increases in the feces. This
would result in an increase in fecal N excretion and an
apparent decrease in crude protein digestibility. Organic mat-
ter, carbohydrate and glucose digestibilities were lower (P
⬍ 0.05) for the MD treatment compared with either the
Enteral Control or the GOS treatments. This may indicate
that MD was not completely fermented in the large intestine
as suggested by our in vitro study. Incomplete fermentation
also was reported by Tsuji and Gordon (1998), who recovered
38% of orally dosed MD in the feces of adult rats. There was
a trend for carbohydrate and glucose digestibility to be slightly
lower for the GOS diet compared with the Control. This
suggests that GOS was extensively fermented. These findings
agree with those of Djouzi et al. (1995) who demonstrated that
GOS was fermented extensively by human intestinal bacterial
strains in vitro and in vivo by trixenic rats associated with
Bacteroides thetaiotaomicron, Bifidobacterium breve and Clostrid-
ium butyricum.
Fecal weight, fecal score, and body weight changes.
There were no differences among treatments in body weight
changes of dogs (data not shown). Fecal weights for dogs
consuming the GOS diet were greater (P
⬍ 0.05) than those
TABLE 5
Nutrient intakes and apparent digestibility data for ileal-
cannulated dogs fed diets supplemented with
␣-
glucooligosaccharide (GOS) or maltodextrin-like glucose-
based oligosaccharide (MD)
Item
Diet
SEM
Control
GOS
MD
Intake, g/d
Dry matter
447
473
464
6.2
Organic matter
433
458
449
5.9
Crude protein
70
71
71
0.8
Fat
66
a
70
b
70
b
1.4
Carbohydrate
297
316
308
4.0
Glucose
211
a
250
b
241
b
3.2
Ileal digestion, %
Dry matter
90.6
87.0
89.3
2.02
Organic matter
92.3
88.7
90.5
1.75
Crude protein
80.8
82.0
87.0
4.07
Fat
96.1
95.2
96.6
0.83
Carbohydrate
94.2
88.7
89.9
1.53
Glucose
97.0
b
92.4
a
92.2
a
1.16
Total tract digestion, %
Dry matter
96.4
95.8
94.2
0.33
Organic matter
97.5
b
96.8
b
95.3
a
0.29
Crude protein
92.3
c
90.1
b
87.9
a
0.60
Fat
95.8
96.0
95.9
0.32
Carbohydrate
99.2
b
98.5
b
96.8
a
0.32
Glucose
99.9
b
99.8
b
98.0
a
0.30
a,b,c
Means (n
⫽ 6) in a row not sharing a superscript letter differ (P
⬍ 0.05).
DIGESTIBILITY OF GLUCOSE-BASED OLIGOSACCHARIDES
1271
jn.nutrition.org
Downloaded from
of the Control on an as-is basis and tended (P
⫽ 0.07) to be
greater on a DM basis (Table 6). Fecal weight, on both an as-is
and DM basis, was greater (P
⬍ 0.05) for dogs consuming the
MD treatment compared with the Control. On a DM basis,
the fecal weight for MD was greater (P
⬍ 0.05) than that of
GOS. These data, along with the high 24-h pH value for MD
after 24 h of in vitro fermentation, indicate that it is not
completely fermented by the colonic microflora of dogs or
humans. Increased fecal weight is a common outcome of
dietary fiber consumption. Depending on its individual char-
acteristics, dietary fiber can increase fecal bulk by increasing
bacterial cell mass, undegraded fiber residue, fecal water or a
combination of these effects (Fahey et al. 1990, Roberfroid
1993, Schneeman, 1987). Fecal scores were higher (P
⬍ 0.05)
for dogs consuming the GOS and MD treatments compared
with the Control, indicating a higher fecal moisture content.
Overall, the fecal scores were relatively high. The loosely
formed stools were caused in part by consumption of an enteral
formula. Increased fecal moisture content is a common effect
attributed to dietary fiber. Fecal water content can be in-
creased by the physical water-holding properties of fibers, and
possibly by the osmotic action of SCFA produced by fermen-
tation (Roberfroid 1993, Schneeman 1987).
Fecal bacterial concentrations.
There were no significant
(P
⬎ 0.05) differences in bacterial concentrations among
treatments (Table 7). However, trends were apparent. The
concentrations of total anaerobes were increased slightly by
the addition of GOS or MD to the basal diet. Bifidobacteria
concentrations also tended to increase when GOS or MD were
added to the diet (P
⫽ 0.13 and 0.23, respectively). Bacte-
roides concentrations were numerically lower (P
⫽ 0.10) for
the MD diet compared with the Control. These results agree
with data collected by Kohmoto et al. (1988), who reported
that dietary isomaltooligosaccharides (13.5 g/d for 14 d) in-
creased fecal bifidobacteria levels (P
⬍ 0.05) in healthy adult
males.
Total anaerobes and total aerobes indicate general fermen-
tative activity, whereas bifidobacteria and lactobacilli are in-
dicators of a more remedial, beneficial bacterial population.
Increased concentrations of bifidobacteria and lactobacilli
have been associated with decreased fecal concentrations of
potentially pathogenic bacteria (Araya-Kojima et al. 1995,
Gibson and Wang, 1994) and decreased levels of carcinogenic
and putrefactive compounds (Hara et al. 1994, Mitsuoka 1982,
Terada et al. 1992). Although these compounds were not
measured in this study, the bifidogenic effect of GOS and MD
also may reduce fecal putrefactive compounds.
Bacteroides are the predominant colonic bacterial genera,
comprising
⬃30% of the total culturable microflora (Macfar-
lane and Macfarlane 1995). Most bacteroides are considered
neither beneficial nor detrimental to host health. They readily
utilize resistant starch as well as nonstarch polysaccharides
(Hudson and Marsh, 1995). In our experiment, GOS and MD
led to a numerical increase in fecal concentrations of bacte-
roides.
Ileal-cannulated dogs were chosen as the animal model for
this study for the many similarities they share with humans.
Both dogs and humans are omnivorous monogastrics. Like
humans, dogs have numerous species of endogenous bacteria
in their lower gastrointestinal tract (Balish et al. 1977, Davis
et al. 1977) that contribute to significant amounts of colonic
fermentation (Banta et al. 1979). The microflora of both dogs
and humans contains bacteroides, bifidobacteria and lactoba-
cilli as predominant species (Davis et al. 1977, Gibson and
Roberfroid 1995). Dogs have been employed in numerous
studies pertaining to human nutrition (Diez et al. 1997 and
1998, Willard et al. 1994). The ileal-cannulated dog model
has been widely used to evaluate ileal digestibility of nutrients
in many types of ingredients (Muir et al. 1996; Murray et al.
1997 and 1998, Zuo et al. 1996). Therefore, the ileal-cannu-
lated dog is an appropriate model to utilize in evaluating
oligosaccharides with potential human applications.
The in vitro and in vivo studies provided complementary
data regarding the fermentation of the novel OS, GOS and
MD. In vitro, the fermentation of GOS resulted in rapid
production of high concentrations of SCFA, whereas MD
fermentation resulted in a more gradual and overall lower
SCFA production. In vivo, GOS and MD resisted hydrolytic
digestion and were present at the terminal ileum.
␣-Gluco-
oligosaccharide appears to be extensively fermented because
very little was recovered in feces. However, MD was fermented
only partially, resulting in significantly lower total tract CHO
and glucose digestibility values.
In conclusion, both GOS and MD appear to be indigestible
in the small intestine, supplying CHO to the large intestine for
bacterial fermentation. Both in vitro and in vivo digestibility
data suggest that GOS was fermented more extensively than
MD. Dietary supplementation of these OS at the 6% level in
an enteral formula did not greatly alter the digestibility of
macronutrients. Both GOS and MD increased the volume of
TABLE 7
Fecal bacterial concentrations for cannulated dogs fed diets
supplemented with
␣-glucooligosaccharide (GOS) or
maltodextrin-like glucose-based oligosaccharide (MD)
1
Item
Diet
SEM
Control
GOS
MD
CFU log
10
/g fecal DM
2
Total anaerobes
10.82
10.93
11.09
0.249
Total aerobes
9.13
9.53
9.25
0.285
Bifidobacteria
9.01
9.67
9.52
0.251
Lactobacilli
7.84
8.37
7.74
0.521
Bacteroides
9.89
9.29
8.58
0.405
1
Values are means, n
⫽ 6.
2
CFU, colony-forming unit; DM, dry matter.
TABLE 6
Fecal characteristics of ileal-cannulated dogs fed diets
supplemented with
␣-glucooligosaccharide (GOS) or
maltodextrin-like glucose-based oligosaccharide (MD)
Item
Diet
SEM
Control
GOS
MD
Feces, as-is, g/d
35.0
a
64.8
b
79.4
b
6.74
Feces, DM
1
basis, g/d
16.0
a
20.0
a
26.7
b
1.38
Fecal score
2
3.4
a
4.1
b
4.4
c
0.10
1
DM, dry matter.
2
Scores based on the following scale: 1
⫽ hard, dry pellets; 2
⫽ hard, formed, dry stool, remains firm and soft; 3 ⫽ soft, formed,
moist, softer than stool that retains shape; 4
⫽ soft, unformed, stool
assumes shape of container, pudding-like; 5
⫽ watery, liquid that can
be poured.
a,b,c
Means (n
⫽ 6) in a row not sharing a superscript letter differ (P
⬍ 0.05).
FLICKINGER ET AL.
1272
jn.nutrition.org
Downloaded from
feces excreted and the moisture content of the feces. These OS
also tended to increase fecal concentrations of beneficial bac-
teria, including bifidobacteria. These findings indicate that
GOS and MD are indigestible in the upper intestinal tract.
However, these OS may serve as fermentable dietary fiber-like
substrates and positively affect gastrointestinal tract health.
LITERATURE CITED
American Association of Cereal Chemists
(1983)
Approved Methods, 8th ed.
AACC, St. Paul, MN.
Araya-Kojima, T., Yaeshima, T., Ishibashi, N., Shimamura, S. & Hayasawa, H.
(1995)
Inhibitory effects of Bifidobacterium longum BB536 on harmful intes-
tinal bacteria. Bifidobacteria Microflora 14: 59 – 66.
Association of Official Analytical Chemists
(1984)
Official Methods of Analysis,
14th ed. AOAC, Washington, DC.
Balish, E., Cleven, D., Brown, J. & Yale, C. E.
(1977)
Nose, throat, and fecal
flora of beagle dogs housed in “locked” or “open” environments. Appl.
Environ. Microbiol. 34: 207–221.
Banta, C. A., Clemens, E. T., Krinsky, M. M. & Sheffy, B. E.
(1979)
Sites of
organic acid production and patterns of digesta movement in the gastroin-
testinal tract of dogs. J. Nutr. 109: 1592–1600.
Bourquin, L. D., Garleb, K. A., Merchen, N. R. & Fahey, G. C., Jr.
(1990)
Effects
of intake and forage level on site and extent of digestion of plant cell wall
monomeric components by sheep. J. Anim. Sci. 68: 2479 –2495.
Bryant, M. P. & Burkey, L. A.
(1953)
Cultural methods and some characteris-
tics of some of the more numerous groups of bacteria in the bovine rumen. J.
Dairy Sci. 36: 205–217.
Bryant, M. P. & Robinson, I. M.
(1961)
An improved nonselective culture
medium for ruminal bacteria and its use in determining diurnal variation in
numbers of bacteria in the rumen. J. Dairy Sci. 44: 1446 –1456.
Budde, E. F.
(1952)
The determination of fat in baked biscuit type of dog foods.
J. Assoc. Off. Agric. Chem. 35: 799 – 805.
Carmer, S. G. & Swanson, M. R.
(1973)
An evaluation of ten pair-wise multiple
comparison procedures by Monte Carlo methods. J. Am. Stat. Assoc. 68:
66 –74.
Davis, C. P., Cleven, D., Balish, E. & Yale, C. E.
(1977)
Bacterial association in
the gastrointestinal tract of beagle dogs. Appl. Environ. Microbiol. 34: 194 –
206.
Diez, M., Hornick, J.-L., Baldwin, P. & Istasse, L.
(1997)
Influence of a blend of
fructo-oligosaccharides and sugar beet fiber on nutrient digestibility and
plasma metabolite concentrations in healthy beagles. Am. J. Vet. Res. 58:
1238 –1242.
Diez, M., Hornick, J.-L., Baldwin, P., Van Eenaeme, C. & Istasse, L.
(1998)
The
influence of sugar-beet fibre, guar gum and inulin on nutrient digestibility,
water consumption and plasma metabolites in healthy beagle dogs. Res. Vet.
Sci. 64: 91–96.
Djouzi, Z., Andrieux, C., Pelenc, V., Somarriba, S., Popot, F., Paul, F., Monsan, P.
& Szylit, O.
(1995)
Degradation and fermentation of
␣-gluco-oligosaccha-
rides by bacterial strains from human colon: in vitro and in vivo studies in
gnotobiotic rats. J. Appl. Bacteriol. 79: 117–127.
Fahey, G. C., Jr., Merchen, N. R., Corbin, J. E., Hamilton, A. K., Serbe, K. A. &
Hirakawa, D. A.
(1990)
Dietary fiber for dogs: II. Iso-total dietary fiber (TDF)
additions of divergent fiber sources to dog diets and their effects on nutrient
intake, digestibility, metabolizable energy and digesta mean retention time. J.
Anim. Sci. 68: 4229 – 4235.
Gibson, G. R. & Roberfroid, M. R.
(1995)
Dietary modulation of the human
colonic microbiota: Introducing the concept of prebiotics. J. Nutr. 125: 1401–
1412.
Gibson, G. R. & Wang, X.
(1994)
Regulatory effects of bifidobacteria on the
growth of other colonic bacteria. J. Appl. Bacteriol. 77: 412– 420.
Hara, H., Li, S.-T., Sasaki, M., Maruyama, T., Terada, A., Ogata, Y., Fujita, K.,
Ishigami, H., Hara, K., Fujimori, I. & Mitsuoka, T.
(1994)
Effective dose of
lactosucrose on fecal flora and fecal metabolites of humans. Bifidobacteria
Microflora 13: 51– 63.
Hudson, M. J. & Marsh, P. D.
(1995)
Carbohydrate metabolism in the colon. In:
Human Colonic Bacteria: Role in Nutrition, Physiology, and Pathology (Gib-
son, G. R. & Macfarlane, G. T., eds.), pp. 73– 85. CRC Press, Boca Raton, FL.
Kohmoto, T., Fukui, F., Takaku, H., Machida, Y., Arai, M. & Mitsuoka, T.
(1988)
Effect of isomalto-oligosaccharides on human fecal flora. Bifidobacteria Mi-
croflora 7: 61– 69.
Macfarlane, S. & Macfarlane, G. T.
(1995)
Proteolysis and amino acid fermen-
tation. In: Human Colonic Bacteria: Role in Nutrition, Physiology, and Pathol-
ogy (Gibson, G. R. & Macfarlane, G. T., eds.), pp. 75– 85. CRC Press, Boca
Raton, FL.
Mackie, R. I., Gilchrist, M. C., Robberts, A. M., Hannah, P. E. & Schwartz, H. M.
(1978)
Microbiological and chemical changes in the rumen during the step-
wise adaptation of sheep to high concentrate diets. J. Agric. Sci. (Camb.) 90:
241–254.
Mitsuoka, T.
(1982)
Recent trends in research on intestinal flora. Bifidobacteria
Microflora 1: 3–24.
Muir, H. E., Murray, S. M., Fahey, G. C., Jr., Merchen, N. R. & Reinhart, G. A.
(1996)
Nutrient digestion by ileal cannulated dogs as affected by dietary
fibers with various fermentation characteristics. J. Anim. Sci. 74: 1641–1648.
Mun˜oa, F. J. & Pares, R.
(1988)
Selective medium for isolation and enumera-
tion of Bifidobacterium spp. Appl. Environ. Microbiol. 54: 1715–1718.
Murray, S. M., Patil, A. R., Fahey, G. C., Jr., Merchen, N. R. & Hughes, D. M.
(1997)
Raw and rendered animal by-products as ingredients in dog diets. J.
Anim. Sci. 75: 2497–2505.
Murray, S. M., Patil, A. R., Fahey, G. C., Jr., Merchen, N. R., Wolf, B. W., Lai, C.-S.
& Garleb, K. A.
(1998)
Apparent digestibility of a debranched amylopectin-
lipid complex and resistant starch incorporated into enteral formulas fed to
ileal-cannulated dogs. J. Nutr. 128: 2032–2035.
Roberfroid, M.
(1993)
Dietary fiber, inulin, and oligofructose: A review com-
paring their physiological effects. Crit. Rev. Food Sci. Nutr. 33: 103–148.
Roediger, W.E.W.
(1980)
Role of anaerobic bacteria in the metabolic welfare of
the colonic mucosa in man. Gut 21: 793–98.
Sakata, T.
(1987)
Stimulatory effect of short-chain fatty acids on epithelial cell
proliferation in the rat intestine: A possible explanation for trophic effects of
fermentable fibre, gut microbes and luminal trophic factors. Br. J. Nutr. 58:
95–103.
SAS Institute Inc.
(1994)
SAS/STAT User’s Guide, Version 6.10. SAS Institute,
Cary, NC.
Schneeman, B. O.
(1987)
Soluble vs insoluble fiber— different physiological
responses. Food Technol. 41: 81– 82.
Terada, A., Hara, H., Oishi, T., Matsui, S., Mitsuoka, T., Nakajyo, S., Fujimori, I. &
Hara, K.
(1992)
Effect of dietary lactosucrose on faecal flora and faecal
metabolites of dogs. Microb. Ecol. Health Dis. 5: 87–92.
Tsuji, K. & Gordon, D. T.
(1998)
Energy value of a mixed glycosidic linked
dextrin determined in rats. J. Agric. Food Chem. 46: 2253–2259.
Valette, P., Pelenc, V., Djouzi, Z., Andrieux, C., Paul, F., Monsan, P. & Szylit, O.
(1993)
Bioavailability of new synthesized glucooligosaccharides in the in-
testinal tract of gnotobiotic rats. J. Sci. Food Agric. 62: 121–127.
Walker, J. A., Harmon, D. L., Gross, K. L. & Collings, G. F.
(1994)
Evaluation of
nutrient utilization in the canine using the ileal cannulation technique. J. Nutr.
124: 2672S–2676S.
Willard, M. D., Simpson, R. P., Delles, E. K., Coben, N. D., Fossum, T. W., Kolp,
D. & Reinhart, G.
(1994)
Effects of dietary supplementation of fructo-
oligosaccharides on small intestinal bacterial overgrowth in dogs. Am. J. Vet.
Res. 55: 654 – 659.
Williams, C. H., David, D. J. & Iismaa, O.
(1962)
The determination of chromic
oxide in faeces samples by atomic absorption spectrophotometry. J. Agric.
Sci. (Camb.) 59: 381–385.
Wolf, B. W., Firkins, J. L. & Zhang, X.
(1998)
Varying dietary concentrations of
fructooligosaccharides affect apparent absorption and balance of minerals in
growing rats. Nutr. Res. 10: 1791–1806.
Zuo, Y., Fahey, G. C., Jr., Merchen, N. R. & Bajjalieh, N. L.
(1996)
Digestion
responses to low oligosaccharide soybean meal by ileally-cannulated dogs. J.
Anim. Sci. 74: 2441–2449.
DIGESTIBILITY OF GLUCOSE-BASED OLIGOSACCHARIDES
1273
jn.nutrition.org
Downloaded from
Wyszukiwarka
Podobne podstrony:
2000 Evaluation of oligosaccharide addition to dog diets influences on nutrient digestion and microb
Cultural Differences in Television?vertising
Gender and Racial Ethnic Differences in the Affirmative Action Attitudes of U S College(1)
PEAR, Gender Differences In Human Machine Anomalies
Differences In Sexual Harassment
Differences in the note taking skills of students with high achievement,
(autyzm) Hadjakhani Et Al , 2005 Anatomical Differences In The Mirror Neuron System And Social Cogn
Statistical testing of individual differences in sensory profiling
Geographical Differences in Human Oral Yeast Flora
2001 In vitro fermentation characteristics of native and processed cereal grains and potato
2000 Influence of Fiber Fermentability on Nutrient Digestion in the Dog
(psychology, self help) 10 Little Things That Can Make a Big Difference in Your Marriage
MRS of limbic structures display metabolite differences in young unaFFECTED RELATIVES OF SCHISOPHREN
Differences in mucosal gene expression in the colon of two inbred mouse strains after colonization w
#0550 – Differences in Male and Female Friendships
2008 4 JUL Emerging and Reemerging Viruses in Dogs and Cats
article expenditure patterns and timing of patent protection in a competitive R&D environment
więcej podobnych podstron