
The Pennsylvania State University
The Graduate School
Department of Psychology
ILLUSORY CORRELATION IN CHILDREN:
COGNITIVE AND MOTIVATIONAL BIASES IN
CHILDREN’S GROUP IMPRESSION FORMATION
A Thesis in
Psychology
by
Kristen Elizabeth Johnston
© 2000 Kristen Elizabeth Johnston
Submitted in Partial Fulfillment
of the Requirements
for the Degree of
Doctor of Philosophy
May, 2000

We approve the thesis of Kristen E. Johnston.
Date of Signature
___________________________________________ ______________
Kelly L. Madole
Assistant Professor of Psychology
Thesis Advisor
___________________________________________ ______________
Janis E. Jacobs
Vice President of Administration and Associate Professor
Of Psychology and Human Development
Thesis Advisor
___________________________________________ ______________
Janet K. Swim
Associate Professor of Psychology
___________________________________________ ______________
Jeffrey Parker
Assistant Professor of Psychology
___________________________________________ ______________
Susan McHale
Associate Professor of Psychology
___________________________________________ ______________
Keith Crnic
Department Head and Professor of Psychology

iii
ABSTRACT
Despite the ubiquity and sometimes devastating consequences of stereotyping, we
know little about the origins and development of these processes. The current research
examined one way in which false stereotypes about minority groups may be developed,
which is called illusory correlation. Research with adults has shown that when people are
told about behaviors associated with majority and minority social groups where no
relationship between social group and behavior exists, people overestimate the number of
infrequent (usually negative) behaviors associated with the minority group. Thus, they
form an illusory correlation between group membership and behaviors. This effect
appears to be due to the enhanced salience of infrequently-occurring information, which
is remembered better and therefore estimated to occur more frequently than less salient
information. Furthermore, the minority group is evaluated relatively more negatively or
positively than the majority group based on the perceived correlation between group
membership and behaviors. When participants are members of one of the groups, people
further exaggerate the illusory correlation such that their own group is more strongly
associated with positive characteristics.
The current research examined whether illusory correlation occurs in second- and
fifth-grade children, and whether there are developmental changes in illusory correlation
formation. Study 1 investigated illusory correlation formation in the absence of self-
involvement in the target groups using a minimal groups paradigm. Children were
presented with pictorially represented behaviors of a majority and minority group. The
majority group consisted of 12 target children, and the minority group consisted of 6
target children. Participants completed attributions of each behavior to a group, a
frequency estimation task in which they indicated the number of members of each group
who performed the infrequent class of behaviors, and evaluations of the two groups.
Children were assigned to either a Negative Behavior-Infrequent condition, in which
negative behaviors were less frequent than positive behaviors, or a Positive-Infrequent
condition, in which positive behaviors were less frequent. If infrequent behaviors
associated with the minority group become more salient, children should overestimate the
frequency with which the behaviors occur in the minority group. Thus, children should
form an illusory correlation between the minority group and infrequent behaviors.

iv
Results showed that children overestimated the proportion of infrequent behaviors in the
minority group, regardless of whether the infrequent behaviors were negative or positive.
Children in the Positive-Infrequent condition also evaluated the minority group more
positively than the majority group, consistent with their estimations of a larger proportion
of positive behaviors in the minority group. Children in the Negative-Infrequent
condition did not evaluate the groups differently, despite the fact that they estimated more
negative behaviors in the minority group than the majority group. However, children’s
illusory correlations predicted differences in evaluations of the majority and minority
groups for the Negative-Infrequent and Positive-Infrequent conditions, indicating that
group evaluations were based to some extent on the illusory correlations children formed.
There were few age differences. Thus, Study 1 suggests that children do show an
information processing bias that leads to illusory correlations between a minority group
and infrequent behaviors.
Study 2 investigated the relative influence of self-involvement in the minority or
majority group and information processing biases using a minimal groups paradigm.
Children were told that they were members of either a majority or minority group, and
their group perceptions were measured as in Study 1. Results indicated that children
overestimated the proportion of negative behaviors in the minority group, and this trend
was the same for children assigned to the majority group and minority group. On the
group evaluations, however, children rated their own group more positively than the other
group. Illusory correlations also predicted differences in evaluations of the majority and
minority groups, indicating that perceiving an association between the minority group
and negative behaviors moderated the relative evaluations of the groups.
Study 3 explored these relative influences using real social stimulus groups of
girls and boys. Results were the same as in Study 2, with one exception. Fifth-graders in
the majority group did not evaluate the groups differently, whereas second-graders in the
majority group, and second- and fifth-graders in the minority group evaluated the ingroup
more favorably than the outgroup. These results suggest that children are indeed
susceptible to illusory correlations, and that there are few consistent age effects.
Furthermore, ingroup favoritism motivations are not sufficient to prevent minority group
members from perceiving an illusory correlation between their own group and negative

v
behaviors, although minority group children did evaluate the ingroup more favorably.
Again, however, differences in evaluations of the majority and minority groups were
predicted by children’s illusory correlations. These findings are discussed in terms of
their implications for stereotype formation, minority children’s group perceptions, and
strategies for counteracting illusory correlation effects.

vi
TABLE OF CONTENTS
LIST OF TABLES………………...….……………………………………………....
x
LIST OF FIGURES…………………………………………………………………..
xii
Acknowledgements…………………………………………………………………... xiii
Chapter 1. ILLUSORY CORRELATION IN CHILDREN: COGNITIVE AND
MOTIVATIONAL BIASES IN GROUP IMPRESSION FORMATION……..
1
Illusory Correlation in Adults…………………………………………………..
3
Measuring Illusory Correlation…………………………………………...
3
The Classic Paradigm…………………………………………………….
5
Explanations for Illusory correlation Findings…………………………...
7
The Distinctiveness Hypothesis…………………………………….
7
Evaluations Based on Group Size……………………………….….
8
The Regression-Information Loss Hypothesis……………………...
10
The Exemplar-Based Model………………………………………..
10
Encoding Bias versus Retrieval Bias……………………………….
11
The Search for Features that Distinguish Categories……………….
13
Summary……………………………………………………………
16
Variations on the Classic Paradigm………………………………………
17
On-Line versus Memory-Based Judgments………………………...
17
The Role of Expectation……………………………………………
18
Target Salience……………………………………………………...
20
Summary……………………………………………………………
22
The Self as a Member of a Target Group………………………………...
23
Summary……………………………………………………………
31
Illusory Correlation in Children: Expectations and Related Developments……
31
Expectations for Developmental Change in Distinctiveness-Based
Illusory correlations………………………………………………………
32
Perception of Frequency and Attention…………………………….
32
Memory Developments………………………………………….….
34
Developmental Changes in Estimation and Use of Base-Rates…….
35
Developmental Changes in Judgment of Covariation……………...
37
Summary……………………………………………………………
39
Empirical Evidence of Distinctiveness-Based Illusory Correlations in
Children…………………………………………………………………... 40
Expectations for Illusory Correlations When the Self is a Member of a
Target Group……………………………………………………………...
43
Prior Expectations and Schematic Information Processing………...
44
Developmental Changes in Intergroup Discrimination…………….
47
Summary……………………………………………………………
50

vii
Expectations for Developmental Changes in the Formation of Illusory
Correlations………………………………………………………………. 50
Current Research………………………………………………………………..
54
Chapter 2. STUDY 1: CHILDREN’S PERCEPTIONS OF DISTINCTIVENESS-
BASED ILLUSORY CORRELATIONS.……………………………………...
56
Method…………………………………………………………………………. 57
Participants…………………………………………………………….…. 57
Materials……………………………………………………………….…
57
Target Children………………………………………………….….
57
Target Behaviors…………………………………………………… 57
Photographs Depicting Target Behaviors…………………………..
58
Group-Behavior Associations………………………………………
58
Illusory Correlation Tasks………………………………………………... 59
Group Attributions……………………………………………….… 59
Frequency Estimations……………………………………………...
59
Group Evaluations………………………………………………….
60
Sentence Memory Measure…………………………………………….… 60
Procedure…………………………………………………………………
61
Results………………………………………………………………………….. 62
Overview of Analyses………………………………………………….…
62
Attribution Task………………………………………………….…….… 63
Tests for Significance of Phi Coefficients……………………….…
64
Condition and Grade Differences in Attributions…………………..
66
Accuracy of Attributions…………………………………………… 67
Summary of Findings for the Attribution Task……………………..
69
Frequency Estimations……………………………………………………
70
Group Evaluations………………………………………………………..
72
Condition and Grade Differences in Evaluations…………………..
72
Regression Analyses………………………………………………..
73
Summary of Results………………………………………………………
77
Negative-Infrequent Condition……………………………………..
77
Positive-Infrequent Condition………………………………………
78
Discussion………………………………………………………………………
81
Distinctiveness of Group-Behavior Associations………………………...
84
The Role of Memory in the Formation of Illusory Correlations………....
85

viii
Chapter 3. STUDY 2: DUAL INFLUENCES OF DISTINCTIVENESS AND
INGROUP FAVORITISM ON PERCEPTIONS OF ILLUSORY
CORRELATION IN SELF-RELEVANT MINIMAL GROUPS.……………...
87
Method……………………………………………………………………….… 90
Participants……………………………………………………………….. 90
Materials and Procedure………………………………………………….
90
Materials…………………………………………………………....
90
Group Assignment……………………………………………….…
90
Measures……………………………………………………………
91
Procedure…………………………………………………………... 91
Results………………………………………………………………………….. 92
Overview of Analyses………………………………………………….…
92
Attribution Task………………………………………………….…….… 92
Tests for Significance of Phi Coefficients……………………….…
93
Condition and Grade Differences in Attributions…………………..
95
Accuracy of Attributions…………………………………………… 95
Frequency Estimations……………………………………………………
96
Group Evaluations………………………………………………………..
98
Condition and Grade Differences in Evaluations…………………..
99
Regression Analyses……………………………………………….. 100
Summary of Results……………………………………………………… 103
Results for Majority Group Members……………………………… 103
Results for Minority Group Members……………………………… 104
Discussion……………………………………………………………………… 107
Distinctiveness versus Ingroup Favoritism…………………………….… 110
The Role of Memory……………………………………………………... 111
Chapter 4. STUDY 3: FORMATION OF ILLUSORY CORRELATIONS
ABOUT GENDER GROUPS………………………………………………….. 113
Method……………………………………………………………………….… 114
Participants……………………………………………………………….. 114
Materials and Procedure…………………………………………………. 114
Results………………………………………………………………………….. 115
Attribution Task………………………………………………….…….… 116
Tests for Significance of Phi Coefficients……………………….… 116
Condition and Grade Differences in Attributions………………….. 119
Accuracy of Attributions…………………………………………… 120
Frequency Estimations…………………………………………………… 122
Group Evaluations……………………………………………………….. 123
Condition and Grade Differences in Evaluations………………….. 124
Regression Analyses……………………………………………….. 125

ix
Summary of Results……………………………………………………… 128
Results for Majority Group Members……………………………… 128
Results for Minority Group Members……………………………… 129
Discussion……………………………………………………………………… 132
Chapter 5. GENERAL DISCUSSION……………………………………….…….… 135
The Relative Influence of Distinctiveness and Ingroup Favoritism…………… 137
Age Differences in Illusory Correlation Formation……………………………. 138
Age Differences in Cognitive Bias………………………………………. 138
Age Differences in Ingroup Favoritism Effects………………………….. 139
Comparison of Illusory Correlations in Children and Adults……………. 141
Limitations of the Current Studies……………………………………………... 143
Practical Implications…………………………………………………………... 147
Future Research Directions…………………………………………………….. 151
REFERENCES………………………………………………………………………. 153
Appendix A. Target Children Used in Group-Behavior Assignment and
Attribution Task………………..……………………………….……………… 163
Appendix B. Lists of Behaviors Assigned to Target Groups………………………… 164
Appendix C. Examples of Photographs Used for Group-Behavior
Assignments……………………………………………………………………. 166
Appendix D. Example Graphic for Frequency Estimation Task ……………………. 167
Appendix E. Institutional Review Board Permission to Conduct Research with
Human Subjects………………………………………..………………………. 168

x
LIST OF TABLES
Table 1. Study 1: Mean Phi Coefficients……………………………………………..
65
Table 2. Study 1: Mean Conditional Probabilities of Positive and Negative
Behaviors Attributed to the Majority and Minority Groups……………………
66
Table 3. Study 1: Proportion of Positive and Negative Behaviors Correctly
Attributed to the Majority and Minority Groups………...……………………..
69
Table 4. Study 1: Estimated Frequency of Occurrence of the Infrequent Behavior
Class in the Majority and Minority Groups…………………………...………..
71
Table 5. Study 1: Mean Evaluation Ratings of the Majority and Minority Groups…
73
Table 6. Study 1: Regression Models Predicting Differences in Evaluations of the
Majority and Minority Groups…...……………………………………………..
76
Table 7. Study 1: Zero-Order Correlations Among Illusory Correlation Tasks and
Evaluations by Condition………………………...……………………………..
77
Table 8. Study 2: Mean Phi Coefficients…………………………………………….
94
Table 9. Study 2: Mean Conditional Probabilities of Positive and Negative
Behaviors Attributed to the Majority and Minority Groups……………………
94
Table 10. Study 2: Proportion of Positive and Negative Behaviors Correctly
Attributed to the Majority and Minority Groups……………………...………..
96
Table 11. Study 2: Estimated Frequency of Occurrence of Positive and Negative
Behaviors in the Majority and Minority Groups…………………………….....
98
Table 12. Study 2: Mean Evaluation Ratings of the Majority and Minority
Groups……………………………………………………………………….... 100
Table 13. Study 2: Regression Models Predicting Differences in Evaluations of the
Majority and Minority Groups……………………………………………...….. 102
Table 14. Study 2: Zero-Order Correlations Among Illusory Correlation Tasks and
Evaluations by Condition…………...………………………………………….. 103
Table 15. Study 3: Mean Phi Coefficients…………………………………………... 118
Table 16. Study 3: Mean Conditional Probabilities of Positive and Negative
Behaviors Attributed to the Majority and Minority Groups………………...…. 118

xi
Table 17. Study 3: Proportion of Positive and Negative Behaviors Correctly
Attributed to the Majority and Minority Groups……………………………..... 121
Table 18. Study 3: Estimated Frequency of Occurrence of the Infrequent-Behavior
Class in the Majority and Minority Groups…………………………………..... 123
Table 19. Study 3: Mean Evaluation Ratings of the Majority and Minority
Groups……………………………………………….…………………………. 125
Table 20. Study 3: Regression Models Predicting Differences in Evaluations of the
Majority and Minority Groups…………………………………..…………….. 127
Table 21. Study 3: Zero-Order Correlations Among Illusory Correlation Tasks
and Evaluations by Condition……………………………………………..…... 128

xii
LIST OF FIGURES
Figure 1. Distribution of Positive and Negative Behaviors in Group A and Group B
in Hamilton and Gifford (1976), Experiment 1……………………………...…
6
Figure 2. Model of Illusory Correlation Formation when the Self is a Target Group
Member………………...………………………………………………………. 31
Figure 3. Model of Processing Steps in the Perception of Shared Infrequency-
Based Illusory Correlations………...…………………………………………... 38
Figure 4. Contingency Table for Covariation Judgments……………………………
53
Figure 5. Study 1: Summary of Findings for the Negative-Infrequent Condition…...
79
Figure 6. Study 1: Summary of Findings for the Positive-Infrequent Condition……
80
Figure 7. Study 2: Summary of Findings for Majority Group Members……………. 105
Figure 8. Study 2: Summary of Findings for Minority Group Members……………. 106
Figure 9. Study 3: Summary of Findings for Majority Group Members……………. 130
Figure 10. Study 3: Summary of Findings for Minority Group Members…………... 131

xiii
Acknowledgments
I would like to express my extreme gratitude to Kelly Madole for years of
mentoring and support, for serving as my advisor and dissertation co-chair, and for
having the time and patience to help me get my graduate career underway. I would also
like to extend special thanks to Janis Jacobs for her role as advisor and co-chair of my
dissertation committee, for doing an excellent job of expanding my conceptual horizons,
and especially for the endless help and support she has given me in every aspect of my
final years of study. I am eternally grateful for their guidance.
I am also extremely indebted to Janet Swim for her role as my minor area advisor
and dissertation committee member. Her enthusiasm for our work together helped ignite
the flame that led to this piece of work. I also thank Jeffrey Parker and Susan McHale for
their service as committee members, and their insightful comments on my work.
I would also like to express my appreciation to Donna Kiley, Jessica Kurland, Jill
Schwait, Clair Wittels, and Craig Morrow for their tireless help in data collection, and
along with numerous undergraduates for their help with data entry.
Most importantly, I must thank my parents for their constant encouragement,
confidence, and emotional and financial support throughout all my schooling. I truly
would never have succeeded without them.
This research was supported by grants from the Society for the Psychological
Study of Social Issues, and the Penn State Research and Graduate Studies Office.

1
Chapter 1
ILLUSORY CORRELATION IN CHILDREN:
COGNITIVE AND MOTIVATIONAL BIASES
IN GROUP IMPRESSION FORMATION
Despite a long history of stereotyping research, very little research has focused on
mechanisms by which stereotypes are acquired, particularly in children. It is clear that
very young children do form stereotypes. For example, by the third year of life children
have acquired some rudimentary gender stereotypes (Kuhn, Nash, & Brucken, 1978;
Martin & Little, 1990; Thompson, 1975; Weinraub et al., 1984). However, little is
known about how children learn these associations.
One mechanism for stereotype development that has been studied broadly in
adults, but until recently has not received attention from a developmental standpoint, is
the formation of illusory correlations (see Hamilton & Sherman, 1989 for review).
Chapman (1967) defined illusory correlation as a perceived correlation between two
classes of events that, in reality, are not correlated, or are correlated to a lesser degree
than the perceived correlation. In the classic illusory correlation paradigm, desirable and
undesirable behaviors of a large social group and a small social group are described.
Although the statistical probability of a desirable or undesirable behavior occurring in
either of the two groups is the same, people often perceive an association between group

2
membership and desirable or undesirable behavior. Thus, they form an illusory
correlation between group membership and type of behavior. This effect has been
explained by information biases (e.g., Fiedler, 1991; Hamilton & Gifford, 1976; Smith,
1991), as well as motivational factors (e.g., McGarty, Haslam, Turner, & Oakes, 1993).
In addition, the formation and nature of illusory correlations have been further studied
using modified paradigms that include, for example, the self as a member of one of the
social groups (Schaller, 1991; Schaller & Maas, 1989), and self-relevant attitudes as
stimuli (Spears, van der Pligt, & Eiser, 1985). When such modifications are made, the
illusory correlation effect is often altered, demonstrating the importance of certain
motivational forces on group perception.
The formation of illusory correlations has important implications for real-world
stereotype development. There are a few cases in which groups are considered
“minority” groups because they have a lower status than other groups, but have numbers
equal to or greater than the population of the majority group, for example, women in
most societies, or Blacks in South Africa. However, most minority group populations are
smaller than the majority group population. Given that so many minority groups are
numerically smaller than majority groups, illusory correlations may explain why many
negative stereotypes about minority groups persist. For example, Blacks comprise only a
small proportion of the total U.S. population, whereas Whites make up the majority.
Furthermore, Blacks and Whites remain socially segregated to some extent. Thus, when
a Black individual is observed in an undesirable act, for instance, behaving aggressively,
the relative rarity of witnessing aggressive behavior, combined with the relative
infrequency of a White person’s encountering Blacks, may lead the White person to
overestimate the base rate for the occurrence of aggressive behavior in Blacks compared
to Whites, resulting in a negative stereotype of Blacks. Moreover, the observer’s
membership in either the Black or White social group may add motivation to view one
group more positively than the other, which could increase or attenuate the illusory
correlation effect. Similar effects could occur in the many situations in which there is a
disparity in the representation of various social groups, including other racial groups,

3
religious and ethnic groups, socioeconomic strata, age groups, and women and men in
gender-typed occupations. The simple underrepresentation of social groups in certain
situations may make the development of stereotypes, in particular negative stereotypes,
more likely and thus put these groups at a disadvantage.
It is important to determine whether children are susceptible to illusory
correlations, and to examine the developmental course of these biased perceptions.
However, developmental research on illusory correlation has just begun to emerge, and
remains scarce. Research on illusory correlation in adults and its explanations will
therefore be reviewed, and developmental trends in related processes that might affect the
developmental course of the formation of illusory correlations will be discussed.
Illusory Correlation in Adults
Measuring Illusory Correlations
Most studies on illusory correlation have manipulated and measured the
phenomenon in similar ways. Participants are presented with two target groups, where
one group (the majority group) is numerically larger than the other group (the minority
group). The groups are often minimal groups, meaning they are experimentally defined
and are not based on real criteria, such as race, religion, or geographical location. In
some cases, real-world majority and minority groups may be used (e.g., Whites and
Blacks). Characteristics such as attitude positions or positive and negative behaviors are
assigned to the two groups, with each group having the same proportion of a certain
characteristic as the other. For example, participants may be told that 18 members of
Group A (69% of Group A members) performed desirable behaviors, and 9 members of
Group A (41% of Group A members) performed undesirable behaviors, and that 9
members of Group B (69% of Group B) performed desirable behaviors, and 4 members
of Group B (41%) performed undesirable behaviors. Thus, if perception is unbiased, the

4
two groups should be judged to have performed the same proportion of positive and
negative behaviors.
Three types of tasks are typically used to measure illusory correlation. The first
task is an attribution task, in which participants are given the list of characteristics
associated with the two groups, and are asked to attribute each characteristic to one of the
two groups. For example, participants would be asked to recall whether a member of
Group A or B performed the behavior “tried not to take sides when his friends had an
argument” (Hamilton & Gifford, 1976). Although some characteristics may be recalled
correctly, some attributions are likely to represent a “best guess” as to whether a
characteristic (e.g., a negative behavior) was associated with the majority or the minority
group. Because the two types of characteristics (e.g., positive versus negative behaviors)
should be distributed evenly across the groups, overattribution or underattribution of
certain characteristics to the groups indicates biased perception, or an illusory correlation
between group membership and particular characteristics.
The second type of task is an estimation of the frequency with which each type of
characteristic occurred in each group. For example, participants might be asked to
determine the proportion of positive and negative behaviors performed by Groups A and
B. Again, because the actual proportions are equal, overestimation or underestimation of
certain characteristics represents biased perceptions of the groups. Whereas the
attribution task measures recall of the correlation between groups and characteristics, the
frequency estimation task represents an overall impression of the group-characteristic
correlation.
The final task is an evaluation task, and is usually used when positive and
negative behaviors were assigned to the groups. Participants are asked to rate the
majority and minority group on several attributes (e.g., sociable, lazy). This task is an
affective measure of the perceived positivity and negativity of each of the groups, and is
presumed to be influenced by the perceived correlation between group membership and
behavior valence. Thus, if an illusory correlation between negative behaviors and

5
minority group membership is formed, evaluations of the minority group should be more
negative than evaluations of the majority group.
The Classic Paradigm
Chapman (1967) first demonstrated the presence of an illusory correlation effect
using word pairs. Participants were presented with each word pair several times, and
each pair appeared with the same frequency. When the word pairs were strongly
associated (e.g., lion-tiger), the rate of co-occurrence for these pairs was overestimated.
In addition, participants overestimated the rate of co-occurrence among longer words,
which occurred less frequently than the shorter words. Chapman hypothesized that the
statistical infrequency of the longer words made them distinctive relative to the shorter
words, and therefore led participants to overestimate their co-occurrence.
Hamilton and Gifford (1976) found similar evidence of such distinctiveness-based
illusory correlations in social stimuli, in which infrequently occurring behaviors were
perceived to be correlated with the smaller social group. In their initial study,
participants were told that two groups, Group A and Group B, represent real social
groups, and that Group B was numerically smaller than Group A. Participants were not
aware of whether they might be members of these “real” social groups. Participants then
read statements describing positive or negative behaviors performed by a member of one
of the two groups. Group A performed twice as many positive and negative behaviors as
Group B (see Figure 1); thus, the ratio of positive to negative behaviors was the same for
both groups (2.25 positive behaviors to one negative behavior), and there was no
correlation between group membership and behavior. After reading these statements,
participants saw the list of behaviors without their corresponding group members, and
were asked to attribute each behavior to either Group A or B (attribution task). They also
estimated the frequency of occurrence for positive and negative behaviors in each group
(frequency estimation task), and completed evaluative ratings of the two groups.

6
To examine whether participants perceived a correlation between group
membership and performance of positive or negative behaviors, phi coefficients were
calculated. A phi coefficient of zero would indicate that no correlation was perceived,
whereas a non-zero phi coefficient would indicate a perceived relationship. The results
indicated that phi coefficients for the group attributions and frequency estimations were
above zero. Closer examination of the group attributions revealed that participants
correctly assigned the positive behaviors to their corresponding groups, but overattributed
negative behaviors to Group B, and underattributed negative behaviors to Group A.
Although Group A actually performed 67% of the negative behaviors, participants
assigned only 48% of the negative behaviors to Group A, and assigned the remaining
52% of the negative behaviors to Group B. Likewise, participants showed a tendency to
overestimate the frequency of negative behaviors relative to positive behaviors in Group
B on the frequency estimation task, although this effect was not statistically significant.
Finally, on the evaluative ratings of the two groups, Group A was rated as more likely to
have positive characteristics and less likely to have negative characteristics than Group B
(Hamilton & Gifford, 1976).
Hamilton and Gifford’s (1976) first experiment demonstrated the formation of an
illusory correlation between statistically infrequent, or distinctive, stimulus events. Thus,
a correlation was perceived between the smaller social group, and the less frequent, or
negative, behaviors. In a second experiment, Hamilton and Gifford reversed the
frequency of positive and negative behaviors and again found a perceived association
Figure 1
Distribution of Positive and Negative Behaviors in Group A
and Group B in Hamilton and Gifford (1976), Experiment 1
Behaviors
A
B
Total
Positive
18
9
27
Negative
8
4
12
Total
26
13
39

7
between the infrequent stimulus sets. That is, in Experiment 2, the positive behaviors
were less frequent than the positive behaviors, and participants overestimated the number
positive behaviors attributed to Group B—the exact opposite effect found in Experiment
1 in which negative behaviors were less frequent.
This phenomenon has since proved to be a robust and reliable effect. A meta-
analysis of 23 studies using attribution tasks, and 28 studies using frequency estimation
tasks underscores the consistency and strength of the illusory correlation effect (Mullen
& Johnson, 1990). Combined effect sizes for negative distinctive behaviors were large
for both attribution and frequency estimation tasks (d=.83-1.0), and effect sizes for non-
negative distinctive behaviors were small to moderate for both types of tasks (d=.32-.44).
Explanations for Illusory Correlation Findings
The Distinctiveness Hypothesis. Hamilton and Gifford (1976) argued that their
illusory correlation findings were the result of biased encoding of distinctive, or
infrequently occurring, information. They reasoned that the infrequency of certain
behaviors made them more salient, and that heightened attention to the more salient
behaviors led to better encoding of these behaviors. The increased attention to the co-
occurrence of the less frequent behavior with the smaller group should result in better
encoding of the relationship between the minority group and the infrequent behaviors.
As a result, these stimuli should be more readily accessible for later retrieval from
memory (Tversky & Kahneman, 1973), and may therefore unduly influence judgments
about the frequency of co-occurrence.
The increased salience of the distinctive stimuli was supported by Hamilton and
Gifford’s (1976) finding that participants were relatively accurate in their group
attributions of the more frequent behaviors. In Experiment 1, participants attributed 65%
of the more frequent (positive) behaviors to the majority group, and 35% to the minority
group, whereas the actual proportions were 67% for the majority group and 33% for the
minority group. However, they attributed only 48% of the infrequent (negative)

8
behaviors to the majority group, and 52% to the minority group, whereas the correct
proportions were again 67% for the majority group and 33% for the minority group.
When asked to estimate the frequency with which each group performed positive and
negative behaviors, participants were accurate in estimating the proportion of frequent
and infrequent behaviors in the majority group (66% and 34%, respectively), but they
overestimated the proportion of infrequent behaviors (44%) and underestimated the
proportion of frequent behaviors (56%) performed by the minority group. Similar results
were obtained in Experiment 2 in which negative behaviors were frequent and positive
behaviors were infrequent. Thus, the pattern of overestimation of the co-occurrence of
the infrequent behaviors being performed by the minority group was consistent across the
attribution and frequency estimation measures, and held when the infrequent behaviors
are positive as well as negative.
Hamilton, Dugan, and Trolier (1985) further examined the distinctiveness
hypothesis in the formation of illusory correlations. In addition to estimating the
frequency of occurrence for positive and negative behaviors in the majority and minority
groups, participants were also asked to recall any behaviors they had heard and the group
who performed each behavior. Hamilton et al. found that participants recalled
significantly more minority group-negative (infrequent) behaviors than minority-positive
behaviors or majority group behaviors, suggesting that the infrequent behaviors
performed by the minority group were indeed more available in memory than other
behaviors. Moreover, phi coefficients based on frequency estimations were significantly
correlated only with the number of minority-negative behaviors recalled. The more
minority-negative behaviors participants recalled, the greater the perceived relationship
between group membership and behavior was. These findings further strengthen the
argument that the illusory correlation effect results from the increased salience of co-
occurring distinctive stimuli.
Evaluations Based on Group Size. Other explanations for the illusory correlation
effect were proposed based on the assumption that larger groups may be perceived more
favorably than smaller groups. One possibility is that if perceivers have a priori notions

9
that majority groups are more favorable than minority groups, this belief may bias their
perceptions against the minority group and lead them to overestimate the minority
group’s base rate for undesirable behaviors. Hamilton and Gifford (1976) examined this
possibility in their second study and found that when desirable behaviors, rather than
undesirable behaviors, were infrequent, participants overestimated the co-occurrence of
the minority group with desirable behaviors, suggesting that they did not simply show a
tendency to overestimate the number of undesirable behaviors performed by the minority
group, or overestimate the number of desirable behaviors performed by the majority
group.
However, Mullen and Johnson’s (1990) meta-analytic review showed that effect
sizes for illusory correlation measures were much higher when the distinctive behaviors
were negative than when they were non-negative. This finding may indicate some
tendency to attribute negative behaviors to minority groups. Another possibility is that
participants might identify with the majority group and therefore want to represent it
more positively (McGarty et al., 1993). Alternatively, the larger effect sizes for negative
distinctive behaviors may be due to the increased salience of negative or undesirable
behaviors. Other research has suggested that undesirable behaviors are more salient and
attract more attention than desirable behaviors (e.g., Kanouse & Hanson, 1972; Ritchie,
McClelland, & Shimkunas, 1967). Consistent with the distinctiveness hypothesis, then,
the negative valence of undesirable-distinctive behaviors may further enhance their
salience, strengthening the illusory correlation effect when undesirable behaviors are
infrequent.
A second explanation that was proposed is derived from the “mere exposure”
effect (Zajonc, 1968), in which greater exposure to a stimulus leads to enhancements in
evaluations of the stimulus. In illusory correlation studies, because the majority group is
numerically larger than the minority group (typically twice as large), the greater exposure
to the positive statements associated with the majority group could produce more
favorable evaluations of that group. However, examination of the data has shown that
participants are fairly accurate in their perceptions of the majority group, but tend to

10
perceive a relationship between minority group membership and distinctive behaviors.
Furthermore, this effect occurs even when desirable behaviors are distinctive, suggesting
that illusory correlations are not due to more favorable evaluations of the majority group.
The Regression-Information Loss Hypothesis. Fiedler (1991) proposed that
illusory correlation effects can be accounted for in terms of information loss from
memory. According to Fiedler’s account, illusory correlation is the result of regression to
the mean, which is especially strong in the low-frequency category, resulting in an
overestimation of the low-frequency behaviors in the minority group. Furthermore,
because the position of the minority group, with its very small number of behaviors in the
infrequent class, is extreme, any lack of confidence in making judgments or information
loss resulting in a central tendency response should affect the minority group more than
the majority group because of the minority group’s extremely low position on the
frequency scale. Importantly, this account does not rely on the assumption that certain
behaviors are more distinctive than others. Rather, a simple regression effect due to
information loss occurs and influences judgments such that the least frequent behaviors,
which occur in the minority group, are overestimated.
Consider, for example, Hamilton and Gifford’s (1976) studies in which there were
18 frequent behaviors and 9 infrequent behaviors in the majority group, and 8 frequent
behaviors and 4 infrequent behaviors in the minority group. Some uncertainty should
occur regarding the group with which some particular behaviors were associated.
Because the groups are of unequal sizes, regression to the mean should occur when
making judgments about whether the uncertain behaviors were performed by the majority
or minority group. However, regression should occur most strongly in the minority
group-infrequent behaviors cell because the number of minority-infrequent behaviors is
extremely small. Thus, regression to the mean should result in an overestimation of
minority-infrequent behaviors, creating an illusory correlation that is not necessarily
dependent on the increased distinctiveness of the minority-infrequent behaviors.
The Exemplar-Based Model. A second model that does not rely on the
distinctiveness of behaviors to explain illusory correlation is Smith’s (1991) exemplar-

11
based model. According to this model, memory for the behaviors presented in the
illusory correlation task depends on the storage and retrieval of specific exemplars.
Estimation of the proportions of positive and negative behaviors in which each group
engaged is based on the arithmetic difference between the number of positive and
negative behaviors. For example, if the majority group engages in 18 positive behaviors
and 8 negative behaviors, the absolute difference between positive and negative
behaviors is 10, in favor of the positive behaviors. If the minority group engages in 9
positive behaviors and 4 negative behaviors, however, the absolute difference between
positive and negative is only 5 in favor of positive behaviors. Thus, the majority group
may be judged more positively than the minority group because of the additional positive
exemplars that were retrieved.
Encoding Bias versus Retrieval Bias. Hamilton and Gifford (1976) claimed that
distinctive stimuli are more salient during the encoding process, and therefore are
encoded more effectively than nondistinctive stimuli. However, another possibility, such
as that proposed by Smith (1991), is that illusory correlation effects are due to a retrieval
bias. According to this view, information may be properly represented at encoding, but
biased retrieval processes may result in illusory correlations.
Hamilton et al. (1985) examined the hypothesis that illusory correlations are due
to an encoding bias rather than a retrieval bias. They presented one group of participants
with a serial presentation of group membership-behavior statements, a second group with
the same group-behavior statements followed by a summary table of the number of
positive and negative behaviors performed by each group, and a third group with only a
summary table. They found that the group that received only the summary table made
accurate estimations of positive and negative and behaviors for both of the groups; the
two groups that received the serial presentation of the stimuli, however, formed the
typical illusory correlation. Hamilton et al. argued that receiving the summary table
following the serial presentation was not able to attenuate the illusory correlation effect
because the memory bias occurred at encoding. Had the bias occurred at retrieval, they
reasoned, viewing the summary table should have led to accurate perceptions.

12
However, a study by McConnell, Sherman, and Hamilton (1994a) disputed the
claim that illusory correlations are necessarily due to a bias during the initial encoding
process. They distributed the minority-infrequent behaviors throughout the presentation
of behaviors in three conditions: a balanced condition, a primacy-loaded condition, and a
recency-loaded condition. In the balanced condition, the minority-infrequent behaviors
were distributed evenly throughout the stimulus set. In the primacy-loaded condition,
these behaviors were massed early in the behavior presentation, thus making them similar
in frequency to the more frequent behaviors and nondistinctive at the time of
presentation. Finally, in the recency-loaded condition, the minority-infrequent behaviors
were not presented until the end of the list, making them especially distinctive at the time
of presentation. The hypothesis that minority-infrequent behaviors are more salient at the
time of encoding would predict no illusory correlation in the primacy-loaded condition,
and enhanced illusory correlation effects in the recency-loaded condition. However,
contrary to the predictions of this hypothesis, the results showed similar effects in all
three conditions.
The findings from this study suggest that distinctiveness at the time of encoding is
not necessary for the formation of illusory correlations. Fiedler’s (1991) and Smith’s
(1991) models, which do not assume any enhanced encoding of distinctive stimuli, could
account for these findings. However, McConnell et al. (1994a) tested an extended
distinctiveness-based explanation in which information that is not distinctive at the time
of encounter can become distinctive as new information is received and processed. The
newly distinctive information is presumed to receive further encoding, and thus result in
illusory correlations due to this post-encoding process. They included a latency measure
for responses on the group attribution task to test their model. Indeed, they found that
response latencies for the minority-infrequent behaviors were lower than for other
behaviors, and these results were similar across the balanced, primacy-loaded, and
recency-loaded conditions. These results indicate that the minority-infrequent behaviors
did become more accessible in memory, regardless of whether they occurred in a position
that would make them more or less distinctive relative to other behaviors. Thus, contrary

13
to Fiedler’s and Smith’s models, McConnell et al. concluded that illusory correlation
effects do appear to result from enhanced encoding of distinctive stimuli, although the
enhanced encoding may occur during a post-encoding process rather than at the time of
initial encoding. In other words, stimuli need not be distinctive at the time of initial
presentation, but can become distinctive later when compared to other behaviors.
McConnell et al.’s (1994a) research suggests that group-behavior associations do
not need to be especially distinctive at the time they are first encountered to become
salient and lead to illusory correlations. Rather, as it becomes apparent that certain types
of group-behavior associations occur less frequently than others, the less frequent
associations can become more available in memory and unduly influence later judgments.
This finding not only provides further support for the distinctiveness hypothesis, but also
lends credence to the notion that illusory correlations may result in real world
circumstances. Even when group-behavior associations are not witnessed as part of a
large series of behaviors in which certain group-behavior associations are noticeably less
frequent, comparisons of the relative frequency of the behaviors may be made later, and
the less frequent group-behavior associations could become more salient at that time due
to their infrequency. Thus, McConnell et al.’s finding suggests the possibility that
illusory correlation effects are not limited to a specific experimental situation in which
the order of the behaviors is carefully contrived, but could be generalizable to more
realistic situations in which later comparisons must be made to determine the relative
frequency of group-behavior associations.
The Search for Features that Distinguish Categories. McGarty and his
colleagues (McGarty, et al., 1993; Haslam, McGarty, & Brown, 1996) have proposed that
motivational factors, namely, the attempt to imbue categories with meaning by seeking
dimensions along which those categories differ, contributes to the formation of illusory
correlations. It is argued that categorization is a process by which people attempt to
make sense of potentially confusing stimuli (McGarty et al., 1993). When faced with
categories of a stimulus, people seek regularities in the stimuli that take the form of
similarities and differences, and they then accentuate the similarities and differences to

14
make distinct and useful categories (Tajfel & Wilkes, 1963). Thus, when told that they
will hear behaviors of Groups A and B in illusory correlation studies, people may seek to
find differences in the two groups, which may cause or accentuate illusory correlations.
McGarty et al. (1993) examined this possibility by giving participants only
minimal information about two groups. Participants were told either that there were
twice as many statements about Group A as Group B, that half the positive statements
referred to Group A, or were given no information about the groups. No behavior
statements about group members were given; thus, there was no possibility that
distinctive behaviors or memory biases influenced performance on the illusory
correlation tasks. Participants were then presented with behavior statements and were
asked to guess the group membership of the person associated with each behavior,
provide frequency estimates of the number of positive and negative behaviors associated
with each group, and complete trait ratings. With the exception of the no information
condition, illusory correlation effects occurred on at least two of the three measures, even
in the absence of behavioral information about the groups. In a second study, participants
were shown the behavior statements with no reference to group membership, and then
were asked to attribute group membership to each behavior. Again, they found that
participants formed illusory correlations despite the fact that encoding and retrieval
biases were impossible. These results indicate that differential encoding or retrieval of
the behavior-group membership information was not necessary for illusory correlations to
be perceived. Rather, participants created perceived differences in the two groups, not
based on any misperception of information, but apparently in an effort to distinguish the
categories.
Haslam et al. (1996) investigated whether illusory correlations are formed when
participants expect groups not to differ on any socially meaningful dimension. They
proposed that if people do not expect any group differences before presentation of the
behavior statements, they should not form illusory correlations. Illusory correlation
effects in a control group, who heard statements about majority and minority groups A
and B, were compared to effects in an experimental group, who heard statements about a

15
majority group of right-handers and a minority group of left-handers (groups that are not
expected to differ with respect to social characteristics because these groups have no
social meaning). They found that whereas people in the control condition showed biased
perceptions against the minority group, people presented with the behaviors of right- and
left-handers did not form illusory correlations. In addition, participants in the control
condition were more likely than those in the experimental condition to report trying to
find differences between the two groups. These findings suggest that illusory
correlations may be caused, or at least facilitated, by the search for a means of
differentiating two social groups, but that the effects are ameliorated when it is known
that the groups have no social meaning and thus do not warrant social differentiation.
Further evidence that illusory correlation effects may have some motivational
basis is Acorn, Hamilton, and Sherman’s (1988) finding that biased perceptions of one
type of characteristic induced by an illusory correlation task generalized to another type
of characteristic. In one study, participants were presented with statements describing
positive and negative social skills, intellectual skills, or both. If illusory correlations were
based solely on the data presented, they should remain domain-specific, and negative
evaluations of the minority group should not generalize to a different domain. However,
Acorn et al. found that negative perceptions of the minority group were indeed
generalized from the social domain to the intellectual domain, or vice versa. In a second
study, generalization across the traits of introversion-extroversion and maturity-
immaturity was examined, with introversion and immaturity considered undesirable
traits. On these dimensions, evaluative generalization did not occur. That is, the
introverted group was not rated as less mature, or vice versa. Rather, participants
generalized the traits using theory-like reasoning about how the traits are related, judging
introverted targets to be more mature, and extraverted targets to be less mature.
Thus, the perceived correlation between group membership and traits was not
based only on the information presented. Rather, group evaluations were generalized
from one domain to another, suggesting some motivational basis for these perceptions.
Although this study does not provide evidence that motivational factors influenced

16
judgments on the initial task for which participants heard which traits were associated
with each group (i.e., social, intellectual, or both), generalization to other trait domains
was due to motivational factors and not to a cognitive bias caused by the presentation of
information.
Summary. Several explanations for illusory correlation effects have been
proposed. Hamilton and Gifford (1976) proposed that these effects result from the
increased salience of behaviors that co-occur infrequently, that is, infrequent behaviors in
the minority group. Because minority-infrequent behaviors do occur so infrequently,
they draw the perceiver’s attention to them, making them distinctive in comparison to
other group-behavior associations, and the frequency of these distinctive behaviors is
overestimated because of their increased cognitive availability (Tversky & Kahneman,
1973).
Fiedler (1991) and Smith (1991) offered explanations for illusory correlation
effects that are not dependent on the assumption of increased salience of minority-
infrequent behaviors. Rather, illusory correlation is believed to be due to regression to
the mean (Fiedler, 1991) or to arithmetic differences between the number of positive and
negative exemplars encountered in each group (Smith, 1991). However, McConnell et al.
(1994) compared these three theoretical explanations, and found evidence only in support
of the distinctiveness hypothesis. Furthermore, McConnell et al. suggested that minority-
infrequent behaviors become distinctive at the time of encoding when these behaviors are
compared to the more frequent group-behaviors associations that have been stored in
memory.
McGarty and his colleagues argued that illusory correlation effects result not
simply from a cognitive bias that leads to the overestimation of distinctive behaviors, but
to the tendency to imbue categories with meaning. When presented with categories of a
stimulus, they argue, people will seek regularities in the stimuli, which will lead to
perceived differences between the groups. However, illusory correlation effects may not
result from either a cognitive bias or a motivational bias, but from a combination of the
two types of biases. While the shared infrequency of minority-infrequent behaviors

17
makes them cognitively distinctive, motivation to find differences in the two groups may
help direct attention towards the distinctive stimuli, or facilitate the overestimation of the
frequency of occurrence of these stimuli. In the absence of motivation to find group
differences, the belief that the groups are alike may lead perceivers to ignore the
distinctiveness of the minority-infrequent behaviors and estimate the groups to be equal.
Variations on the Classic Paradigm
On-line versus Memory-Based Judgments. Hamilton and Gifford (1976) argued
that illusory correlations are formed from memory-based judgments. According to their
view, distinctive information is represented more strongly in memory and is therefore
more accessible for making judgments. Several studies have examined whether illusory
correlation can take place under conditions of on-line impression formation. In contrast
to memory-based judgments, which rely strictly on information retrieved from memory,
on-line impression formation involves attending to the usual behaviors performed by a
target. On-line judgments create an overall impression of the target and are continually
revised as new information is received.
Sanbonmatsu and his colleagues (Sanbonmatsu, Hamilton, and Sherman, 1987;
Sanbonmatsu, Shavitt, Sherman, & Roskos-Ewoldsen, 1987) believed that on-line
impression formation would not lead to illusory correlation effects involving the
overestimation of distinctive behaviors. They examined whether people form illusory
correlations of individuals as opposed to groups. Group perception is assumed to be
memory-based because perceivers presumably do not expect groups to have a “group
personality.” On the other hand, individuals are presumed to be judged on-line because
the individual is expected to exhibit consistent behaviors that will allow the perceiver to
form a clear impression of the individual.
Sanbonmatsu, Hamilton, and Sherman (1987) investigated perceptions of salient
and non-salient individual targets in an illusory correlation task. Because judgments of
the individual targets are likely to be made on-line, perceivers should attend to the more

18
typical behaviors of the targets, rather than to the unusual, infrequent behaviors.
Participants read about or observed several individual targets. In addition, one of the
targets was made distinctive by instructing participants to pay special attention to him.
Although each of the targets performed the same number of desirable and undesirable
behaviors, participants overestimated the occurrence of the more frequent behaviors
when judging the target who was made distinctive, but were accurate in judging the other
targets. Thus, on-line impression formation of a distinctive individual target led to
illusory correlation that was in the opposite direction as that formed when judging group
targets, suggesting that illusory correlation effects are dependent on the target of
perception, and the type of information processing that takes place.
Pryor (1986) and Schaller and Maass (1989) demonstrated that on-line impression
formation could ameliorate illusory correlation effects when the targets were groups.
Participants were instructed to try to form a general impression of the two groups as they
read the behavior statements describing each group member. They found that these on-
line judgments did not lead to any illusory correlation effects.
Thus, the illusory correlation effect in which the minority group’s involvement in
infrequent behaviors is overestimated appears to be due to memory-based processing.
However, McConnell, Sherman, and Hamilton (1994b) found that group impressions on
an illusory correlation task were not strictly memory-based. Correlations between recall
for behaviors and judgments, which would indicate memory-based judgments, were only
significant when participants received instructions that interfered with on-line processing.
McConnell et al. proposed that group judgments may involve a slight degree of on-line
processing; this processing does not result in a fully integrated impression of the groups,
but may involve some partial perception of group traits which may influence judgments.
The Role of Expectation. Despite the abundance of illusory correlation research
on the formation of novel group perceptions, very little work has focused on the role of
prior expectations in the perception of illusory correlations. Although Hamilton and
Gifford (1976) originally conceived of this phenomenon as a means of developing new
stereotypes, prior expectations about specific ways in which groups might differ (e.g.,

19
stereotypes) may serve to hinder or facilitate the perception of illusory correlations.
When group expectations are consistent with the anticipated illusory correlation effects,
that is, when expectations about the minority group’s characteristics are consistent with
the infrequent characteristics exhibited by the minority group, the perception of a
correlation between the minority group and these behaviors should be facilitated.
However, when minority group expectations are inconsistent with the minority group’s
infrequent characteristics, perception of an illusory correlation should be impeded. As is
predicted in schematic-processing situations, information that confirms expectations
should be more readily attended to and encoded, leading to judgments consistent with
illusory correlation effects. However, expectations that are inconsistent with actual group
characteristics may undermine illusory correlation effects by shifting attention away from
the distinctive information that disconfirms prior expectations.
McArthur and Friedman (1980) examined the role of stereotyped expectations on
illusory correlation effects using black/white, young/old, and male/female stimulus
groups. Groups of blacks, elderly people, and women were expected to be seen by
young, white college students as having less desirable characteristics than whites, young
people, and men. Indeed, when stereotyped expectations about blacks and elderly people
were consistent with shared infrequency, that is, when blacks and elderly people were
members of the numerical minority group and infrequent behaviors were undesirable,
illusory correlation effects were found such that negative behaviors and negative ratings
were more strongly associated with blacks and elderly people. In addition, men, but not
women, rated women more negatively and associated more negative behaviors with
women when women were the stimulus minority group. In contrast, when expectations
about the stimulus groups were inconsistent with the anticipated illusory correlation
effects, no illusory correlation was seen. That is, when whites, young people, and men
were the stimulus minority groups, undesirable behaviors were not overattributed to these
groups, and these groups were rated more positively than when they appeared more
frequently. Thus, illusory correlation effects based on shared infrequency were not found

20
when these effects were inconsistent with respondents’ prior expectations about the target
groups.
Whereas McArthur and Friedman (1980) found that expectations overrode the
group information presented to impede the formation of illusory correlation, Berndsen,
van der Pligt, and Spears (1996) found that data that disconfirmed expectations could
prevent expectancy-based perceptions. Some participants were given the expectation that
a minority group behaved more negatively than a majority group. All participants
completed a rating task that served to present positive and negative behaviors performed
by the two groups. The rating task also disconfirmed the expectation that the minority
group would engage in more negative behaviors than the majority group because the base
rates for positive and negative behaviors were the same for both groups. Participants
who completed the rating task in the absence of prior expectations about the minority
groups’ behavior perceived an illusory correlation between group and behavior
desirability. However, participants who were given the expectation that the minority
group would perform more negative behaviors perceived a significantly lower correlation
between group and behavior valence after completing the rating task. Although they
initially expected the minority group to behave more negatively, the rating task allowed
them the opportunity to test and disconfirm their expectation, and the illusory correlation
effect was therefore reduced. Thus, in contrast to McArthur and Friedman’s findings that
group perceptions were primarily expectation-driven rather than data-driven, Berndsen et
al. demonstrated that perceptions could be based on an interplay between prior
expectations and actual data. The ability of the expectation-disconfirming evidence to
reduce expectancy-based illusory correlation effects may be due to the amount of
attention to the disconfirming evidence required by the rating task, or to the fact that
expectations were manipulated just prior to the rating task and may therefore have been
easily revised.
Target Salience. Other means of making information distinctive independent of
frequency have been explored. Sanbonmatsu, Sherman, and Hamilton (1987) examined
illusory correlation effects when one group was made distinctive by directing

21
participants’ attention towards it. They hypothesized that drawing attention to one group
over the others would increase the likelihood that the infrequent behaviors would be
associated with this group. Five target groups were used, and each group engaged in the
same number of positive and negative behaviors. One of the groups was made distinctive
by telling participants that this group was of special interest. As expected, people
overestimated the number of infrequent behaviors associated with the distinctive group.
Thus, although the groups performed the same number of desirable and undesirable
behaviors, the special attention paid to one group led to an association between that group
and the infrequent behaviors.
Self-relevant target features have also been shown to make attitudes distinctive
and produce illusory correlation effects. Spears et al. (1985) examined illusory
correlation as a function of attitude congruence with a majority or minority group
position and attitude extremity. Participants who held pro- or anti-nuclear power
attitudes read attitude statements about a large town and a small town whose residents
held mainly pro- or anti-attitudes towards the building of a nuclear power plant. Spears
et al. reasoned that statements congruent with participants’ attitudes would be more
salient than incongruent attitudes. For participants who held attitudes congruent with the
minority position, then, the minority-infrequent statements should be particularly salient
because their self-relevance should increase the distinctiveness effects. On the other
hand, for participants who held attitudes congruent with the majority position, the
salience of the majority position should compete with the distinctiveness effect of the
infrequent position and attenuate perceptions of an illusory correlation. Furthermore,
these effects were expected to vary in strength as a function of participants’ attitude
extremity.
Spears et al. (1985) found that, as expected, minority-congruent attitude holders
showed stronger illusory correlation effects than majority-congruent attitude holders.
Furthermore, the strength of the illusory correlations increased with attitude extremity for
the minority-congruent participants, but decreased with attitude extremity for majority-
congruent participants. Thus, self-relevance of the attitude statements made statements

22
congruent with participants’ own attitudes more salient and strengthened the illusory
correlation for minority-congruent attitude holders. For majority-congruent attitude
holders, the competing salience of the majority group’s attitude position and the attitude-
incongruent minority position reduced the illusory correlation effect, particularly for
participants who held strong majority-congruent attitudes.
Summary. Illusory correlation effects change substantially when certain aspects
of the paradigm are changed. Specifically, judging individuals rather than groups,
judging groups with directions to form coherent group impressions as the information
about the groups is presented, and having prior expectations about groups led to a
different pattern of perceptions than in the classical paradigm. These differences appear
to occur because under these conditions, processing of the group-behavior associations is
believed to take place on-line, rather than from a complete set of associations stored in
memory. When processing occurs on-line, the perceiver compares each new piece of
information to the previously encountered pieces of information to form an impression of
the target or targets that is continuously updated. The result is an impression that is more
strongly influenced by the more frequently encountered information, rather than by the
less frequent information. Thus, when judging individual targets, or when the perceiver
is asked to form an impression of the groups at the time of presentation of the group-
behavior associations, illusory correlations are not typically formed, and judgments of the
targets or groups are fairly accurate. One exception is when individual targets or groups
are made explicitly salient. In this case, the more frequent behaviors are overly
associated with the salient target, resulting in an illusory correlation effect that is opposite
the effect normally found in group perception, that is, that the minority group is overly
associated with the less frequent behaviors (Sanbonmatsu, Hamilton, & Sherman, 1987).
However, the presence of prior expectations about groups places an additional
constraint on processing. Because perceivers expect certain behaviors to be prevalent in
certain groups, their attention should be directed towards confirmatory information. That
is, perceivers are likely to search for information that confirms their prior expectations

23
about the groups, and discount information that contradicts their expectations. The result
is group impressions that are likely to be consistent with prior expectations.
Shared infrequency is also not the only way in which group-behavior associations
can become distinctive. Even when the groups are the same size and engaged in the same
number of positive and negative behaviors, the number of infrequent behaviors
performed by a group that has been made salient by directing perceivers’ attention
towards it will be overestimated (Sanbonmatsu, Sherman, & Hamilton, 1987).
The self-relevance of a group characteristic can also make the characteristic
distinctive, and can strengthen or attenuate illusory correlation effects. When the self-
relevant characteristic occurs in the minority group, illusory correlations are particularly
strong because the relative infrequency of the characteristic and its salience due to self-
relevance makes it especially distinctive. However, when the self-relevant characteristic
occurs in the majority group, the effects of infrequency and self-relevance compete, and
illusory correlation effects are reduced (Spears et al., 1985).
Thus, judging individuals versus groups, prior expectations about groups, target
salience, and self-relevance are factors that disrupt the formation of illusory correlations,
and may allow for accurate perceptions, or may lead to different types of illusory
correlations than those based on shared infrequency. Moreover, findings that on-line
processing, which directs attention away from infrequent behaviors, and the effects of
increasing target salience, either by increasing attention to particular targets or groups or
through self-relevance of target characteristics, add further support to the hypothesis that
illusory correlation effects result from the increased salience of certain characteristics.
When these characteristics are made more or less salient, illusory correlation effects are
likewise enhanced or reduced.
The Self as a Member of a Target Group
Another set of factors influences the formation of illusory correlations when the
perceiver is a member of one of the target groups. When the self is implicated in

24
perceptions, new motivations for the maintenance of self-esteem are introduced. To
maintain self-esteem people often engage in self-enhancement strategies such as viewing
their own social group more positively than other groups, known as ingroup favoritism.
Social categorization research has repeatedly demonstrated that group members show
favoritism towards their own group, for example, by allocating more rewards to the
ingroup (Tajfel, Flament, Billig, & Bundy, 1971) or by rating the ingroup more favorably
than the outgroup (Horowitz & Rabbie, 1982), even when the basis for categorizing
people is minimal and apparently unmeaningful (Brewer, 1979; Tajfel, 1982). Schaller
and Maass (1989) argued that when the perceiver is a member of a target group used in
an illusory correlation task, initial group impressions are formed when the perceiver is
categorized into one of the groups rather than following the presentation of behaviors
engaged in by the two groups. Thus, participants in illusory correlation studies who are
members of one of the target groups are likely to be biased towards their own group
before the positive and negative behaviors of the two groups have been presented. This
expectation may then bias the group information encountered such that information
consistent with the expectation that one’s own group is relatively more positive will be
remembered and data inconsistent with this notion may be discounted. When ingroup
bias and shared infrequency effects are in conflict, perceivers may tend to view their own
group more favorably than the outgroup, even if illusory correlation effects would predict
the opposite.
Another difference between the processing of information about the self or a
group to which one belongs versus groups to which one does not belong is that as in the
case of judging other individual targets, making judgments about the self involves on-line
processing, which leads to different outcomes than memory-based judgments
(Sanbonmatsu, Hamilton, & Sherman, 1987; Sanbonmatsu, Shavitt, et al., 1987). On-line
impressions of the self or self-relevant groups should be made beginning with the initial
presentation of information and should be continuously revised as new information is
encountered. Perceivers should therefore attend to the more frequently encountered
information, and should overassociate their own group with the more frequent class of

25
behaviors. However, self-protective motives should lead perceivers to form the
expectation that their own group will be positive. If the more frequent behaviors are
undesirable, the normal effects of on-line impression formation and self-enhancement
motives will be in opposition.
Sanbonmatsu, Shavitt, et al. (1986) examined the effects of on-line processing of
targets and self-enhancement motives on the development of illusory correlations by
comparing perceptions of the self to perceptions of individual targets. Participants were
told either that they were performing a task along with several other targets (participant
condition), or that they would be observing a task performed by several individuals
(observer condition). In the observer condition, one target was made salient by asking
participants to attend to him, whereas in the participant condition, the self was presumed
to function as a salient target. In the success condition, participants were told that they
performed the task well, while in the failure condition they were told that they performed
poorly. Finally, participants were made to believe that the task was either important
(social knowledge) or unimportant (social trivia); thus, the potential effects on self-
esteem were varied by whether the person succeeded or failed the task and by the
importance of the task.
It was expected that consistent with on-line impression formation, participants
would form an illusory correlation between the salient target, whether it was the self or a
salient other, and the more frequent class of behaviors, either successes or failures on the
task. One exception was predicted. In the condition in which participants performed the
task, the task was important, and failures were more frequent than successes, motivation
to preserve self-esteem was expected to override the cognitive bias to form an illusory
correlation between the self and failures. Thus, although participants in this condition
were told that they failed an important task, they were not expected to judge themselves
to have any more failures than non-salient targets (Sanbonmatsu, Shavitt, et al., 1986).
Indeed, they found that the self and salient others were judged similarly, and the
association between the self or a salient target and successes was overestimated when
successes were frequent or when the task was unimportant. However, in the participant

26
condition, the self was not judged differently than other targets when failures were
frequent and the task was important. Furthermore, when asked to rate how well the self
or the salient target performed relative to the other targets, the same pattern of results was
obtained. Thus, when cognitive biases were expected to work to enhance one's view of
the self, illusory correlations were formed, but when cognitive and motivational biases
were expected to work in opposition to one another, motivational biases to preserve self-
esteem outweighed cognitive effects, and no illusory correlation was formed
(Sanbonmatsu, Shavitt, et al., 1986).
Schaller and Maass (1989) investigated the relative effects of ingroup bias and
shared infrequency effects on the formation of illusory correlations about self-relevant
groups. Because perceivers should expect their own group to be more positive than other
groups, this prior expectation should lead perceivers to attend to positive information
about their own group, and discount negative, expectancy-incongruent information when
forming impressions of their own group.
Self-enhancement motives and ingroup favoritism may therefore exacerbate
illusory correlation effects that denigrate the minority group when the perceiver is a
member of the majority group. For instance, if the less frequent behaviors in question are
negative, an illusory correlation may be expected such that negative behaviors are unduly
associated with the minority group. If the perceiver is a member of the majority group,
this cognitive bias may combine with a bias towards the majority ingroup and increase
the perception of covariation between the minority group and negative behaviors.
However, when the perceiver is a member of the minority group and these motivational
factors are in conflict with the expected shared infrequency-based illusory correlation
effects, the motivational factors could outweigh the cognitive effects of shared
infrequency. Thus, minority group members’ desire to view their own group favorably
might be expected to lead to no illusory correlation effects, or an illusory correlation in
favor of the minority group.
Participants were assigned either to a control condition in which they were not
members of the target groups, or to experimental conditions in which participants were

27
told they were members of the majority or minority target groups, which purportedly
represented two different personality types. Half the participants read behavior
statements in which the more frequent behaviors were positive, and half read statements
in which negative behaviors were more frequent. Schaller and Maass predicted illusory
correlation effects on the attribution and frequency estimation tasks in the control group
and experimental conditions in which shared infrequency and ingroup bias would predict
similar outcomes. Thus, minority group members in the desirable-infrequent condition
and majority group members in the undesirable-infrequent condition were expected to
overattribute infrequent behaviors to the minority group because these perceived
correlations would make participants' own group appear more positive. In contrast,
illusory correlation effects were expected to be attenuated under conditions of conflict
between shared infrequency and ingroup bias. That is, minority group members in the
undesirable-infrequent condition and majority group members in the desirable-infrequent
condition should show less evidence of illusory correlation because their motivation to
view their own group favorably would be at odds with the overestimation of these
infrequent behaviors in the minority group (Schaller & Maass, 1989).
Whereas illusory correlation effects were expected on the attribution and
frequency estimation tasks under some conditions in the experimental groups,
participants who were assigned to the target groups were expected to rate their own group
more favorably than the other group, regardless of condition. These more favorable
evaluations of the ingroup were expected to be formed at the time of assignment into a
group, and were not expected to be dependent on the presentation of behaviors.
As expected, they found that illusory correlation effects on group attributions and
frequency estimations were significantly lower in the conditions in which ingroup bias
and shared infrequency effects were contradictory. However, they also found a reduction
in illusory correlation effects in the other experimental conditions compared to the
control condition on the attribution task, although the differences were not significant.
Only on the frequency estimation task did minority group members in the desirable-
infrequent condition form the anticipated illusory correlation, but majority group

28
members in the undesirable-infrequent condition did not show the expected illusory
correlation effects. Participants also showed a tendency to evaluate their own group more
favorably than the outgroup, but these differences were significant only when desirable
behaviors were infrequent. Furthermore, differences in ratings of the ingroup and
outgroup were mediated by the illusory correlation that was formed (Schaller & Maass,
1989).
Thus, the hypotheses were partially supported. As expected, participants who
were members of the target groups developed weaker illusory correlations when ingroup
biases and shared infrequency effects were in conflict. However, they also showed
weaker illusory correlations when these two factors should have worked in concert.
Participants also showed a tendency to rate the ingroup more favorably than the outgroup,
but this effect did not appear to be driven by participants' initial categorization into a
group, but rather by the illusory correlations they formed from the data presented
(Schaller & Maass, 1989).
Schaller and Maass (1989) conducted a second study to investigate the possibility
that people were more accurate in remembering information about their own group, and
that the reduced illusory correlation effects found in the first study were due to increased
accuracy. They reasoned that because people expect their own group to be desirable,
encountering undesirable information about one's group would require the reconciliation
of this information with the favorable impression of the group. The assimilation of the
undesirable information with the prior positive expectation about the group requires more
effortful processing, which should make that information more accessible for later recall
(e.g., Hastie, 1980; Wyer & Gordon, 1982). Thus, although expectancy-inconsistent
information may be given less weight when attending to information about one's group,
therefore maintaining a positive image of the ingroup, the expectancy-inconsistent
information may be more easily recalled from memory because of the extra processing it
requires.
Schaller and Maass (1989) argued that enhanced cognitive availability of
expectancy-inconsistent information may have led to the lack of illusory correlation

29
effects on the attribution tasks in Study 1. Furthermore, they believed that attribution
tasks are more sensitive to recall accuracy than frequency estimation tasks because
frequency estimation tasks require only probabilistic estimations of the occurrence of
certain behaviors by the two groups and thus reflect overall group impressions.
Attribution tasks, on the other hand, should be more sensitive to variations in recall
accuracy.
The assumptions that group members were more accurate than non-members at
remembering group information, and that an attribution task would be more sensitive to
this difference were tested in Study 2. Group members' perceptions of illusory
correlation were compared to perceptions of a control group that was given instructions
to form an overall impression of the groups while the behaviors were being presented.
Thus, the control group, as well as the experimental group, were expected to use on-line
processing when forming group impressions. They expected that control participants
would perceive no correlation between group membership and behaviors, whereas
participants assigned to a target group would associate their own group with positive
behaviors on the frequency estimation task and show an evaluative preference for their
own group. However, on the group attribution task, group members were expected to be
more accurate than control group participants, especially for the undesirable behaviors.
Another possibility is that if undesirable behaviors were more accessible in memory than
desirable behaviors for group members, they might be expected to form an illusory
correlation in favor of the outgroup. That is, they might overestimate the association
between their own group and negative behaviors (Schaller & Maass, 1989).
As predicted, control participants did not perceive covariation between the groups
and behaviors on the frequency estimation task, but group members perceived a
correlation between their own group and positive behaviors. On the attribution task,
however, group members perceived less covariation between their own group and
positive behaviors than did control participants. Thus, on this task group members
perceived their own group less favorably than the control group did. Despite group
members' less favorable perception of their group on the attributions, however, their

30
evaluative ratings of the two groups showed a strong preference for their own group,
whereas control participants showed no differences in ratings of the two groups.
In sum, Schaller and Maass (1989) found that first, illusory correlation effects
were attenuated when perceivers were members of one of the target groups, particularly
when the expected illusory correlation would be in favor of the outgroup. Second, they
found that people recalled undesirable information, or information that was inconsistent
with their positive expectations for their own group, better than information that was
consistent with these expectations, and perceived correlations between their own group
and negative behaviors on the attribution task. Third, despite their enhanced recall of
undesirable behaviors, participants rated the ingroup more favorably than the outgroup.
Motivations leading to ingroup favoritism outweighed the potential effects of the highly
accessible negative information about their groups. Fourth, participants perceived a
correlation between their own group and positive behaviors on the frequency estimation
task, consistent with both on-line processing of the behaviors presented and ingroup
favoritism. Finally, the group attribution task and frequency estimation task typically
used in illusory correlation studies appear to tap different processes. Whereas
attributions reflect memory for the behaviors presented and are therefore more
susceptible to differences in recall, frequency estimation is based on an overall
impression of the group and therefore may not be as easily influenced by recall when
impressions are made on-line (see Figure 2).
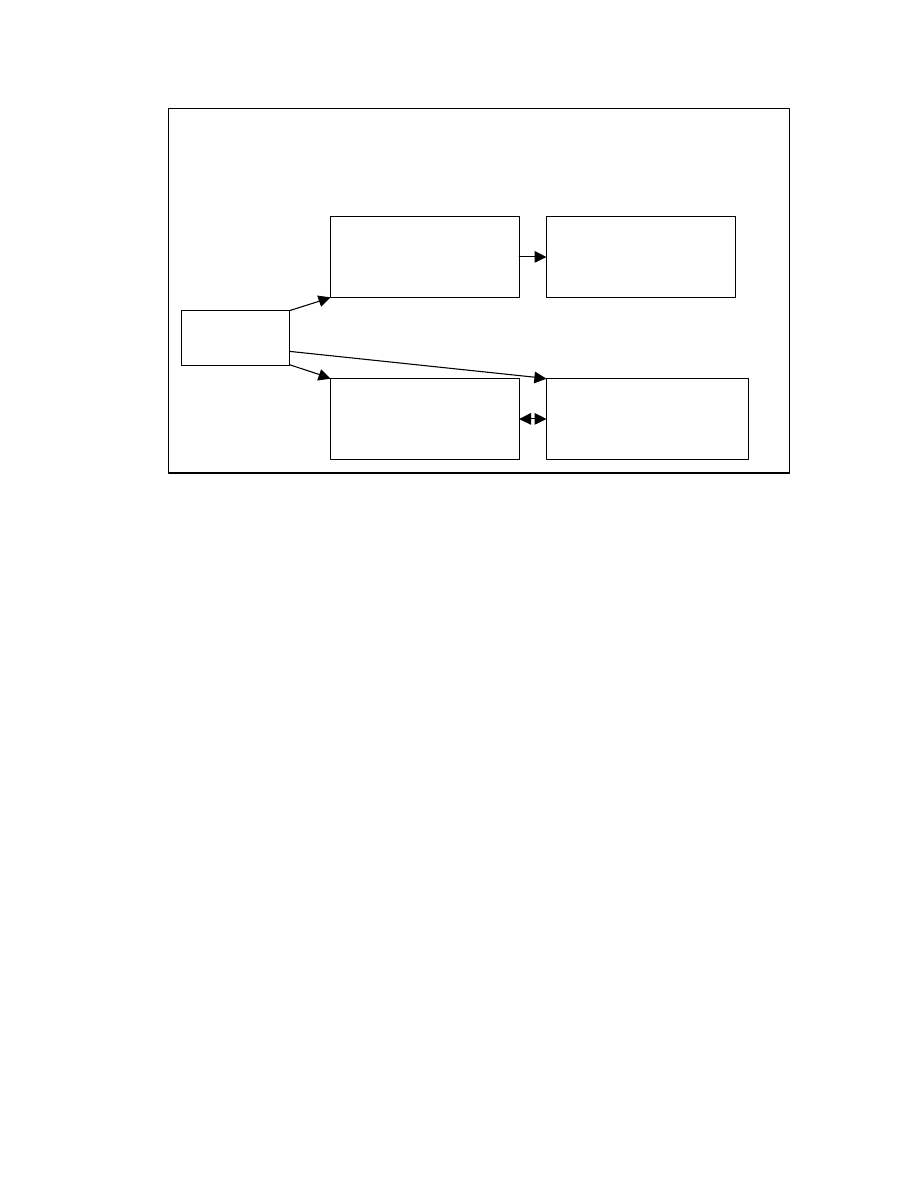
31
Summary. Sanbonmatsu, Shavitt et al.’s (1986) study and Schaller and Maass’
(1989) studies outline two important influences of self-involvement on perceptions of
illusory correlations. First, the self functions as a salient target, drawing more attention
to behaviors or characteristics relevant to the self than those concerning others. Second,
motivational forces related to the protection of self-esteem also affect illusory
correlations. When cognitive and motivational biases are in conflict, illusory correlation
effects may be attenuated such that one’s own group is not seen as less positive than
another group, or illusory correlation effects that favor the ingroup may be formed.
Illusory Correlation in Children:
Expectations and Related Developments
Despite two decades of research on illusory correlation in adults and the important
implications of this phenomenon for understanding the development of stereotypes,
research on the development of illusory correlation in children has just begun to emerge.
Furthermore, little is known about whether children might be susceptible to the same
biases as adults when performing these tasks. Some research on constructs related to
Figure 2
Schaller and Maass’ (1989) Model for the Effects of Group Membership on
Illusory Correlations Involving Self-Relevant Groups
Enhanced recall of
undesirable behaviors in
the ingroup
Cued-recall based
illusory correlations
favoring the outgroup
Group
membership
Relatively more
favorable impression of
the ingroup
Illusory correlations
favoring the outgroup on
frequency estimation task

32
judgments of base-rates for group behaviors, such as encoding of frequency information
(Hasher & Zacks, 1984) and schematic information processing (e.g., Bigler & Liben,
1990; Liben & Signorella, 1980; Signorella & Liben, 1984), suggests that few
developmental differences might be expected. However, other research (e.g., Jacobs,
Greenwald, & Osgood, 1995; Jacobs & Potenza, 1991; Shaklee & Paszek, 1985) suggests
that children’s ability to make the kinds of relative base-rate judgments required on
illusory correlation tasks might improve with age. Additionally, judgments of self-
relevant target groups may show developmental changes as children become more and
then less biased towards their own social groups (Brown, 1995). Because there has been
little research on children’s formation of illusory correlations, the development of related
skills will be reviewed, and expectations for the development of perception of illusory
correlation as it relates to the development of its related skills will be discussed. A model
indicating the various skills believed to be involved in the perception of illusory
correlation (with no self-relevance) is illustrated in Figure 4.
Expectations for Developmental Change in Distinctiveness-Based
Illusory Correlations
Perception of Frequency and Attention. Illusory correlation tasks require
participants to judge the frequency with which a certain class of behaviors occurred in
each of two social groups. Research on the perception of frequency indicates little
developmental change in this ability, and changes in illusory correlation effects that are
reliant upon the perception of frequency would therefore also not be expected to change
developmentally. Hasher and Zacks (1984) reviewed evidence that the encoding of
frequency information appears to be an automatic process that is present at all ages and
shows no developmental change. Across a variety of tasks, people are remarkably
accurate in judging the frequency with which stimuli were presented, even when
participants are not expecting a memory test (Zacks, Hasher, & Sanft, 1982) and when
using counting strategies would be extremely difficult (Alba, Chromiak, Hasher, & Attig,

33
1980). Judgments of frequency are insensitive to feedback and practice (Hasher &
Chromiak, 1977; Zacks et al., 1982), and show few individual differences, for example,
between children who are proficient learners and learning-disabled children (Goldstein,
Hasher, & Stein, 1983). Age differences in the ability to detect frequency also have not
been found. In one study, 2-, 4-, and 6-year-olds’ judgments of frequency were
compared to those of college students. All groups were able to detect frequency equally
well (Hasher & Chromiak, 1977). In another study, Kindergartners, first-, second-, and
third-graders were found to have equally good memory for frequencies (Hasher & Zacks,
1979). Even infants have been shown to be able to discriminate numerosities (Antell &
Keating, 1983; Starkey & Cooper, 1980). Thus, the encoding of information about the
frequency of occurrence for behaviors on illusory correlation tasks might be expected not
to change with age.
Interestingly, despite people’s remarkable and apparently automatic capacity to
encode frequency information, adults consistently overestimate the co-occurrence of
behaviors in a particular group on illusory correlation tasks. Chapman (1967) and
Hamilton and Gifford (1976) proposed that these biased judgments result because the
relative infrequency of the smaller class of behaviors and the smaller size of the minority
group make them more salient than the frequent behaviors and the majority group. This
salience increases the cognitive availability of the infrequent events, which, when paired
together, are judged to co-occur more often than they actually do. According to Hamilton
and Gifford, this increased availability of certain information is the mechanism
responsible for illusory correlation. The cognitive bias proposed by Chapman and
Hamilton and Gifford might be expected to be present at any age, and therefore to show
little if any developmental change. Thus, based on the lack of expected developmental
changes in perception of frequency and availability of distinctive information, few
developmental changes in illusory correlation might be expected. However, research on
other skills necessary for group perception has found improvement with age in these
skills, which might predict age-related changes in perceptions of illusory correlation.

34
Memory Developments. Perception of illusory correlations when the self is not a
member of a target group is largely memory-based, and appears to be based on the
enhanced encoding of minority-infrequent behaviors (Hamilton & Gifford, 1976;
McConnell et al., 1994a). The ability to encode and retrieve information is therefore
crucial to the perception of illusory correlations. Brainerd (1981) found developmental
changes in the likelihood that children would retrieve stored information to make
probabilistic judgments. Most types of memory show improvement with age, including
recall (e.g., Perlmutter, 1984), content-specific memory which improves as knowledge
increases (e.g., Bjorklund & Muir, 1988; Chi & Ceci, 1987), and working memory
capacity and transfer of information to long-term memory (e.g., Ornstein, Naus, &
Liberty, 1975). Children also show age-related improvement in the ability to attend to
stimuli for longer periods of time (Ruff & Lawson, 1990; Stodolsky, 1974), and to attend
only to task-relevant information (e.g., Strutt, Anderson, & Well, 1975).
It is possible that these memory developments could influence biases in
judgments of covariation between groups and behaviors. Age differences in what
children choose to attend to may result in different patterns of performance on illusory
correlation tasks. For instance, if younger children attend to information that is irrelevant
to the goal of forming impressions of how group members behave, their judgments of the
groups may look quite different from those of older children and adults. The ability to
encode and recall behaviors is critical if one is to notice that certain behaviors have
occurred less often than others. If younger children have difficulty storing information or
recalling the behaviors that they have encountered, the infrequent behaviors may seem
less salient than they do to adults and older children. Finally, increased recall of
infrequent behaviors is believed to lead to the overestimation of these behaviors in the
minority group. However, if younger children cannot easily recall much of the
information presented, they may not show the typical perceptions of covariation. If
younger children are less able to encode group-behavior associations, or to store or recall
this information, then group perceptions may appear random and highly variable,

35
whereas older children may show more consistent judgments and therefore more
evidence of illusory correlation.
On the other hand, Mullen and Johnson’s (1990) meta-analytic review showed
that illusory correlation effects increased with memory load. Because older children’s
memory is superior to that of younger children, the same amount of information would
represent less of a memory load for the older children. Assuming shared infrequency did
cause minority-infrequent behaviors to become more salient for children, older children
could actually show less susceptibility to illusory correlation than younger children.
Developmental Changes in Estimation and Use of Base-Rates. Research has
shown that children’s ability to estimate and use base-rates, which are necessary skills in
judging covariation between groups and their characteristics, increases with age (Jacobs,
Greenwald, & Osgood, 1995; Jacobs & Potenza, 1991). Jacobs et al. (1995) examined
first-, third-, and sixth-graders’ accuracy in estimating the base-rates for behaviors and
attitudes among their classmates. Children reported how often they engaged in certain
behaviors (e.g., ride a bike) and how much they liked particular activities (e.g., going to
movies), and they also estimated how often other children in their class engaged in the
same behaviors and liked the same activities. The self-reports were used to determine
mean base-rates for the class and were compared to children’s estimations of the base-
rates.
They found that children’s accuracy in estimating base-rates increased with age
for both behavioral and attitudinal items. Correspondence between children’s own
attitudes and behaviors and their beliefs about others’ attitudes and behaviors also
increased with age. Younger children’s estimates of base-rates for others’ attitudes and
behaviors were more variable than older children’s estimates, as were their actual reports
of these items, which could have contributed to their decreased accuracy compared to
older children (Jacobs et al., 1995).
Jacobs and Potenza (1991) investigated first-, third-, and sixth-graders’ use of
base-rates and judgment heuristics in making categorical predictions. Scenarios were
used in which only base-rate information or base-rates as well as individuating

36
information was given. In the base-rate only conditions, information about the base-rate
for two types of object or social groups was given (e.g., Two girls took swimming lessons
and four girls took piano lessons.). Participants were asked to judge the likelihood that a
person or object would be in each category (Do you think Julie took piano lessons or
swimming lessons?). Thus, the only logical method of judgment was using the given
base-rates to determine that the target object or person would most likely belong to the
more frequently occurring object or social group. In another condition, base-rates as well
as individuating information was given (e.g., Ten girls are trying out to be cheerleaders
and 20 girls are trying out for the band. Juanita is very popular and pretty. She is always
telling jokes and loves to be around people.), and participants were asked to judge which
group the object or individual most likely belonged to (Is Juanita trying out to be
cheerleader or for the band?). Although correct judgments would be based on the base-
rate information, individuating information, or stereotype-relevant information about the
target that could be used to classify them into a social group, could also be used. Finally,
participants’ rationales for their choices were collected.
In the object scenarios in which only base-rate information was given, no age
differences were found in children’s use of base-rates to make judgments. When
individuating information and base-rates were given in the object scenarios, however, the
use of base-rates increased with age. Younger children were more likely to falsely base
their judgments on the individuating information. In the social scenarios, the use of base-
rates increased with age when only base-rate information was given. In contrast, when
both base-rates and individuating information were given, the use of base-rates to make
judgments decreased with age as the use of individuating information increased. Thus, in
the social domain, younger children were less able to use either type of information to
make judgments than were older children. Indeed, examination of the consistency
between children’s choices and their rationales for those choices indicated that younger
children were less consistent in their choices, using idiosyncratic strategies and personal
preferences rather than a comparison of the numbers to make decisions (Jacobs &
Potenza, 1991).

37
Children’s increasing adequacy at estimating base-rates and using base-rate
information to make predictions about category membership have important implications
for their ability to judge social groups on an illusory correlation task. If young children
are highly inaccurate at determining base-rates for behaviors and attitudes from their
environment, they may be equally inaccurate at attending to the base-rate information
about group behaviors when it is given during an illusory correlation study. Their
performance on these tasks may appear highly variable and unsystematic, as it did in
Jacobs et al.’s (1995) study. In addition, if they are less able to use base-rates to make
judgments, their evaluations of groups may appear different from the evaluative patterns
found in adults because the young children may be basing their evaluations on something
other than the perceived base-rates. For example, they might be expected not to evaluate
minority groups more negatively than majority groups based on a perceived correlation
between minority groups and negative behaviors, but might show more variability in their
evaluations of minority groups. Furthermore, these evaluations might not correspond to
their estimations of base-rates for behaviors in the two groups because they may not use
this information to determine their evaluations.
Developmental Changes in Judgment of Covariation. Research has also found
developmental trends in children’s ability to judge covariation from frequency
information (e.g., Shaklee & Mims, 1981; Shaklee & Paszek, 1985). Although strategy
use in judging covariation on illusory correlation tasks has not been examined per se,
several strategies for judging covariation in general, some of which can lead to false
estimates of covariation, have been identified (Mullen & Johnson, 1990). Two possible
strategies are to simply consider the size of Cell A or Cell D (see Figure 3; Nisbett &
Ross, 1980; Rothbart, 1981; Smedslund, 1963). Using the Cell A strategy, covariation
judgments should increase as the size of Cell A increases, whereas the Cell D strategy
should yield a decrease in covariation estimates as the size of Cell D increases. Another
common strategy is the comparison of Cell A and Cell B or (A - B). This strategy leads
to increased covariation judgments as the size of Cell A diverges from the size of Cell B
(Ward & Jenkins, 1965). The sum-of-diagonals strategy (A + D) – (B + D) is a

38
comparison of the number of confirming and disconfirming cases (Ward and Jenkins,
1965). Using this strategy, judgments of covariation should increase as the number of
confirming cases (A and D) increases relative to the number of disconfirming cases (B
and D). Finally, the correct strategy is a comparison of conditional probabilities of an
event, or A/(A+C) versus B/(B+D). This strategy takes into account the relative base-
rates for groups of different sizes, and should lead to an accurate estimate of covariation.
Research has shown that while even many adults fail to employ the conditional
probabilities strategy in their covariation judgments, children are even less likely to do
so. Shaklee and Paszek (1985) asked second-, third-, and fourth-graders to judge whether
two events co-occurred. For example, children were given frequencies of healthy plants
that received fertilizer (cell A), unhealthy plants that were given fertilizer (cell B),
healthy plants that were not given fertilizer (cell C), and unhealthy plants that received no
fertilizer (cell D). The children were asked to determine whether sick plants were more
likely to get better if they did nor did not receive fertilizer, or whether there would be no
difference. To answer the questions, children had to determine whether plants being
healthy or unhealthy covaried with whether or not they had been given fertilizer.
Shaklee and Paszek (1985) found that children’s strategies for judging covariation
became more complex with age. In particular, the use of the Cell A versus Cell B
strategy increased, and use of simpler strategies such as Cell A or response biases, in
which frequency information was not considered at all, decreased. Use of the sum-of-
diagonals strategy also increased slightly with age, although this strategy was used only
infrequently. Comparison of conditional probabilities was not used by any of the
Figure 3
Contingency Table for Covariation Judgments
Majority Group
Minority Group
Frequent Behaviors
A
B
Infrequent Behaviors
C
D

39
children. However, even many of the youngest children used a comparison of
frequencies to determine covariation. In a second study, first-, and second-graders were
able to use even the most complex strategy of comparing conditional probabilities after
receiving training, although children did not use this strategy spontaneously.
The fact that young children were able to make covariation judgments, and their
common use of frequency comparisons to make these judgments suggest that children
might indeed be susceptible to illusory correlation effects. The most common judgment
strategy found by Shaklee and Paszek (1985) was a comparison of Cell A and Cell B.
When estimating the frequency of occurrence for behaviors on illusory correlation tasks,
comparing the frequency of a certain type of behavior (e.g., desirable behaviors) in
majority and minority groups might be expected to result in a positive association
between the majority group and the more frequent behaviors, or a negative association
between the minority group and frequent behaviors, because these behaviors occurred
more frequently in the majority group. Thus, children might be susceptible to a bias
when judging the number of positive and negative behaviors performed by majority and
minority group members. However, given that children are likely to use more complex
strategies as they become older, illusory correlations formed by older children might
appear somewhat different than those formed by younger children.
Summary. Hamilton and Gifford (1976) proposed that the basic mechanism
responsible for illusory correlation is the increased cognitive availability of certain group-
behavior associations that are made distinctive by their shared infrequency. Because this
information is more available in memory, it is overestimated when making judgments
about groups. This mechanism may be expected to be present at any age. Indeed,
perception of frequency, which can be biased if some frequency information is more
available than other information, appears to be an automatic process that does not change
with age.
However, the formation of illusory correlations in group perception involves
processes other than the perception of frequency, and developmental changes in these
related skills may lead to developmental increases in susceptibility to illusory

40
correlations. Such skills include the ability to attend to only task relevant information,
and to encode and retrieve relevant information, all of which increase with age. The
estimation of base-rates is also necessary in perceiving illusory correlations. Children’s
ability to estimate and use base-rates increases with age, although their use of base-rates
in social perception decreases with age if individuating information is available. Finally,
children must be able to judge covariation between two types of stimuli to perceive
illusory correlations. Even very young children are capable of judging covariation,
suggesting that they may also be susceptible to illusory correlation, but their use of
complex strategies in judging covariation increases with age.
Empirical Evidence of Distinctiveness-Based Illusory Correlations in Children
Only one study has addressed the question of whether children form illusory
correlations upon learning information about unknown majority and minority groups, and
whether there are developmental trends in susceptibility to illusory correlation. Primi and
Agnoli (1998) examined children’s perceptions of novel social groups of which they were
not members in a paradigm similar to that used by Hamilton and Gifford (1976). First-
through fifth-graders were shown drawings of 15 positive behaviors and 6 negative
behaviors performed by members of a majority group, called the Pines, or a minority
group, called the Firs. The majority group was twice as large as the minority group. The
children completed a group evaluation task in which they were asked to rate each of the
groups on 20 attributes. They then completed a group attribution task in which they were
shown the drawing of the behaviors with the group member omitted, and children were
asked to determine which group had performed the behavior by sorting the drawings into
boxes labeled Firs and Pines. Finally, children were given two stacks of cards, with each
card representing a group member in the Firs and Pines groups. The children estimated
the frequency of occurrence for negative behaviors in each group by removing the
number of cards corresponding to the number of group members who performed positive
and negative behaviors.

41
Primi and Agnoli (1998) reasoned that if illusory correlations are due to an
information processing bias in which shared infrequency makes minority-infrequent
behaviors more salient, then children should form illusory correlations similar to those
found in adults, and these correlations should be similar across ages. To examine
whether illusory correlation effects occurred on the group attribution task, phi
coefficients were calculated to determine the degree of perceived association between
group membership and behavior type. They found that children overattributed negative
behaviors to the minority group, and underattributed them to the majority group.
However, children also underattributed positive behaviors to the majority group and
overattributed them to the minority group. These effects were similar for all age groups,
and phi coefficients were not significantly above zero, indicating that there was no
correlation perceived between group membership and behavior type.
Children’s frequency estimates showed that they accurately estimated the number
of majority group members who performed negative behaviors, but overestimated the
number of minority group members who engaged in negative behaviors. Phi coefficients
for this task were significantly above zero for third and fourth graders only, indicating
that children of these ages perceived a correlation between the minority group and
negative behaviors. The trend of overestimation of negative behaviors by the minority
group was present in all age groups, although it declined with age, with older children’s
estimations of negative behaviors in the minority group being more accurate. On the
evaluation task, children rated the majority group more positively than the minority group
on 13 of the 20 adjectives used (Primi & Agnoli, 1998).
In a second study, Primi and Agnoli (1998) replicated Study 1 using first-, third-,
and fifth-graders, and found the same results. Again, children overattributed both
negative and positive behaviors to the minority group, and underattributed both types of
behaviors to the majority group. Children overestimated the frequency of negative
behaviors in the minority group, but phi coefficients for this effect were only significantly
above zero for third- and fifth-graders. However, variability was higher among first-
graders’ responses than among the third- and fifth-graders, which may have obscured any

42
effects in the youngest age group. Finally, the majority group was evaluated more
positively than the minority group.
To further investigate Primi and Agnoli’s (1998) belief that children’s illusory
correlations reflected a cognitive bias, they conducted a third study on illusory correlation
effects using nonsocial stimuli. Majority and minority groups were composed of squares
and triangles, respectively. The shapes appeared in red more frequently than in green. If
illusory correlations are caused simply by an information processing bias, children should
be expected to overrepresent the number of green triangles in comparison to red triangles
or to red or green squares. The results were similar to those of Study 1 and Study 2.
First-, third-, and fifth-graders overattributed both the frequent and infrequent colors to
the minority (triangles) group, and overattributed both colors to the majority (squares)
group. Children overestimated the number of green triangles (minority-infrequent
association), but the variability in responses was lower on this task than on the social
task, and phi coefficients were above zero for all age groups.
Thus, children’s performance on these tasks did not exactly parallel adults’
performance, and younger children did respond somewhat differently than older children.
On the group attribution task, children did not show evidence of forming illusory
correlations similar to those formed by adults. Children were relatively inaccurate in
attributing the behaviors to groups. Furthermore, they did not simply overrepresent the
number of negative behaviors performed by the minority group on the frequency
estimation task, as is typically the case with adults; rather, it appears that they may have
tried to equalize the number of positive and negative behaviors across the two groups,
especially in the younger age groups, resulting in the appearance of an illusory
correlation in favor of the majority group based on mean frequency estimates. Despite
younger children’s greater overattribution of negative behaviors to the minority group,
phi coefficients were significantly above zero only for older ages, reflecting the large
variability in younger children’s responses. Recall for group membership on this task
was also near chance. However, children were not told prior to beginning the tasks that
one group was numerically larger than the other, or that they would be asked to

43
remember which group had performed each behavior. These missing instructions, which
are typically given in adult tasks, may have contributed to children’s poor recall and their
overassignment of both positive and negative behaviors to the minority group.
Children’s evaluations of the majority group were more positive than their
evaluations of the minority group, as is usually seen in adult ratings on similar tasks.
This effect could be attributable to children’s inflated estimations of the base-rate for
negative behaviors in the minority group, which, as in the case of adults, could have led
them to view the minority group more negatively. However, because their recall of
behaviors on the attribution task was so poor, and their performance on both the
attributions and the frequency estimation tasks could reflect a misunderstanding of the
differing group sizes, it is not entirely clear that their more positive evaluation of the
majority group is due to an illusory correlation between the minority group and negative
behaviors. Another possible explanation that is that children may have an a priori
expectation that smaller groups are more negative than larger groups. Although this did
not appear to be a viable explanation for adult findings (Hamilton & Gifford, 1976), it
cannot be discounted for the children in this study. First, college students participating in
the adult studies may have developed beliefs that they should not discriminate against
minority groups, and that stereotypes about minority groups are often false and should be
discounted, but children may not share this value. Second, the children in this study were
Italian, whereas most of the adult research has involved American students. Possible
cultural and age differences in the valuation of minority groups and motivations to avoid
discrimination make it impossible to rule out the possibility that children may simply
expect that minority groups will behave more negatively than majority groups.
Expectations for Illusory Correlations when the Self is a Member of a Target Group
The previous sections discussed possible developmental changes in children’s
perceptions of groups when they are not a member of one of those groups. The following

44
section will describe developmental changes in factors related to perception of the self in
groups.
Prior Expectations and Schematic Information Processing. When the self is a
member of one of the target groups used in illusory correlation tasks, new restraints are
placed on processing of group information. Because people are likely to expect their own
group to be positive due to self-enhancement motives, this expectation should bias
processing of information about the groups as the new information is encountered. Thus,
perception of self-relevant groups may be similar to perception of nonself-relevant target
groups about which the perceiver has prior expectations.
McArthur & Friedman (1980) demonstrated that adults’ expectations about
groups (e.g., stereotypes) could override the effects of shared distinctiveness in the
formation of illusory correlations. Adults ascribed characteristics to the target groups
such that their stereotyped beliefs about the groups were upheld, regardless of the actual
information given about the groups. Even very young children show this type of
schematic processing of stereotyped information, and children might therefore be
expected to perceive expectation-based illusory correlations at a young age.
Numerous studies have shown that children are susceptible to information
processing biases associated with group expectations. For example, children as young as
four and five years of age exhibit better memory for information that is consistent with
racial (Bigler & Liben, 1993) and gender stereotypes (Bigler & Liben, 1990; Martin &
Halverson, 1983; Liben & Signorella, 1980; Signorella & Liben, 1984) than for
counterstereotypical information. Children are also more likely to reconstruct
counterstereotypical information such that it becomes consistent with stereotypes than
they are to reconstruct stereotype-consistent information (Bigler & Liben, 1990; Bigler &
Liben, 1992).
Martin and Halverson (1981) argued that illusory correlations may be formed
through children’s schematic processing of stereotyped information. Just as shared
infrequency may make some novel associations more salient than other associations,
stereotypes are believed to direct attention towards stereotype-consistent information,

45
making this information more salient and thus more cognitively available. For this
reason, illusory correlations may be formed to preserve preconceived beliefs about
characteristics associated with particular groups.
Schematic processing was found to be similar at all the ages tested in the
previously cited studies. However, some age-related changes in the use of expectations
in processing stereotyped information on illusory correlation tasks might be expected.
Stereotyping has been found to follow a curvilinear pattern of development. The
endorsement of gender stereotypes increases sharply between ages four and six, and then
begins to decline throughout the elementary school and adolescent years (Trautner,
Helbing, Sahm, & Lohaus, 1988; see Huston, 1983 for review). Older children show
more flexibility in their beliefs about what is appropriate for women and men, and benefit
more from interventions to reduce stereotyping (Bigler & Liben, 1990). Thus, the
anticipated effect of prior expectations on illusory correlation might actually be greater
for younger children’s perceptions than for older children’s perceptions.
On the other hand, knowledge about stereotypes and other types of expectations
about groups must develop over time. For instance, although children are quite
knowledgeable about gender stereotypes by age three (e.g., Blakemore, LaRue, &
Olejnik, 1978; Edelbrock & Sugawara, 1979; Kuhn, Nash, & Brucken, 1978), their
knowledge continues to accrue throughout adolescence (Huston, 1983). Logically,
changes in expectations should lead to differences in perceptions based on these
expectations.
Barrett, Abdi, Murphy, and Gallagher (1993) examined the role of children’s
changing expectations on judgments of category membership. First- and fourth-graders
were taught features associated with two novel bird categories. The categories were
defined by three consistent features that occurred only in one of the categories, and three
random features that occurred in both categories. Two of the consistent features were
linked by an intuitive theory (has a big brain and can remember all the places it has found
food, or has a small brain and can remember only the last place it found food). However,
only three of the consistent features appeared in any given exemplar; thus, the theory-

46
correlated features did not co-occur more often than the theory-neutral consistent
features. Barrett et al. posited that whereas even young children associate the brain with
memory (Johnson & Wellman, 1982), older children are more likely to infer a connection
between physical properties of the brain (i.e., size) and cognitive ability (i.e., memory for
places where the bird has found food) (Crider, 1981). Older children were therefore
expected to perceive the theory-correlated features as a basis for category membership,
and to use theory-based links when classifying ambiguous stimuli into the two categories.
Following familiarization of the novel bird categories, children were presented
with new exemplars that either preserved the theory-based correlation between brain size
and memory (i.e., had a large brain and good memory, or had a small brain and bad
memory), or violated this correlation (i.e., had a small brain and good memory, or had a
large brain and bad memory). Both types of exemplars possessed the same number of
nontheory-related characteristics. Thus, the only difference was whether they preserved
or violated the expected correlation (Barrett et al., 1993).
Barrett et al. (1993) reasoned that the exemplars that violated the correlation
should be more difficult to classify than those that preserved the correlation. They found
that fourth-graders’ performance on the classification task, but not first-graders’
performance, was significantly above chance. As expected, children classified more
items that preserved the theory-based correlation than items that violated the correlation.
However, this effect did not vary by age, perhaps because the first-graders had a simpler
intuitive theory about the relationship between brain size and memory and were able to
use this expectation to facilitate their classification of the correlated items. Thus, Barrett
et al. demonstrated that children perceived a relationship between category features that
were expected to be associated by an intuitive theory, although these features did not
actually co-occur more often than other types of features, and they used this expectation
to determine the category membership of new exemplars.
One study has directly examined the formation of expectancy-based illusory
correlations in children. Susskind (1997) showed Kindergarten, second-, and fourth-
grade children drawings of women and men engaged in gender stereotype-consistent or

47
gender-neutral activities. Although the stereotyped and neutral pictures occurred with the
same frequency, Susskind expected that children would overestimate the frequency of
occurrence for the stereotyped pictures. He found that second- and fourth-graders did
indeed overestimate the frequency of the stereotype-consistent behaviors compared to the
neutral pictures, but Kindergartners did not perceive a difference between the frequency
of the stereotyped and neutral pictures, perhaps because their gender stereotype
knowledge was not as extensive as the older children’s knowledge.
In a second study, Susskind (1997) presented second- and fourth-graders with
women and men performing stereotype-consistent, neutral, or stereotype-inconsistent
behaviors, and varied the frequency with which the sexes occurred. That is, for half the
children, women performed the behaviors twice as often as men, and the other half of the
children saw men engaged in the behaviors twice as often as women. Susskind predicted
that children would again overestimate the relationship between gender and behaviors for
the stereotype-consistent pictures, but not for the stereotype-inconsistent and neutral
behaviors. As expected, both second- and fourth-graders estimated the frequency of the
stereotype-consistent behaviors to be higher than the inconsistent and neutral behaviors,
and this effect did not differ for the high- and low-frequency gender conditions. Thus,
children’s perceptions were influenced by their gender stereotypes such that they
perceived an illusory correlation between gender and stereotype-consistent behaviors,
although they were relatively accurate at judging the number of women and men
presented across the two gender-frequency conditions. These results are consistent with
Jacobs and Potenza’s (1991) findings that although children’s ability to use base-rates in
making social judgments increases with age, children prefer to use stereotype-relevant
individuating information about targets with increasing age.
Developmental Changes in Intergroup Discrimination. Related to expectation-
based illusory correlations is the case in which a participant is asked to make judgments
about a group to which the participant belongs. In such situations motivational factors
leading to ingroup favoritism can result in more positive perceptions of one’s own group
than of other groups, even if the perceiver is presented with information that should lead

48
to the opposite effect. Given that very young children have been shown to be susceptible
to information processing biases due to stereotypes and group expectations, young
children might also be predicted to show more favorable perceptions of the ingroup on
illusory correlation tasks.
However, children’s tendencies to favor their own group follow a developmental
course that is consistent across various types of social groups. Specifically, children’s
ingroup favoritism is usually found to peak between the ages of five and eight (Brown,
1995). For example, one study found that British children distributed more sweets to
unknown children of their own ethnic group than to children of other ethnic groups, and
also attributed more negative traits to the outgroups. The discrepancies between ingroup
and outgroup perceptions were more marked in the 7- to 8-year age group than among the
9- to 10-year-olds (Davey, 1983). A study of intergroup discrimination between Dutch-
speaking and French-speaking groups in Belgium found that children evaluated their own
group more favorably and distributed more rewards to their own group than to the
outgroup, and this effect was more pronounced among the 8-year-olds than among the 6-
to 7-year-olds or the 9- to 10-year-olds (van Avermaet & McLintock, 1988). Powlishta,
Serbin, Doyle, and White (1994) also found that among English-speaking Canadian
children, bias against French-Canadians and obese people, and against people of the other
sex peaked between ages five and nine.
Gender bias is also quite strong during this time, especially among girls. For
example, Yee and Brown (1994) showed children collages of differing attractiveness
purportedly constructed by a team of girls or boys. Children allocated prizes to the teams
for the quality of the collages. The boys tended to reward the team that had allegedly
constructed the more attractive collage, whereas the girls rewarded the team of girls,
regardless of whether they had allegedly constructed the good or poor quality collage.
Zalk and Katz (1978) also found that girls were more likely than boys to attribute
undesirable behaviors to their own gender group and undesirable behaviors to the other
gender group, and that ingroup bias was stronger among 7-year-olds than among 10-year-
olds.

49
Ingroup favoritism is not limited to real social groups. In an adaptation of the
minimal groups paradigm in which children were assigned to groups based on their
preferences for artists, Vaughan, Tajfel, and Williams (1981) asked children to allocate
money to the two minimal groups. They found that children gave more money to their
own group than to the outgroup, particularly when this practice would establish a relative
discrepancy between the groups.
Yee and Brown (1992) found a similar effect when they examined children’s
perceptions of their teams’ performance in an egg-and-spoon race. Children were given a
practice session at running with an egg and spoon and were given bogus feedback
regarding their performance. The children were placed on a team of unknown children
who were ostensibly expert egg-and-spoon runners or who were less good runners, and
they were asked to rate how good each teams’ performance was likely to be in a race. As
would be expected, children assigned to the high-performance condition believed the
high-performance team would perform better than the low-performance team. In
contrast, three- and nine-year olds in the low-performance group rated the outgroup as
likely to out-perform their own group. Seven-year-olds rated the performance of the two
teams similarly, although they judged the high-performance team to be slightly better
than their own low-performance team. However, five-year olds in this condition believed
their own low-performance team would do better than the high-performance team.
Klaczynski and his colleagues have examined the influence of self-serving biases
on reasoning. They have found that adolescents’ and adults’ personal beliefs bias their
scientific reasoning, and that the intrusion of self-serving biases does not change with
age. For example, when asked to detect threats to internal validity of evidence relevant to
religious beliefs, adolescents were less likely to detect threats to internal validity if
detection would discredit their own beliefs (Klaczynski & Gordon, 1996). Thus, they
showed evidence of self-serving biases that protected their belief systems. Furthermore,
reasoning about evidence that is consistent with one’s prior beliefs tends to be more
strongly biased by personal beliefs, whereas belief-incongruent evidence tends to be

50
subject to deeper processing and therefore more sophisticated scientific reasoning
(Klaczinsky & Fauth, 1997; Klaczinsky, Gordon, & Fauth, 1997).
In sum, children clearly show a bias towards their own group, even when group
assignment is arbitrary and children have had little time to attempt to ascertain how the
groups might differ. Children’s ingroup bias also tends to increase and then peak around
five- to eight-years of age, and then declines. The ingroup favoritism seen in children
may also be expected to manifest itself in the formation of illusory correlations. On
illusory correlation tasks in which children are assigned to one of the target groups,
children, like adults, might be expected to perceive their own group more favorably than
the outgroup, even when they are assigned to a minority group in which negative
behaviors are distinctive, and the effects of shared infrequency would otherwise result in
a more negative perception of the minority group.
Summary. The tendency to view one’s own group more positively than other
groups may serve as a prior expectation that will bias perception of group-relevant
information on illusory correlation tasks such that the perceiver discounts negative
information about her own group when forming group impressions. Research on
schematic processing and theory-based reasoning has shown that even young children’s
perceptions are biased by their prior beliefs. The effects of prior expectations do not
appear to change with age, although the content of the biases does change as more
information is learned. However, research on intergroup discrimination has shown that
children’s ingroup favoritism does tend to peak around the ages of 5-8 years, and then
declines. Thus, the decrease in ingroup favoritism among older children may lead them
to show less bias based on intergroup discrimination in their group perceptions on
illusory correlation tasks.
Expectations for Developmental Changes in the Formation of Illusory Correlations
The proposed mechanism leading to the formation of nonself-relevant illusory
correlations is the distinctiveness, or increased cognitive accessibility, of certain group-

51
behavior associations. These associations may become distinctive because the shared
infrequency of the minority group and infrequent behaviors make these minority-
infrequent associations particularly salient. The ability to perceive relative frequency,
and the enhanced cognitive accessibility of particular types of information leading to the
overestimation of this information is not expected to change with age (Hasher & Zacks,
1984).
However, given the developmental changes in other skills that are required for the
formation of illusory correlations, some age-related changes in the perception of illusory
correlation might be expected. Please refer to the hypothesized processing steps involved
in illusory correlation illustrated in Figure 4. First, children must encode the group-
behavior associations that have been presented, and to perceive the difference in
frequency between the frequent and infrequent behaviors in order to notice the relative
infrequency of the minority-infrequent behaviors. The perception of the relative
infrequency of the minority-infrequent behaviors should cause these behaviors to become
distinctive in memory at the time of encoding. Hasher and Zacks (1984) reviewed
evidence showing that children of all ages are quite adept at perceiving frequency, and
that this ability appears to be automatic and possibly innate. The perception of distinctive
behaviors should therefore not differ with age. However, older children’s increased
ability to attend to task-relevant stimuli (Strutt, Anderson, & Well, 1975) and to encode
and store information in memory (Ornstein, Naus, & Liberty, 1975) should make them
better able to encode the group-behavior associations at Level 1. Thus, older children
might be more likely to encode the minority-infrequent behaviors for later retrieval.
The second processing step is to recall the group-behavior associations. If all
associations were recalled correctly, no illusory correlation would be formed because the
correct number of positive and negative behaviors would be associated with each group.
However, even adults do not correctly recall all this information, and are subject to
information processing biases in the attempt to determine which group performed certain
positive and negative behaviors. At this level, older children may be able to recall more
associations, leading to more consistent judgments of the groups.

52
In Level 3, children must determine whether positive and negative behaviors were
associated with the majority or minority group for group-behavior associations that were
not recalled. If minority-infrequent behaviors are more accessible at this point, illusory
correlations should be formed on the attribution task and frequency estimation task. If
older children remembered more of these distinctive behaviors, then their group
perceptions should likewise be more strongly influenced by them.
Estimation of base-rates and perceptions of covariation should also influence
perceptions of illusory correlation at this level. Older children’s use of more
sophisticated strategies for judging covariation (Shaklee & Paszek, 1985) may aid them
in making more consistent judgments about correlations between majority and minority
group membership and positive and negative behaviors. Perhaps more importantly,
children must be able to estimate base-rates for positive and negative behaviors in the two
groups to complete the attribution task and, in particular, the frequency estimation task.
Older children are more capable of estimating base-rates than younger children (Jacobs et
al., 1995), and this skill, in addition to their ability to use more complex strategies for
judging covariation and improved memory, may enable older children to make more
consistent judgments on the illusory correlation tasks, whereas younger children’s
judgments are likely to show more inconsistency and variability. If children are
susceptible to the same perceptual biases that lead to illusory correlations in adults, and
older children’s judgments on illusory correlation tasks are more consistent than younger
children’s judgments, then the biases that cause illusory correlations should be more
apparent in older children. That is, as children’s ability to judge covariation and estimate
base-rates, and memory for information improves, their judgments of group-behavior
associations should become more accurate. However, if older children do show a bias
towards overestimated minority-infrequent information, this bias should become
especially apparent in light of their increased accuracy in judging other types of group-
behavior associations.

53
Model of Processing Steps in the Perception of Shared Infrequency-Based
Recall group-behavior associations
Make “best guess” as to which group
positive and negative behaviors
associated with
Possible random
responses, no
consistent illusory
correlation effects
If positive behaviors are frequent,
minority group will be evaluated more
negatively
If negative behaviors are frequent,
minority group will be evaluated more
positively
Encode group-behavior associations
Are all group-behavior associations recalled correctly?
Are minority-infrequent behaviors more accessible?
Infrequent behaviors
will be overattributed to
minority group on
Attribution task
Overestimate frequency
of minority-infrequent
behaviors on Frequency
Estimation task

54
Finally, evaluations are made based on the perceived correlation between group
membership and behavior type. The use of base-rates becomes especially important at
this level because differences in evaluations of the majority and minority groups should
be based on a comparison of the base-rates for positive and negative behaviors in the two
groups. At Level 4, then, older children’s greater ability to use base-rates (Jacobs &
Potenza, 1991) should lead to more consistent evaluations of the majority and minority
groups that are based on the degree of perceived association between group membership
and behavior type.
When the self is a member of one of the target groups, motivational impulses to
protect self-esteem are introduced. Specifically, children should be motivated to judge
their own group more favorably than the other group. This ingroup favoritism should
then lead to biased perceptions of the group such that own-group positive behaviors are
attended to more than negative behaviors in forming group impressions, and these
reasoning biases may not be different at different ages (Barrett et al., 1993; Bigler &
Liben, 1990; Bigler & Liben, 1992; Martin & Halverson, 1981; Klaczinsky & Fauth,
1997; Klaczinsky et al., 1997; Klaczinsky & Gordon, 1996). However, younger children
show more ingroup favoritism than older children (Brown, 1995), and their self-serving
biases in group perceptions may therefore be stronger than in older children.
Current Research
Three studies were designed to examine first, whether children are susceptible to
cognitive biases due to distinctiveness of infrequent information in their judgments of
majority and minority groups on illusory correlation tasks. Second, this research
investigated the relative effects of intergroup biases and cognitive biases on group
perceptions. Finally, developmental trends in cognitive and motivational biases in the
formation of illusory correlations were examined.
Study 1 investigated children’s susceptibility to illusory correlations in
perceptions of novel social groups of which they are not members. Second- and fifth-

55
graders were presented with positive and negative behaviors (e.g., always gets homework
finished on time, throws rocks at windows) assigned to majority and minority group
members, with the base-rates for positive and negative behaviors being equivalent in the
two groups. Children completed three tasks to assess their perceptions of illusory
correlation between group membership and behavior type. The first measure was an
attribution task in which children were given the list of behaviors assigned to the two
groups, and were asked to determine whether a minority or majority group member
performed each behavior. On the second task, children estimated the number of target
children in the majority and minority groups who performed the infrequent class of
behaviors. Finally, children evaluated the positivity and negativity of each group on
several dimensions (e.g., good/bad, nice/mean). These tasks are similar to those used to
measure illusory correlation in adults, but were modified for use with children.
Study 2 examined the impact of children’s membership in one of the target
groups on their group perceptions. Second- and fifth-graders were told that they were
members of either a novel majority group or a novel minority group. In both groups,
positive behaviors occurred more frequently than negative behaviors, and positive and
negative behaviors had the same base-rate of occurrence in both groups. Children again
completed an attribution task, a frequency estimation task, and group evaluations to
measure their perceptions of illusory correlation.
Study 3 explored the effects of membership in a real social group on illusory
correlations. This study paralleled Study 2, but used gender groups as the target social
groups. Majority and minority groups were manipulated by varying the number of target
girls and boys engaged in a mixed-sex task.

56
Chapter 2
STUDY 1:
CHILDREN’S PERCEPTIONS OF DISTINCTIVENESS-
BASED ILLUSORY CORRELATIONS
Study 1 examined cognitive biases that may lead to illusory correlations in
children. Specifically, children’s tendency to falsely associate a minority group with an
infrequent class of behaviors due to the paired-distinctiveness of the information was
examined. In one condition, the infrequent behaviors were negative; in another
condition, they were positive. Children were expected to associate the minority group
with the infrequent behaviors, regardless of the valence of the behaviors.
It was predicted that fifth-graders would show a greater susceptibility to illusory
correlation than second-graders. Younger children’s perceptions were expected to show
more variability, but be less consistently biased, as Primi and Agnoli (1998) found.
Because younger children have inferior memory capacities, are less likely to use complex
strategies for judging covariation, and are less adept at judging base-rates in comparison
to older children, their responses on illusory correlation tasks were expected to be
inconsistent. Older children, in contrast, were expected to show some sensitivity to
cognitive biases due to distinctive information, and their patterns of judgment on illusory
correlation tasks were therefore predicted to be more similar to those of adults.

57
Method
Participants
Sixty-five second-graders (35 girls, 30 boys) and 60 fifth-graders (31 girls, 29
boys) participated. The average age of the second-graders was 7 years, 9 months; the
average age of the fifth-graders was 10 years, 7 months. Ninety-eight percent of the
sample was White, and the remaining 3% was Black. All children attended public
elementary schools in a small town or rural area in Central Pennsylvania. The children
received a token gift (a pencil) for returning permission slips regardless of whether their
parents allowed them to participate. Children were also asked to give their consent
before participating. Participants were tested individually in their elementary schools on
two different days. Each child participated in all three studies. Studies 1 and 2 were
completed on the first day of testing, and Study 3 was completed during a later testing
session.
Materials
Target Children. Two novel groups of fictitious children, a “blue” group and a
“red” group, were used. The majority group consisted of 12 children, and the minority
group consisted of 6 children. The fictitious target children were depicted only by line
drawings (see Appendix A), or by a hand shown in a photograph (see Appendix C). Each
of the 18 target children engaged in a positive or negative behavior (e.g., making good
grades, cheating at games; see Appendix B).
Target Behaviors. Fifty-four positive and negative behaviors related to school or
home activities were developed. Four children within the age range of the participants,
and five adults rated a list of 70 behaviors on a scale of 1 to 7, ranging from “very bad” to
“very good.” Behaviors that received ratings that were consistently on the “good” end of

58
the scale for positive behaviors, or the “bad” end of the scale for negative behaviors, and
that received mean ratings of moderate positivity or negativity were chosen. Behaviors
rated as extreme or neutral were not included in the final set of target behaviors.
A set of 24 positive and 12 negative behaviors, as well as 6 additional negative
behaviors that were used only in the Positive-Infrequent condition, were developed. The
specific positive and negative behaviors that children heard in Study 1 were
counterbalanced across participants in the Negative-Infrequent condition such that half
the participants received Set A and the other half received Set B in Study 1 (see
Appendix B for a list of behaviors by set). In the Positive-Infrequent condition, children
were presented with the six additional negative behaviors, as well as six negative and six
positive behaviors from Set A (see Appendix B, Set C for a list of behaviors used in the
Positive-Infrequent condition).
Photographs Depicting Target Behaviors. The target behaviors were depicted
using photographs of props associated with the behaviors (e.g., school papers with A’s,
board games). When necessary, a child’s hand was shown in the photograph to
demonstrate an action (see Appendix C).
Group-Behavior Associations. The behaviors were associated with the two
social groups through verbal statements from the experimenter and the line drawings of a
child in a red or blue shirt paired with the photograph. Positive and negative behaviors
were associated with the groups across two between-subjects conditions. In the
Negative-Infrequent condition, negative behaviors were less frequent than positive
behaviors for each target group. The majority group engaged in eight positive behaviors
and four negative behaviors, and the minority group engaged in four positive behaviors
and two negative behaviors. Thus, the ratio of positive to negative behaviors was 2:1 in
both groups. To test for possible a priori expectations that minority groups are less
positive than majority groups or for mere exposure effects, a Positive-Infrequent
condition was also included. In this condition, positive behaviors were less frequent than
negative behaviors for each group. If children have prior expectations that the minority
group will be less positive than the majority group, or if mere exposure effects cause

59
them to like the majority group more because they have seen more exemplars from this
group, then children should perceive the majority group more positively than the minority
group. However, if they are influenced by the infrequency of the minority-infrequent
behavior, then they should perceive the minority group more positively than the majority
group. The majority group engaged in eight negative behaviors and four positive
behaviors, and the minority group engaged in four negative behaviors and two positive
behaviors. The colors associated with the majority and minority group were
counterbalanced to control for any effects of color preferences.
Illusory Correlation Tasks
Group Attributions. To assess children’s attribution of positive and negative
behaviors to each of the groups, each photograph depicting a behavior was shown, and
line drawings of a child from the red group and blue groups were placed on either side of
the photograph. Children were asked to indicate whether a child from the red group or
the blue group performed the behavior. Thus, this task assessed recognition of the group
associated with each behavior.
Frequency Estimations. Children were shown schematic drawings of 12
majority group members and 6 minority group members wearing shirts of the appropriate
color. The drawings were depicted in single rows such that the contrasting size of the
two groups was clear (see Appendix D). Children were asked to circle the number of
majority and minority group members that engaged in the infrequent class of behaviors.
To ensure that children understood that their frequency estimation for the infrequent class
of behaviors implied that the remainder of the target children performed the frequent
class of behaviors, the experimenter asked the children to verify this by asking, for
example, “If these children did bad things, does that mean all the rest of these children
did good things?” Any children who answered “no” to this question were asked to revise
their frequency estimations to correct the misunderstanding. The frequency estimation

60
task assessed children’s impression of the relative proportion of positive and negative
behaviors performed by each of the groups.
Group Evaluations. Children were shown a seven-point Likert scale drawn with
numbers ranging from 1 (very negative) to 7 (very positive). A frowning face was drawn
above the one to indicate that it anchored the negative end of the scale, and a smiling face
was drawn above the seven to indicate that it anchored the positive end of the scale. The
children rated how positive and negative the majority and minority groups were on nine
descriptors: 1) good/bad; 2) kind/unkind; 3) nice/mean; 4) friendly/unfriendly; 5)
likable/unlikable; 6) makes a good friend/makes a bad friend; 7) behaves well/behaves
badly; 8) would like to play with/would not like to play with; and 9) would want to have
as a friend/would not want to have as a friend. For each descriptor, children rated the
majority group, immediately followed by the minority group.
Reliability of ratings across the nine descriptors was calculated to determine
whether the descriptors were homogeneous. The alpha coefficient for this analysis was
.90 for ratings of both the majority and minority groups; the nine descriptors were thus
averaged into one evaluation rating for each target group.
Sentence Memory Measure
The Memory for Sentences subscale from the Stanford-Binet intelligence scales
was used as an independent assessment of children’s capacity to remember verbal
information. This measure was included to act as a covariate in analyses of illusory
correlations to control for variance due to individual differences in general verbal
memory capacity. The sentences began at the level normed for second- or fifth-graders.
The experimenter read a practice sentence aloud and asked the child to repeat it exactly
as she had. Recitation of the sentences continued until the child incorrectly repeated
three consecutive sentences, or three of the four sentences within two consecutive
sentence pairs (sentences were paired by difficulty level). The measure was scored by
subtracting the total number of incorrect responses from the total number of sentences

61
read by the experimenter before the child met the failure criterion. These scores were
used in the covariation analyses.
Procedure
Children were tested individually in a quiet area of their school by a female
experimenter. Testing took place at the discretion of the teachers. The experimenter
briefly explained that she was interested in what children think about other children, and
that the participants would hear about some things that other children did, and would be
asked to try to remember those behaviors and say what they think about the groups. The
experimenter then obtained the child’s agreement to participate, and had the child sign an
Informed Assent form.
The experimenter introduced two groups of children, a blue group and a red
group, who were ostensibly from another town. Target children were of the same sex as
the participant to avoid any unwanted gender effects, and the experimenter told the
children that she would be using the target children’s initials instead of their real names.
The experimenter explained that one group had more children than the other group, and
showed the picture that would later be used for the frequency estimation task depicting
the majority and minority groups in rows and made clear the relative sizes of the groups.
Children were told that they would hear about behaviors that the group members had
performed, and that they would be asked to remember “whether someone in the red group
or someone in the blue group” had performed each behavior. The experimenter placed
each photograph depicting a behavior in front of the child, and a drawing of a child
wearing a red or blue t-shirt next to the photograph. The child was told, for example,
“S.D., who is in the blue group, always makes good grades on tests.” Each target child
performed a different behavior.
After being shown the 18 group-behavior associations, children completed the
attribution task, the frequency estimation task, and the group evaluations. Tasks were
administered in this order to each child to avoid contamination of the attribution task,

62
which assess recognition memory, by overall impressions (frequency estimations) or
evaluations of the groups. Following these tasks, children completed the sentence
memory measure.
Results
Overview of Analyses
To examine illusory correlation effects on the attribution task, the numbers of
positive and negative behaviors attributed to the majority and minority groups were first
transformed into phi coefficients. The phi coefficient is a measure of the degree of
relatedness between group membership and behavior type. It is calculated by the
following formula where A is the number of behaviors attributed to the majority group
and B is the number of behaviors attributed to the minority group, and
+
represents
positive behaviors and
–
represents negative behaviors:
(A
+
* B
-
) – (B
+
* A
-
) / ((A
+
+ B
+
) (A
-
+ B
-
) (A
+
+ A
-
) (B
+
+ B
-
))
A phi score of zero would indicate that the perceived group-behavior associations
were equal to the information given; thus, a zero phi coefficient indicates no illusory
correlation. A non-zero phi score indicates an illusory correlation between at least one
group and a type of behavior. Several analyses were performed on the phi coefficients
obtained from the attribution task. First, the mean phi coefficient for each condition and
grade was compared to zero to determine whether children formed significant illusory
correlations (e.g., Haslam & McGarty, 1994; Schaller & Maass, 1989). The conditional
probabilities of each type of group-behavior association were also examined to determine
where children’s misattributions tended to occur. Second, phi coefficients were subjected
to an analysis of variance to determine whether there were condition or age-related
differences in the degree to which children formed illusory correlations. In addition, this
analysis was repeated as an analysis of covariance with children’s scores on the sentence
memory task as a covariate to remove variance that may be due to children’s general

63
memory capacity. Third, the proportions of positive and negative behaviors correctly
attributed to the majority and minority groups were also compared to determine whether
illusory correlations were due to better or worse memory for a particular group-behavior
class combination.
To examine illusory correlation effects in frequency estimations, children’s
estimations of the proportion of the infrequent class of behaviors performed by the
majority and minority groups were compared across each condition. Due to the expected
age differences in memory mentioned earlier, this analysis was also repeated using
sentence memory scores as a covariate.
Finally, evaluations of the majority and minority groups were examined across
conditions. In addition, the extent to which illusory correlations predicted evaluations of
the majority versus the minority group were examined using regression analyses.
Each analysis outlined above was first analyzed for sex differences. No sex
differences were found for any of the measures, so participant sex was excluded from
further analyses.
Group Attribution Task
It was predicted that children would form illusory correlations on the attribution
task such that they overassociated the infrequent class of behaviors with minority group
membership. Due to age-related increases in memory and ability to judge base-rates and
covariance, fifth-graders were expected to show stronger, more consistent illusory
correlations, whereas second-graders’ misattributions were expected to be more
inconsistent.
Because illusory correlation effects were expected to be due to increased attention
to and memory for infrequent behaviors paired with the minority group, children’s
correct attributions were examined. The proportion of correct attributions made for
minority-infrequent behaviors was expected to be larger than for the other group-
behavior associations. Thus, more correct attributions of minority-infrequent behaviors

64
would suggest that children attended more closely to these group-behavior associations
than other types of group-behavior associations.
The numbers of positive and negative behaviors attributed to the majority or
minority group were computed. Thus, each child’s attributions were distributed into four
group-behavior type classifications: (1) majority group-positive behaviors; (2) majority
group-negative behaviors, (3) minority group-positive behaviors, and (4) minority group-
negative behaviors. To examine whether children formed illusory correlations, phi
coefficients were calculated using these four scores.
Positive phi coefficients are consistent with an illusory correlation in which the
minority group is overassociated with negative behaviors, and negative phi coefficients
are consistent with an overassociation of the minority group with positive behaviors.
Thus, in the Negative-Infrequent condition, phi coefficients were expected to be positive,
and in the Positive-Infrequent condition, phi coefficients were expected to be negative.
Tests for Significance of Phi Coefficients. Phi coefficients obtained for the
attribution task in each condition were compared to zero. Scores reliably different from
zero indicate that children’s attributions showed reliable illusory correlations. Scores
were examined separately for each grade, and for the Negative-Infrequent and Positive-
Infrequent conditions. Mean phi coefficients were very close to zero; however, some
were significantly different from zero. The small number of behaviors used in this study
makes it difficult to obtain large phi coefficients. Because children showed basically
good memory for the group-behavior associations, the phi coefficients were necessarily
small and close to zero. However, the direction of the effects and the statistical reliability
of the phi coefficients are particularly important to consider.
In the Negative-Infrequent condition, in which phi scores were expected to be
positive, phi scores were significantly greater than zero for second-graders, t(35)=3.2,
p=.003, but not for fifth-graders, t(30)=0.9, n.s. (see Table 1). Examination of the
conditional probabilities for attributions of the infrequent and frequent classes of
behaviors to each group indicated that in the Negative-Infrequent condition, both second-
and fifth-graders overattributed negative behaviors to the minority group; however,

65
attributions of positive behaviors to the majority and minority groups were closer to the
actual proportions of 66% and 33%, respectively (see Table 2). Thus, although phi
coefficients were close to zero for second-and fifth-graders, and did not significantly
differ from zero for fifth-graders, mean attribution scores indicate that the expected trend
of overattribution of the infrequent class of behaviors to the minority group was present.
The results for the Positive-Infrequent condition were less consistent than those
for the Negative-Infrequent condition, and only fifth-graders showed a tendency towards
the hypothesized illusory correlation effects in this condition. In the Positive-Infrequent
condition, phi scores were expected to be negative. Scores for second-graders
approached significance, t(28)=1.8, p=.09 (two-tailed t-test), but the mean phi score was
positive. Phi did not differ from zero for fifth-graders, t(28)= -0.2, n.s. (see Table 1).
Examination of the conditional probabilities showed that second-graders in the Positive-
Infrequent condition overattributed negative behaviors to the minority group, contrary to
expectations. Fifth-graders, however, overattributed positive behaviors to the minority
group, but also equally overattributed negative behaviors to the minority group (see Table
2).
Table 1
Study 1: Mean Phi Coefficients
Condition n Mean Phi Coefficient
*
SD
Negative-Infrequent
Second-Graders
36
0.22
.41
Fifth-Graders
31
0.05
.33
Grades Combined 67
0.14
.38
Positive-Infrequent
Second-Graders
29
0.08
.24
Fifth-Graders
29
-0.01
.28
Grades Combined 58
0.04
.26
Conditions Combined
125
0.09
.34
*Phi coefficients were multiplied by 100 to increase ease of interpretation
in the table only.
NOTE: Means and standard deviations do not reflect logarithmic transformations.

66
Condition and Grade Differences in Group Attributions. In order to directly test
for the interaction of grade and condition, differences in phi coefficients across
conditions and grades were also tested using an analysis of variance. Before performing
this analysis, two was added to each phi coefficient to create positive numbers that could
undergo logarithmic transformation, and log
10
transformations were performed to
normalize significantly skewed distributions. The transformed phi scores were entered
into a 2(condition: negative-infrequent, positive-infrequent) X 2(grade: 2
nd
, 5
th
) analysis
of variance. The Condition X Grade interaction was not significant, F(1, 121)=0.4, n.s.
However, there was a significant main effect of Grade, F(1, 121)=4.6, p=.03, and a trend
for the main effect of Condition, F(1, 121)=2.9, p=.09. Examination of the means
revealed that the main effects were due to positive phi scores among second-graders and
Table 2
Study 1: Mean Conditional Probabilities of Positive and Negative Behaviors Attributed to
the Majority and Minority Groups
Group-Behavior Association
Majority- Majority- Minority- Minority-
n Positive Negative Positive Negative
Correct Conditional
Probabilities
.67
.67
.33
.33
Condition
Negative-Infrequent
Second-Graders
36 .64 (.13)
.48 (.23)
.36 (.13)
.52 (.23)
Fifth-Graders
31 .59 (.11)
.55 (.18)
.41 (.11)
.45 (.18)
Grades Combined 67 .62 (.12)
.51 (.21)
.38 (.12)
.49 (.21)
Positive-Infrequent
Second-Graders
29 .60 (.14)
.54 (.11)
.40 (.14)
.46 (.11)
Fifth-Graders
29 .56 (.17)
.57 (.11)
.43 (.16)
.43 (.11)
Grades Combined 58 .58 (.16)
.56 (.11)
.41 (.15)
.45 (.11)
NOTE: Standard deviations are shown in parentheses. Means and standard deviations do
not reflect logarithmic transformations.

67
negative phi scores among fifth-graders in the Positive-Infrequent condition, and to phi
scores that were closer to zero among fifth-graders in both conditions.
Group differences were also examined controlling for children’s memory capacity
as measured by the sentence memory task. By controlling for variance due to memory
that is not specific to the illusory correlation tasks, additional group differences in
attributions could become apparent. Phi coefficients were tested using a 2(condition:
negative-infrequent, positive-infrequent) X 2(grade: 2
nd
, 5
th
) analysis of covariance
(ANCOVA), with the number of sentences correctly recalled entered as the covariate.
The main effect of Condition remained marginally significant, F(1, 120)=2.9, p=.09, and
the main effect of Grade was no longer present when memory was controlled, F(1,
120)=1.7, n.s.
The loss of the main effect of grade suggests that memory mediated the grade
differences in illusory correlations. Indeed, based on a test for mediation described by
Baron and Kenny (1986), grade effects should be no longer significant when the variance
due to the mediating factor is removed, and the mediating variable should be significantly
correlated with the test variable. To test the relationship between memory and phi
coefficients, the absolute value of the phi coefficient was computed to eliminate effects of
condition (negative-infrequent vs. positive-infrequent). The correlation between memory
scores and /phi/ was marginally significant and negative, r
= -.17, p=.06. The negative
correlation further suggests that children’s memory capacity mediated the formation of
illusory correlations such that children with better memory made less distorted
attributions, as would be expected. However, the weakness of the correlation also
suggests that memory alone cannot account for the illusory correlation effects.
Accuracy of Group Attributions. To test whether illusory correlation effects
were due to increased memory for distinctive stimuli paired with the minority group, the
proportions of frequent and infrequent behaviors correctly attributed to the majority and
minority group were examined using a 2(participant condition: negative-infrequent,
positive-infrequent) X 2(grade: 2
nd
, 5
th
) X 4(target condition: majority-frequent, majority-
infrequent, minority-frequent, minority-infrequent) mixed-design ANOVA with Target

68
Condition as a within-subjects variable, and in which Target Condition represents the
group-behavior class combination. There was a main effect of Grade, F(1, 121)=4.5,
p=.04, with fifth-graders making more correct attributions overall than second-graders.
There was also a main effect of Target Condition, F(3, 363)=5.3, p=.002, but this effect
was subsumed by a Participant Condition X Target Condition interaction, F(3, 363)=3.3,
p=.03. Differences in correct attributions among the target conditions were examined
using post-hoc comparisons. To correct for family-wise error, the alpha level for the
post-hoc tests was set at .001 (.05/8).
Children in the Negative-Infrequent condition correctly attributed significantly
more infrequent (negative) behaviors to the minority group than the majority group,
t(66)=-4.0, p<.001. The latter finding is consistent with the hypothesis that the shared
infrequency of infrequent behaviors paired with a minority group makes these stimuli
distinctive and therefore more memorable. Children in the Negative-Infrequent condition
also made more correct attributions of frequent (positive) behaviors to the majority group
than infrequent (negative) behaviors, t(66)=3.6, p=.001, although this effect may be a
consequence of the overattribution of infrequent behaviors to the minority group,
resulting in fewer correct attributions of infrequent behaviors to the majority group (see
Table 3 for means).
For children in the Positive-Infrequent condition, however, the only difference
that approached significance was in attributions of frequent (negative) behaviors.
Children correctly attributed more frequent behaviors to the minority group than to the
majority group, t(57)=-2.9, p=.005, although this contrast failed to meet the stringent
alpha level set for the post-hoc comparisons (see Table 3). This finding may explain why
second-graders in the Positive-Infrequent condition overattributed negative behaviors,
rather than positive behaviors, to the minority group. The inherent salience of negative
behaviors may have led children to attend to these behaviors at least as much as to the
less frequent positive behaviors. Thus, the overattribution of negative behaviors to the
minority group probably resulted because second-graders paid particular attention to the

69
minority-negative behaviors, and this effect obscured any effect of increased salience of
the minority-infrequent (positive) association.
Summary of Findings for the Attribution Task. In general, the findings from the
attribution measure suggest that children are susceptible to the biasing effects of shared
infrequency on attributions of behaviors to a majority and minority group. Second- and
fifth-graders in the Negative-Infrequent condition showed the predicted overattribution of
infrequent behaviors to the minority group. The phi coefficients reflecting this effect
were not significantly different from zero for fifth-graders, but this lack of effect may be
due to better memory in the fifth-graders. Although fifth-graders’ misattributions were
not large, they were in the predicted directions.
Attributions in the Positive-Infrequent condition were not as consistent. Second-
graders did not show attributional errors in the predicted direction. Rather than
overattributing positive behaviors to the minority group, as predicted, they overattributed
Table 3
Study 1: Proportion of Positive and Negative Behaviors Correctly Attributed to the
Majority and Minority Groups
Group-Behavior Association
Majority- Majority Minority- Minority-
n Positive Negative Positive Negative
Condition
Negative-Infrequent
Second-Graders
36
.87 (.13)
.64 (.32)
.79 (.28)
.86 (.23)
Fifth-Graders
31
.83 (.15)
.77 (.23)
.87 (.20)
.90 (.24)
Grades Combined 67
.85 (.14)
.70 (.29)
.83 (.25)
.88 (.23)
Positive-Infrequent
Second-Graders
29
.78 (.23)
.71 (.17)
.76 (.32)
.81 (.25)
Fifth-Graders
29
.78 (.29)
.78 (.17)
.90 (.45)
.85 (.21)
Grades Combined 58
.78 (.26)
.74 (.17)
.83 (.39)
.83 (.22)
Conditions Combined
125
.82 (.21)
.72 (.24)
.82 (.32)
.86 (.23)
NOTE: Standard deviations are shown in parentheses. Means and standard deviations do not
reflect logarithmic transformations.

70
negative behaviors to this group. Fifth-graders in the Positive-Infrequent condition
overattributed both positive and negative behaviors to the minority group. The
inconsistency in the attributional patterns in the Negative-Infrequent and Positive-
Infrequent conditions may be due to the relative salience of positive and negative
behaviors. Negative behaviors tend to be more salient than positive behaviors, which
may have focused the attention of children in the Positive-Infrequent condition on the
minority-negative associations (Mullen & Johnson, 1990).
Frequency Estimations
As on the attribution task, children were expected to overestimate the proportion
of infrequent behaviors performed by the minority group on the frequency estimation
task. This effect was expected to be more pronounced among fifth-graders, whereas
second-graders were expected to show less consistency in their frequency estimations.
To examine these hypotheses, the number of targets in each group that children estimated
as having performed the infrequent class of behaviors was first converted to a proportion
score by dividing the estimated number by 12 for the majority group estimation, and by 6
for the minority group estimation. One was then added to each score to create nonzero
numbers, and the distribution of scores was normalized using a log
10
transformation. The
transformed proportions were analyzed using a 2(condition: negative-infrequent,
positive-infrequent) X 2(grade: 2
nd
, 5
th
) X 2(target group: majority, minority) mixed-
design analysis of variance with Condition and Grade as between-subjects variables, and
Target Group as a within-subjects variable.
Results indicated a main effect of Target Group, F(1, 121)=24.2, p<.001, with
children estimating a significantly greater proportion of infrequent behaviors in the
minority group than the majority group. Contrary to expectations, Target Group did not
interact with Grade F(1, 121)=0.2, n.s. (see Table 4 for means). Thus, children estimated
the minority group to have performed a greater proportion of infrequent behaviors,

71
regardless of whether the infrequent behaviors were positive or negative, as predicted.
However, contrary to predictions, this effect did not differ by grade.
These hypotheses were tested again controlling for memory capacity. The
transformed proportion scores were submitted to a 2(condition: negative-infrequent,
positive-infrequent) X 2(grade: 2
nd
, 5
th
) X 2(target group: majority, minority) ANCOVA
with sentence memory scores as the covariate. Results showed that the main effect of
Target Group was no longer significant, F(1,120)=0.8, n.s., and no other significant
effects emerged. Thus, children’s memory appears to have had some mediating effect on
frequency estimations.
The relationship between the illusory correlation effect and memory was further
tested to determine whether a mediational relationship could be inferred. Higher memory
scores on the sentence memory task should be related to smaller differences in
estimations of infrequent behaviors in the majority versus minority group. To test this
relationship, the proportion of infrequent behaviors estimated for the majority group was
Table 4
Study 1: Estimated Frequency of Occurrence of the Infrequent
Behavior Class in the Majority and Minority Groups
Target Group
Condition n Majority Minority
Negative-Infrequent
Second-Graders
36
.34 (.20)
.43 (.22)
Fifth-Graders
31
.34 (.13)
.48 (.19)
Grades Combined
67
.34 (.17)
.45 (.21)
Positive-Infrequent
Second-Graders
29
.45 (.18)
.53 (.17)
Fifth-Graders
29
.43 (.16)
.49 (.17)
Grades Combined
58
.44 (.17)
.51 (.17)
Conditions Combined
125
.39 (.18)
.48 (.19)
NOTE: Standard deviations are shown in parentheses. Means and
standard deviations do not reflect logarithmic transformations.

72
subtracted from the proportion of infrequent behaviors estimated for the minority group.
Thus, a larger difference score indicates a greater illusory correlation. The correlation
between the frequency estimation difference scores and memory scores was then
computed. This correlation was not significant, and, contrary to expectations, was also
positive, r =.14, n.s. The positive, nonsignificant correlation suggests that memory did
not have a clear mediational influence on frequency estimations. This finding is perhaps
not surprising given that frequency estimations do not measure recall of specific group-
behavior associations, but more general impressions of the majority and minority groups.
In sum, children estimated a larger proportion of infrequent behaviors in the
minority group than in the majority group, as predicted. There were no differences in this
trend in the Negative-Infrequent versus the Positive-Infrequent condition, lending further
evidence to the notion that the illusory correlation effects found in this study are due to
increased attention to paired-distinctive stimuli. There were also no age effects,
indicating that second- and fifth-graders were equally susceptible to illusory correlation
effects on the frequency estimation task.
Group Evaluations
Children’s evaluations of the majority and minority groups should be influenced
by the illusory correlations they formed. Thus, in the Negative-Infrequent condition, in
which negative behaviors were overassociated with the minority group, children were
expected to evaluate the minority group more negatively than the majority group. In the
Positive-Infrequent condition, in which positive behaviors were overassociated with the
minority group, the minority group should be evaluated more positively than the majority
group.
Condition and Grade Differences in Evaluations. The mean ratings for the
majority and minority groups were subjected to a 2(condition: negative-infrequent,
positive-infrequent) X 2(grade: 2
nd
, 5
th
) X 2(target group: majority vs. minority) mixed-
design ANOVA, with Target Group as a within-subjects variable. The expected

73
Condition X Grade X Target Group interaction was not found, F(1, 121)=0, n.s; however,
there was a significant Condition X Target Group interaction F(1, 121)=4.4, p=.04. Post-
hoc contrasts (
α
=.025) revealed that children in the Negative-Infrequent condition did not
evaluate the majority and minority groups differently, t(66)=0.5, n.s. Thus, children in
the Negative-Infrequent condition formed illusory correlations such that they
overassociated negative behaviors with the minority group on both the attribution and
frequency estimation tasks reported earlier, but the illusory correlations were not
reflected on the evaluation task.
In contrast, children in the Positive-Infrequent condition rated the minority group
more positively than the majority group, as expected, t(57)=2.3, p=.02 (see Table 5 for
means). Thus, only children in the Positive-Infrequent condition evaluated the groups
differently based indicators of illusory correlation.
Regression Analyses. The relative evaluations of the majority and minority
groups should be predicted by children’s illusory correlations. That is, the degree of
association between attributions to a particular group and behavior valence (phi
Table 5
Study 1: Mean Evaluation Ratings of the Majority and Minority Groups
Target Group
Condition n Majority Minority
Negative-Infrequent
Second-Graders
36
4.8 (1.3)
4.8 (1.3)
Fifth-Graders
31
4.6 (1.0)
4.4 (1.2)
Grades Combined
67
4.7 (1.2)
4.6 (1.2)
Positive-Infrequent
Second-Graders
29
4.0 (1.3)
4.8 (1.2)
Fifth-Graders
29
3.5 (1.4)
4.0 (1.2)
Grades Combined
58
3.7 (1.4)
4.4 (1.3)
Conditions Combined
125
4.2 (1.4)
4.5 (1.3)
NOTE: Standard deviations are shown in parentheses.

74
coefficients), and the degree of perceived difference in the proportion of positive and
negative behaviors estimated for each group (frequency estimations) should be the basis
for evaluations of the two groups. To examine how illusory correlations contributed to
children’s evaluations, two regression models were tested. In the first model, grade and
condition were regressed onto evaluation scores. In the second model, phi coefficients
and frequency estimations were added to this model to test whether illusory correlation
measures removed substantially more variance than the grade and condition predictors
alone. The dependent variable was the difference in mean evaluations of the majority
and minority groups. This variable was computed by subtracting the minority group
rating from the majority group rating. This yielded scores ranging from –6 to 6. To
simplify the analysis, six was added to each difference score to obtain a positive number
from 0 to12, in which scores below six represented a more favorable evaluation of the
minority group, and scores above six represented a more favorable rating of the minority
group.
The predictor variables in the first model included grade and participant’s
condition (negative-infrequent vs. positive-infrequent). Condition was dummy coded as
1 and –1 (majority and minority groups), and grade was entered as 2 or 5. This model
was not significant, F(2, 122)=2.5, p=.08, adjusted R
2
= .02. Model 2 included scores on
the illusory correlation measures. Both phi coefficients and frequency estimations were
entered into the model together because, although they both measure illusory correlation,
the zero-order correlation between the variables was fairly low (see Table 7), and
therefore should have relatively little covariance in the model. Thus, variables in the
second model included grade, condition, phi coefficients, differences in frequency
estimations of the infrequent behaviors for the majority and minority groups, and a
frequency estimation X condition interaction term. Because the frequency estimation
variable was scored as proportions of infrequent behaviors estimated, and does not take
into account whether the infrequent behaviors were positive or negative, the frequency
estimation X condition interaction term was included to reflect the expectation that
children in the Negative-Infrequent condition should evaluate the majority group more

75
positively, and children in the Positive-Infrequent condition should evaluate the minority
group more favorably. The frequency estimation variable was calculated by subtracting
the estimated proportion of infrequent behaviors for the majority group from the
estimated proportion of infrequent behaviors for the minority group, and one was added
to these values to create positive numbers. Because the frequency estimation variable
was also used in calculating the interaction term, the mean of this variable was subtracted
from each frequency estimation score to compensate for the distance of two (-1 to 1)
between the dummy coded variables in the interaction term. The interaction term was
created by multiplying the same frequency estimation variable that was entered into the
model alone by condition (1 or –1).
The second model containing grade, condition, phi coefficients, frequency
estimation, and frequency estimation X condition was significant, F(5, 119)=15.4,
p<.001, adjusted R
2
=.37. Three of the five predictor variables emerged as significant
independent predictors: Condition, Phi, and Frequency Estimation X Condition (see
Table 6 for alpha values and beta weights of all variables, and Table 7 for zero-order
correlations among the variables). Thus, Condition functioned as an independent
predictor, given that children in the two conditions were expected to show opposite
patterns of evaluations of the majority and minority groups. Phi coefficients also
predicted evaluations, indicating that illusory correlations measured by the attribution
task influenced evaluations. Finally, the interaction variable of Frequency Estimation X
Condition was also a significant predictor of evaluations.
The slopes of the regression plane for the Frequency X Condition interaction were
calculated using Cohen and Cohen’s (1975) method for interpreting interaction terms.
The slopes of the interaction plane were dichotomized along the condition variable,
creating separate slope values for frequency estimations of children in the Negative-
Infrequent and Positive-Infrequent conditions. The slope for the Negative-Infrequent
condition was positive, indicating that as the difference in the proportion of infrequent
(negative) behaviors estimated for the minority compared to the majority group became
larger, evaluations of the minority group became more negative. For children in the

76
Positive-Infrequent condition, the opposite effect was found. The slope of the regression
plane was negative, indicating that as the difference in the proportion of infrequent
(positive) behaviors estimated for the minority compared to the majority group became
larger, evaluations of the minority group became more favorable. Thus, as expected,
children’s illusory correlations predicted their relative evaluations of the majority and
minority groups. Furthermore, a model containing illusory correlation scores was
necessary to significantly predict differences in evaluations of the groups.
Table 6
Study 1: Regression Models Predicting Differences in Evaluations of the Majority and
Minority Groups
Unstandardized Standardized
Predictor Beta Weight Beta Weight t p Partial r
Model 1 (R
2
=.02)
Grade
0.10
.07
0.8
.41
.08
Condition
0.39
.19
2.1
.04
.19
Model 2 (R
2
=.37)
Grade
0.10
.07
1.0
.33
.09
Condition
-5.23
-2.50
- 6.3
<.001
-.50
Phi Coefficient
108.00
.17
2.2
.03
.20
Frequency Estimation
-0.68
- .07
- 1.0
.34
-.09
Freq. Est. X Condition
5.11
2.70
6.8
<.001
.53

77
Summary of Results
Negative-Infrequent Condition. In the Negative-Infrequent condition, negative
behaviors were less frequent than positive behaviors. Therefore, children were expected
to form an illusory correlation between the minority group and negative behaviors due to
the shared infrequency of this combination. They were likewise expected to evaluate the
minority group more negatively than the majority group. The results showed that on the
attribution task, both second- and fifth-graders in the Negative-Infrequent condition
overattributed negative behaviors to the minority group, although only second-graders’
phi coefficients significantly differed from zero. The children were also more correct in
making attributions for negative behaviors to the minority group than for any other
Table 7
Study 1: Zero-Order Correlations Between Illusory Correlation Tasks and
Evaluations by Condition
Grade
Sentence
Memory
Phi
Coefficient
Frequency
Estimation
Evaluations
Grade
1.00
.56**
-.22
.11
.06
Sentence
Memory
.59
1.00
-.21
.07
.00
Phi
Coefficient
-.17
-.11
1.00
.37**
.34**
Frequency
Estimation
-.03
.21
.27
1.00
-.63**
Evaluations .08
-.03
.31
.55
1.00
NOTE: Correlations listed above the diagonal are for the Negative-
Infrequent condition; correlations listed below the diagonal are for the
Positive-Infrequent condition.
NOTE: Frequency Estimation=estimation for minority - majority group
NOTE: Evaluations=evaluation for majority - minority group
**Correlation is significant at the .01 level (2-tailed).

78
group-behavior combination, suggesting that their overattribution of negative behaviors
to the minority group was due to increased salience of the negative behaviors. Similarly,
children in this condition estimated a greater proportion of negative behaviors associated
with the minority group than the majority group on the frequency estimation task, again
indicating an association between the minority group and infrequent behaviors. Despite
the illusory correlations these children formed, their evaluations of the majority and
minority groups did not differ. However, their illusory correlations did predict their
relative evaluations of the groups, suggesting that their perceived illusory correlations
had some effect on their evaluations. See Figure 5 for a graphical representation of the
Negative-Infrequent condition findings.
Positive-Infrequent Condition. In the Positive-Infrequent condition, positive
behaviors were less frequent than negative behaviors; thus, children were expected to
form an illusory correlation between the minority group and positive behaviors, and to
evaluate the minority group more positively than the majority group. Results showed that
on the group attribution task, second-graders overattributed negative behaviors to the
minority group, and fifth-graders overattributed both positive and negative behaviors to
the minority group. Children in this condition showed better memory for minority-
negative behaviors, although the negative behaviors were more frequent, suggesting that
negative behaviors are especially salient due to their valence, and children therefore
remembered the minority-negative behavior associations better. In contrast, children
estimated a larger proportion of positive behaviors in the minority group, suggesting a
susceptibility to cognitive biases due to shared infrequency in the Positive-Infrequent
condition as well. Finally, the children evaluated the minority group more positively than
the majority group, and their illusory correlations predicted this difference in evaluations.
See Figure 6 for a graphical representation of the Positive-Infrequent condition findings.

79
Summary of Findings for the Negative-Infrequent Condition
Deviation from Actual Proportion of Negative Behaviors
Deviation from Actual Proportion of Negative Behaviors

80
Summary of Findings for the Positive-Infrequent Condition
Deviation from Actual Proportion of Positive Behaviors
Deviation from Actual Proportion of Positive Behaviors

81
Discussion
Study 1 examined children’s susceptibility to cognitive biases leading to illusory
correlations. It was hypothesized that, like adults, children would perceive an erroneous
relationship between a minority group and an infrequent class of behaviors. This
perceived relationship should be due to the shared infrequency of less frequent behaviors
that are performed by a numerically smaller group of target children. The shared
infrequency of the minority-infrequent behaviors should make them more noticeable and
therefore more memorable, leading to an overrepresentation of this association in
memory, and thus a perceived association between the minority group and infrequent
behaviors. Furthermore, age-related changes in susceptibility to illusory correlations
were predicted. Compared to second-graders, fifth-graders have better memory (e.g.,
Bjorkland & Muir, 1988; Brainerd, 1981; Chi & Ceci, 1987; Ornstein et al., 1975;
Perlmutter, 1984; Ruff & Lawson, 1990; Stodolsky, 1974; Strutt et al., 1975), are better
at judging base-rates (Jacobs et al., 1995; Jacobs & Potenza, 1991) and covariation
(Shaklee & Mims, 1981; Shaklee & Paczek, 1985), and show less variability in their
group perceptions (Primi & Agnoli, 1998). Therefore, it was predicted that fifth-graders
would be more susceptible to illusory correlations than second-graders because their
judgments should be less variable and show more consistent effects of the
overassociation between the minority group and the infrequent class of behaviors.
Alternatively, however, fifth-graders’ increased memory and ability to judge base-rates
and covariation might make their group perceptions more accurate, and they might
therefore show less bias than second-graders.
The hypothesis that children would form illusory correlations between a minority
group and an infrequent class of behaviors was generally supported. In the Negative-
Infrequent condition, negative behaviors were expected to be overassociated with the
minority group. On the attribution task, children in this condition were quite accurate in
attributing positive behaviors to the majority and minority groups, making mean
attributions near the correct proportions for the majority and minority groups. However,

82
children overattributed negative behaviors to the minority group, and underattributed
negative behaviors to the majority group. These trends were supported by positive phi
coefficients, although only second-graders’ phi scores were significantly above zero.
Children’s frequency estimations also demonstrated an overestimation of negative
behaviors in the minority group. That is, children estimated the minority group to have
performed a greater proportion of negative behaviors than the majority group, although
the actual proportions of negative behaviors were equal for the two groups.
Contrary to expectations, the illusory correlations formed by children in the
Negative-Infrequent condition did not lead to differences in the evaluation of the majority
and minority groups. Although these children overassociated negative behaviors with the
minority group, they did not evaluate the minority group more negatively than the
majority group. However, regression analyses indicated that children’s illusory
correlations did influence their relative ratings of the two groups such that children who
formed stronger illusory correlations also evaluated the majority and minority groups
more differently. Thus, the potential for illusory correlations between a minority group
and negative behaviors to lead to more negative evaluations of the minority group seems
apparent.
Children in the Positive-Infrequent condition also showed some of the expected
illusory correlation effects. In this condition, positive behaviors were less frequent than
negative behaviors, and a perceived association between the minority group and positive
behaviors was predicted. On the attribution task, results were not as similar to the
predicted trends as in the Negative-Infrequent condition. Second- and fifth-graders in the
Positive-Infrequent condition overattributed both positive and negative behaviors to the
minority group, and underattributed these behaviors to the majority group. Contrary to
expectations, second-graders showed a greater overattribution of negative behaviors to
the minority group than positive behaviors. However, findings for the frequency
estimation task in the Positive-Infrequent condition did support the hypothesis that
children would perceive a false relationship between the minority group and infrequent
(positive) behaviors. Indeed, children estimated a greater proportion of positive

83
behaviors to have been performed by the minority group than the majority group.
Finally, children in the Positive-Infrequent condition evaluated the minority group more
favorably than the majority group, as would be expected based on the perceived
association between the minority group and positive behaviors. The illusory correlations
children formed also predicted the difference in their evaluations of the majority and
minority groups.
The predicted age-related trends in illusory correlation were not found. It was
hypothesized that second-graders’ judgments would show more variability than fifth-
graders’ judgments, and that fifth-graders should therefore evidence stronger illusory
correlation effects. Contrary to these expectations, both age groups were equally
susceptible to illusory correlations on the frequency estimation task, which measures
overall group impressions. Both age groups also showed similar differences in group
evaluations. On the attribution task, second-graders formed significant illusory
correlations, but fifth-graders formed weaker illusory correlations than second-graders.
Thus, even children as young as second grade were clearly susceptible to biases that
cause illusory correlations. Fifth-graders’ attributions were more accurate than second-
graders’ attributions, which probably caused the weaker illusory correlation effects.
However, fifth-graders’ misattributions were in the predicted directions, and they formed
illusory correlations that were similar in strength to those of second-graders on the
frequency estimations.
In sum, the hypothesis that children would overassociate the minority group with
infrequent behaviors was generally supported. In both the Negative-Infrequent and
Positive-Infrequent conditions, children overestimated infrequent behaviors in the
minority group, and these perceptions predicted differences in their evaluations of the
groups. Results from the attributions task were not as consistent across conditions,
perhaps because this task is more sensitive to specific variations in memory than the
frequency estimation task, which measures overall impressions of the groups. Thus, the
frequency estimation task may be a better indicator of how children view the groups’

84
positive and negative behavior in general, whereas the attribution task assesses memory
for specific group-behavior associations.
Distinctiveness of Group-Behavior Associations
The illusory correlation effects and patterns of correct attributions found in Study
1 suggest that certain stimuli are more salient than others, and that illusory correlations
are due to the increased distinctiveness of certain group-behavior associations over
others. Results from the frequency estimation task in both the Negative-Infrequent and
Positive-Infrequent conditions showed that illusory correlation effects are characterized
by an overestimation of infrequent behaviors in the minority group. Children in the
Negative-Infrequent condition made an erroneous association between the minority group
and infrequent behaviors on the attribution and frequency estimation tasks. Children in
this condition also made more correct attributions for minority-negative behaviors,
underscoring the particular salience of the association. Children in the Positive-
Infrequent condition overassociated both negative and positive behaviors with the
minority group on the attribution task, but on the frequency estimation task they
overestimated the positive (infrequent) behaviors in the minority group.
Given this fairly consistent finding of illusory correlations between the minority
group and negative behaviors, it might appear that the illusory correlations are due to a
bias towards viewing minority groups more negatively than majority groups. However,
the lack of difference in evaluations of the majority and minority groups in the Negative-
Infrequent condition, and the finding of more positive evaluations of the minority group
in the Positive-Infrequent condition suggest otherwise. The proportion of correct
attributions in the Positive-Infrequent condition was greater for minority-negative
behaviors, suggesting that this association may have been more salient than other group-
behavior associations. The reason may be that negative behaviors are inherently more
salient than positive behaviors, and therefore attract more attention than positive
behaviors. Thus, when paired with a minority group, the minority-negative association

85
stands out, even when negative behaviors are more frequent than positive behaviors. The
salience of the minority-negative behaviors may have obscured any effects of the
distinctiveness of the minority-positive behaviors in the Positive-Infrequent condition on
the attribution task. Nevertheless, the distinctiveness of the minority-positive association
became apparent on the frequency estimations task, in which children in the Positive-
Infrequent condition overestimated the proportion of positive behaviors in the minority
group.
The slightly different patterns of results found in the Negative-Infrequent and
Positive-Infrequent conditions on the attribution task are not entirely inconsistent with
findings from research with adults. Meta-analysis showed that whereas illusory
correlations were very robust when negative behaviors were infrequent, effect sizes were
much smaller when the infrequent behaviors were non-negative (Mullen & Johnson,
1990). The reason for these results may be that the added salience of negative behaviors
makes minority-negative behaviors particularly distinctive when negative behaviors are
infrequent, but competes with the salience of the minority-positive relationship when
positive behaviors are infrequent.
The Role of Memory in the Formation of Illusory Correlations
Children’s memory capacity, as measured by the independent sentence memory
task, mediated age differences in illusory correlation effects on the attribution task.
There was also partial evidence for a mediating role of memory on children’s frequency
estimations. On both tasks, when sentence recall scores were covaried out of the
analyses, there were no longer significant illusory correlation effects. Further evidence
for the mediating role of memory in attributions came from a significant negative
correlation between sentence recall scores and phi coefficients, with children who scored
higher on the sentence recall task forming weaker illusory correlations. There was no
significant correlation between sentence recall and frequency estimations, perhaps
because frequency estimations represent an overall impression of the majority and

86
minority groups, and may thus be less dependent on memory for specific group-behavior
correlations.
Memory should indeed mediate illusory correlation effects to some extent because
these effects should be memory-based. That is, they appear to be dependent on better
memory for certain group-behavior associations than others, which leads the more salient
group-behavior associations to be overrepresented in memory, and overestimated in
judgments of the groups. However, illusory correlation effects are not entirely accounted
for by memory capacity, perhaps because illusory correlations are caused by systematic
memory distortions that are due to differences in the salience of certain types of stimuli,
rather than by a simple inability to remember the stimuli. Thus, having a better memory
does not necessarily make one immune to the bias towards attention to certain stimuli.

87
Chapter 3
STUDY 2:
DUAL INFLUENCES OF DISTINCTIVENESS
AND INGROUP FAVORITISM ON PERCEPTIONS OF
ILLUSORY CORRELATION IN SELF-RELEVANT
MINIMAL GROUPS
The methodology of Study 1, in which children formed impressions of groups to
which they do not belong, represents a social perceptual situation that undoubtedly occurs
in real life. Perhaps more often than not, however, children are members of one of the
social groups about which they are forming impressions. For example, any perceptions
of gender groups probably involve a comparison to oneself, as most people have a clear
gender identity. Numerous other social groupings, such as race, religion, and social class,
are also likely to make reference to the self. Thus, in addition to understanding the
cognitive biases that lead to illusory correlations, it is also important to understand how
motivation to view one’s social group, and thus oneself, favorably can impact the
formation of illusory correlations.
The purpose of Study 2 was to examine the dual influences of cognitive biases
that lead to illusory correlations between a minority group and infrequent behaviors, and
motivational biases to view one’s own social group more favorably than other social

88
groups. Using a methodology similar to that of Study 1, several group-behavior
associations were presented, children were told that they themselves were members of
either the target majority or minority group, and the formation of illusory correlations and
group evaluations were measured. Because a case in which positive behaviors
outnumber negative behaviors is more ecologically valid than the reverse situation,
negative behaviors were always the infrequent class of behaviors. Thus, based on
cognitive biases in attention to the minority-infrequent behaviors alone, illusory
correlations between the minority group and negative behaviors would be predicted.
Based on Schaller and Maass’ (1989) findings, children were expected to attend
closely to behaviors in their own group. The self-relevance of this task may motivate
children to use on-line processing when listening to the group-behavior associations to
form impressions of the groups as each behavior is presented. On-line processing should
lead to an association between one’s own group and frequent, in this case positive,
behaviors. Children may also presuppose that their own group will behave desirably;
thus, children may attend more to positive behaviors in forming their impressions of their
own group, and may also attend to negative behaviors when forming impressions of the
other group.
For children assigned to the Majority
1
group, the predicted direction of illusory
correlations based on motivational biases to view the ingroup more favorably than the
outgroup and the fore-mentioned cognitive biases should be the same. Majority group
children should form illusory correlations such that the minority group is associated with
negative behaviors and the majority group is associated with positive behaviors, and
majority group children should evaluate the majority group more positively than the
minority group. For children assigned to the Minority group, however, motivational
biases and cognitive biases may be in conflict. That is, unless children use purely on-line
processing, and do not rely on any memory-based processing to form impressions, the
cognitive bias that makes minority-negative behaviors more salient than other group-
1
The capitalized words “Majority” and “Minority” will from this point on signify reference to the participants
who are assigned membership to one of the target groups.

89
behavior associations should lead Minority group children to form an association
between their own group and negative behaviors. However, the motivational bias to view
one’s own group more favorably than the other group may attenuate this bias, leading to
weaker illusory correlations, or it may overwhelm the cognitive bias and allow Minority
group children to form an illusory correlation between the minority group and positive
behaviors.
Schaller and Maass (1989) also found different results for adults’ attributions and
frequency estimations when participants were told that they were members of one of the
target group. On the frequency estimation measure, adults formed illusory correlations
between their own group and positive behaviors. On the group attribution measure, in
contrast, illusory correlations were attenuated. Schaller and Maass argued that the
attenuation was due to the effortful processing required to reconcile negative behaviors in
one’s own group with the a priori notion that one’s own group will behave positively.
An increased amount of attention is given to negative behaviors in one’s own group in
order to reconcile the discrepancy between expectations and actual information, and
consequently ingroup-negative behaviors are well represented in memory, and illusory
correlations between the outgroup and negative behaviors are decreased. The reason for
the difference in illusory correlations on the two measures, according to Schaller and
Maass, is that the frequency estimation task measures overall group impressions and calls
for less accurate memory, whereas the attribution task is subject to more accurate
memory for the group-behavior associations. Thus, illusory correlation effects in
children might also be attenuated on the attribution task.
The most important age effect predicted for Study 2 was a decrease in the
influence of ingroup favoritism on fifth-graders’ perceptions. Specifically, fifth-graders
were expected to show less difference in their estimations of negative behaviors in the
ingroup versus the outgroup, and less of a difference in evaluations of the majority and
minority groups due to the expected decrease in ingroup favoritism. It was also predicted
that fifth-graders assigned to the Minority group would show more negative minority
group perceptions if they were influenced by the shared infrequency of the minority-

90
negative behaviors, but would be less influenced by a motivation to attribute positive
behaviors to the ingroup due to ingroup favoritism than second-graders assigned to the
Minority group.
Method
Participants
Participants were the same children who participated in Study 1.
Materials and Procedure
Materials. The materials were similar to those used in Study 1. The same line
drawings of girls and boys were used to depict the majority and minority groups. The
target groups were labeled the “yellow” group and the “green” group, and the drawings
depicted children wearing a yellow or green t-shirt. As in Study 1, the majority group
consisted of 12 children, and the minority group consisted of 6 children. Each target
child was associated with a positive or negative behavior, which was communicated by
placing a drawing of a child in a yellow or green shirt next to a photograph depicting the
behavior. The behaviors used in Study 2 consisted of the set of behaviors not used in
Study 1 (e.g., Set B if Set A was used in Study 1). The list of positive and negative
behaviors was counterbalanced across Studies 1 and 2, but each individual child received
a different set of behaviors for Study 1 and Study 2 (see Appendix B). Positive behaviors
were always more frequent than negative behaviors in Study 2; thus, the majority group
engaged in eight positive behaviors and four negative behaviors, and the minority group
engaged in four positive behaviors and two negative behaviors.
Group Assignment. Half the participants were assigned to membership in the
Majority group, and the other half were assigned to Minority group membership. At the
beginning of Study 2, the experimenter told the children that she would tell them about

91
two other groups of children, and that this time they would be members of one of the
groups. She asked them to choose whether they wanted to be in the “green” or “yellow”
group, and told them that once they had chosen a group they could not change their group
membership. Thus, children chose the color group they preferred to belong to. However,
children’s membership in the Majority or Minority group was assigned prior to the study,
and the color associated with the majority and minority group for that particular
participant was determined by the color the child chose to be associated with. Allowing
children to choose their preferred color group membership should have helped children
identify with either the majority or minority group and minimized any extraneous effects
due to color preferences.
Measures. The measures included the same group attribution, frequency
estimation, evaluation, and sentence memory tasks that were used in Study 1. For the
evaluation task, analysis of the descriptors showed ratings to be reliable across the nine
descriptors for Study 2, with alpha coefficients of .91 for majority group ratings, and .92
for minority group ratings. The descriptors were therefore averaged to form a composite
evaluation score for each group.
Procedure. Following the color group assignments, children were shown the
drawings of 12 majority group and 6 minority group children used for the frequency
estimation task, and they were told that the “green” (or yellow) group had twice as many
children as the “yellow” (or green) group. The experimenter told the children that she
would “tell them about some things that children in the green and yellow groups have
done,” and instructed them to attend to and try to remember the group associated with
each behavior. For each group-behavior association, a drawing of a child of the
participants’ sex wearing either a yellow or green t-shirt was placed next to the
photograph depicting the behaviors, and the experimenter said, for example, “J.M., who
is in the green group, always shares her toys with other children.” Children then
completed the attribution task, frequency estimation task, and group evaluations. Testing
for Study 2 took place immediately following Study 1 and the sentence memory task.

92
Results
Overview of Analyses
The analyses of Study 2 were the same as in Study 1. For the group attribution
task, children’s attributions of each behavior to a group were used to compute phi
coefficients. The phi coefficients were first tested to determine whether they were
significantly different from zero. Condition and grade differences in phi coefficients
were then examined, and finally, the accuracy of children’s attributions was examined.
For the frequency estimation task, condition and grade differences in the proportion of
negative behaviors attributed to each group were assessed. Finally, children’s
evaluations of the majority and minority groups were examined, and regression analyses
were performed to determine whether illusory correlations predicted differences in group
evaluations. For each analysis, sex differences were tested in preliminary analyses. No
sex differences were found on any of the measures; therefore, participant sex was not
included as a factor in the following analyses.
Attribution Task
In Study 2, children were told that they were members of the Majority or Minority
group. Their perceptions were therefore expected to be influenced by both cognitive-
based illusory correlation effects due to the shared infrequency of minority-negative
behaviors, as well as motivational biases to view their own group more positively than
the other group. For children assigned to the Majority group, ingroup favoritism effects
and shared infrequency effects should lead to similar illusory correlation effects;
therefore, children assigned to this group were expected to have positive phi coefficients,
consistent with a relationship between the majority group and positive behaviors.
However, for children assigned to the Minority group, ingroup favoritism motives and
cognitive effects of shared-infrequency should be in conflict. Therefore, children

93
assigned to the Minority group were expected to have phi coefficients that are close to
zero, indicating an attenuation of illusory correlation, or negative phi coefficients,
consistent with a perceived association between the minority group and positive
behaviors.
Tests of Significance of Phi Coefficients. These hypotheses were first tested by
comparing phi coefficients for each condition against zero. Results of one-sample t-tests
showed that none of the phi coefficients differed from zero (see Table 8 for means).
Thus, neither second- and fifth-graders in the Majority group, nor second- and fifth-
graders in the Minority group showed significant illusory correlations on the attribution
task.
Examination of the proportion of positive and negative behaviors attributed to
each group revealed that children’s attributions of positive behaviors were very accurate.
Their attributions of negative behaviors were slightly lower than the actual proportions
for the majority group, and slightly higher than the actual proportions for the minority
group, but this tendency was not sufficient to produce significant phi coefficients (see
Table 9 for means). The lack of illusory correlation effects on this task may have
occurred for several reasons. First, because children were motivated to attend to
behaviors relevant to their own group, they may have remembered the group-behavior
associations more accurately, thus forming no illusory correlations. Second, the
attenuation of illusory correlation effects could have been due to practice effects carried
over from Study 1. Finally, the lack of illusory correlation effects on the attribution task
could be interpreted as an indication that children were using on-line rather than memory-
based processing when forming perceptions of the groups.

94
Table 8
Study 2: Mean Phi Coefficients
Condition n Mean Phi Coefficient
*
SD
Majority Group Members
Second-Graders
32
0.07
0.33
Fifth-Graders
29
0.01
0.27
Grades Combined 61
0.04
0.34
Minority Group Members
Second-Graders
33
0.09
0.33
Fifth-Graders
31
0.07
0.35
Grades Combined 64
0.08
0.34
Conditions Combined
125
0.06
0.34
*Phi coefficients were multiplied by 100 to increase ease of interpretation
in the table only.
NOTE: Means and standard deviations do not reflect logarithmic transformations.
Table 9
Study 2: Mean Conditional Probabilities of Positive and Negative Behaviors
Attributed to the Majority and Minority Groups
Group-Behavior Association
Majority- Majority- Minority- Minority-
n Positive Negative Positive Negative
Correct Conditional
Probabilities
.67
.67
.33
.33
Condition
Majority Group Members
Second-Graders
32
.63 (.14)
.57 (.23)
.37 (.14)
.43 (.23)
Fifth-Graders
29
.64 (.07)
.63 (.16)
.36 (.07)
.36 (.16)
Grades Combined
61
.64 (.11)
.60 (.20)
.36 (.11)
.40 (.20)
Minority Group Members
Second-Graders
33
.65 (.11)
.58 (.20 )
.35 (.11)
.42 (.20)
Fifth-Graders
31
.65 (.08 ) .59 (.23 )
.35 (.09)
.41 (.23)
Grades Combined
64
.65 (.10 ) .59 (.21)
.35 (.10)
.41 (.21)
Conditions Combined
125
.64 (.10)
.59 (.21)
.36 (.10)
.41 (21)
NOTE: Standard deviations are shown in parentheses. Means and standard deviations do not
reflect logarithmic transformations.

95
Condition and Group Differences in Phi Coefficients. Although children did not
form significant illusory correlation effects on the attribution task, a test of condition and
grade differences was nevertheless performed to test the original hypothesized condition
X grade interaction. Phi coefficients were first transformed to normalize significantly
skewed distributions by adding two to each phi coefficient and performing a log
10
transformation. The transformed phi scores were subjected to a 2(group membership:
majority, minority) X 2(grade: 2
nd
, 5
th
grade) analysis of variance. The results showed no
significant differences in grade or condition. This analysis was repeated including
children’s sentence memory scores as a covariate to remove variance due to differences
in memory capacity. Results again indicated no significant effects.
Accuracy of Attributions. To determine whether children showed increased
memory for certain group-behavior associations, the proportion of positive and negative
behaviors correctly attributed to each group was examined. Proportions of positive and
negative behaviors that were correctly attributed to the majority and minority groups
were calculated, and were submitted to a 2(participant condition: majority group,
minority group) X 2(grade: 2
nd
, 5
th
) X 4(target condition: majority-positive, majority-
negative, minority-positive, minority-negative) mixed-design ANOVA with Target
Condition as a within-subjects variable. There was a significant main effect of Target
Condition, F(3, 363)=3.5, p=.02. Post-hoc analyses on the contrasts of theoretical
interest (
α
=.01) indicated that a significantly greater proportion of positive behaviors
than negative behaviors was correctly attributed to the majority group, t(124)=3.6,
p<.001, but there was no difference in the proportion of positive and negative behaviors
attributed to the minority group. There was also a trend towards more correct attributions
of positive behaviors to the majority group than to the minority group, t(124)=1.7, p=.09,
but the proportion of negative behaviors correctly attributed to the majority group versus
the minority group did not differ (see Table 10 for means). Thus, children’s memory
biases tended to be towards making more correct attributions for positive behaviors to the
majority group. This finding is in contrast to that of Study 1, in which children tended to
make more correct attributions for negative behaviors to the minority group.

96
Frequency Estimations
On the frequency estimation task, it was predicted that children in both the
Majority and Minority groups would estimate a greater proportion of negative behaviors
to have been performed by the outgroup compared to the ingroup, based on the expected
ingroup favoritism effects. Fifth-graders were expected to show less ingroup favoritism
than second-graders; therefore, it was predicted that, compared to second-graders
assigned to the Minority group, fifth-graders assigned to the Minority group would show
attenuated illusory correlations, or even illusory correlations between the minority group
and negative behaviors, because their frequency estimations should be more strongly
influenced by shared-infrequency effects, which would lead to an overestimation of
minority-negative behaviors. Likewise, fifth-graders assigned to the Minority group were
Table 10
Study 2: Proportion of Positive and Negative Behaviors Correctly Attributed to the
Majority and Minority Groups
Group-Behavior Association
Majority- Majority Minority- Minority-
n Positive Negative Positive Negative
Condition
Majority Group Members
Second-Graders
32
.82 (.18) .77 (.27)
.75 (.21)
.84 (.39)
Fifth-Graders
29
.93 (.10) .88 (.17)
.93 (.11)
.88 (.32)
Grades Combined
61
.87 (.15) .82 (.23)
.84 (.19)
.86 (.36)
Minority Group Members
Second-Graders
33
.89 (.12) .75 (.29)
.84 (.26)
.76 (.31)
Fifth-Graders
31
.92 (.10) .80 (.27)
.90 (.20)
.82 (.30)
Grades Combined
64
.91 (.11) .77 (.28)
.87 (.24)
.79 (.31)
Conditions Combined
125
.89 (.14) .80 (.26)
.85 (.22)
.82 (.33)
NOTE: Standard deviations are shown in parentheses. Means and standard deviations do
not reflect logarithmic transformations.

97
expected to be less influenced by ingroup favoritism effects, which would lead to an
overestimation of minority-positive behaviors.
The numbers of majority and minority group members that children estimated to
have performed negative behaviors were converted to proportions by dividing the
estimated number of behaviors by 12 for the majority group, and 6 for the minority
group. One was added to the proportions to remove all zero values, and log
10
transformations were performed to normalize the distributions. These scores were
entered into a 2(condition: majority group, minority group) X 2(grade: 2
nd
, 5
th
) X 2(target
group: majority group, minority group) mixed-design analysis of variance, with Target
Group as a within-subjects variable.
Results showed a significant main effect of Target Group, F(1, 121)=40.0,
p<.001, with children estimating a greater proportion of negative behaviors to have been
performed by the minority group than the majority group. The expected Condition X
Grade X Target Group interaction approached significance, F(1, 121)=3.4, p=.07.
Because differences in second- and fifth-graders’ memory capacities were expected, the
analysis was repeated including sentence memory as a covariate. When memory was
controlled, the main effect of Target Group remained significant, F(1, 120)=5.7, p=.02,
and the Condition X Grade X Target Group interaction was also significant, F(1,
120)=4.2, p=.04. Post-hoc analyses (
α
=.01) were performed on the contrasts of interest
to ascertain the trends within each condition. Frequency estimations for children
assigned to the Majority and Minority groups were compared within each condition at
each grade level separately.
Estimations of negative behaviors were significantly greater for the minority
group than the majority group for second-graders assigned to the Majority group,
t(31)=3.6, p=.001, fifth-graders in the Majority group, t(28)=4.2, p<.001, and second-
graders assigned to the Minority group, t(32)=3.6, p=.001. However, estimations of
negative behaviors in the majority and minority groups did not differ among fifth-graders
assigned to the Minority group, t(30)=1.5, n.s. (see Table 11 for means).

98
The results for children assigned to the Minority group are quite interesting in that
second-graders showed no sign of their frequency estimations being influenced by
ingroup favoritism. Fifth-graders, on the other hand, did not estimate significantly more
negative behaviors in their own group than the outgroup, although the trend was towards
a larger proportion of negative behaviors attributed to the minority group. This effect
could reflect more accurate memory for the group-behavior associations due to age-
related increases in memory for the self-relevant groupings, or it could reflect increased
ingroup favoritism among fifth-graders assigned to the Minority group.
Group Evaluations
Children were expected to show ingroup favoritism in their group evaluations.
That is, they were expected to evaluate their own group more favorably than the
outgroup. It was predicted that second-graders would show greater ingroup favoritism
Table 11
Study 2: Estimated Frequency of Occurrence of Negative Behaviors
in the Majority and Minority Groups
Target Group
Condition n Majority Minority
Majority Group Members
Second-Graders
32
.35 (.15)
.47 (.21)
Fifth-Graders
29
.35 (.13)
.51 (.19)
Grades Combined
61
.35 (.14)
.49 (.20)
Minority Group Members
Second-Graders
33
.33 (.14)
.49 (.22)
Fifth-Graders
31
.40 (.17)
.46 (.21)
Grades Combined
64
.36 (.16)
.47 (.21)
Conditions Combined
125
.36 (.15)
.48 (.21)
NOTE: Standard deviations are shown in parentheses. Means and
standard deviations do not reflect logarithmic transformations.

99
effects than fifth-graders; second-graders were therefore expected to show greater
differences in their evaluations of the majority and minority groups. In addition,
evaluations of the majority and minority groups were expected to be based on the illusory
correlations children formed. Thus, phi coefficients and frequency estimations should
predict evaluations of the groups.
Condition and Grade Differences in Evaluations. Evaluations were subjected to
a 2(group membership: majority vs. minority) X 2(grade: 2
nd
, 5
th
) X 2(target group:
majority vs. minority) mixed-design ANOVA, with Target Group as a within-subjects
variable. The expected Group Membership X Grade X Target Group interaction was not
significant, F(1, 121)=2.6, n.s. However, there was a significant Group Membership X
Target Group interaction, F(1, 121)=17.8, p<.001.
Post-hoc analyses (
α
=.025) on the hypotheses of interest indicated that, as
expected, children in the Majority group evaluated the majority more positively than the
minority group, t(60)=3.6, p=.001, whereas children in the Minority group evaluated the
minority group more positively than the majority group, t(63)=-2.3, p=.02 (see Table 12
for means). Thus, children evaluated the ingroup more favorably than the outgroup, but
there was no attenuation of the ingroup favoritism effect among fifth-graders, as had been
predicted.

100
Regression Analyses. To examine whether children’s illusory correlations
predicted their evaluations, three regression models were tested. The first two contained
only simple predictors, and the third block included interaction variables. Model 1 tested
the predictive power of grade and condition. Condition was dummy coded as 1 and –1,
representing Majority and Minority group membership, respectively, and grade was
entered as 2 or 5. The dependent variable was created by subtracting the evaluation
rating for the minority group from the rating for the majority group, yielding scores
ranging from –6 to 6. Six was added to each score to create positive numbers ranging
from 0 to 12, with scores below six representing evaluations in favor of the minority
group, and scores above six representing evaluations in favor of the majority group. For
Model 1, the overall regression model was significant, F(2, 122)=9.5, p<.001, adjusted
R
2
=.12. Only Condition was a significant predictor in this model.
In Model 2, grade and condition, as well as phi coefficients, and frequency
estimation were regressed onto evaluation scores. Phi and frequency estimation were
again entered into a single regression model because the correlation between the two
variables was relatively low. The frequency estimation predictor variable was created by
Table 12
Study 2: Mean Evaluation Ratings of the Majority and Minority Groups
Target Group
Condition n Majority Minority
Majority Group Members
Second-Graders
32
5.2 (1.5)
4.2 (1.6)
Fifth-Graders
29
5.1 (1.0)
4.2 (1.1)
Grades Combined
61
5.1 (1.3)
4.2 (1.3)
Minority Group Members
Second-Graders
33
4.1 (1.3)
5.1 (1.2)
Fifth-Graders
31
4.6 (1.2)
4.7 (1.1)
Grades Combined
64
4.4 (1.3)
4.9 (1.2)
Conditions Combined
125
4.7 (1.3)
4.6 (1.3)
NOTE: Standard deviations are shown in parentheses.

101
subtracting the proportion of negative behaviors estimated for the majority group from
the proportion of negative behaviors estimated for the minority group, and one was added
to the scores to create nonzero numbers, with scores below one representing illusory
correlations in favor of the minority group, and scores above one representing illusory
correlations in favor of the majority group. For Model 2, the overall model was
significant, F(4, 120)=11.2, p<.001, adjusted R
2
=.25, and the R
2
change was significant
(R
2
change=.14, F(2, 120)=11.3, p<.001). Condition and Frequency Estimation emerged
as significant predictors of differences in evaluations of the majority and minority groups.
Phi also approached significance as a predictor (see Table 13 for alpha values and beta
weights, and Table 14 for zero-order correlations among the variables). Thus, children’s
group membership predicted differences in evaluations independently in both models. As
expected, children’s illusory correlations also predicted differences in evaluations of the
two groups, and adding the illusory correlation variables significantly reduced error in the
regression model, underscoring their importance in children’s group evaluations.
Because condition was an independent predictor of evaluations, a third regression
model with the added interaction variables of phi X condition and frequency estimation X
condition was tested to examine whether illusory correlation effects affected evaluations
differently for children assigned to the Majority and Minority groups. These interaction
variables were created by multiplying the variable that was entered into the regression
alone by condition (1 or –1), and subtracting the mean score of the original variable.
Model 3 was significant, F(6, 118)=7.5, p<.001, adjusted R
2
=.24. Frequency estimation
again predicted differences in evaluations, and phi approached significance as a predictor.
However, neither interaction variable was significant, and there was no change in R
2
.
These findings suggest that the condition to which children were assigned (i.e., the
Majority or Minority group) influenced their evaluations, but not through an interaction
with illusory correlation effects. Rather, group membership alone was sufficient to
motivate certain patterns of evaluations. Furthermore, illusory correlation effects
influenced children’s evaluations in the same way regardless of whether children were in
the Majority or Minority group.

102
Table 13
Study 2: Regression Models Predicting Differences in Evaluations of the Majority and
Minority Groups
Unstandardized Standardized
Predictor Beta Weight Beta Weight t p Partial r
Model 1 (R
2
=.12)
Grade
0.12
.09
1.0
.32
.09
Condition
0.74
.36
4.3
<.001
.36
Model 2 (R
2
=.25)
Grade
0.16
.11
1.4
.15
.13
Condition
0.72
.35
4.4
<.001
.38
Phi Coefficient
86.70
.14
1.7
.09
.15
Frequency Estimation
2.90
.30
3.6
<.001
.32
Model 3 (R
2
=.24)
Grade
0.17
.12
1.5
.13
.12
Condition
1.05
.51
1.1
.26
.09
Phi Coefficient
84.58
.14
1.7
.10
.13
Frequency Estimation
2.93
.30
3.6
<.001
.28
Phi X Condition
41.57
.07
0.8
.42
.07
Frequency Est. X Condition -0.32
-.18
-0.4
.70
-.04

103
Summary of Results
Results for Children Assigned to the Majority Group. Neither second- nor fifth-
graders formed significant illusory correlations on the attribution task. On the frequency
estimation task, however, both second- and fifth-graders assigned to the Majority group
overestimated the proportion of negative behaviors in the minority group compared to the
majority group. Second- and fifth-graders in this condition also evaluated the majority
group more favorably than the minority group. In addition, the illusory correlations
children formed predicted the difference in evaluation of the majority and minority
groups, but membership in the majority group also predicted this difference, indicating
the importance of both illusory correlations and ingroup favoritism on relative
Table 14
Study 2: Zero-Order Correlations Between Illusory Correlation Tasks and
Evaluations by Condition
Grade
Sentence
Memory
Phi
Coefficient
Frequency
Estimations
Evaluations
Grade
1.00
.67**
-.10
.11
-.06
Sentence
Memory
.48**
1.00
-.11
.03
-.02
Phi
Coefficient
-.03
-.16
1.00
.24
.27*
Frequency
Estimations
-.21
-.24
.41**
1.00
.33**
Evaluations .23
.18
.23
.40**
1.00
NOTE: Correlations for Majority group members are listed above the diagonal.
Correlations for Minority group members are listed below the diagonal.
NOTE: Frequency Estimation=estimation for minority - majority group
NOTE: Evaluations=evaluation for majority - minority group
*Correlation is significant at the .05 level (2-tailed).
**Correlation is significant at the .01 level (2-tailed).

104
evaluations of the groups. See Figure 7 for a graphic representation of Majority group
findings.
Results for Children Assigned to the Minority Group. Results for Minority
group members were similar to those for Majority group members. Neither second- nor
fifth-graders formed significant illusory correlations on the attribution task. Minority
group children did form an illusory correlation between the minority group and negative
behaviors on the frequency estimation task. Despite the direction of this illusory
correlation, Minority group children evaluated the minority group more positively than
the majority group. However, both membership in the Minority group and the illusory
correlations these children formed predicted differences in evaluations of the majority
and minority groups. Thus, when Minority group children formed stronger illusory
correlations between the minority group and negative behaviors, they were less likely to
evaluate the minority group more positively than the majority group. See Figure 8 for a
graphic representation of Minority group findings.
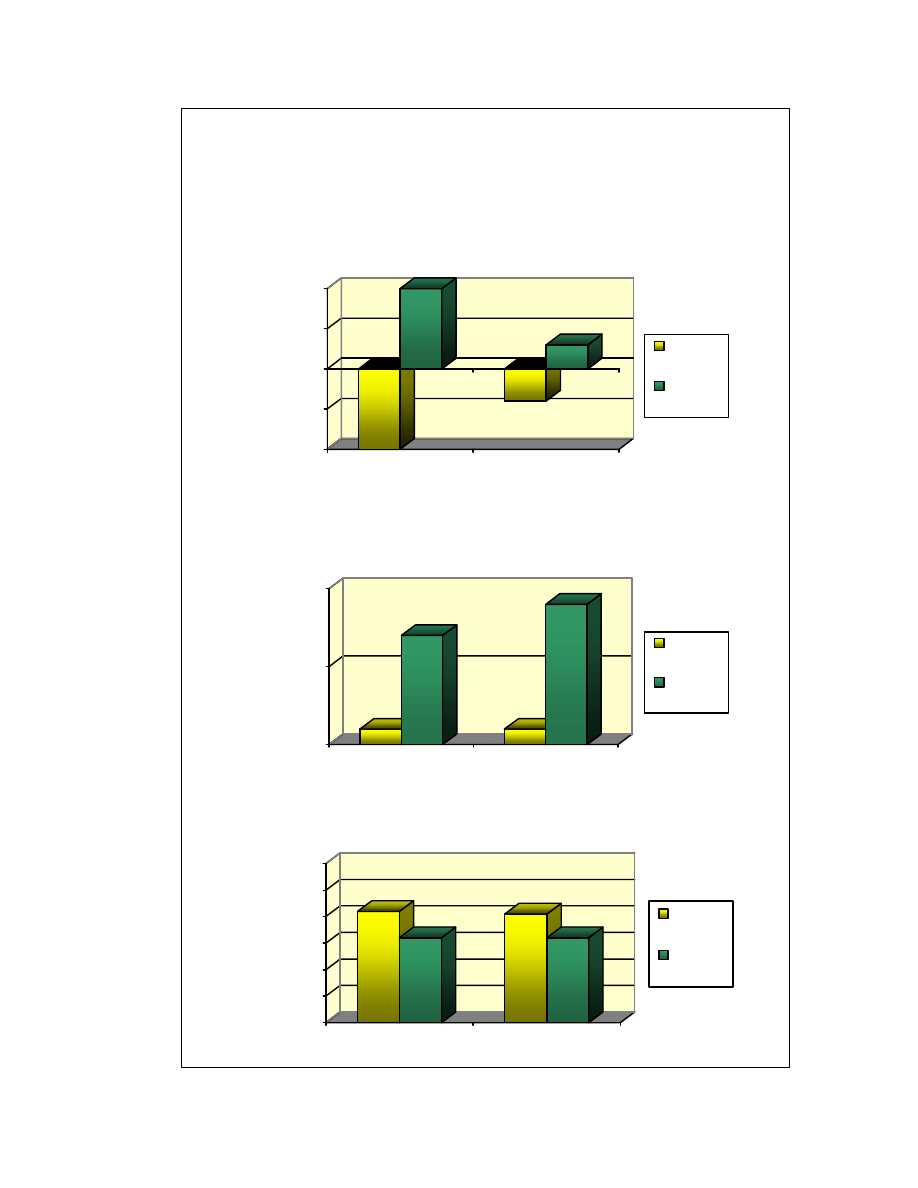
105
Summary of Findings for Majority Group Members
Deviation from Actual Proportion of Negative Behaviors
Deviation from Actual Proportion of Negative Behaviors

106
Summary of Findings for Minority Group Members
Deviation from Actual Proportion of Negative Behaviors
Deviation from Actual Proportion of Negative Behaviors

107
Discussion
Study 2 examined the influences of cognitive biases towards attending to and
overestimating minority-negative behaviors, and motivational biases of ingroup
favoritism when children are members of one of the target groups on children’s illusory
correlations. For children assigned to the Minority group, motivational biases were
expected to be in conflict with the cognitive biases. Thus, illusory correlations in this
unique situation were of interest.
It was hypothesized that children’s illusory correlations would favor the ingroup,
particularly for Majority group children because both cognitive and motivational biases
should lead to an illusory correlation between the minority group and negative behaviors.
One possible qualification, however, was that illusory correlations might have been
attenuated on the attribution measure because children may have paid closer attention to
the group-behavior associations because they were self-relevant in this study. This
increased attention could have led to increased accuracy and decreased illusory
correlation effects.
Age differences were also predicted, particularly with respect to ingroup
favoritism effects. Second-graders were expected to show more ingroup favoritism than
fifth-graders. Thus, illusory correlation effects and group evaluations that favor the
ingroup were expected to be stronger for second-graders. This prediction is particularly
important in the hypotheses for Minority group members. Because second-graders
should show stronger ingroup favoritism, any effects of the distinctive minority-negative
behaviors were expected to be compensated by ingroup favoritism, leading to more
favorable perceptions of the minority group. For fifth-graders in the Minority group, on
the other hand, ingroup favoritism effects should have declined by this age, and illusory
correlations may therefore not favor the ingroup as much, but rather be attenuated, or
even favor the outgroup.
On the attribution task, perceptions were quite accurate, and there were no
significant illusory correlation effects. Children in both the Majority and Minority

108
groups slightly overattributed negative behaviors to the minority group, but phi
coefficients were not significantly different from zero for any group of children. There
were also no differences across grades or conditions in the extent to which children
formed illusory correlations. The only pattern of incorrect attributions suggests that
children were influenced by the distinctiveness of the minority-negative behaviors;
however, children showed no significant distortion in their attributions, perhaps because
the self-relevance of the information made their memory for the group-behavior
associations more accurate, or because their attributions became more accurate with
practice following Study 1.
Examination of correct attributions showed that children made more correct
attributions for majority-positive behaviors. This finding could indicate that they were
using on-line processing to form an impression of each group that was revised as each
group-behavior association was presented. On-line processing would mean that children
should have attended to the more frequent behaviors in forming impressions; thus, they
would have paid special attention to the majority-positive behaviors. There are
discrepancies in children’s attributional distortions and their correct attributions that
make it unclear whether children were processing information on-line, or using memory-
based processing when completing the attribution measure. The lack of significant phi
coefficients, and the higher proportion of majority-positive behaviors that was correctly
attributed are consistent with on-line processing strategy, but the actual pattern of
attributions, in which negative behaviors were overattributed to the minority group, is
consistent with memory-based processing. Given these results, it is possible that children
used both types of processing on the attribution task. Interestingly, the direction of
children’s illusory correlations, on the attribution task and especially on the frequency
estimations task, underscores the importance of a cognitive bias to associate negative
behaviors with the minority group.
On the frequency estimation task, second- and fifth-graders overestimated the
proportion of negative behaviors performed by the minority group. For Majority group
children, this illusory correlation effect could occur either through the distinctiveness of

109
the minority-negative behaviors or ingroup favoritism for the majority group. With these
two biases acting in conjunction, children in the Majority group could certainly be
expected to form this type of illusory correlation.
Among children assigned to the Minority group, second-graders perceived an
illusory correlation between the minority group and negative behaviors on the frequency
estimation task. Fifth-graders perceived a larger proportion of negative behaviors in the
minority group, but did not form significant illusory correlations. Thus, the perceptions
of second-graders in the Minority group appear to have been influenced mainly by the
distinctiveness of the minority-negative behaviors, and not strongly influenced by
ingroup favoritism. There are two possible explanations for why the fifth-graders in the
Minority group did not form significant illusory correlations. One possibility is that these
children’s perceptions were simply more accurate than those of second-graders or fifth-
graders in the Majority group. Examination of correct attributions shows that fifth-
graders in the Minority group were quite accurate in their attributions, but no more
accurate than fifth-graders in the Majority group, who did form significant illusory
correlations on the frequency estimation task. If accuracy on the attributions task can be
presumed to predict accuracy on frequency estimations, then the explanation that fifth-
graders in the Minority group formed no illusory correlations on the frequency
estimations due to increased accuracy is perhaps unlikely. Another possibility is that
fifth-graders’ perceptions may have been affected by ingroup favoritism such that the
motivation to view the minority group positively negated any cognitive bias to
overestimate minority-negative behaviors. Interestingly, this explanation would imply
that fifth-graders showed more ingroup favoritism than second-graders, although the
reverse finding was predicted.
Although Minority group children did not show illusory correlations in favor of
their own group, but rather showed no illusory correlations or illusory correlations that
favored the outgroup, their group evaluations nevertheless were more positive for their
own group than for the majority group. Thus, the effects of ingroup favoritism were very
clear on the evaluation measure. Children in the Majority group also rated the ingroup

110
more positively, but this effect would be expected whether children were basing their
evaluations on ingroup favoritism or the illusory correlations they formed.
The regression analyses provided further support that children’s group
membership influenced their evaluations, but that evaluations were not solely influenced
by ingroup favoritism. Group membership was a significant independent predictor of the
difference between evaluations of the majority and minority groups. The extent to which
children formed illusory correlations also predicted the difference in evaluations of the
majority and minority groups. However, the predictive power of group membership did
not interact with illusory correlation effects. That is, for Majority group members,
stronger illusory correlations between the minority group and negative behaviors
predicted a greater difference in evaluations of the majority and minority group, with
evaluations favoring the majority group. For Minority group members, stronger illusory
correlations also predicted evaluations of the majority group that were more favorable
compared to evaluations of the minority group. Thus, although Minority group members
evaluated the minority group more favorably than the majority group on average, those
children who formed stronger illusory correlations between the minority group and
negative behaviors also evaluated the minority and majority groups less differently than
children who formed weaker illusory correlations. Furthermore, examination of
individual scores showed that some of these Minority group children evaluated the
majority group more positively than the minority group.
Distinctiveness versus Ingroup Favoritism
Children’s group perceptions were clearly affected by both cognitive biases that
make infrequent information distinctive and more memorable, as well as ingroup
favoritism. The clearest effect of ingroup favoritism was found on the evaluations.
Minority group children evaluated the ingroup more favorably than the outgroup, despite
the fact that they estimated more negative behaviors to have been performed by minority
group members than majority group members. Other possible ingroup favoritism effects

111
are less clear. The lack of significant phi coefficients could have been influenced by
ingroup favoritism insofar as children’s desire to view their own group positively may
have led them to notice the ingroup-positive behaviors, and may also have made ingroup-
negative behaviors more salient because they had to reconcile the negative behaviors with
their positive ingroup preconceptions. However, the insignificant phi coefficients also
could have been caused by increased attention to the group-behavior associations due to
the self-relevance of the groups, or to practice effects. The lack of significant differences
in Minority group fifth-graders’ frequency estimations could also have been affected by
ingroup favoritism. Increased ingroup favoritism among these fifth-graders could have
caused them to estimate fewer minority group-negative behaviors than they otherwise
would have, which decreased the illusory correlation effect. The direction of their
frequency estimations was towards greater estimation of minority-negative behaviors,
suggesting that the distinctiveness of the minority-negative behaviors was quite
influential in their perceptions.
There is also support for effects of distinctiveness of shared-infrequent
information on illusory correlations. Both Majority and Minority group members
estimated more minority-negative behaviors than majority-negative behaviors, indicating
that the paired-infrequent information was particularly salient and tended to be
overestimated. Although children’s phi coefficients were not significantly different than
zero, examination of their attributions indicated a tendency to overattribute negative
behaviors to the minority group. Thus, distinctive information clearly played a role in
children’s illusory correlations, even when children were members of the Minority group
and the distinctive information led to more negative perceptions of their own group.
The Role of Memory
Children’s memory capacity appears to have played a different role in Study 2
than in Study 1. When children were not told that they were members of one of the target
groups, their scores on the sentence memory task mediated their illusory correlations, at

112
least to some extent. However, when children were told that they were members of a
target group, memory did not mediate their perceptions. Sentence memory had no effect
on attributions. It did act as a covariate in the frequency estimations, but not as a
mediator. Rather, it removed enough variance to make other effects more apparent,
rather than removing condition or age effects. Thus, memory was important in children’s
frequency estimations, but illusory correlations were based on memory distortions due to
the distinctiveness of the minority-infrequent behaviors, rather than on memory capacity.

113
Chapter 4
STUDY 3:
FORMATION OF ILLUSORY CORRELATIONS
ABOUT GENDER GROUPS
The purpose of Study 3 was to further explore the development of illusory
correlations in self-relevant groups by using real social groups as target stimuli. The
processes involved in the formation of illusory correlations may be similar when children
perceive completely unfamiliar groups and familiar groups in a specific setting.
However, the latter case may be more strongly influenced by prior expectations about the
groups. Whereas the belief that one’s own social group will behave favorably is the only
prior expectation that is likely to affect illusory correlation formation when groups are
completely novel, other expectations, such as specific stereotypes or more general
attitudes about what a group is like, may affect illusory correlations about familiar
groups. Given that second- and fifth-graders already have extensive knowledge, and
therefore prior expectations, about many different social groups, it is important to explore
the formation of illusory correlations in familiar social groups as well as novel groups. In
addition, ingroup favoritism may have more or less impact when social groups are real
than when they are fictitious minimal groups. Gender groups served as the social groups

114
in Study 3, and Majority and Minority status was assigned to the participants by
manipulating the number of target girls and boys in a stimulus task group.
It is important to note that although gender groups do not differ in the overall
population, the balance of females and males is unequal in many situations. For example,
girls are often in the minority on mixed-sex little league sports teams, boys are often in
the minority in home economics classes, and women are a small minority in certain
professions such as engineering. Thus, the situation in Study 3 does not represent many
social situations in which gender groups are relatively balanced, but is representative of
some situations. To more closely parallel such situation-specific perceptions of gender
groups, the target behaviors used in Study 3 occurred within a single scenario of children
working together on a school project.
Method
Participants
Participants were the same children who participated in Studies 1 and 2.
Materials and Procedure
The majority and minority groups consisted of either 12 target girls and 6 target
boys, or 12 target boys and 6 target girls. Children were told that the target girls and boys
were an elementary school class working on a big school project together. As in Studies
1 and 2, each target child was associated with either a positive or negative behavior, none
of which were used in Studies 1 and 2, and each group performed twice as many positive
behaviors as negative behaviors (see Appendix B, Set D for a list of Study 3 behaviors).
The target behaviors were all related to work on a group project for school. The
drawings of girls and boys used in the preceding studies, but with uncolored t-shirts, were
used for the group-behavior assignments. Either a boy or a girl was paired with each

115
photograph, and children were shown drawings of both boys and girls on the attribution
and frequency estimation tasks.
On the frequency estimation task, more realistic drawings of girls and boys than
the minimalist line drawings used in Studies 1 and 2 were used to more closely represent
real groups. In addition, each of the targets in the frequency estimation graphic were
different, more clearly representing distinct children. However, the same minimalist line
drawings used in Studies 1 and 2 were used to present the group-behavior associations
and on the attribution task to avoid children becoming too concerned with remembering
which specific target, rather than which group, performed each behavior on the
attribution task if 18 different targets were used.
The procedure was identical to that of Study 2 with the exception that, rather than
choosing a color group, the participants’ sex determined whether they were Majority or
Minority group members. Because gender groups are very salient to children (McGraw,
Durn, & Durnam, 1989; McGraw, Durm, & Patterson, 1983; Serbin & Sprafkin, 1986),
participants’ gender or their membership in one of the target groups was not explicitly
mentioned. Following the presentation of the group-behavior associations, children
completed an attribution task, a frequency estimation task, and group evaluations similar
to those used in Studies 1 and 2. On the evaluation task, reliabilities among the
descriptors was high for Study 3 (alpha reliability coefficient=.89 for majority group
ratings, and .90 for minority group ratings). Testing took place during a second testing
session, usually several weeks after testing for Study 1 and Study 2 was completed.
Results
The analyses for Study 3 were identical to those in Study 2. Each analysis was
first performed including participant sex as a factor to test for sex differences. No main

116
effects or interactions with sex
2
were found for any of the measures, and main effects
and interactions that did not involve sex remained significant whether or not sex was
included as a variable in the analysis of variance. Sex was therefore excluded from any
of the reported analyses.
Attribution Task
The predictions for Study 3 were the same as those for Study 2. Children were
expected to attribute a larger proportion of positive behaviors to the ingroup than the
outgroup. Thus, positive phi coefficients were predicted for children assigned to the
Majority group, and negative phi coefficients were predicted for children assigned to the
Minority group. If children’s attributions showed any such influence of ingroup
favoritism, older children were expected to show less of this effect. Alternatively, it was
expected that children might show no illusory correlations due to the increased memory
for the group-behavior associations that is motivated by the self-relevance of the
information.
Tests for Significance of Phi Coefficients. Attributions were converted to phi
coefficients, and these scores were first tested for significance against zero. Analyses
were performed separately for each condition and grade level.
Fifth-graders assigned to the Majority group had phi scores significantly below
zero, t(31)=-2.7, p=.01, but phis did not differ from zero for second-graders in the
Majority group, t(31)=-0.4, n.s. (see Table 15). Mean numbers of positive and negative
behaviors attributed to each group were examined to ascertain how the positive and
negative attributions were distributed between the groups. Both second-and fifth-graders
assigned to the Majority group had negative phi scores, and the attributional trends were
2
For the attribution task, sex main effect F(1, 117)=0.6, n.s.; Sex X Condition F(1, 117)=0.8, n.s.; Sex X
Condition X Grade F(1, 117)=0.9, n.s. For the frequency estimation task, Sex X Target Condition F(1,
117)=0.0, n.s.; Sex X Condition X Target Condition F(1, 117)=0.0, n.s.; Sex X Condition X Grade X
Target Condition F(1, 117)=0.1, n.s. For the group evaluations, Sex X Target Group F(1, 117)=0.5, n.s.;
Sex X Condition X Target Group F(1, 117)=0.0, n.s.; Sex X Condition X Grade X Target Group F(1,
117)=0.1, n.s.

117
similar for these groups of children. Children tended to underattribute positive behaviors
to the majority group, and overattribute positive behaviors to the minority group.
However, their attributions for negative behaviors were quite accurate (see Table 16).
Better memory for the negative behaviors would be expected given children’s supposed
self-involvement in the target groups, but even children in the Majority group showed a
bias towards attributing more positive behaviors to the minority group, possibly
suggesting a preexisting bias towards viewing both girls and boys positively.
For children assigned to the Minority group, second-graders had phi scores
significantly below zero, t(32)=-3.8, p=.001, but phis were not significantly different
from zero for fifth-graders assigned to the Minority group, t(27)=0.8, n.s. (see Table 15).
Examination of the conditional probabilities showed that, like Majority group members,
these children tended to underattribute positive behaviors to the majority group and
overattribute positive behaviors to the minority group. Interestingly, fifth-graders in the
Minority group had positive phi coefficients, contrary to predictions, although their phi
scores were not significantly different than zero. These children tended to overattribute
negative behaviors to the minority group, but also overattributed positive behaviors to the
minority group (see Table 16). However, because their phi coefficients indicated no
significant illusory correlation effect, it is not clear that these attributional trends are
meaningful.

118
Table 15
Study 3: Mean Phi Coefficients
Condition n Mean Phi Coefficient* SD
Majority Group Members
Second-Graders
32
-0.02
0.33
Fifth-Graders
32
-0.09
0.19
Grades Combined
64
-0.06
0.27
Minority Group Members
Second-Graders
33
-0.11
0.17
Fifth-Graders
28
0.04
0.25
Grades Combined
61
-0.04
0.22
Conditions Combined
125
-0.05
0.25
*Phi coefficients were multiplied by 100 to increase ease of interpretation
in the table only.
NOTE: Means and standard deviations do not reflect logarithmic transformations.
Table 16
Study 3: Mean Conditional Probabilities of Positive and Negative Behaviors
Attributed to the Majority and Minority Groups
Group-Behavior Association
Majority- Majority- Minority- Minority-
n Positive Negative Positive Negative
Correct Conditional
Probabilities
.67
.67
.33
.33
Condition
Majority Group Members
Second-Graders
32
.62 (.15)
.65 (.13)
.38 (.15)
.35 (.13)
Fifth-Graders
32
.59 (.08)
.66 (.12)
.41 (.08)
.34 (.12)
Grades Combined
64
.61 (.12)
.65 (.12)
.39 (.12)
.35 (.12)
Minority Group Members
Second-Graders
33
.56 (.08)
.65 (.11)
.44 (.09)
.35 (.11)
Fifth-Graders
28
.62 (.09)
.59 (.12)
.38 (.09)
.41 (.12)
Grades Combined
61
.59 (.09)
.62 (.12)
.41 (.09)
.38 (.11)
Conditions Combined
125
.60 (.11)
.64 (.12)
.40 (.11)
.36 (.12)
NOTE: Standard deviations are shown in parentheses. Means and standard deviations do not
reflect logarithmic transformations.

119
Condition and Grade Differences in Phi Coefficients. Group differences in phi
scores were expected. Specifically, children assigned to the Majority group were
expected to have higher phi scores than children assigned to the Minority group. Among
Minority group members, second-graders were expected to show stronger ingroup
favoritism effects in their illusory correlations than fifth-graders. The distribution of phi
coefficients was normalized by adding two to each score and performing log
10
transformations. These scores were examined using a 2(condition: majority group,
minority group) X 2(grade: 2
nd
, 5
th
) X 2(target group: majority, minority) mixed-design
ANOVA with Target Group as the within-subjects variable. The predicted Condition X
Grade interaction was significant, F(1, 121)=6.2, p=.01.
Post-hoc analyses (
α
=.01) revealed that second-graders assigned to the Majority
vs. Minority groups did not differ in the degree to which they formed illusory correlations
on the attribution task, t(64)=0.9, n.s. Fifth-graders assigned to the Minority group had
significantly higher phi scores than fifth-graders assigned to the Minority group,
t(59)=2.6, p=.03, and this effect was due to the former group’s mean phi coefficient being
positive and the latter group’s mean phi coefficient being negative.
For children assigned to the Majority group, fifth-graders and second-graders did
not differ, t(63)=0.5, n.s. For children assigned to the Minority group, fifth-graders had
significantly higher phi scores than second-graders, t(60)=3.8, p=.008. This effect is
again due to fifth-graders’ having a positive mean phi score, whereas second-graders had
a negative mean phi score. Thus, the observed group differences were due to negative
mean phi scores among all groups except fifth-graders assigned to the Minority group,
who had a positive mean phi score.
The analysis for group differences in phi scores was repeated using sentence
memory as a covariate. The transformed phi scores were analyzed using a 2(condition) X
2(grade) ANCOVA with memory as a covariate. Results revealed that the Condition X
Grade interaction remained significant, F(1, 120)=5.6, p=.02, and no other effects
emerged. Thus, the observed group differences in phi scores were not accounted for by
differences in memory.

120
Accuracy of Attributions. The proportion of correct attributions made to the
majority and minority groups was also examined. Fifth-graders were expected to show
better memory for the group-behavior associations than second-graders. It was also
predicted that children would show better memory for negative behaviors in the minority
group, and Minority group members were expected to show particularly good memory
for this group-behavior association. Alternatively, because children tend to show better
memory for schema-consistent behaviors, which should be positive behaviors in one’s
own group, Minority group members could be expected to remember minority-positive
behaviors better than minority-negative behaviors.
The proportions of positive and negative behaviors correctly attributed to the
majority and minority groups were subjected to a 2(participant condition: majority group,
Minority group) X 2(grade: 2
nd
, 5
th
) X 4(target condition: majority-positive, majority-
negative, minority-positive, minority-negative) mixed-design analysis of variance, with
Target Condition as a within-subjects variable. There was a main effect of Target
Condition, F(3, 363)=5.5, p=.001. This effect was subsumed by a Participant Condition
X Grade X Target Condition interaction, F(3, 363)=3.1, p=.03. Post-hoc analyses were
performed to compare correct attributions across the four group-behavior combinations
within each grade and participant condition. The alpha level was set at
α
=.003 (.05/16)
to compensate for family-wise error.
The analyses indicated that second-graders assigned to the Majority group did not
differentially remember any group-behavior associations. Fifth-graders assigned to the
Majority group correctly attributed more positive behaviors to the minority group than
the majority group, t(31)=3.2, p=.003. They also correctly attributed more negative than
positive behaviors to the majority group, although this contrast did not reach the alpha
level set for the post-hoc analyses, t(31)=2.4, p=.02 (see Table 17 for means). Thus,
children in the Majority group did not show the expected memory effects, but rather
appear to have had better memory for group-behavior associations that were expected to
be inconsistent with the expectation that the ingroup would behave more positively than
the outgroup.

121
Unlike children assigned to the Majority group, second-graders assigned to the
Minority group made more correct attributions for negative than positive behaviors to the
majority group, t(32)=3.8, p=.001, and for positive behaviors to the minority group than
the majority group, t(32)=5.5, p<.001. Fifth-graders assigned to the Minority group
correctly attributed more negative behaviors to the minority group than the majority
group, t(27)=2.6, p=.02, but this contrast did not meet the alpha level set for the post-hoc
analyses (see Table 17 for means). Thus, second-graders in the Minority group showed
memory effects suggestive of ingroup favoritism in attention to the positive and negative
behaviors. These children made more correct attributions for negative behaviors than
positive behaviors to the outgroup, but correctly attributed more positive behaviors than
negative behaviors to the ingroup. In contrast, fifth-graders in the Minority group made
more correct attributions of negative behaviors than positive behaviors to the ingroup,
suggesting that they were especially attentive to their own group’s negative behaviors.
Table 17
Study 3: Proportion of Positive and Negative Behaviors Correctly Attributed to the
Majority and Minority Groups
Group-Behavior Association
Majority- Majority Minority- Minority-
n Positive Negative Positive Negative
Condition
Majority Group Members
Second-Graders
32
.84 (.18)
.91 (.20)
.82 (.26)
.88 (.25)
Fifth-Graders
32
.85 (.13)
.93 (.15)
.95 (.12)
.91 (.20)
Grades Combined
64
.84 (.14)
.92 (.17)
.88 (.21)
.89 (.23)
Minority Group Members
Second-Graders
33
.81 (.14)
.93 (.13)
.95 (.12)
.92 (.18)
Fifth-Graders
28
.88 (.09)
.86 (.17)
.92 (.15)
.96 (.13)
Grades Combined
61
.84 (.12)
.90 (.15)
.94 (.13)
.94 (.16)
Conditions Combined
125
.84 (.14)
.91 (.16)
.91 (.18)
.92 (.20)
NOTE: Standard deviations are shown in parentheses. Means and standard deviations do not
reflect logarithmic transformations.

122
Frequency Estimations
In their frequency estimations, children in the Majority group were expected to
estimate the minority group to have performed a greater proportion of negative behaviors
than the majority group. In contrast, children in the Minority group were expected to
estimate a greater proportion of negative behaviors in the majority group, which would be
consistent with ingroup favoritism effects, and second-graders were expected to show this
effect more strongly than fifth-graders. However, if Minority group members were to
estimate a larger proportion of negative behaviors in the minority group, this effect would
be consistent with cognitive biases that should lead to an overestimation of negative
behaviors in the minority group.
The numbers of negative behaviors children estimated for the majority and
minority groups were converted to proportions, one was added to each score to create
non-zero numbers, and the distribution of scores was normalized using a log
10
transformation. The transformed proportion scores were entered into a 2(condition:
majority group, Minority group) X 2(grade: 2
nd
, 5
th
) X 2(target group: majority, minority)
mixed-design ANOVA with Target Group as a within-subjects variable. The predicted
three-way interaction was not significant, F(1, 121)=0.4, n.s. However, there was a
significant main effect of Target Group, F(1, 121)=21.1, p<.001, with children estimating
a larger proportion of negative behaviors in the minority group than the majority group
(see Table 18 for means). Thus, children associated the minority group with negative
behaviors, regardless of their own group membership.

123
This analysis was repeated as an analysis of covariance with sentence memory
scores as a covariate. The main effect of Target Group was no longer significant, F(1,
120)=2.9, p=.09, and no other effects emerged. The decrease in the effect of Target
Group due to the memory covariate suggests that memory may have mediated children’s
illusory correlations on this task. To complete a mediation analysis, the correlation
between sentence memory scores, and the difference between the proportion of negative
behaviors estimated for the minority versus majority group was calculated. The
correlation was negative, r = -.13, indicating that as memory scores improved, illusory
correlation effects decreased. However, the correlation was not significant, suggesting
that children’s memory ability did not entirely account for the illusory correlations they
formed.
Group Evaluations
It was predicted that children would have more positive evaluations of their own
group than the outgroup, and that second-graders would show more of an ingroup
Table 18
Study 3: Estimated Frequency of Occurrence of Negative Behaviors
in the Majority and Minority Groups
Target Group
Condition n Majority Minority
Majority Group Members
Second-Graders
32
.30 (.16)
.42 (.21)
Fifth-Graders
32
.40 (.09)
.46 (.14)
Grades Combined
64
.35 (.13)
.44 (.18)
Minority Group Members
Second-Graders
33
.37 (.18)
.42 (.19)
Fifth-Graders
28
.40 (.11)
.43 (.12)
Grades Combined
61
.38 (.15)
.43 (.16)
Conditions Combined
125
.37 (.14)
.43 (.17)
NOTE: Standard deviations are shown in parentheses. Means and
standard deviations do not reflect logarithmic transformations.

124
favoritism effect than fifth-graders. Furthermore, it was hypothesized that illusory
correlation effects would predict differences in evaluations for the majority and minority
groups.
Condition and Grade Differences in Evaluations. To test differences in
evaluations of the majority and minority groups, children’s nine evaluation ratings for
each group were averaged into single evaluation scores for the majority and minority
groups. The composite ratings of the two groups were subjected to a 2(condition:
majority group, minority group) X 2(grade: 2
nd
, 5
th
) X 2(target group: majority, minority)
mixed-design analysis of variance. There was a main effect of Target Group, F(1,
121)=4.4, p=.04, and a significant Condition X Target Group interaction, F(1, 121)=46.9,
p<.001. These effects were subsumed by the predicted Condition X Grade X Target
Group interaction, F(1, 121)=17.4, p<.001.
To further examine this three-way interaction, post-hoc analyses were conducted
on the contrasts of theoretical interest (
α
=.01). These analyses showed that second-
graders assigned to the Majority group evaluated the majority group more positively than
the minority group, t(31)=4.0, p<.001. Fifth-graders in the Majority group, however, did
not evaluate the groups differently, t(31)=0.2, n.s. Second-graders assigned to the
Minority group evaluated the minority group more positively than the majority group,
t(32)=-5.5, p<.001, as did fifth-graders assigned to the Minority group, t(27)=-3.1, p=.004
(see Table 19 for means). These findings suggest that second-graders in both groups, as
well as fifth-graders in the Minority group, showed favoritism towards the ingroup on the
evaluations. However, fifth-graders in the Majority group showed the expected age-
related decrease in ingroup favoritism on this measure.

125
Regression Analyses. The variables that contributed to children’s evaluations
were examined using regression analyses. The dependent variable was calculated by
subtracting evaluation ratings for the minority group from ratings for the majority group.
Six was then added to these scores to create positive numbers. Three models were again
tested. Model 1 contained grade and condition regressed onto evaluation ratings. Grade
was entered as 2 or 5, and condition was dummy coded as 1 and –1 (Majority and
Minority group member, respectively). This model was significant, F(2, 122)=21.8,
p<.001, adjusted R
2
=.25. Only Condition was a significant predictor in this model.
Model 2 included grade and condition, and added phi coefficients and frequency
estimation as predictors. The frequency estimation variable was created by subtracting
the estimated proportion of negative behaviors in the majority group from that estimated
for the minority group, and adding one to make all scores positive. Model 2 was
significant, F(4, 120)=22.0, p<.001, adjusted R
2
=.40, and accounted for significantly
more variance than Model 1 (R
2
change=.16, F(2, 120)=16.6, p<.001). Condition, Phi,
and Frequency Estimation contributed significantly to the model (see Table 20 for alpha
values and beta weights, and Table 21 for zero-order correlations among the variables).
Table 19
Study 3: Mean Evaluation Ratings of the Majority and Minority Groups
Target Group
Condition n Majority Minority
Majority Group Members
Second-Graders
32
5.4 (0.9)
4.2 (1.4)
Fifth-Graders
32
4.4 (0.8)
4.4 (0.8)
Grades Combined
64
4.9 (1.0)
4.3 (1.1)
Minority Group Members
Second-Graders
33
3.7 (1.3)
5.5 (1.0)
Fifth-Graders
28
4.2 (1.0)
4.9 (0.7)
Grades Combined
61
3.9 (1.2)
5.2 (0.9)
Conditions Combined
125
4.4 (1.2)
4.7 (1.2)
NOTE: Standard deviations are shown in parentheses.

126
Thus, as children estimated more negative behaviors in the minority group compared to
the majority group, evaluations also became more positive for the majority versus the
minority group.
Condition acted as an independent predictor in both Model 1 and Model 2. To
examine whether the effects of condition were due to differences in the predictive power
of phi and frequency estimation among children in the Majority and Minority groups, a
third regression analysis was performed including interaction variables of phi X condition
and frequency estimation X condition. Model 3 was also significant, F(6, 118)=15.0,
p<.001, but there was no change in R
2
, adjusted R
2
=.40. Phi and Frequency Estimation
again emerged as significant predictors. However, neither interaction variable was
significant. Thus, condition predicted differences in evaluations of the majority and
minority groups independent of its influence on illusory correlation effects. That is,
children tended to evaluate the ingroup more favorably than the outgroup, but the
influence of illusory correlation effects was the same for children in both groups.

127
Table 20
Study 3: Regression Models Predicting Differences in Evaluations of the Majority and
Minority Groups
Unstandardized Standardized
Predictor Beta Weight Beta Weight t p Partial r
Model 1 (R
2
=.25)
Grade
-0.04
-.03
-0.4
.71
-.03
Condition
1.00
.51
6.6
<.001
.51
Model 2 (R
2
=.40)
Grade
-0.02 -.01
- 0.2
.85
-.02
Condition
0.92
.48
6.8
<.001
.53
Phi Coefficient
176.03 .22
3.1
.002
.27
Frequency Estimation
3.40
.29
3.9
<.001
.34
Model 3 (R
2
=.40)
Grade
0.01
.01
0.1
.93
.01
Condition
0.26
.14
0.3
.80
.02
Phi Coefficient
153.12 .19
2.6
.01
.18
Frequency Estimation
2.91
.25
3.1
.002
.21
Phi X Condition
67.79 .09
1.1
.26
.08
Frequency Est. X Condition 0.66
.37
0.7
.49
.05

128
Summary of Results
Results for Children Assigned to the Majority Group. Second-graders assigned
to the Majority group did not show significant illusory correlations on the attribution task.
Fifth-graders showed significant illusory correlations between the minority group and
positive behaviors, contrary to expectations. Fifth-graders also made more correct
attributions of positive behaviors to the minority group than any other group-behavior
combination, consistent with the illusory correlation they formed. On the frequency
estimation task, both second- and fifth-graders in the Majority group overassociated
negative behaviors with the minority group. Finally, second-graders evaluated the
majority group more positively than the minority group, but fifth-graders in the Majority
group did not evaluate the groups differently. Both the illusory correlations children
Table 21
Study 3: Zero-Order Correlations Between Illusory Correlation Tasks and
Evaluations by Condition
Grade
Sentence
Memory
Phi
Coefficient
Frequency
Estimations
Evaluations
Grade
1.00
.67**
-.13
-.14
-.39**
Sentence
Memory
.46**
1.00
-.20
-.14
-.31**
Phi
Coefficient
.34**
.28
1.00
.43**
.54**
Frequency
Estimations
-.08
-.13
-.13
1.00
.57**
Evaluations .33**
.28*
.09
.16
1.00
NOTE: Correlations for Majority group members are listed above the diagonal.
Correlations for Minority group members are listed below the diagonal.
NOTE: Frequency Estimation=estimation for minority - majority group
NOTE: Evaluations=evaluation for majority - minority group
*Correlation is significant at the .05 level (2-tailed).
**Correlation is significant at the .01 level (2-tailed).

129
formed and their group membership predicted differences in evaluations of the two
groups, and this effect did not differ by grade. A graphic representation of these findings
Results for Children Assigned to the Minority Group. Second-graders assigned
to the Minority group formed significant illusory correlations between the minority group
and positive behaviors on the attribution task, but fifth-graders did not. The trend among
fifth-graders’ attributions was an overattribution of both negative and positive behaviors
to the minority group. Consistent with these findings, second-graders made more correct
attributions of negative behaviors to the majority group and positive behaviors to the
minority group, whereas fifth-graders made more correct attributions of negative
behaviors to the minority group. However, on the frequency estimation task, second- and
fifth-graders formed an illusory correlation between the minority group and negative
behaviors. On their evaluations, both second- and fifth-graders evaluated the minority
group more positively than the majority group, despite showing the opposite impression
on the frequency estimation task. However, children’s illusory correlations as well as
their group membership predicted the difference in evaluation of the majority and
minority groups. Thus, children’s illusory correlations as well as their membership in the
Minority group predicted their relative evaluations of the groups. A graphic

130
Summary of Findings for Majority Group Members
Deviation from Actual Proportions of Negative and Positive Behaviors
Deviation from Actual Proportion of Negative Behaviors

131
Summary of Findings for Minority Group Members
Deviation from Actual Proportion of Negative and Positive Behaviors
Deviation from Actual Proportion of Negative Behaviors

132
Discussion
Study 3 examined illusory correlation formation using gender groups. Thus, as in
Study 2, children were members of one of the target groups, but unlike Study 2, the target
groups were actual social categories rather than minimal groups. This situation was of
both theoretical and practical importance not only because it employed real social
groupings, but also because it represents a case in which children may have prior
expectations about the positivity and negativity of the groups. Although this study
measured impressions of the gender groups in a given situation, children’s extensive
knowledge of gender groups may introduce biases in perceptions of the experimental
situation that are due to expectations about the groups’ behavior. In addition, unlike
Study 2 in which children’s membership in a target group was made explicit, the
experimenter did not mention the participants’ gender, and children’s own group
membership therefore could have been less salient than in Study 2. However, the results
suggest that children’s own membership in a gender group was sufficiently salient to
produce ingroup favoritism effects on the evaluations that were similar to those found in
Study 2. Importantly, not making the perceivers’ group membership salient may be more
representative of most real social situations in which perceivers’ group membership is
made salient by the situation, rather than by a bystander mentioning the perceiver’s social
group.
The predictions for Study 3 were the same as those for Study 2, and in general,
the results were similar. As in Study 2, children overestimated the frequency of negative
behaviors in the minority group on the frequency estimation task, and tended to evaluate
their own group more favorably than the outgroup. However, there were a few key
differences, particularly on the attribution task. Second-graders assigned to the Majority
group and fifth-graders assigned to the Minority group showed no significant illusory
correlations on the attribution task, but fifth-graders assigned to the Majority group and
second-graders assigned to the Minority group overattributed positive behaviors to the
minority group, although negative behaviors were less frequent and should therefore have

133
been more salient. The overassociation of positive behaviors with the minority group in
these cases appears to be due to increased salience of the positive behaviors in the
minority group, which children’s greater accuracy in making attributions for minority-
positive behaviors suggests. The possibility that children had a priori expectations for
the minority group to behave more positively is unlikely given that children
overestimated negative behaviors in the minority group on the frequency estimation task.
In addition, girls and boys each served as the majority and minority group for half the
participants; thus, if children had expectations about one gender behaving better than the
other, the counterbalancing of gender in the majority and minority groups should have
diluted the effects of such an expectation.
There are three remaining explanations for why minority-positive behaviors were
more salient. First, children could have had a prior expectation that the minority group
would engage in more negative behaviors than the majority group, and may have been
surprised by the minority-positive behaviors, thus making them more salient. However,
findings from Study 1 call into question the validity of this explanation. Results from
Study 1 suggested that negative behaviors were far more salient than positive behaviors,
and that children did not have a priori notions that the minority group would behave
more negatively. A second possible explanation is that children had expected that the
gender groups would not differ significantly in the number of positive and negative
behaviors performed by each. If this was the case, the overattribution of positive
behaviors to minority group members might indicate a compensatory effect. That is,
children may have tried to attribute closer to half of the positive behaviors to the minority
group because they expected the behaviors to be distributed in this way. Thus, they may
have perceived that the minority group engaged in more negative behaviors than the
majority group, as shown by their frequency estimations, but they may have tried to
compensate for this perception on the attribution task by attributing additional positive
behaviors to the minority group. Finally, a third explanation is that this effect was due to
idiosyncratic stereotypic beliefs that led children to attribute certain behaviors to one
gender because they believed that gender group was more likely to perform that behavior.

134
However, the behaviors used in Study 3 were chosen such that no behavior was
consistently rated as masculine or feminine by the children or adults who completed the
preliminary behavior ratings. In addition, the behaviors assigned to the majority and
minority group were counterbalanced across children, as were the assignments of girls
and boys to majority and minority status. Thus, every effort was taken to avoid the
systematic influence of gender stereotypes in Study 3.
On the frequency estimation task, children were clearly susceptible to the biasing
influence of shared infrequency. Indeed, even Minority group members perceived an
illusory correlation between the minority group and negative behaviors on the frequency
estimation task. Among Minority group members, ingroup favoritism did not ameliorate
this effect. Ingroup favoritism did appear to have influenced group evaluations, however.
Minority group members evaluated their own group more positively than the outgroup,
despite the opposite perception shown on the frequency estimations.
As in Studies 1 and 2, few age-related effects were found in the formation of
illusory correlations. These effects were mostly confined to the attribution task, and were
not consistent across ages and group membership status. However, predictions relating to
age-related decreases in ingroup favoritism were also partially supported on the
evaluations. Second-graders in the Majority group evaluated the ingroup more
positively, but fifth-graders in the Majority group showed no differences in their
evaluations of the groups. Thus, as expected, ingroup favoritism motives did not lead
fifth-grade Majority group children to rate their own group more positively than the
outgroup. Among Minority group members, however, there was no age-related decrease
in ingroup favoritism. Rather, both second- and fifth-graders evaluated the ingroup more
favorably, even though they had perceived an illusory correlation between their own
group and negative behaviors, clearly demonstrating the power of ingroup favoritism
motives.

135
Chapter 5
GENERAL DISCUSSION
The most clear-cut conclusion that can be drawn from these three studies is that
children tend to form illusory correlations between minority groups and negative
behaviors. Furthermore, the illusory correlations children formed, particularly those
measured by the frequency estimations, were related to less positive evaluations of the
minority group, suggesting that children were responding to the discrepancy in the
perceived proportions of positive and negative behaviors in the target groups, and that
their affective response to the target groups was based on their perceptions of the groups’
behavior.
It appears that this tendency comes not from a general expectation that smaller
groups will behave less desirably than larger groups, but to a susceptibility to the biasing
effects of infrequency. When one type of behavior is less frequent than another, the less
frequent class of behaviors becomes more salient. Likewise, when one social group has
fewer members than another, the behaviors of any given member of the minority group
are more salient than behaviors of majority group members. When less frequent
behaviors are paired with minority group members, this group-behavior combination is
especially salient, is remembered more accurately, and becomes overrepresented in
children’s memory of how the minority group behaved. Therefore, children overestimate

136
how often the minority group members perform infrequent behaviors, which may often
be negative because most people’s behavior probably consists of mainly positive or
neutral acts. Thus, children may falsely associate negative behaviors with the minority
group.
In all three studies, children who saw negative behaviors less frequently than
positive behaviors formed illusory correlations between the minority group and negative
behaviors. Although this effect was not always found on the attribution task, it was
found consistently on the frequency estimation task. It did not matter whether children
were ostensibly members of one of the target groups or not; they overestimated negative
behaviors in the minority group, even if this meant that they reported more negative
behaviors by their own social group.
Additional evidence that these illusory correlations are due to the shared
infrequency of certain group-behavior associations, rather than preexisting expectations
that minority groups will behave more negatively than majority groups, is offered by the
findings from the Positive-Infrequent condition in Study 1. When positive behaviors
were less frequent than negative behaviors, children overestimated the frequency of the
positive behaviors in the minority group, and also evaluated the minority group more
positively than the majority group. These findings suggest that it is the frequency of the
information, not just the valence of the behaviors, that influences illusory correlations and
resulting evaluations. However, it is important to note that there was also evidence that
negative behaviors performed by the minority group were also particularly salient in the
Positive-Infrequent condition. Thus, illusory correlations between minority groups and
negative behaviors are probably more likely than between minority groups and positive
behaviors, even if the minority group’s observed positive behaviors are relatively
infrequent.

137
The Relative Influence of Distinctiveness and Ingroup Favoritism
The biasing effects of distinctive information and ingroup favoritism appear to
affect cognitive and affective measures differently. The distinctiveness of minority-
infrequent information, especially negative behaviors by the minority group, affected
children’s perceptions of the relative frequency of certain behaviors in each of the target
groups. That is, distinctiveness influenced children’s perceptions of how good or bad
each group’s behavior was. However, ingroup favoritism had its most powerful effect on
group evaluations, which measure an affective component of children’s perceptions.
Although children’s illusory correlations predicted their relative evaluations of the target
groups, children’s group membership was also a strong predictor. Each variable made an
independent contribution to the regression equation, suggesting that children’s
evaluations were not based entirely on their perceived group-behavior associations, but
were also influenced by the motivation to rate the ingroup favorably.
The different avenues of influence of cognitive versus motivational biases are
most evident in the perceptions of children assigned to the minority groups. These
children perceived their own group to have engaged in proportionally more negative
behaviors than the outgroup; nevertheless, they evaluated their own group more
positively than the outgroup on such dimensions as goodness, niceness, friendliness, and
wanting to play with the target children. Clearly this is a bias owing to a desire to
perceive the ingroup more favorably than the outgroup. Thus, on the evaluation measure,
motivational forces were able to outweigh the cognitive bias that had caused an
association of the ingroup with negative behaviors, resulting in a more positive rating of
the ingroup. However, ingroup favoritism was not able to outweigh the cognitive bias on
the illusory correlation measures, and minority group members believed the behavior of
their own group to have been more negative than the behavior of the majority group.

138
Age Differences in Illusory Correlation Formation
Age Differences in Cognitive Bias. Although age differences were found on the
attribution measure in some conditions across the studies, there were no consistent age
differences on this measure. Illusory correlations measured by frequency estimations
were very consistent across ages in each of three studies. In every condition, second- and
fifth-graders formed similar illusory correlations. The finding that second-graders
formed illusory correlations indicates that this tendency develops rather early. The
finding that fifth-graders formed similar illusory correlations shows that it is not a
tendency that wanes with age. Indeed, previous studies have found consistent evidence
of both cognitive and motivational biases that lead to illusory correlations in adults.
The sentence memory subscale from the Stanford-Binet Intelligence Scales
showed improvement with age. Scores on this measure also mediated age differences in
illusory correlations in Study 1, and removed some variance in responses on other
measures in Study 2 so that differences in perceptions of the target groups became
statistically significant. However, illusory correlations are apparently not due entirely to
differences in the ability to remember the information in these studies. Rather, they
appear to be due to a bias in the perception of infrequent information that makes this
information become overrepresented in memory. Furthermore, this bias does not appear
to have changed substantially from second- to fifth-grade, or indeed by adulthood. This
bias is perhaps more related to frequency perception than to memory, per se. Frequency
perception appears to be governed by an automatic encoding process, which Hasher and
Zacks (1984) argued is innate (Antell & Keating, 1983; Starkey & Cooper, 1980) and
undergoes no developmental change (Hasher & Zacks, 1979).
Despite other developmental changes that occur between second- and fifth-grade,
such as improvements in memory (e.g., Bjorkland & Muir, 1988; Brainerd, 1981; Chi &
Ceci, 1987; Ornstein et al., 1975; Ruff & Lawson, 1990; Stodolsky, 1974; Strutt et al.,
1975), base-rate estimation (Jacobs et al., 1995; Jacobs & Potenza, 1991), and judgment
of covariation (e.g., Shaklee & Mimms, 1981; Shaklee & Paszek, 1985), there was no

139
substantial age-related change in susceptibility to illusory correlations between the
second- and fifth-grades. The lack of age differences suggests that the perceptual bias
underlying illusory correlations is at least a very early developing bias. Given that the
ability to perceive frequency is arguably innate (Hasher & Zacks, 1984), the bias towards
paying more attention to infrequent information may also be innate. However, an innate
tendency or early developing bias does not preclude any developmental change. Other
cognitive abilities certain play a role in social perception, and must also play a role in the
processes involved in illusory correlation formation. It is possible that the age range
tested was not large enough to show consistent age differences. Perhaps more dramatic
age differences would appear if other age groups were tested, for example, infants and
toddlers using modified methodologies. If the bias leading to illusory correlations is
indeed innate, however, the overall trend of illusory correlation formation might remain
similar at all testable ages. If the tendency to overassociate infrequent stimuli with a
smaller group is present at all ages, then children should not show dramatic variation in
the tendency to associate negative behaviors with minority groups. Any observed
differences might be specific to certain measures requiring other types of abilities, rather
than to large changes in the cognitive bias leading to illusory correlation.
Support for an overall trend in illusory correlation formation while specific age-
related changes are observed can be found in a recent study on illusory correlation
formation in young adults and older adults (Mutter, 1999). This study found nearly
identical patterns of frequency estimation in older and younger adults, but slightly
different patterns of attributions among younger and older adults on the attribution task.
These age differences appeared to be due to differences in information processing
strategies, which were probably related to memory decreases in older adults. However,
the findings indicated that older adults were not more or less susceptible to illusory
correlations than younger adults, although the cognitive accessibility of specific group-
behavior associations declined with age.
Age Differences in Ingroup Favoritism Effects. Although ingroup favoritism
has been shown to decrease sharply by about 10 years of age, fifth-graders in this study

140
tended to show as much ingroup favoritism as second-graders in their group perceptions.
The most apparent case of a decrease in ingroup favoritism among fifth-graders was in
Study 3, in which Majority group members did not evaluate the ingroup more favorably
than the outgroup, whereas Majority group second-graders did. Another case in which
ingroup favoritism may have influenced perceptions is in Minority group fifth-graders’
frequency estimations in Study 2. These children did not estimate more negative
behaviors in the minority group, whereas second-graders in the Minority group, as well
as second- and fifth-graders in the Majority group did overestimate minority group-
negative behaviors. This instance could suggest an effect of increased ingroup favoritism
among Minority group fifth-graders, which could have led them to estimate fewer
negative behaviors in their own group, or proportionally more negative behaviors in the
majority group. However, this finding is far from unequivocal because this result could
have been due to better memory or attention to the stimuli, or better base-rate or
covariation judgment, which simply made this group of children more accurate at
perceiving the equality of the two groups.
The findings relating to ingroup favoritism suggest that there was certainly no
decrease in ingroup favoritism among fifth-graders assigned to the Minority groups. The
only decrease in ingroup favoritism effects was found in fifth-graders assigned to a
Majority group. These findings are particularly interesting when considered in light of
adult studies on the self-esteem buffering effects of social identity for minority group
members. Research has shown that minority group members can protect themselves
from the negative psychological effects of experiencing prejudice by increasing their
identification with their minority social group (Branscombe, Schmitt, & Harvey, 1999;
Ruggiero & Major, 1998; Ruggiero & Marx, 1999; Ruggiero & Taylor, 1995; 1997).
When identification with a social group increases, the individual’s attitude towards the
group is likely to become somewhat more favorable as well (Branscombe & Ellemers,
1998). Furthermore, when social identity is threatened, for instance, by negative attitudes
about one’s group from outgroup members, group members tend to respond by increasing
attempts to positively differentiate the ingroup from the outgroup (Brown, 1995). Thus,

141
members of the threatened group may show increased ingroup favoritism when group
members perceive that others see the group as inferior. A similar effect might have taken
place with children assigned to Minority groups in the present research. Minority group
children might have responded to their perceived association between their group and
negative behavior by increasing their ingroup favoritism. Although ingroup favoritism
did not affect their perceptions of the number of negative behaviors performed by each
group, it did affect their group evaluations. The fact that fifth-graders in the Minority
group did not show a decrease in ingroup favoritism effects on the evaluations in either
Study 2 or Study 3, while fifth-graders in the Majority group did show a decrease in
Study 3, may suggest a compensatory effect of ingroup favoritism motivated by a need to
protect collective self-esteem among Minority group members. This question is certainly
worthy of further research to determine whether children do react to minority group
status by employing such strategies as negotiating their social identity.
Comparison of Illusory Correlations in Children and Adults. It is important to
note that the findings from the current research on the effects of self-relevance of the
group-behavior associations on illusory correlations are not consistent with those of adult
studies. Schaller and Maass (1989) found that being a member of one of the target
groups affected both attributions and frequency estimations. On frequency estimation
tasks, adults estimated the ingroup to have performed proportionally more positive
behaviors than the outgroup, even when they were assigned to the minority group,
demonstrating a biasing effect in ingroup favoritism. In contrast, they attributed more
negative behaviors to the ingroup on the attribution task, and also recalled more ingroup-
behavior behaviors on a free recall measure, presumably because reconciling the ingroup-
negative behaviors with their positive expectations for the ingroup required more
effortful processing of this information, making it more available in memory. However,
adult illusory correlations in situations in which participants are ostensibly members of
one of the target groups are due partly to on-line processing of the group-behavior
associations, rather than memory-based judgments made when completing the illusory
correlation tasks (Schaller & Maass, 1989). That is, adults’ impression formation appears

142
to begin early in the presentation of the group-behavior information, and is continuously
updated as new information is presented. This kind of processing leads to a perceived
association between the groups and more frequent information, whereas memory-based
judgments lead to a perceived association between the smaller group and infrequent
information. Thus, ingroup favoritism motivates adults to view the ingroup more
positively before presentation of the group-behavior associations, and on-line processing
of the information allows adults to confirm their notions that the ingroup did indeed
perform many positive behaviors.
Children’s illusory correlations showed a somewhat different pattern than adults’
illusory correlations when the children were assigned to one of the target groups. Both
Majority and Minority group children’s illusory correlation between the minority group
and negative behaviors suggests that children in the current studies did not engage in on-
line processing while attending to the group-behavior associations. This may be an
important developmental change that emerges in children older than the fifth-graders in
these studies. On-line processing necessarily requires more working memory than
memory-based judgments. When memory-based processing is used in illusory
correlation studies, during the presentation of the group-behavior associations, the group-
behavior information must receive only enough processing to go into long-term memory
store to be made available for later recall. When asked to make judgments about the
target groups, the information can be accessed from long-term store, and group
impressions can then be made. In on-line processing of such information, the group-
behavior associations must be held in working or short term memory in order to compare
new information with the information presented previously. In addition, comparisons of
the relative proportion of positive and negative behaviors in each group must be made as
the new information is received. Such processing demands may be beyond the capability
of second- and fifth-graders.
However, on-line versus memory-based judgments have not been examined in
children, and it is unknown what the age-related limitations and developmental course of
on-line processing are. In Mutter’s (1999) study on illusory correlations in young and

143
older adults, participants were expected to use on-line processing in their perception of
the group-behavior associations. She found that young adults’ memory and judgment
data suggested that they used on-line processing in their group perceptions, but older
adults used a mix of on-line and memory-based processing. Perhaps the memory
requirements of on-line processing were too considerable for older adults to be able to
use a primarily on-line processing strategy, and they therefore relied partially on
memory-based processing to make judgments.
If memory decrements in older adults can impede the use of on-line processing in
illusory correlation tasks, then perhaps children’s less developed memories also impede
on-line processing. Thus, on-line processing of group-behavior information may be one
important developmental achievement that leads to later age-related changes in illusory
correlations. The development of on-line processing strategies in children could actually
improve minority group members’ ingroup perceptions, because employing on-line
processing results in illusory correlations between the minority group and positive
behaviors among minority group perceivers.
Limitations of the Current Studies
Perhaps the greatest limitation of these studies was due to the attribution task
adapted from the adult literature. Because this task is particularly sensitive to slight
variations in memory for the specific group-behavior associations, it may be less
appropriate for use with children than the frequency estimation and evaluation tasks,
which measure more general group impressions. The unexpected results on the
attribution tasks may have occurred because children cannot be expected to show the
same consistency of attention and recognition as adults. Whereas adults make mistakes
in their attributions, they tend to make very consistent mistakes of overattribution of the
infrequent behaviors to the minority group. Children in these studies, on the other hand,
showed inconsistency in their patterns of attributions across conditions and across
studies. Furthermore, because children’s “guesses” about which group performed each

144
behavior were assessed, it is difficult to determine from these data whether children’s
unexpected attributional patterns resulted from salience of group-behavior associations
other than those hypothesized to be most salient, prior expectations about the types of
behaviors each group would perform, particularly where the behaviors were self-relevant,
or simply to memory decrements across all types of group-behavior associations.
Although children’s attributions in these studies were quite accurate, with proportions of
correct attributions falling between 70% and 95%, it is not clear what proportion of these
were actually correctly remembered and what proportion were simply good guesses.
Thus, certain group-behavior associations could appear to have been highly salient due to
high rates of correct attributions, but they could represent luck in making attributions
rather than real memory due to the salience of the stimuli.
Perhaps a better of method of determining whether illusory correlations result
from increased salience of minority-infrequent behavior, and whether minority-infrequent
behaviors are more likely to be highly salient when the infrequent behaviors are negative
than when they are positive would be to assess the group-behavior associations that
children think they remember correctly. In essence, this amounts to measuring children’s
free recall of the information, as more salient information should be better remembered
on free recall tasks. However, this type of assessment can be modified to ease the
demands on children’s memory. For example, the experimenter might show each child
the photographs depicting the target behaviors, place the pictures of a majority and
minority group member on either side of the photograph to facilitate recognition, and ask
whether the child is sure she remembers the association or is only guessing.
Another major limitation to these studies is that in Studies 2 and 3, cognitive and
motivational biases could, and indeed were expected to exert simultaneous influence on
children’s judgments. It is therefore difficult to determine unequivocally the extent to
which each type of bias affected judgments. To be able to parse out the effects of each,
only one type of bias can be possible when making judgments. However, because
illusory correlations have been traditionally viewed as primarily due to a specific
cognitive bias, illusory correlation studies have usually compared frequent and infrequent

145
behaviors in majority and minority groups. Testing only the effects of ingroup favoritism
on illusory correlations would require removing the possibility of a cognitive bias due to
group size and stimuli frequency, but such a methodology would amount to essentially a
study of ingroup favoritism rather than a study of self-relevant illusory correlations.
However, a careful comparison of illusory correlations where children are not members
of the target groups, where participants are members of the target groups, and assessment
of ingroup favoritism effects when cognitive biases are removed, using the same
behaviors across these conditions to eliminate any effects that particular behaviors might
have on salience of group-behavior associations or on group-level judgments, might
provide more insight into just how these cognitive and motivational biases influence
illusory correlations, and why illusory correlations may be different among children
assigned to a Majority group versus a Minority group.
A third possible constraint on the interpretation of the results is that the same
number of targets were used for second- and fifth-graders. If the 18 group-behavior
associations were easy for fifth-graders to remember, this might explain the lack of
significant phi coefficients among fifth-graders in several conditions across the three
studies. However, the number of targets was sufficient to produce illusory correlations in
fifth-graders on the frequency estimation tasks. Primi and Agnoli (1998) used only 21
targets in their illusory correlation studies, and found memory barely above chance for
children in the same age groups; thus, it is difficult to predict the most appropriate
number of targets. In addition, children in the current studies showed slightly better
memory for the group-behavior associations in the studies in which they were assigned
membership in a target group than in Study 1. Because children participated in all three
studies and the studies were conducted in the same order to avoid certain spill-over
effects, it is impossible to determine from these data whether children’s attributions were
more correct in Studies 2 and 3 because the information was self-relevant, or because of
practice effects.
The materials used in these studies could have caused some of the inconsistencies
in the findings. Any aspect of the materials or methodology could have influenced

146
results in an undesirable way, including the colors chosen for the groups, the use of
minimal groups or gender groups as targets, the order, speed, or method of presenting the
group-behavior associations, or the way in which participants were assigned group
membership. Perhaps the most questionable materials were the target behaviors, the
pictures of target children, and the types of target groups employed. Although the
behaviors were pilot tested to test for consistency of their valence and extremity, some
behaviors may nonetheless have been better suited to the experimental manipulation than
others. In particular, certain behaviors may have stood out more than others, increasing
their salience independent of the frequency and group association manipulations, and thus
causing unexpected variations in children’s memory for those group-behavior
associations.
The use of minimal groups has been shown to be effective in many studies with
children, particularly in studies of ingroup favoritism (Brown, 1994). Nevertheless,
children’s group-level judgments on illusory correlation tasks may be different for
minimal groups and real social groups. This possibility was examined by using gender
groups in Study 3, but gender groups could be a unique example of majority and minority
groups because they are equal in the general population, and Study 3 relied on the
inequality of gender groups in a given situation. Without a comparison to other real
social groups, it is impossible to know whether illusory correlations in perceptions of
other groups, for examples, Blacks and Whites, would be similar to those obtained for
gender groups or minimal groups.
Likewise, the stimuli representing target children in these studies were simple line
drawings, and the same drawing represented all the children in each group. There is
some possibility that children would respond differently to more realistic drawings, or
even to videotaped children or photographed children with their faces and bodies shown,
or to target groups consisting of distinct children rather than the same stimulus
representing each child.
Finally, the experimental design and stimuli used in these studies were not
ecologically valid. Like most experiments, they have the advantage of controlling for

147
many unwanted variables and presenting a situation in which the presence of particular
biases can be assessed, but they do not closely resemble a real world social situation.
Until illusory correlations are tested using more realistic stimuli and more realistic social
situations, the generalizability of these findings can only be speculated. However, these
studies are among the first research on illusory correlation in children, and this first step
to understanding whether children form illusory correlations under carefully controlled
circumstanced needed to be taken.
Practical Implications
Perhaps the most important implication of children’s illusory correlations is that
these perceptions may lead to negative stereotypes about and prejudice towards
minorities. Stereotypes are stable cognitive representations of behaviors and
characteristics that are perceived to be associated with one group, and prejudice is an
affective attitude towards a group, which is likely to be based on the stereotypes. The
illusory correlations measured in these studies assessed only a momentary perceptual and
affective response to a specific set of stimuli. While it is likely that these perceptions
could lead to stable stereotypes, the possibility has not been tested.
Stereotypes formed from illusory correlations may not have the “grain of truth”
that some stereotypes have. Thus, they could be rooted in a totally false perceptual basis.
Not only would the generalization of the stereotypes to individual group members be
incorrect and unfair, but also the belief that the group in general is more likely to engage
in certain behaviors could be unfounded. Unfortunately, the possibilities for illusory
correlations between minority groups and negative behaviors are pervasive. Minorities
are often portrayed negatively on television and in movies (Graves, 1993; Huston et al.,
1992), and even real examples of minority group members’ negative behavior may lead
to false stereotypes due to illusory correlations. For example, a non-Black child watching
a newscast in which a photograph of an Black man is shown while this man’s recent
violent behavior is reported may perceive an association between Blacks and violence.

148
The relative infrequency with which the child witnesses the behavior of Blacks,
combined with the salience of the negative behavior, may make this association more
salient than cases in which the child has witnessed Blacks behaving positively, which are
likely to be more numerous. The association between the Black man and violent
behavior could become a cognitive representation of Blacks, or Black men, in general,
and this stereotype could then lead to prejudice towards Blacks, and aversion to and
discrimination against Blacks as a group. In contrast, consider the example of a White
child who watches a similar newscast featuring a story about a White man who
committed the same violent act. Because the White child’s experience with other Whites
is likely to be so vast, an illusory correlation between Whites and violent behavior is
unlikely.
Another important implication of children’s tendency to form illusory correlations
is that minority group members may also be likely to develop negative impressions of
their own social groups, simply because the negative behaviors of the smaller group are
so salient. What does forming negative stereotypes about one’s own group, but having
more favorable evaluations the group mean for overall group and self-impressions? Can
these contradictory perceptions be reconciled so as to preserve a positive group attitude?
It is possible that over time, if negative stereotypes about one’s own minority social
group persist, evaluations of the ingroup may also become less favorable than evaluations
of the majority group. Again, the more positive ingroup evaluations in the current
research are only based on a small time frame. It is unclear what the long-term
implications of illusory correlations are on stereotypes and attitudes towards the target
groups.
The apparent inevitability of illusory correlations may paint a bleak picture for the
status of minority group members. If their negative behaviors are likely to be highly
salient simply because they make up a smaller proportion of the population, either in
general or in a given setting, then how are negative stereotypes about minority groups
ever going to be decreased and attitudes towards minorities improved? Findings from
illusory correlation studies suggest that there is a simple cognitive bias that is likely to

149
facilitate the formation of negative stereotypes about minorities. This same bias may
possibly be used to promote attention to the positive behaviors and achievements of
minority group members. Infrequency seems to be an automatic road to saliency, but
behaviors can be made salient by many other means as well. Parents and teachers are in a
particularly good position to point out positive acts and the many accomplishments of
minorities to children, thus making the minority group members’ positive characteristics
highly noticeable, and hopefully facilitating the formation of positive minority group
stereotypes. Study 1 suggested that infrequency alone might not increase the salience of
minority-positive behaviors above the level of salience of minority-negative behaviors.
In addition, few minority group members engage in mostly negative behaviors. The
majority of any individual’s behaviors are likely to be positive; thus, the infrequency of
negative behaviors, combined with their ability to attract more attention, make them far
more salient than positive behaviors. However, focusing children’s attention on positive
behaviors by explicitly making note of them should dramatically increase the availability
of these events in children’s memory, and may help change children’s impressions of
minority groups for the better.
There are numerous everyday situations in which this could be accomplished. For
example, a teacher with a class with only a few minority students, but many majority
group students, could make a special effort to praise the minority students for their good
work, achievements, honors, and good behavior. Likewise, because the minority group
children’s behaviors will stand out simply because of the smaller number of minority
students in the class, the teacher could avoid public reprimands and publicly calling
attention to negative behaviors and poor school achievement. Instead, he or she may
choose to discuss such problems in private with the minority students. Although such a
discrepancy in behavior towards minority and majority group children may seem unfair,
the benefits to the minority students in the class, and possibly to other members of those
minority groups, may be substantial.
Increasing the salience of positive behaviors can occur at institutional levels and
through the media as well. Multicultural appreciation programs can increase positive

150
stereotypes about minority groups, but these programs need to be employed continuously.
Public service announcements may also expose children to repeated examples and
reminders that minority group members do behave positively, or even extraordinarily,
and have made many outstanding accomplishments. School and television programs
featuring topics such as Black history, women scientists, or Hispanic political figures
could improve children’s appreciation of the accomplishments of minorities in areas in
which they have historically been seen negatively or are underrepresented. Finally,
television shows such as Sesame Street that feature positive relations between majority
and minority group members need to call more attention to those relationships by
explicitly discussing racial and cultural issues, leaving no ambiguity as to the message
they mean to transmit.
One way to decrease illusory correlations may be to increase contact among
majority and minority group members. In addition, ingroup favoritism can be used to
facilitate positive relations among majority and minority group members by creating new
social groups, especially competitive groups, that include members of various naturally
occurring majority and minority social groups. For instance, ensuring that little league
sports teams are racially integrated would create a new social grouping within each team,
both increasing interracial contact and increasing positive feelings towards the fellow
group members. Adding a competitive component to these new social groups by having
the teams compete competitively would likely encourage even more favorable attitudes,
cooperation, and friendship among ingroup members. Thus, by creating dynamic social
groups in which children of different naturally occurring social groups (e.g., different
races, ethnicities, religions, socio-economic status, or genders) must work together
towards a common goal, the positive attitudes that are formed about specific group
members might generalize to other members of the natural social groups.

151
Future Research Directions
Many other questions about the effects of minority group status on illusory
correlations in children are raised by the current research. It will be important to replicate
and extend this work to children of other ages, and to perceptions of other real social
groups. Children’s ability to form similar illusory correlations in more ecologically valid
situations, i.e., when viewing majority and minority group children’s behavior in a
natural setting, should be examined, as well as the potential for illusory correlations to
become stable representation of the target groups.
Perhaps the most interesting questions relate to illusory correlation formation
among minority group children. The long-term consequences of minority group
children’s tendency to perceive illusory correlations between their own group and
negative behaviors on their ingroup perceptions, attitudes, self-concept, and self-esteem
should be investigated. In addition, the different social experiences of majority and
minority group children may greatly influence whether minority group children form
illusory correlations about their own groups in real situations. The fact that minority
group members tend to have more contact with other members of the same minority
group than majority group members is likely to affect whether minority group children
form the same illusory correlations as majority group children would when real social
groups are involved. If minority group children have more contact with other minority
group members, they may, hopefully, be less influenced by the shared infrequency of
minority group-negative behaviors because the more examples of minority group
behavior they have, the less salient any one minority group member’s behavior should be.
However, if minority group children’s contact with other minority group members is
primarily within their own families, but school settings involve contact with mostly
majority group members, minority group children may still be likely to form illusory
correlations between the minority group and negative school-related behaviors, which
could lead to specific academic problems such as academic de-identification.

152
In sum, children’s tendency to form illusory correlations is a potentially rich topic
of study from both a theoretical standpoint, and a practical standpoint. From a theoretical
perspective, the study of children’s illusory correlations provides an opportunity to
examine the innateness or developmental changes in perceptual biases, and to relate these
biases to social perception, other developing cognitive and social abilities, and
developmental changes in self-enhancement motivations. In addition, it provides a
potential explanation for the early development of certain stereotypes. Finally,
understanding how the cognitive and motivational biases involved in illusory correlation
formation work could aid in stereotype and prejudice reduction by helping parents and
educators to use children’s biases in social perception to their own advantage, thus
increasing the success of programs aimed at reducing stereotyping and promoting
positive intergroup relations.

153
References
Acorn, D.A., Hamilton, D.L, & Sherman, S.J. (1988). Generalization of biased
perceptions of groups based on illusory correlations. Social Cognition, 6, 345-372.
Alba, J.W., Chromiak, W., Hasher, L., & Attig, M.S. (1980). Automatic encoding
of category size information. Journal of Experimental Psychology: Learning, Memory,
and Cognition, 6, 370-378.
Antell, S.E., & Keating, D.P. (1983). Perception of numerical invariance in
neonates. Child Development, 54, 695-701.
Barrett, S.E., Abdi, H., Murphy, G.L., & Gallagher, J.M. (1993). Theory-based
correlations and their role in children’s concepts. Child Development, 64, 1595-1616.
Berndsen, M., van der Pligt, J., & Spears, R. (1996). Expectation-based and data-
based illusory correlation: The effects of confirming versus disconfirming evidence.
European Journal of Social Psychology, 26, 899-913.
Bigler, R.S., & Liben, L.S. (1993). A cognitive-developmental approach to racial
stereotyping and reconstructive memory in Euro-American children. Child Development,
64, 1507-1518.
Bigler, R.S., & Liben, L.S. (1990). The role of attitudes and interventions in
gender-schematic processing. Child Development, 61, 1440-1452.
Bigler, R.S., & Liben, L.S. (1992). Cognitive mechanisms in children’s gender
stereotyping: Theoretical and educational implications of a cognitive-based intervention.
Child Development, 63, 1351-1363.
Bjorklund, D.F., & Muir, J.E. (1988). Children’s development of free recall:
Remembering on their own. In R. Vasta (Ed.), Annals of child development (Vol. 5, pp.
79-123). Greenwich, CT: JAI Press.
Blakemore, J.F.O., LaRue, A.A., & Olejnik, A. (1979). Sex-appropriate toy
preference and the ability to conceptualize toys as sex-role related. Developmental
Psychology, 15, 339-340.

154
Brainerd, C.J. (1981). Working memory and the developmental analysis of
probability judgment. Psychological Review, 88, 463-502.
Branscombe, N.R., & Ellemers, N. (1998). Coping with group-based
discrimination: Individualistic versus group-level strategies. In Swim, J.K., & Stangor,
C. (Eds.), Prejudice: The target's perspective. (pp. 243-266). San Diego, CA: Academic
Press, Inc.
Branscombe, N.R., Schmitt, M.T., & Harvey, R.D. (1999). Perceiving pervasive
discrimination among African Americans: Implications for group identification and well-
being. Journal of Personality and Social Psychology, 77, 135-149.
Brewer, M.B. (1979). Ingroup bias in the minimal intergroup situation: A
cognitive-motivational analysis. Psychological Bulletin, 86, 307-324.
Brown, R. (1995). Prejudice: Its social psychology. Oxford: Blackwell.
Chapman, L.J. (1967). Illusory correlation in observational report. Journal of
Verbal Learning and Verbal Behavior, 6, 151-155.
Chi, M.T.H., & Ceci, S.J. (1987). Content knowledge: Its role, representation,
and restructuring in memory development. In H.W. Reese (Ed.), Advances in child
development and behavior (Vol. 20, pp. 91-142). Orlando, FL: Academic Press.
Cohen, J., & Cohen, P. (1975). Applied multiple regression/correlation analysis
for the behavioral sciences (pp. 291-308). Hillsdale, N.J.: Laurence Earlbaum
Associates.
Crider, C. (1981). Children’s conceptions of the body interior. In R. Bibace &
M.E. Walsh (Eds.), New directions for child development: Children’s conceptions of
health, illness, and bodily functions (pp. 49-65). Sand Francisco: Jossey-Bass.
Davey, A. (1983). Learning to be prejudiced. London: Edward Arnold.
Edelbrock, C., & Sugawara, A.I. (1978). Acquisition of sex-typed preferences in
preschool-aged children. Developmental Psychology, 14, 614-623.

155
Fiedler, K. (1991). The tricky nature of skewed frequency tables: An information
loss account of distinctiveness-based illusory correlations. Journal of Personality and
Social Psychology, 60, 24-36.
Fiske, S.T., & Taylor, S.E. (1991). Social cognition (2
nd
edition). New York:
McGraw-Hill.
Goldstein, D., Hasher, L., & Stein, D.K. (1983). The processing of occurrence
rate and item information by children of different ages and abilities. American Journal of
Psychology, 96, 229-241.
Graves, S.B. (1993). Television, the portrayal of African Americans, and the
development of children’s attitudes. In G.L. Berry & J.K. Asamen (Eds.), Children and
television (pp. 179-190). Newbury Park, CA: Sage.
Hamilton, D.L., & Gifford, R.K. (1976). Illusory correlation in interpersonal
perception: A cognitive basis of stereotypic judgments. Journal of Experimental Social
Psychology, 12, 392-407.
Hamilton, D.L., Dugan, P.M., & Trolier, T.K. (1985). The formation of
stereotypic beliefs: Further evidence for distinctiveness-based illusory correlations.
Journal of Personality and Social Psychology, 48, 5-17.
Hamilton, D.L., & Sherman, S.J. (1989). Illusory correlations: Implications for
stereotype theory and research. In D. Bar-Tal, C.F. Graumann, A.W. Kruglanski, & W.
Stroebe (Eds.), Stereotyping and prejudice: Changing conceptions (pp. 59-82). NY:
Springer-Verlag.
Hasher, L., & Chromiak, W. (1977). The processing of frequency information:
An automatic mechanism? Journal of Verbal Learning and Verbal Behavior, 16, 173-
184.
Hasher, L., & Zacks, R.T. (1979). Automatic and effortful processes in memory.
Journal of Experimental Psychology: General, 108, 356-388.
Hasher, L., & Zacks, R.T. (1984). Automatic processing of fundamental
information: The case of frequency of occurrence. American Psychologist, 39, 1372-
1388.

156
Haslam, S.A., & McGarty, C. (1994). Problems with the measurement of illusory
correlation. European Journal of Social Psychology, 24, 611-621.
Haslam, S.A., McGarty, C., & Brown, P.M. (1996). The search for differentiated
meaning is a precursor to illusory correlation. Personality and Social Psychology
Bulletin, 22, 611-619.
Hastie, R. (1980). Memory for behavioral information that confirms or
contradicts a personality impression. In R. Hastie, T.M. Ostrom, R.S. Wyer, Jr., D.L.
Hamilton, & D.E. Carlston (Eds.), Person memory: The cognitive basis of social
perception (pp. 155-177). Hillsdale, NJ: Erlbaum.
Hastie, R., & Park, B. (1986). The relationship between memory and judgment
depends on whether the judgment task is memory-based or on-line. Psychological
Review, 93, 258-268.
Horowitz, M., & Rabbie, J.M. (1982). Individuality and membership in the
intergroup system. In H. Tajfel (Ed.), Social identity and intergroup relations (pp. 241-
274). Cambridge: Cambridge University Press.
Huston, A. (1983). Sex-typing. In P.H. Mussen (Ed.), Handbook of child
psychology, Vol. 4: Socialization, personality, and social behavior (4
th
edition) (pp. 388-
467). New York: Wiley.
Huston, A.C., Donnerstein, E., Fairchild, H., Feshbach, N.D., Katz, P.A., Murray,
J.P., Rubinstein, E.A., Wilcox, B.L., & Zuckerman, D. (1992). Big world, small screen:
The role of television in American society. Lincoln: University of Nebraska Press.
Jacobs, J.E., Greenwald, J.P., & Osgood, D. (1995). Developmental differences
in baserate estimates of social behaviors and attitudes. Social Development, 4, 165-181.
Jacobs, J.E., & Potenza, M. (1991). The use of judgment heuristics to make
social and object decisions: A developmental perspective. Child Development, 62, 166-
178.
Johnson, C.N., & Wellman, H.M. (1982). Children’s developing conceptions of
the mind and brain. Child Development, 53, 222-234.

157
Kanouse, D.E., & Hanson, L.R. (1972). Negativity in evaluations. In E.E. Jones
et al. (Eds.), Attribution: Perceiving the causes of behavior. Morristown, NJ: General
Learning Press.
Klaczynski, P.A., & Fauth, J. (1997). Developmental differences in memory-
based intrusions and self-serving statistical reasoning biases. Merrill-Palmer Quarterly,
43, 539-566.
Klaczinsky, P.A., Gordon, D.H., & Fauth, J. (1997). Goal-oriented critical
reasoning and individual differences in critical reasoning biases. Journal of Educational
Psychology, 89, 470-485.
Klaczinsky, P.A., & Gordon, D.H. (1996). Everyday statistical reasoning during
adolescence and young adulthood: Motivational, general ability, and developmental
influences. Child Development, 67, 2873-2891.
Kuhn, D., Nash, S.C., & Brucken, L. (1978). Sex role concepts of two- and three-
year-old children. Child Development, 49, 445-451.
Liben, L.S., & Signorella, M.L. (1980). Gender-related schemata and
constructive memory in children. Child Development, 51, 11-18.
Martin, C.L., & Little, J.K. (1990). The relation of gender understanding to
children’s sex-typed preferences and gender stereotypes. Child Development, 61, 1427-
1439.
McArthur, L.Z., & Friedman, S.A. (1980). Illusory correlation in impression
formation: Variations in the shared distinctiveness effect as a function of the distinctive
person’s age, race, and sex. Journal of Personality and Social Psychology, 39, 615-624.
McConnell, A.R., Sherman, S.J., & Hamilton, D.L. (1994a). Illusory correlation
in the perception of groups: An extension of the distinctiveness-based account. Journal
of Personality and Social Psychology, 67, 414-429.
McConnell, A.R., Sherman, S.J., & Hamilton, D.L. (1994b). On-line and
memory-based aspects of individual and group target judgments. Journal of Personality
and Social Psychology, 67, 173-185.

158
McGarty, C., Haslam, S.A., Turner, J.C., & Oakes, P.J. (1993). Illusory
correlation as accentuation of actual intercategory difference: Evidence for the effect with
minimal stimulus information. European Journal of Social Psychology, 23, 391-410.
McGraw, K.O., Durm, M.W., & Durnam, M.R. (1989). The relative salience of
sex, age, race, and glasses in children’s social perceptions. Journal of Genetic
Psychology, 150, 251-267.
McGraw, K.O., Durm, M.W., & Patterson, J.N. (1983). Concept discrimination
learning by preschool children using facial stimuli differing in age, sex, race, and
eyeglasses. Journal of General Psychology, 108, 193-202.
Mullen, B., & Johnson, C. (1990). Distinctiveness-based illusory correlations and
stereotyping: A meta-analytic integration. British Journal of Social Psychology, 29, 11-
28.
Mutter, S.A. (1999). Illusory correlation and group impression formation in
young and older adults. Journals of Gerontology: Psychological Sciences. Unpublished
manuscript.
Nisbett, R. & Ross, L. (1980). Human inference: Strategies and shortcomings of
social judgment. Englewood Cliffs, NJ: Prentice-Hall.
Ornstein, P.A., Naus, M.J., & Liberty, C. (1975). Rehearsal and organizational
processes in children’s memory. Child Development, 46, 818-830.
Perlmutter, M. (1984). Continuities and discontinuities in early human memory:
Paradigms, processes, and performances. In R.V. Kail, Jr., & N.R. Spear (Eds.),
Comparative perspectives on the development of memory (pp. 253-287). Hillsdale, NJ:
Erlbaum.
Powlishta, K.K., Serbin, L.A., Doyle, A.B., & White, D.R. (1994). Gender,
ethnic, and body type biases: The generality of prejudice in childhood. Developmental
Psychology, 30, 526-536.
Primi, C., & Agnoli, F. (1998). Children correlate infrequent behaviors with
minority groups: A case of illusory correlation. Unpublished manuscript.

159
Pryor, J.B. (1986). The influence of different encoding sets upon the formation of
illusory correlations and group impressions. Personality and Social Psychology Bulletin,
12, 216-226.
Ritchie, M.H., McClelland, L., & Shimkunas, A.M. (1967). Relative importance
of positive and negative information in impression formation and persistence. Journal of
Personality and Social Psychology, 6, 322-327.
Rothbart, M. (1981). Memory processes and social beliefs. In D.L. Hamilton
(Ed.), Cognitive processes in stereotyping and intergroup behavior. Hillsdale, NJ:
Erlbaum.
Ruff, H.A., & Lawson, K.R. (1990). Development of sustained, focused attention
in young children during free play. Developmental Psychology, 26, 85-93.
Ruggiero, K.M., & Major, B.N. (1998). Group status and attributions to
discrimination: Are low- or high-status group members more likely to blame their failure
on discrimination? Personality and Social Psychology Bulletin, 24, 821-837.
Ruggiero, K.M., & Marx, D.M. (1999). Less pain and more to gain: Why high status
group members blame their failure on discrimination. Journal of Personality and Social
Psychology, 77, 774-784.
Ruggiero, K.M., & Taylor, D.M. (1995). Coping with discrimination: How
disadvantaged group members perceive the discrimination that confronts them. Journal
of Personality and Social Psychology, 68, 826-838.
Ruggiero, K.M., & Taylor, D.M. (1997). Why minority group members do or do not
perceive the discrimination that confronts them: The role of self-esteem and perceived
control. Journal of Personality and Social Psychology, 72, 373-389.
Sanbonmatsu, D.M., Shavitt, S., Sherman, S.J., & Roskos-Ewoldsen, D.R. (1987).
Illusory correlation in the perception of performance by self or a salient other. Journal of
Experimental Social Psychology, 23, 518-543.
Sanbonmatsu, D.M., Sherman, S.J., & Hamilton, D.L. (1987). Illusory correlation
in the perception of individuals and groups. Social Cognition, 5, 1-25.

160
Serbin, L.A., & Sprafkin, C. (1986). The salience of gender and the process of
sex typing in three- to seven-year-old children. Child Development, 57, 1188-1199.
Schaller, M., & Maass, A. (1989). Illusory correlation and social categorization:
Toward an integration of motivational and cognitive factors in stereotype formation.
Journal of Personality and Social Psychology, 56, 709-721.
Shaklee, H., & Mims, M. (1981). Development of rule use in judgments of
covariation between events. Child Development, 52, 317-325.
Shaklee, H., & Paszek, D. (1985). Covariation judgment: Systematic rule use in
middle childhood. Child Development, 56, 1229-1240.
Signorella, M.L., & Liben, L.S. (1984). Recall and reconstruction of gender-
related pictures: Effects of attitude, task difficulty, and age. Child Development, 55, 393-
405.
Smedslund, J. (1963). The concept of correlation in adults. Scandinavian
Journal of Psychology, 4, 165-173.
Smith, E.R. (1991). Illusory correlation in a simulated exemplar-based memory.
Journal of Experimental and Social Psychology, 27, 107-123.
Spears, R., van der Pligt, J., & Eiser, J.R. (1985). Illusory correlation in the
perception of group attitudes. Journal of Personality and Social Psychology, 48, 863-
875.
Starkey, P., & Cooper, R.G., Jr. (1980). Perception of numbers by human infants.
Science, 210, 1033-1035.
Stodolsky, S.S. (1974). How children find something to do in preschools.
Genetic Psychology Monographs, 90, 245-303.
Strutt, G.F., Anderson, D.R., & Well, A.D. (1975). A developmental study of the
effects of irrelevant information on speeded classification. Journal of Experimental
Child Psychology, 20, 127-135.
Susskind, J.E. (1997, April). Children’s stereotypic biases: The perception of
gender-based illusory correlations. Poster presented at the Biennial Meeting of the
Society for Research in Child Development, Washington, D.C.

161
Tajfel, H. (1982). Social psychology of intergroup relations. Annual Review of
Psychology, 33, 1-39.
Tajfel, H., Flament, C., Billig, M.G., & Bundy, R.P. (1971). Social categorization
and intergroup behavior. European Journal of Social Psychology, 1, 149-178.
Tajfel, H., & Wilkes, A.L. (1963). Classification and quantitative judgment.
British Journal of Psychology, 54, 101-114.
Thompson, S.K. (1975). Gender labels and early sex-role development. Child
Development, 46, 339-347.
Trautner, H.M., Helbing, N., Sahm, W.B., & Lohaus, A. (1988). Unkenntnis-
Rigiditaet-Flexibilitaet: Ein Entwicklungsmodell der Geschlechtsrollen-Typisierung.
Zeitschrift fuer Entwicklungspsychologie und Paedagogische Psychologie, Band XX, Heft
2, 105-120.
Tversky, A., & Kahneman, D. (1973). Availability: A heuristic for judging
frequency and probability. Cognitive Psychology, 5, 207-232.
Tversky, A., & Kahneman, D. (1974). Judgment under uncertainty: Heuristics
and biases. Science, 185, 1124-1131.
Van Avermaet, E., & McLintock, L.G. (1988). Intergroup fairness and bias in
children. European Journal of Social Psychology, 18, 407-427.
Vaughan, G., Tajfel, H., & Williams, J.A. (1981). Bias in reward allocation in an
intergroup and an interpersonal context. Social Psychology Quarterly, 44, 37-42.
Ward, W., & Jenkins, J. (1965). The display of information and the judgment of
contingency. Canadian Journal of Psychology, 19, 231-241.
Weinraub, M., Clemens, L.P., Sockloff, A., Etheridge, T., Gracely, E., & Myers,
B. (1984). The development of sex role stereotypes in the third year: Relationships to
gender labeling, gender identity, sex-typed toy preferences, and family characteristics.
Child Development, 55, 1493-1503.
Wyer, R.S., & Gordon, S.E. (1982). The recall of information typical or atypical
about persons and groups. Journal of Experimental Social Psychology, 18, 128-164.

162
Yee, M.D. & Brown, R.J. (1992). Self evaluations and intergroup attitudes in
children aged three to nine. Child Development, 63, 619-629.
Zacks, R.T., Hasher, L., & Sanft, H. (1982). Automatic encoding of event
frequency: Further findings. Journal of Experimental Psychology: Learning, Memory,
and Cognition, 8, 106-116.
Zajonc, R.B. (1968). Attitudinal effects of mere exposure. Journal of Personality
and Social Psychology, 9.
Zalk, S.R., & Katz, P.A. (1978). Gender attitudes in children. Sex Roles, 4, 349-
357.


164
Lists of Behaviors Assigned to Target Groups
Set A: Study 1 Negative-Infrequent Condition, and Study 2
1. volunteered to help the teacher erase the
11. always pets her/his dog nicely
12. always keeps her/his room clean
4. breaks other people's things on
5. puts her/his fingers in her/his nose
6. erases notes the teacher wrote about
Set B: Study 1 Negative-Infrequent Condition, and Study 2
4. makes good grades in school
5. usually writes without mistakes on
1. cheats at games
2. knocks other people's papers off
3. usually doesn't finish her/his
4. eats cookies when her/his parents

165
Set C: Study 1 Positive-Infrequent Condition
1. won't help other children clean up toys
7. breaks other people's things on purpose
8. doesn't help sweep the floor when her/his
1. volunteered to help the teacher
2. likes to help put away classroom
3. never forgets to feed the cat
4. always shares her/his school
5. always pets her/his dog nicely
6. always keeps her/his room clean
Set D: Study 3 Behaviors
Positive Behaviors
Negative Behaviors
1. volunteered to help put away supplies
when the class was finished working
2. shared his/her markers with other children
3. finished his/her part of the project on time
4. made a good grade on his/her part of the
project
5. volunteered to help clean up a mess after
working on the project
6. found lots of good pictures to use in the
project
7. offered to help another child who was
having trouble
8. always brought extra supplies in case
anyone ran out
9. helped someone pick up crayons that had
fallen all over the floor
10. lent his/her scissors to someone whose
scissors were broken
11. offered to help another child carry heavy
supplies
12. wrote everything correctly on his/her part
of the project
1. took another child’s construction
paper without asking
2. turned in his/her part of the project
late
3. glued things badly so they fell off
the poster
4. broke other people’s crayons on
purpose
5. wrote messily when the teacher said
to write neatly
6. copied somebody else’s work

166
Examples of Photographs Used for Group-Behavior Assignments
“always pets her/his dog nicely”
“breaks other people’s things on purpose”
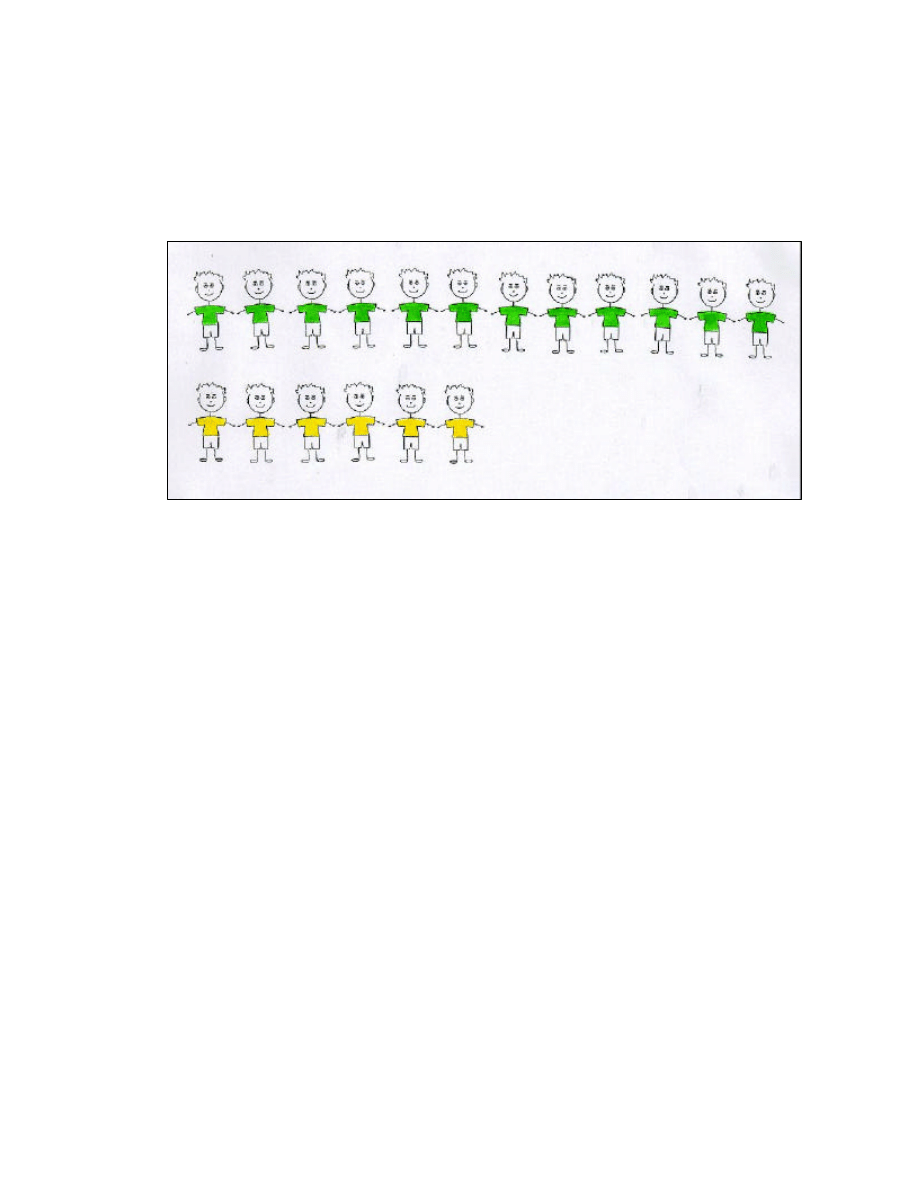

Curriculum Vitae
KRISTEN E. JOHNSTON
EDUCATION
2000 Ph.D. in Developmental Psychology at The Pennsylvania State University
Dissertation title: Illusory correlation in children: Cognitive and
motivational biases in group impression formation
Minor: Social psychology
1997 M.S. in Developmental Psychology, The Pennsylvania State University
Thesis title: Influences on preschoolers’ toy preferences for the self
and others: Evidence for a multifactorial gender schema model
1994 B.A. with High Honors in Psychology, The University of Texas at Austin
AWARDS AND HONORS
1999 Grant-in-Aid, APA Division 9, Society for the Psychological Study of Social
Issues
1999 First Place, Penn State Graduate Research Exhibition
1998 Dissertation Support Grant, Penn State Research and Graduate Studies
1998 Honorable Mention, Penn State Graduate Research Exhibition
1995 Thesis Support Grant, Department of Psychology
1994 Phi Beta Kappa National Honor Society
PUBLICATIONS AND MANUSCRIPTS IN PREPARATION
Johnston, K.E., Madole, K.L., Bittinger, K., & Smith, A. (2000). Developmental changes in
infants’ and toddlers’ attention to gender categories. Accepted pending revisions,
Merrill-Palmer Quarterly.
Johnston, K.E. (1999). Influences on preschoolers’ toy choices for the self and others.
Manuscript under revision.
Johnston, K.E., Swim, J.K., & Stangor, C. (1999). The effects of enhancing gender identity
on the perception of gender discrimination against the self. Manuscript in preparation.
SELECTED CONFERENCE PRESENTATIONS
Johnston, K.E. (2000, June). Children’s illusory correlations: Cognitive and motivational
biases. Paper presented at the Meeting of the Society for the Psychological Study of
Social Issues, Minneapolis, Minn.
Johnston, K.E. (2000, June). Effects of gender identity on perception of personal gender
identity. Poster presented at the Meeting of the Society for the Psychological Study of
Social Issues, Minneapolis, Minn.
Madole, K.L., & Johnston, K.E. (1999, October). Infants’ attention to appearance-function
correlations: The role of color, shape, and labels. Poster presented at the Meeting of the
Cognitive Development Society, Raleigh, N.C.
Johnston, K.E. (1997, April). Influences on preschoolers’ novel toy preferences for the self
and others. Poster presented at the Biennial Meeting of the Society for Research in Child
Development, Washington, D.C.
Johnston, K.E., & Madole, K.L. (1997, April). Fourteen- and eighteen-month-olds’ attention
to gender categories. Poster presented at the Biennial Meeting of the Society for
Research in Child Development, Washington, D.C.
Document Outline
- Abstract
- Table of Contents
- List of Tables
- List of Figures
- Chapter 1 Introduction
- Illusory Correlation in Adults
- Illusory Correlation in Children
- Expectations for Developmental Change in Distinctiveness-Based
- Empirical Evidence of Distinctiveness-Based Illusory Correlations in Children
- Expectations for Illusory Correlations when the Self is a Member of a Target Group
- Expectations for Developmental Changes in the Formation of Illusory Correlations
- Current Research
- Chapter 2 Study 1: Children's Perceptions of Distinctiveness-Based Illusory Correlations
- Chapter 3 Study 2: Dual Influences of Distintiveness and Ingroup Favoritism on Perceptions of Illusory Correlation
- Chapter 4 Study 3: Formation of Illusory Correlations about Gender Groups
- Chapter 5 General Discussion
- References
- Appendix A
- Appendix B
- Appendix C
- Appendix D
- Curriculum Vitae
Wyszukiwarka
Podobne podstrony:
ANG ćwicz cough in children
Immobilization and hypercalciuria in children
HYPERTENSION IN CHILDREN AND ADOLESCENTS AZ
Immune function biomarkers in children exposed to lead and organochlorine compounds a cross sectiona
Effect of sensory education on food preferences in children
Alpay Self Concept and Self Esteem in Children and Adolescents
(Parenting) Anger and Aggression in Children Teaching Self Control
Ileal lymphoid nodular hyperplasia, non specific colitis, and pervasive developmental disorder in ch
A Propagandist of Extermination, Johann von Leers and the Anti Semitic Formation of Children in Nazi
In this picture you?n see two children
feminism and formation of ethnic identity in greek culture
Blood Lead Level Distribution by Age Group in Japanese
Formation of heartwood substances in the stemwood of Robinia
21- Jak sformatować dysk twardy i podzielić go na partycje, Formatowanie dysku twardego i dzielenie
Formation of a new chromosomes as a virulence mechanism in C glabrata
New World Orders in Contemporary Children's Literature
Word formation, fill in thegaps, multiple chioce exercises
children in egipt
więcej podobnych podstron