Stocks & Commodities V. 20:8 (46-56): Developing A Trading System by Dennis D. Peterson
Copyright (c) Technical Analysis Inc.
Combining Stochastic RSI And Bollinger Bands
Developing A Trading System
If you’ve ever tried it, you know that developing a trading
system is no easy task. But you may find that following a series
of steps could help you reduce the learning curve. Here’s an
example.
here are three key features when it comes to
developing a trading system: entry and exit
signals, a plan for the type of stop, and a money
management strategy. The first involves
generating the signals, which can be purely
encode visual signals. In this article I will take two of the
better-known technical indicators and go through the steps
involved in developing a trading system.
The two indicators I will be using are Bollinger Bands
and stochastic relative strength index (StochR
SI
). StochR
SI
,
which combines the features of stochastics and R
SI
, was
detailed in Tushar S. Chande and Stanley Kroll’s book,
The New Technical Trader. I selected this combination
because it is a useful way to determine when prices will
stop tagging a Bollinger Band and are likely to move all
the way from one band to the next. Of course, those prices
may not move all the way, so you will need to use stops for
protection. You will also want to use a simple money
visual, a result of technical indicators, or a combination of
both. Most mechanical trading systems use indicators to
T
by Dennis D. Peterson
SYSTEM DESIGN
BRIAN AJHAR
Stocks & Commodities V. 20:8 (46-56): Developing A Trading System by Dennis D. Peterson
Copyright (c) Technical Analysis Inc.
management strategy of allocating only a portion of your
capital to any one position.
G
ROUND
RULES
:
THE
BIGGER
PICTURE
First, let’s take a look at R
SI
and StochR
SI
. Stochastics, you
will recall, is simply a way of measuring, for a given period
of time, where today’s close is relative to the lowest low, and
where within the range of the highest high and lowest low the
price falls over the same time period. The formula for
stochastics for a 14-day period is:
Note the use of range — high minus low
— in the denominator of the calculation.
Many trading techniques and strategies
are built around range in some form, and
if you use several indicators, you want
independent sources, so that the indicators
independently confirm one another.
Independent confirmation is one part
of Dow theory you should consider
embracing. For example, Larry Williams’
%R is the reverse of stochastics,
substituting the difference of highest high
over a given period minus today’s close
for the numerator. So if you want to use
this indicator together with stochastics,
you are not using independent indicators.
Instead, you should consider using an
indicator that does not involve a range,
such as volume, or one that is statistical in
nature, such as Bollinger Bands.
The next step is to identify the type of
stock that will work best. If you are
going to use an indicator that relies on price volatility such as
StochR
SI
, then you should examine your charts to see the
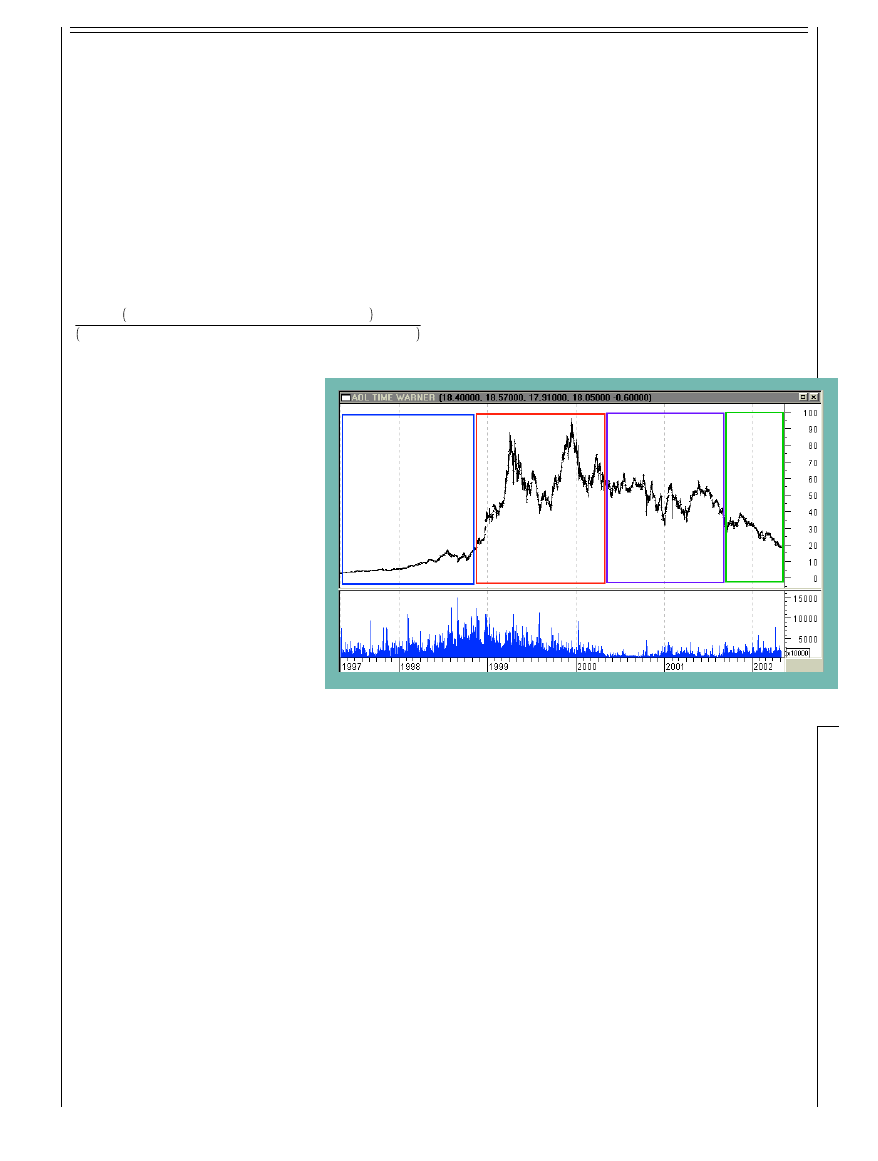
nature of the current volatility. For example, I have used A
OL
Time Warner (A
OL
) in Figure 1. What differentiates the four
areas (A, B, C, and D) is the combination of price and volume
volatility. Area A has low price and high volume volatility.
Area B has both high price and volume volatility. Area C has
high price volatility, and low volume volatility for the stock.
Finally, area D has moderate volume and price volatility.
A useful rule to remember is that a price is “in gear” — that
is, in sync — if price goes up on high volume or down on
lowered volume. Prices that reflect such moves are prices that
the market is comfortable with. If you were long in area A or
short in area D, you would have done well. A trading system
designed for areas A and D — “in-gear” moves — is likely to
have a terrible time in areas B and C. As you will discover
shortly, A
OL
represents the good, the bad, the ugly, and the
really ugly when it comes to using a trading system that only
takes long positions.
P
AY
ATTENTION
TO
THE
MARKET
:
U
SE
MONEY
MANAGEMENT
Since there is no crystal ball when it comes to the markets, it’s
important to protect yourself by using stops and money
management methods. You spread your risk with money
management; for example, you might decide to only invest
10% of your total capital in any one position.
Remember that not all stocks trade in the same fashion.
One group of stocks might do better than another, making it
necessary to build watchlists of stocks to compare your
system’s performance. You also need to realize that just as
individual stocks behave differently within a single market,
each market also behaves differently from the others.
The commodities markets are generally a more closed
system: The price of pork bellies is less dependent on earnings
figures stated by accounting firms than, say, a company
traded on a stock exchange would be. Even among stock
exchanges, trading systems generate different results. A
system that takes long positions on extreme gapdowns, for
example, might produce a few trades a year for stocks traded
on the New York Stock Exchange (N
YSE
), while producing
many more trading the Nasdaq.
Within a given exchange, the behavior of an individual
stock — or possibly almost the entire exchange if it contains
similar stocks — can change because of shifts in expectations.
Remember that the market participants’ expectations are a
major factor in shaping the market’s behavior, and when you
start analyzing them, the apparent randomness of the markets
starts to disappear.
In addition, keep in mind that it is difficult to predict what
the market will do. Sideways price movements accompanied
by low volume will be random in nature and can be detrimental
to your trading capital, as you will see in a later example. You
Today's close – Lowest low of the last 14 days
Highest high of the last 14 days – Lowest low of the last 14 days
A
B
C
D
FIGURE 1: DAILY AOL PRICE AND VOLUME. Price volatility is less before June 1998. For indicators that use price
volatility such as StochRSI, you want to use fewer periods in the calculation to generate trading signals than you would
prior to June 1998.
METASTOCK (EQUIS INTERNATIONAL)/eSIGNAL
Stocks & Commodities V. 20:8 (46-56): Developing A Trading System by Dennis D. Peterson
Copyright (c) Technical Analysis Inc.
should always trade stocks that have
trading volumes above 500,000 shares
per day, or even better, those that trade
above one million shares daily, on
average. Thus, this trading system is for
swing traders, not scalpers (who trade
noise).
RSI
VS
. S
TOCH
RSI
If you compare R
SI
and StochR
SI
measurements over a few months, you
will notice a difference: One of them
will hit the extreme faster and tend to
stay near the extreme better than the
other. The formula for StochR
SI
for a
14-day period is:
If you build this indicator, of course,
you can make the R
SI
use a 14-day
period or you can, for example, make the R
SI
based on a nine-
day period and retain the 14 days for the stochastics portion.
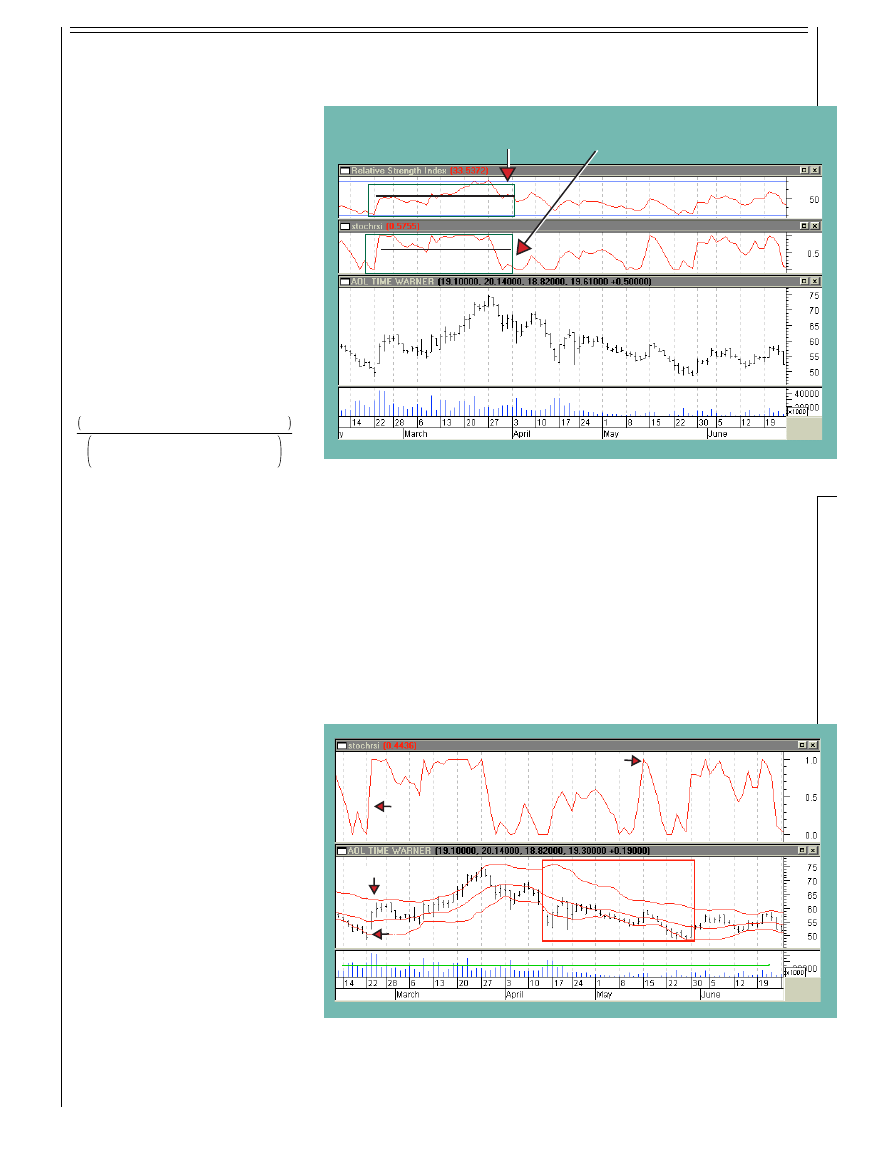
As you can see from Figure 2, StochR
SI
does a better job of
hitting its extreme and staying there than R
SI
does. StochR
SI
allows you to draw a line that acts as a threshold line better
than R
SI
(black lines drawn within green boxes). While both
R
SI
and StochR
SI
range between zero and one — although
cosmetic adjustments are made to R
SI
so it appears to range
between zero and 100 — StochR
SI
hits its extreme faster
because you are only looking at the R
SI
over a recent lookback period. Still,
there are times, as in April, when
StochR
SI
gives you a mixed message.
This is where Bollinger Bands can help.
If you overlay price with Bollinger
Bands, as in Figure 3, you begin to get
an idea of the setup for a long position:
Act when prices are tagging the lower
band (point A) with a move up (point
B), while StochR
SI
shows a significant
gain in value (point C).
However, this setup has potential
problems for long trades; look at the red
box in the chart. In April and May 2000,
you have examples of prices tagging the
lower band and then closing above. In
one instance (event D), StochR
SI
would
potentially give a confirming signal that
you should go long, but then prices go
back down to the lower band. This is an
example of the problem I referred to
earlier, that low volume is often
FIGURE 3: DAILY AOL AND VOLUME AND STOCHRSI (UPPER CHART): FEBRUARY/JUNE 2000. A 20-day, two
standard deviation Bollinger Band is overlaid on the price chart. On the left hand side is a setup that promises to enter
a long position. It starts with prices tagging the lower band, event A. Prices close above the lower band, event B, and at
the same time StochRSI has moved up to a value of 0.4, event C. What is distressing is the action in the red box, especially
in view of event D, a spike in StochRSI and a close above the lower band followed by a retreat of prices. But if you look
at volume below, the problem mentioned earlier is obviously apparent: low volume giving you a random price movement.
A
B
C
D
FIGURE 2: DAILY AOL PRICE AND VOLUME 2000 WITH RSI (TOP CHART) AND STOCHRSI (SECOND FROM TOP
CHART). StochRSI not only responds quickly to price changes, but also hits its extreme and stays there better than
RSI (see green boxes); 14-day periods are used for both RSI and StochRSI.
Within this green box StochRSI hits its extreme
faster than RSI and stays up better, i.e. above black line
RSI moves slowly and is indecisive
about staying above the black line
RSI – Lowest RSI over the last 14 days
Highest RSI over the last 14 days –
Lowest RSI over the last 14 days
accompanied by randomness. Note that volume in late April
and May is significantly lower than in the preceding time
frame. I will try to incorporate some rules into the trading
system to account for this, but in such a situation it is often
best to exit and find another stock.
I will now execute a trading system, without stops and
money management, to see what it can do. The trading
system is going to have the following trading rules for a long
position:
Stocks & Commodities V. 20:8 (46-56): Developing A Trading System by Dennis D. Peterson
Copyright (c) Technical Analysis Inc.
Entry:
1
Look for prices tagging the
lower Bollinger Band
2
Look for a closing price of an
up day, that is (close>open),
that is above the lower band
after having prices follow (1)
3
Volume of this up day should
be greater than the volume of
the previous up day
4
StochR
SI
should be above a
threshold to ensure some mo-
mentum is associated with the
push up
5
The (close-open)/(high-
low)>0.2, to avoid days that
have short candlestick bodies.
Exit:
1
StochR
SI
should be less than
a threshold to assure loss of
momentum
2
Look for prices to reach the
upper band
3
Closing price should be near
the top Bollinger Band.
You are looking for the stock to continue up if it has been
tagging a lower Bollinger Band and then made a convincing
move up, so that it conforms to entry rules 2 through 5 above.
I used weighted closes in calculating the Bollinger Bands:
(2*close+high+low)/4.
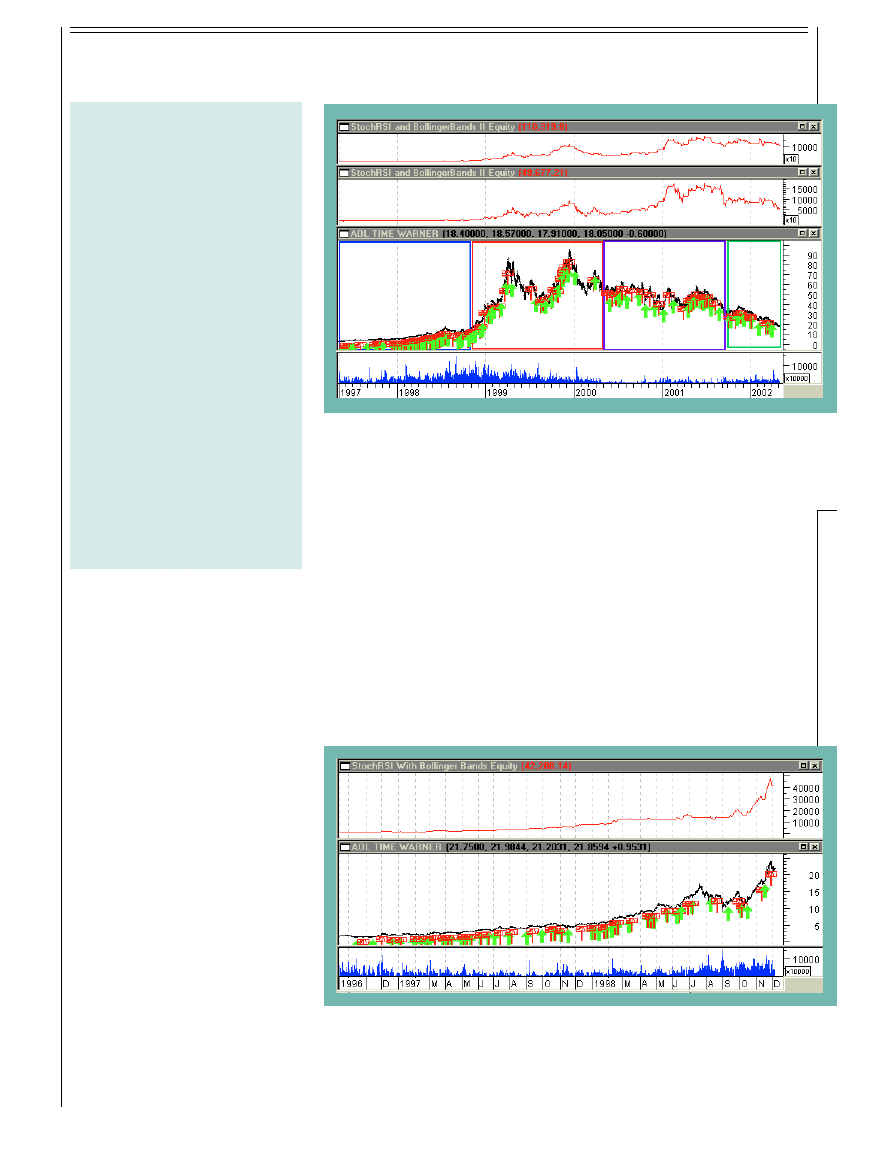
From Figure 4 you can see that investing $1,000 in 1997
and using this trading system without stops resulted in $58,000
(second chart from top), which beat buy/
hold by more than $47,000. However,
there are serious drawdowns in each of
the areas B, C, and D. The only factor
that varied in this trading system was the
number of periods for StochR
SI
and
Bollinger Bands. When using the initial
version of this system I optimized the
StochR
SI
thresholds as well. The equity
looked better in terms of drawdowns
and ended up with $300,000+, which
led me to believe that there might be
something to this approach.
Optimizing on everything — from
periods to thresholds — results in
spectacular equity performance (Figure
5), and although it is curve-fitting, it
shows the potential you are trying to
achieve. It also shows the trading system
is biased to take advantage of strong
uptrends: During uptrends, prices that
tag the bottom Bollinger Band will
move to the upper band, resulting in a trading system that
can do much better than buy and hold. But letting thresholds
optimize curve-fits the performance too much, so I set the
thresholds visually.
To get rid of the serious drawdowns, I used maximum-
loss stops of 5%, which improved the equity performance
(Figure 4: top chart). Still, area B just eats away at your
equity, although it does appear I took care of the low-
volume problem in area C.
FIGURE 4: DAILY AOL AND VOLUME WITH EQUITY PERFORMANCE. Starting with $1,000, a trading system that
goes long using Bollinger Bands and StochRSI is seen to have four trading behaviors, as indicated by areas A, B, C,
and D. Note the equity scales are X10. The second chart from the top is the equity performance without stops. In area
A, the system makes little money despite rising prices, breaks even in B, has a better performance in C, and then
performs poorly during D. Even area C is not especially appealing because you are faced with serious drawdowns,
unless you use stops (as seen in top chart). The top chart, using maximum stop-losses of 5%, provides better
performance.
FIGURE 5: DAILY AOL AND VOLUME WITH EQUITY PERFORMANCE FOR AREA A. A $1,000 equity investment
reaches $45,000+, while buy and hold reaches $20,000+. While this kind of equity performance (top chart) is
spectacular, it comes from letting all the variables in the trading system be optimized — curve-fitting. What this shows,
however, is the potential of the system if the periods and thresholds are chosen correctly, along with the right (strong
uptrend) price movement. It also reflects the bias of the trading system, which takes advantage of the fact that in a strong
uptrend, prices that tag the lower Bollinger Band do so only briefly.
A
B
C
D

Stocks & Commodities V. 20:8 (46-56): Developing A Trading System by Dennis D. Peterson
Copyright (c) Technical Analysis Inc.
adjust1:= rdv1-rdp1+11;
adjust1:=if(adjust1<8,8,adjust1);
adjust1:=if(adjust1>12,12,adjust1);
adjust2:=rdv1-rdp2+14;
adjust2:=if(adjust1<12,12,adjust2);
adjust2:=if(adjust1>20,20,adjust2);
ENTRY CONDITIONS
periods:=adjust1;
BBpds:=adjust2;
Both thresholds (howclosetoBBbot and longthresholdentry)
need to be a factor of either adjust1 or adjust2, but here they
will be set to constants, and I will substitute in the code of
what I want to use.
howclosetoBBbot:=0.9;
longthresholdentry:=0.3;
wprice:=(2*C+H+L)/4;
deviations:=.0625*BBpds+0.75;
StochRSI:=(RSI(periods)-LLV(RSI(periods),periods))/
(HHV(RSI(periods),periods)-LLV(RSI(periods),periods));
Syntax
BBandBot(Data Array, Periods, Method, Devia-
tions )
Function
Calculates the bottom Bollinger Band of data array
using method calculation method and shifted down-
ward deviation standard deviations. Valid methods
are simple, exponential, weighted, time series,
triangular, and variable (these can be abbreviated
as S, E, W, T, TRI, and Var).
Example
BBandBot(close, 10, S, 2 )
Syntax
BBandTop(Data Array, Periods, Method, Devia-
tions )
Function
Calculates the top Bollinger Band of data array
using method calculation method and shifted up-
ward deviation standard deviations. Valid methods
are simple, exponential, weighted, time series,
triangular, and variable (these can be abbreviated
as S, E, W, T, TRI, and Var).
Example
BBandTop( close, 10, S, 2 )
botpercentage:=Abs((wprice-
BBandBot(wprice,BBpds,S,deviations))/
(BBandTop(wprice,BBpds,S,deviations)-
BBandBot(wprice,BBpds,S,deviations)));
{entry conditions}
entry1:=botpercentage-howclosetoBBbot<0.3;
The constant 1.05 in the following statement may also need
adjustment, but will require further testing.
entry2:=C*1.05>BBandBot(wprice,BBpds,S,deviations) and
StochRSI>longthresholdentry;
volbb:=If(C>Ref(C,-1),V,0);
METASTOCK AND WEALTH-LAB SCRIPT
Here is the MetaStock script I captured for the StochR
SI
trading system, with explanations from MetaStock’s Help
function (the “syntax,” “function,” and “example” text). I
have also annotated the various sections of code with my
comments in italics.
Following that is the Wealth-Lab script. My thanks to
Wealth-Lab developer Dion Kurczek for writing the Wealth-
Lab chartscript.
METASTOCK CODE
Fix the periods for finding the standard deviations
(standarddev) and the number of periods used in RSI:
standarddev:= 60;
periods:= 14;
LLV is the lowest low value: see below.
Here is the explanation from MetaStocks’s Help function:
Syntax
LLV( Data Array, Periods )
Function
Calculates the lowest value in the Data Array over
the preceding Periods (Periods includes the cur-
rent day).
Example
The formula “LLV( Close, 14 )” returns the lowest
closing price over the preceding 14 periods.
HHV does a like thing for highest high value:
StochRSI:=(RSI(periods)-LLV(RSI(periods),periods))/
(HHV(RSI(periods),periods)-LLV(RSI(periods),periods));
Syntax
round( Data Array )
Function
Rounds Data Array to the nearest integer.
Example
The formula “round( +10.5 )” returns +11. The
formula “round( -10.4 )” returns -10.
Syntax
stdev( Data Array, Periods )
Function
Calculates the predefined Standard Deviation indi-
cator.
Example
stdev( Close, 21 )
Use the rounding functions to get an integer to be used for
periods:
rdp1:=Round(Stdev(stochrsi,standarddev)/.053);
rdp2:=Round(Stdev(stochrsi,standarddev)/.035);
rdv1:=Round(Stdev(Mov(V,periods,S)/
1000000,standarddev));
I need two adjustments. If the initial calculation is less than
8, then set adjust1 to 8, and if it’s greater than 12, set
adjust1 to 12. This is because I want RSI to range between
eight and 12 periods. Similarly for adjust2, if the initial
calculation is less than 12, then set it to 12, and if greater
than 20, set it equal to 20. This way the Bollinger Band
periods will range between 12 and 20.

Stocks & Commodities V. 20:8 (46-56): Developing A Trading System by Dennis D. Peterson
Copyright (c) Technical Analysis Inc.
I can’t get MetaStock to do the right thing with this next
statement. Volbb is the volume for an up day (today’s
close>yesterday’s close). What I want for an entry condi-
tion is: if today is an up day and the volume for today is
greater than the last up day, set entry3 to be true.
entry3:=Volbb>Ref(volbb,-1);
entry4:=(C-O)/(H-L)>.2;
If all four entry conditions are true, then enter:
entry1 and entry2 and entry3 and entry4
EXIT CONDITIONS
standarddev:= 60;
periods:= 14;
StochRSI:=(RSI(periods)-LLV(RSI(periods),periods))/
(HHV(RSI(periods),periods)-LLV(RSI(periods),periods));
rdp1:=Round(Stdev(stochrsi,standarddev)/.053);
rdp2:=Round(Stdev(stochrsi,standarddev)/.035);
StochRSIvol:=(V-LLV(V,periods))/(HHV(V,periods)-
LLV(V,periods));
rdv1:=Round(Stdev(Mov(V,periods,S)/
1000000,standarddev));
adjust1:=rdv1-rdp2+14;
adjust1:=if(adjust1<8,8,adjust1);
adjust1:=if(adjust1>12,12,adjust1);
adjust2:=rdv1-rdp2+14;
adjust2:=if(adjust1<12,12,adjust2);
adjust2:=if(adjust1>20,20,adjust2);
periods:=adjust1;
BBpds:=adjust2;
Same comment as above — both of these thresholds need to
be adjusted slightly, but until I see how the trades go, I won’t
know. For now, I’ll just set them equal to two constants.
longthresholdexit:=0.7;
howclosetoBBtop:=0.8;
wprice:=(2*C+H+L)/4;
deviations:=.0625*BBpds+0.75;
StochRSI:=(RSI(periods)-LLV(RSI(periods),periods))/
(HHV(RSI(periods),periods)-
LLV(RSI(periods),periods));
toppercentage:=Abs((wprice-
BBandTop(wprice,BBpds,S,deviations))/
(BBandTop(wprice,BBpds,S,deviations)-
BBandBot(wprice,BBpds,S,deviations)));
{exit conditions}
exit1:=stochrsi<longthresholdexit;
exit2:=toppercentage<howclosetoBBtop;
exit3:=C>0.95*BBandTop(wprice,BBpds,S,deviations);
exit4:=C<BBandBot(wprice,BBpds,S,deviations);
(exit1 and exit2 and exit3) or exit4
WEALTH-LAB CHARTSCRIPT
This is the actual Wealth-Lab code that resulted:
var Bar, StandardDev, Periods, ExitBar123, EntryBar1234:
integer;
var StochRSISer, VolSer, MyBBandLower, MyBBandUpper,
WPrice: integer;
var rdp1, rdp2, rdv1, adjust1, adjust2, BBpds: integer;
var deviations, x, xPrice, bbBottom, bbTop: float;
var HowCloseToBBot, HowCloseToBBTop: float;
var LongThresholdEntry, BotPercentage,
LongThresholdExit, TopPercentage: float;
var Entry1, Entry2, Entry3, Entry4: boolean;
var Exit1, Exit2, Exit3, Exit4, Exit5, Exit6, Exit7: boolean;
var y, Vol, LastUpVol: float;
procedure PlotEntryRule( b: boolean; s: string );
begin
if b then
begin
y := y * 0.995;
AnnotateChart( s, 0, Bar, y, #Gray, 7 );
end;
end;
procedure PlotExitRule( b: boolean; s: string );
begin
if b then
begin
y := y * 1.005;
AnnotateChart( s, 0, Bar, y, #Gray, 7 );
end;
end;
StandardDev := 60;
Periods := 14;
{ Set up base StochRSI Series }
StochRSISer := StochRSISeries( #Close, Periods );
{ Set up average Volume Series }
VolSer := SMASeries( #Volume, Periods );
VolSer := DivideSeriesValue( VolSer, 1000000 );
{ Create Price Series to Hold Custom BBands }
MyBBandLower := CreateSeries;
MyBBandUpper := CreateSeries;
{ Create and Populate Weighted Price Series }
WPrice := CreateSeries;
for Bar := 0 to BarCount - 1 do
begin
x := ( 2 * PriceClose( Bar ) + PriceHigh( Bar ) + PriceLow( Bar
) ) / 4;
SetSeriesValue( Bar, WPrice, x );
end;
{ Main Loop ... executes once for each bar on chart }
ExitBar123 := 0;
EntryBar1234 := 0;
for Bar := StandardDev to BarCount - 1 do
begin
rdp1 := Round( StdDev( Bar, StochRSISer, StandardDev ) /

Stocks & Commodities V. 20:8 (46-56): Developing A Trading System by Dennis D. Peterson
Copyright (c) Technical Analysis Inc.
0.053 );
rdp2 := Round( StdDev( Bar, StochRSISer, StandardDev ) /
0.035 );
rdv1 := Round( StdDev( Bar, VolSer, StandardDev ) );
adjust1 := rdv1 - rdp1 + 11;
if adjust1 < 8 then
adjust1 := 8;
if adjust1 > 12 then
adjust1 := 12;
adjust2 := rdv1 - rdp2 + 14;
if adjust2 < 12 then
adjust2 := 12;
if adjust2 > 20 then
adjust2 := 20;
Periods := adjust1;
BBpds := adjust2;
deviations := 0.0625 * BBpds + 0.75;
bbBottom := BBandLower( Bar, WPrice, BBPds, deviations );
bbTop := BBandUpper( Bar, WPrice, BBPds, deviations );
SetSeriesValue( Bar, MyBBandLower, bbBottom );
SetSeriesValue( Bar, MyBBandUpper, bbTop );
HowCloseToBBot := 0.9;
LongThresholdEntry := 30;
xPrice := GetSeriesValue( Bar, WPrice );
botpercentage := Abs( ( xPrice - bbBottom ) / ( bbTop -
bbBottom ));
Entry1 := botpercentage - HowCloseToBBot < 0.3;
Entry2 := ( PriceClose( Bar ) * 1.05 > BBandLower( Bar,
WPrice, BBpds, deviations ) ) and
( StochRSI( Bar, #Close, Periods ) > LongThresholdEntry );
Entry3 := false;
if PriceClose( Bar ) > PriceClose( Bar - 1 ) then
begin
Vol := Volume( Bar );
if Vol > LastUpVol then
Entry3 := true;
LastUpVol := Vol;
end;
Entry4 := ( PriceClose( Bar ) - PriceOpen( Bar ) ) /
( PriceHigh( Bar ) - PriceLow( Bar ) ) > 0.2;
{ Position Entry Rules }
if not LastPositionActive then
begin
if Entry1 and Entry2 and Entry3 and Entry4 then
BuyAtMarket( Bar + 1, ‘’ );
{ See which Entry Conditions were met }
y := PriceLow( Bar );
PlotEntryRule( Entry1, ‘1’ );
PlotEntryRule( Entry2, ‘2’ );
PlotEntryRule( Entry3, ‘3’ );
PlotEntryRule( Entry4, ‘4’ );
end
else
{ Position Exit Rules }
begin
HowCloseToBBTop := 0.7;
LongThresholdExit := 70;
xPrice := GetSeriesValue( Bar, WPrice );
toppercentage := Abs( ( xPrice - bbTop ) / ( bbTop -
bbBottom ));
Exit1 := StochRSI( Bar, #Close, Periods ) < LongThresholdExit;
Exit2 := TopPercentage < HowCloseToBBTop;
Print( FloatToStr( TopPercentage ) + #9 + FloatToStr(
HowCloseToBBTop ) );
Exit3 := PriceClose( Bar ) > 0.95 * BBandUpper( Bar, #Close,
BBpds, deviations );
if Exit1 and Exit2 and Exit3 then
ExitBar123 := Bar;
Exit4 := PriceClose( Bar ) < BBandLower( Bar, #Close,
BBpds, deviations );
Exit5 := ( Bar - ExitBar123 < 4 );
Exit6 := PriceClose( Bar - 1 ) - PriceOpen( Bar - 1 ) < 0;
if Entry1 and Entry2 and Entry3 and Entry4 then
EntryBar1234 := Bar;
Exit7 := ( Bar - EntryBar1234 ) < 2;
if ( Exit5 and Exit4 ) then
SellAtMarket( Bar + 1, LastPosition, ‘4&5’ )
else if ( Exit6 and Exit7 ) then
SellAtMarket( Bar + 1, LastPosition, ‘6&7’ );
{ See which Exit Conditions were met }
y := PriceHigh( Bar );
PlotExitRule( Exit1, ‘1’ );
PlotExitRule( Exit2, ‘2’ );
PlotExitRule( Exit3, ‘3’ );
PlotExitRule( Exit4, ‘4’ );
PlotExitRule( Exit5, ‘5’ );
PlotExitRule( Exit6, ‘6’ );
PlotExitRule( Exit7, ‘7’ );
end;
end;
{ Plot Weighted Price }
PlotSeries( WPrice, 0, #Red, #Thin );
{ Plot Custom BBands }
PlotSeries( MyBBandUpper, 0, 337, #Thick );
PlotSeries( MyBBandLower, 0, 337, #Thick );
—D.D.P.
One of the problems I ran into was a limitation in MetaStock
for determining the volume of the previous up day. Further,
I wanted to see what asset allocation with various watchlists
would do. To find out, I turned to Wealth-Lab Developer.
Wealth-Lab Developer has some chartscripting features
not available in MetaStock. For example, the number of
periods used in StochR
SI
and the Bollinger Bands can be
calculated, rather than using a fixed number. Rather than
optimizing on the periods, I could now calculate them as a
function of price and volume volatility. After several runs
optimizing on periods, I found that in area A longer periods
were favorable, whereas in areas B, C, and D shorter periods
worked better. By optimizing, I was able to get an idea on how
I wanted to bias the choice of periods.
Another improvement I could make was to have the
volume for the up day (the day before I enter) be greater than
the volume for the previous up day. Since the previous up day
might be several bars back, encoding this kind of rule without
a loop is difficult, and I actually hit MetaStock’s code limit
when I tried using several nested if statements.
Having used A
OL
Time Warner (A
OL
) to lay out the
general approach, I used General Electric (GE) for refinements,
because GE has been all over the volatility map as well, and
I wanted to avoid tailoring too much to A
OL
. The results can
Stocks & Commodities V. 20:8 (46-56): Developing A Trading System by Dennis D. Peterson
Copyright (c) Technical Analysis Inc.
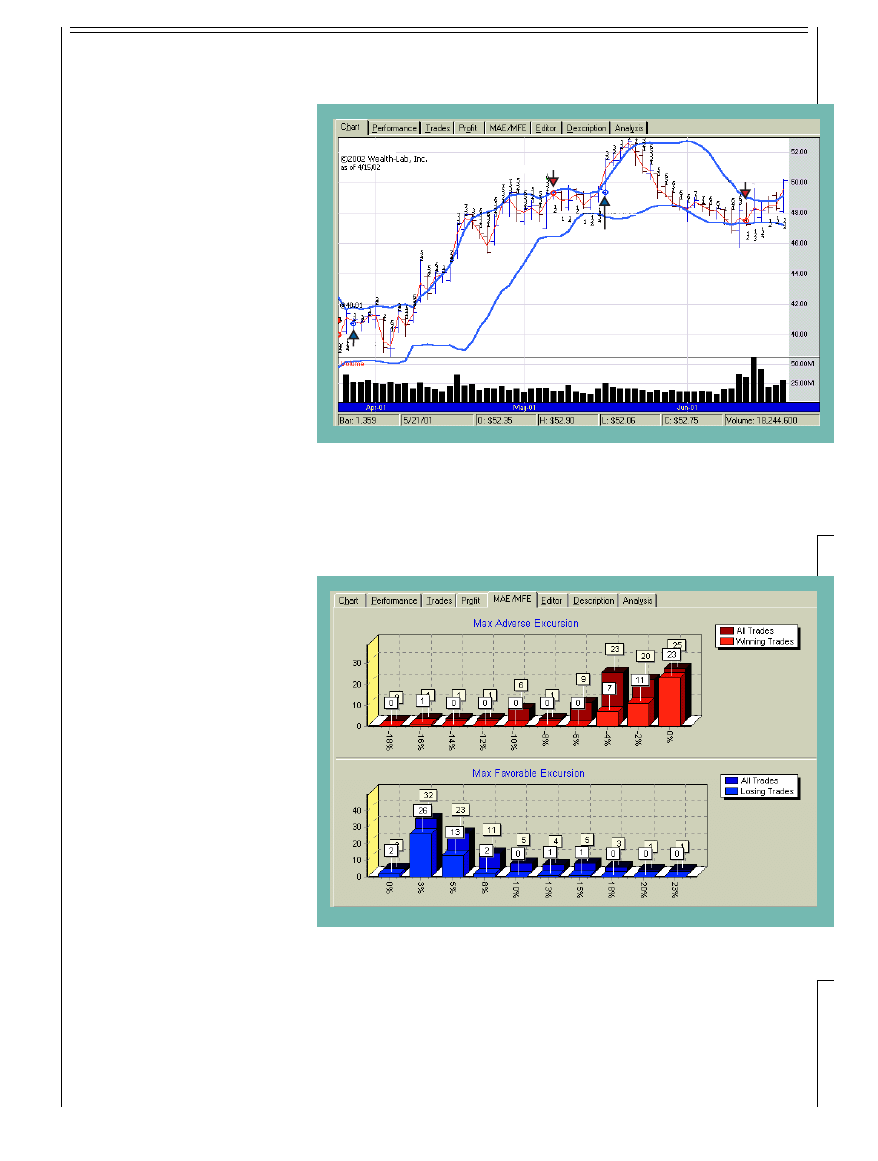
be seen in Figure 6. Entries are generally
chosen exactly the way I would want
them to be, but some exits caused losses
that seemed unnecessary.
It appeared that many of my losing
trades actually had gains before I took
the loss at exit — obviously, my exit
coding was still deficient. For example,
one trade entered in mid-May and exited
in mid-June had a gain before ending
with a loss. So how many of this
system’s trades have a profit before
seeing a loss?
One of the features of Wealth-Lab
Developer is that it allows you to look
at maximum adverse excursion† (M
AE
)
and maximum favorable excursion†
(M
FE
). What I find from Figure 7 is
that 26 losing trades made a profit of
3% and 13 losing trades made a profit
of 5% before finishing as losing trades.
What all this suggests is that rather
than fixing the exit rules, a shortcut
might simply be to use a trailing stop to
lock in profits. From Figure 6, I can
visually determine that I should encode
a rule that states if the midline of the
Bollinger Band is crossed after tagging
the upper band and losing enough
momentum, it is time to exit.
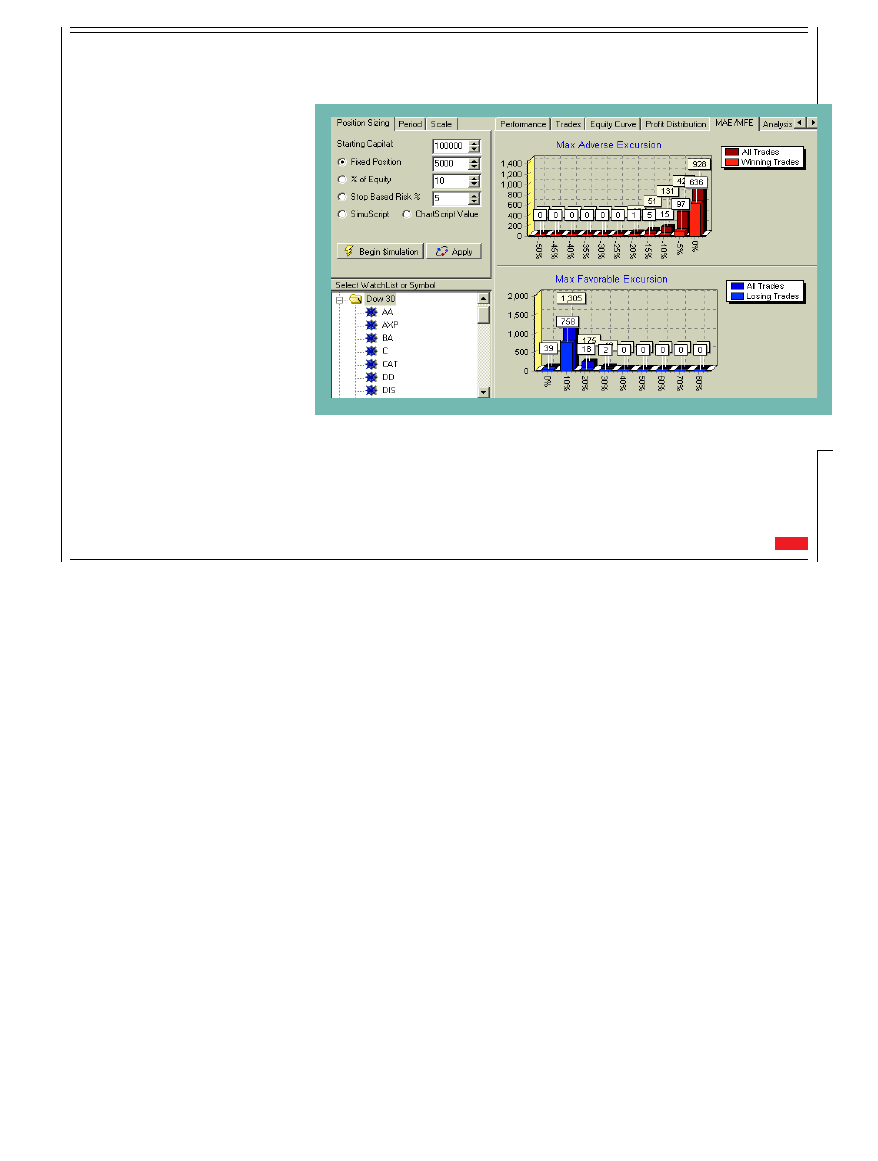
I then traded the Dow 30 stocks
using $5,000 per trade out of an initial
capital of $100,000 (Figure 8). The
results surprised me: 758 losing trades
made approximately 10% profit before
becoming losing trades. This suggests
that trailing stops used in conjunction
with Dow 30 stocks could shift 758
trades into the winning box, which
would boost the winning average well
above 60%.
Sounds good, doesn’t it? Here’s the
catch. Some of my biggest winners
were more than 10%. Now I am faced
with two different questions: Is it better
to take the smaller profits and run, or
continue to work on the logic for exit?
Obviously, it is just a matter of time
and skill to achieve a successful exit
strategy, but of course the enormous
advantage is that if you can encode
what your eye can see, then you have the option of running
several watchlists and seeing how they perform. These
concerns are typical when developing a trading system, and
what we have here is the start of one, not a final product.
FIGURE 6: GENERAL ELECTRIC (GE) DAILY PRICE AND VOLUME. The Wealth-Lab chart shows long positions
entered at blue up arrows and exits at red down arrows. The profit for each trade is shown as a green number and the
loss as a red number. The strengths and weaknesses of the trading system can be seen when an entry is made in mid-
March 2001 and the exit two months later in the beginning of May 2001 for a $1,028.96 profit, but then followed with a
trade entered in mid-May 2001 and an exit in mid-June 2001, for a $186.71 loss. Clearly the logic that needs to be
encoded is that once reaching the top of the band, the exit should occur when price passes below the simple moving
average for the Bollinger Band. While easy to visualize, it is difficult to code that kind of rule.
WEALTH-LAB
GE Daily
Sell 100 @ 47.52
Sell 120 @ 49.32
Buy 100 @ 49.32
120 @ 40.75
-186.71
1,028.96
FIGURE 7: MAXIMUM ADVERSE EXCURSION (MAE) AND MAXIMUM FAVORABLE EXCURSION (MFE) FOR
GENERAL ELECTRIC. MAE/MFE shows that 26 losing trades actually had a 3% gain before resulting in a loss.
Conversely, 18 winning trades took a 2% and 4% loss before resulting in a profit. This suggests that locking in profits
with a trailing stop might be one way to avoid further encoding.
S
UMMARY
With few exceptions, StochR
SI
is a better indicator than R
SI
.
Since it is a momentum indicator, it would be natural to use
it to buy when price is moving up. Bollinger Bands provide
Stocks & Commodities V. 20:8 (46-56): Developing A Trading System by Dennis D. Peterson
Copyright (c) Technical Analysis Inc.
S&C
†See Traders’ Glossary for definition
FIGURE 8: MAE/MFE FOR DOW 30. A bit of a surprise is that 758 of the losing trades made close to 10% profit before
turning into losing trades. The money management scheme uses, at most, 10% of your current capital in any one trade.
a way to see if price has been changing
to the low side (lower-band walkers) or
changing to the upside (upper-band
walkers). It is possible to build a solid
trading system with these two indicators.
But every trading system has a bias,
which could apply to the entire market
and not just a few stocks or commodities.
Software that can test your ideas is
available, and as you do your evalua-
tion, you might see the potential of the
system. If you start with something that
is fundamentally flawed, money man-
agement and stops can help, but it will
be difficult to make a profit. In the
trading system found in the sidebar
“Wealth-Lab and MetaStock script,”
the Wealth-Lab script allows you to
further adjust the periods for R
SI
and
the Bollinger Bands. Another improve-
ment would be to make the thresholds
self-adapting.
Dennis Peterson is a Staff Writer for S
TOCKS
& C
OMMODITIES
.
S
UGGESTED
READING
Chande, Tushar, and Stanley Kroll [1994]. The New Technical
Trader, John Wiley & Sons.
Wyszukiwarka
Podobne podstrony:
Jaekle Urban, Tomasini Emlio Trading Systems A New Approach To System Development And Portfolio Opt
Metastock Formule X Trading System fixed
Forex Intraday Pivots Trading System Complete System
MetaStock Trading System Commodity Channel Index CCI Buy and Sell Signals
5 min MA intraday trading system(update)
Mechanical Trading Systems
aaa truth about trading systems
Metastock Formule X Trading System fixed
12 FOREX Tools and Trading Systems
Trading With Bollinger Bands with Toni Turner
BONUS 4 Powerful Trend Trading System
(eBook) The Best Intraday Forex Trading System EVER
A hybrid financial trading system chaos theory,statistica,artificial intelligence
How To Make Money With Trading Systems Markus Heitkoetter
Van Tharp What is a Trading System
więcej podobnych podstron