America (And The World)
Faces Genuine
Energy/Electricity Challenges
America (And The World)
Faces Genuine
Energy/Electricity Challenges
Global WINDPOWER 2004
Chicago, Illinois
March 31, 2004
Presented By:
Matthew R. Simmons
Global WINDPOWER 2004
Chicago, Illinois
March 31, 2004
Presented By:
Matthew R. Simmons

S
IMMONS
& C
OMPANY
INTERNATIONAL
Renewable Energy Soon To
Be Urgently Needed
Renewable Energy Soon To
Be Urgently Needed
n
For years, renewable energy
was “clean energy luxury.”
n
Fossil fuels are now running
into limits to growth.
n
It is now critical that renewable energy users
understand their own limits to growth.
n
The future for wind must be bright.
n
The challenges might also be awesome.

S
IMMONS
& C
OMPANY
INTERNATIONAL
The Nub Of The Problem:
We Face An Energy Crisis
The Nub Of The Problem:
We Face An Energy Crisis
n
Future growth in electricity demand needs
to shift from total reliance on natural gas.
n
Shift to oil does not work.
n
Coal and nuclear capacity now
approximately 100%.
n
U.S. energy demand has to grow for U.S.
to prosper.
n
Problems to grow energy use: domestic oil
and natural gas supply are both in decline.
n
The U.S. (and world) need a real
substitution for both in order for demand to
grow.

S
IMMONS
& C
OMPANY
INTERNATIONAL
Energy Is The Heart And
Soul Of Our Economy
Energy Is The Heart And
Soul Of Our Economy
n
Petroleum creates our transportation.
n
Natural gas creates our “heat”.
n
Electricity is used in industrial, residential and
commercial.
n
For economy to prosper, electricity must grow.
n
All future growth was supposed to happen
through natural gas.
n
This assumption was wrong.

S
IMMONS
& C
OMPANY
INTERNATIONAL
America’s Electricity Is “Mother’s
Milk” To Our Prosperity
America’s Electricity Is “Mother’s
Milk” To Our Prosperity
n
A pearl in America’s prosperity has been our electric grid.
n
To grow U.S. GDP, electricity
must grow.
n
We became one of few country’s
to be totally electrified.
n
Blackouts were what Third World
countries suffered.
n
To avoid blackouts, electricity generation and transmission
need to exceed electricity demand.
n
While electricity was totally regulated, need to know
electricity was limited.

S
IMMONS
& C
OMPANY
INTERNATIONAL
America’s Electricity Model Was Flawed
America’s Electricity Model Was Flawed
n
People assumed demand growth was waning.
n
Electricity deregulation would make industry
“efficient”.
n
Electricity could be wheeled from “coast to coast”.
n
1,000 KW of capacity creates power for 1,000 homes.
n
It was safe to use one form of feedstock (natural gas)
to fuel all future growth.
All assumptions were wrong!

S
IMMONS
& C
OMPANY
INTERNATIONAL
Electricity Demand Is Still Growing
Electricity Demand Is Still Growing
n
Historical demand facts:
–
1973 - 2002: 2.7% per annum growth
–
1998 - 2002: 1.6% per annum growth
n
Slowdown was primarily mild weather driven.
–
Average monthly use (1998) = 291,000 MMKW
–
Peak use (Summer 2002) = 381,500 MMKW
n
Electricity growth parallels GDP growth in normal
weather.
n
If electricity growth stopped, so would GDP.
+31% or
7% per annum

S
IMMONS
& C
OMPANY
INTERNATIONAL
Electricity Deregulation Was Flawed
Electricity Deregulation Was Flawed
n
Wheeling electricity assumes
neighboring states do not share
same peak weather uses.
n
As wheeling grows in distance,
yield losses soar.
n
Deregulation used up
“reserve margins”.
n
Free markets never intentionally create cushion (called
reserve margins).
n
Electricity capacity is still tied to peak needs, not average
needs.

S
IMMONS
& C
OMPANY
INTERNATIONAL
“1,000 KW Creates Power For 1,000
Homes” Was Wrong
“1,000 KW Creates Power For 1,000
Homes” Was Wrong
n
If true, America would only need 300,000 MW
generating capacity.
–
110 million homes use 35% of U.S. power.
–
U.S. has 950,000 MW of total power capacity.
n
This standard was probably true 40 years ago.
n
Today, it understates generation needs by
two-thirds.
n
Or generation added only fuels one-third as
many homes as expected.

S
IMMONS
& C
OMPANY
INTERNATIONAL
In 1999, America Began A
Power-Adding Binge
In 1999, America Began A
Power-Adding Binge
n
1990’s: Long standing habit of expanding
power capacity ground to a halt.
n
Summer of 1999: 29 different blackouts /
brownouts.
n
America then went on a “Power Buying Spree”.
n
220,000 MW added by end of 2003.
n
98% was gas-fired power plants.
n
America bets its future onto natural gas.

S
IMMONS
& C
OMPANY
INTERNATIONAL
Some Think America Created
A Power Glut
Some Think America Created
A Power Glut
n
Many energy experts now assume
America created massive power glut.
n
August 2003 blackout happened on
only extremely muggy day.
n
Late February 2003 bitter weather sent
power prices to $400 to 1,000 KW/hour
across the U.S.
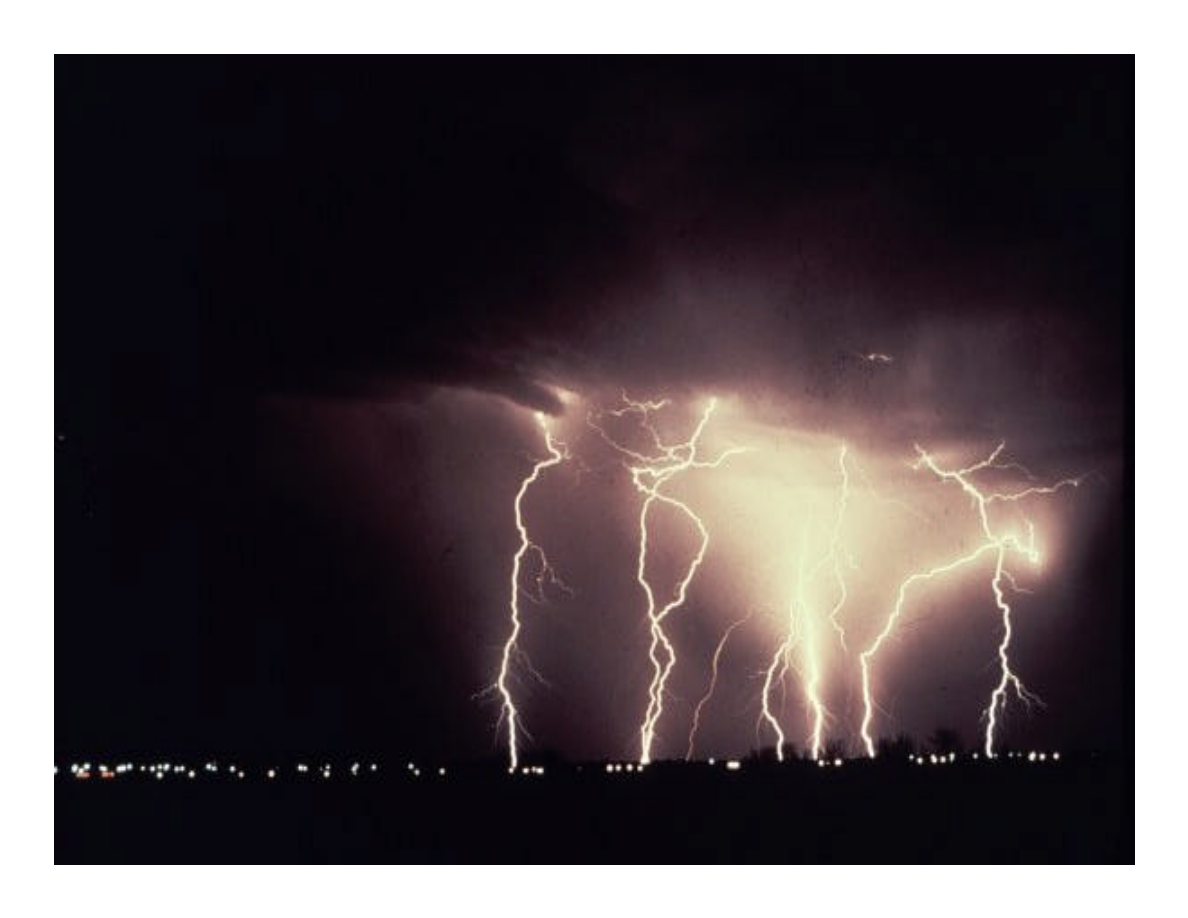
Simulated photo. Not true representation of the
August 2003 blackout.
n
If we have too much generating capacity, we forgot to
de-bottleneck transmission.
n
Spare capacity needs to be approximately 35% to 50%.

S
IMMONS
& C
OMPANY
INTERNATIONAL
America’s Bet On Natural Gas Was
Sound (If Supply Had Worked)
America’s Bet On Natural Gas Was
Sound (If Supply Had Worked)
n
Natural gas was a safe
economic bet.
–
Most efficient way to create
kilowatts.
–
Cheapest cost to build
generating capacity.
–
Cleanest form of fossil fuel.
–
Only form that turns on instantly.
n
The bet was essential.
–
All other forms operate at
effective 100% capacity.
–
Nuclear and coal take days to turn on.
Image courtesy of World Energy.
S
IMMONS
& C
OMPANY
INTERNATIONAL
Supply Constraints Made The Bet Bad
Supply Constraints Made The Bet Bad
n
NPC study (1999/2000) saw need for
supply to grow to 30 TCF.
n
NPC study (2003) shows how hard it will
be to keep supply even flat through 2009.
n
Conventional natural gas peaked in 1973.
n
Non-conventional gains created illusion that flat
supply in 1990s could grow if needed.
n
2000/2001 drilling boom shattered this dream.

S
IMMONS
& C
OMPANY
INTERNATIONAL
Natural Gas Prices Have Become
A “One-Way” Street
Natural Gas Prices Have Become
A “One-Way” Street
n
Commodity core assumptions:
–
High prices create surge in supply.
–
High prices also depress demand.
–
Low prices depress supply.
–
Low prices encourage greater demand.
n
This “thesis” underpins why commodities are
“commodating.”
n
High natural gas prices stimulate more “planting”
but not genuine supply growth.
n
If prices fall, supply also falls. (A one-say street)

S
IMMONS
& C
OMPANY
INTERNATIONAL
“Quo Vadis” Natural Gas Supply?
“Quo Vadis” Natural Gas Supply?
n
Conventional gas supplies are in steep decline.
–
New vintage gas wells decline by 40-50% in one year.
–
When production is > 10% of peak, final decline is
slow.
n
Oilfield technology revolution accelerated ability
to drain proved reserves.
n
Conventional gas supply peaked in 1973 at
63 bcf/day.
n
It is probably approximately 25 to 30 bcf/day
now.

S
IMMONS
& C
OMPANY
INTERNATIONAL
Creating Net Growth By
Non-Conventional Supply Is Tough
Creating Net Growth By
Non-Conventional Supply Is Tough
n
All non-conventional sources are
“non-conventional”.
n
Arctic gas has hurdles to overcome.
–
Proved North Slope gas is now injected.
–
McKenzie Delta gas “found” is not great.
–
Exploration in Arctic has been tough.
n
CBM/Tight Sands gas is small/wellhead.

S
IMMONS
& C
OMPANY
INTERNATIONAL
LNG’s Future Is Bright
(But Tough To Grow Fast)
LNG’s Future Is Bright
(But Tough To Grow Fast)
n
Global LNG markets are experiencing “Renaissance”.
n
U.S. was last to get aboard a fast moving train.
n
Why U.S. landed LNG has to grow.
2010 To
2015
(Bcf/day)
Implicit Demand
90
Probably U.S. Supply
40
Canadian/Arctic/Current LNG
10
Shortfall
40
ConocoPhillips Qatar Gas III: $5 billion for 1 bcf/day
of gas (in 2010). This is 2.5% of our need.

S
IMMONS
& C
OMPANY
INTERNATIONAL
Adequacy Of Global Natural Gas
Supply Is “Hazy”
Adequacy Of Global Natural Gas
Supply Is “Hazy”
n
All long-term global energy forecasts assume gas
demand will soar (and offset any surprises in oil supply).
n
Everyone assumes global gas supply is fabulous,
though stranded.
–
98% of “stranded” gas has never seen a drill bit.
–
Undrilled structures are not proved reserves.
n
65% of current global gas supply is in decline.
–
U.S./Canadian gas
–
Most of Russia’s gas
–
U.K. gas
–
Indonesian gas
–
Netherlands gas
If 2/3 of supply in decline, hard
for total growth to be high.

S
IMMONS
& C
OMPANY
INTERNATIONAL
How Did We Get Into This Energy Mess?
How Did We Get Into This Energy Mess?
n
Energy prices were “too low for too long”.
n
Low prices created illusion about energy security.
n
Low prices encouraged growth in demand.
n
Low prices inhibited growth of supply.
n
Supply growth might have ended
anyway.
n
Two decades of low energy prices took
a painful toll on energy sustainability,
let alone growth.

S
IMMONS
& C
OMPANY
INTERNATIONAL
What Will Future Energy Prices Be?
What Will Future Energy Prices Be?
n
For two decades, conventional energy wisdom
has assumed “prices are set to fall”.
n
Low prices inhibited any
supply growth and
stimulated energy demand.
n
There is no knowledge on
“replacement cost of a barrel of oil”.
n
Current prices are still too low.

S
IMMONS
& C
OMPANY
INTERNATIONAL
Global Energy Issues Are
Extremely Complex
Global Energy Issues Are
Extremely Complex
n
Worldwide oil demand at record high (exceeded
83 million b/d).
n
Natural gas and oil demand expected/needs to grow
by two-thirds over next 25 years.
n
World oil supplies are peaking.
n
Natural gas supplies could also peak.
n
This does not mean we have run out of either energy
source.
n
It does mean supply growth ends.
n
These are complex and serious issues.

S
IMMONS
& C
OMPANY
INTERNATIONAL
Investment
Bankers
to the
E
nergy
Industry
Wyszukiwarka
Podobne podstrony:
Effects of the Great?pression on the U S and the World
Healing Together How to Bring Peace into Your Life and the World
The Philippines and the World Market
War and the World, 1450 2000
Anderson, Kevin J Sky Captain and the World of Tomorrow
Anderson, Kevin J Sky Captain and the World of Tomorrow
DRUGS AND THE WORLD
Immanuel Wallerstein Islam, the West and the World (1999 Journal of Islamic Studies)
LECTURE 5 Britain and the world
The Mayan Calendar And The World s Prophecies Jonah Edition
Conspiracy CIA and The World Trade Centre
Culture and the World System
Anne Norton Leo Strauss and the Politics of American Empire (2004)
Alastair Sweeny Black Bonanza, Canada s Oil Sands and the Race to Secure North America s Energy Fut
Van Gosse, Richard R Moser The World the Sixties Made, Politics and Culture in Recent America (2003
Haruki Murakami HardBoiled Wonderland and the End of the World
The?lance in the World and Man
więcej podobnych podstron