1 Przemiany Me w jeziorach

|
0. ?° |
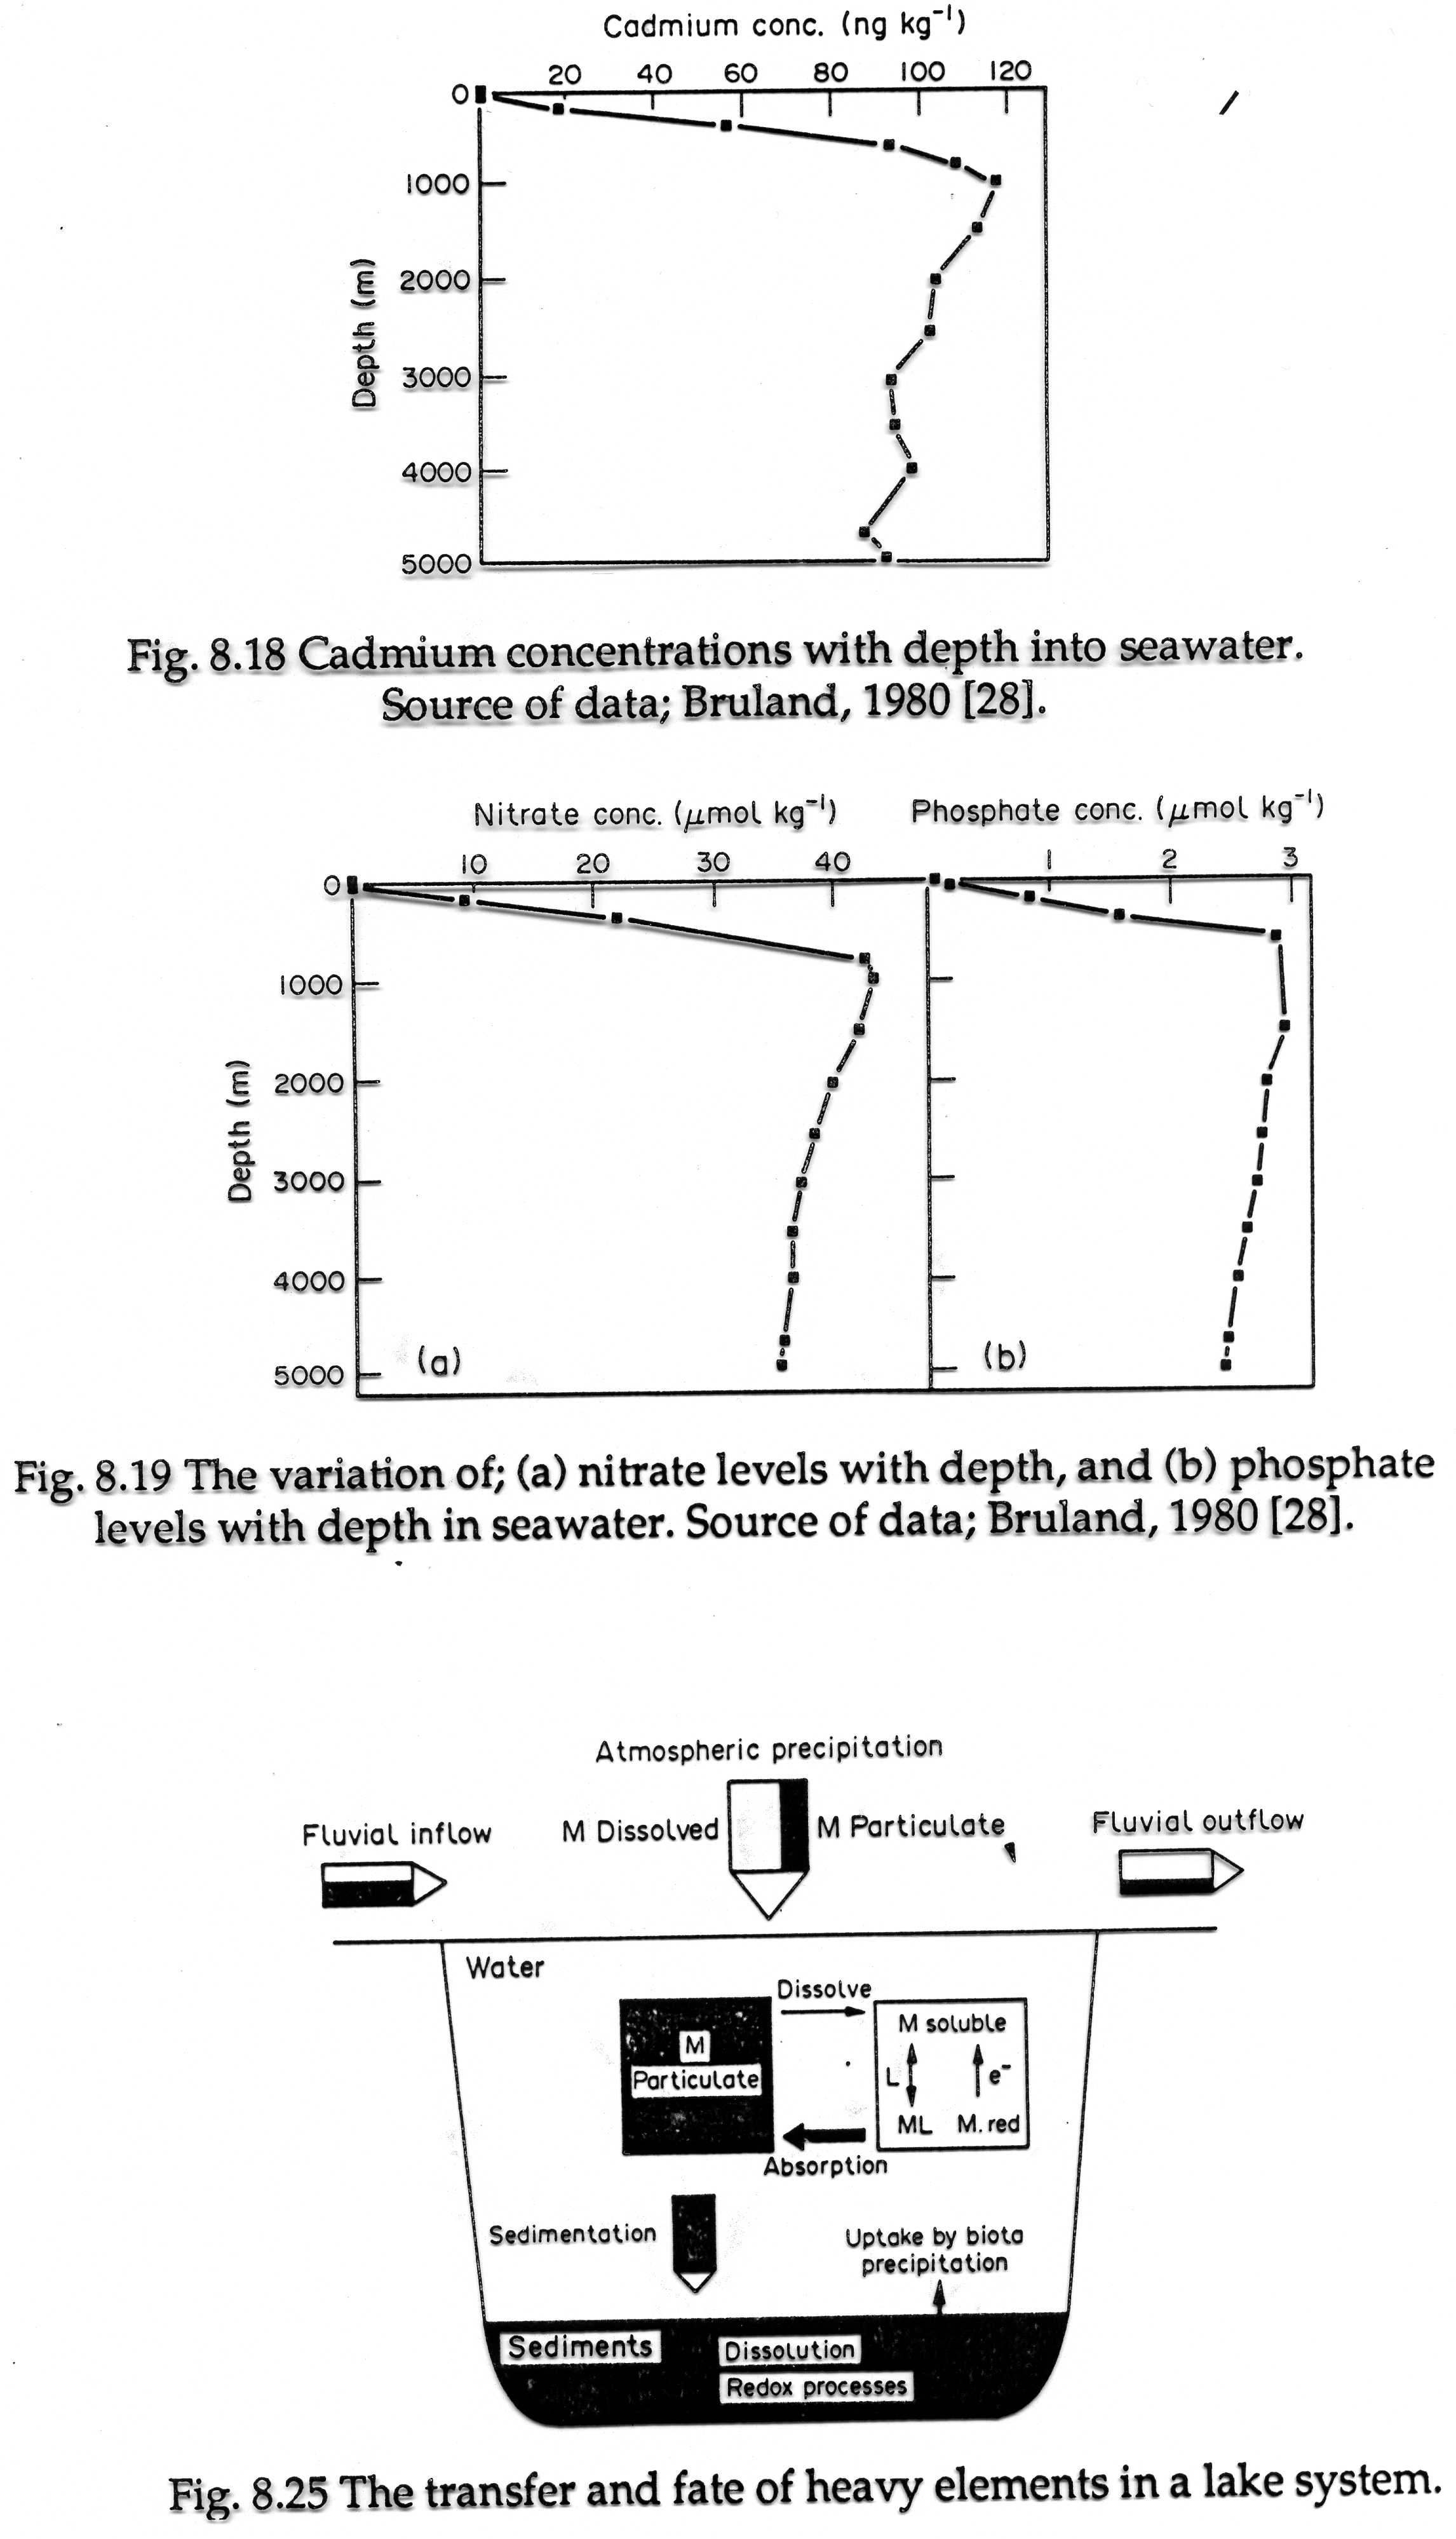
Cadmium conc. (ng kg-1) 40 60 80 100 120 -1-1-1-1-1—1 | |
|
IOOO |
— ■- | |
|
2000 |
/ 9 / ■ | |
|
3000 |
1 m / B \ | |
|
4000 |
\ B \ ■ | |
|
5000 |
/ •s | |
Fig. 8.18 Cadmium concentrations with depth into seawater. Source of data; Bruland, 1980 [28].
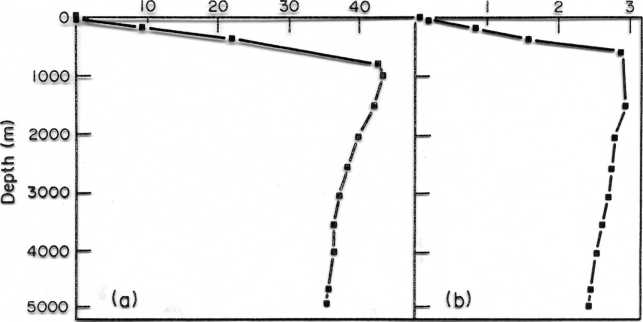
Nitrate conc. (/imol kg'1) Phosphate conc. (^.moL kg'1)

Fig. 8.19 The variation of; (a) nitrate levels with depth, and (b) phosphate levels with depth in seawater. Source of data; Bruland, 1980 [28].
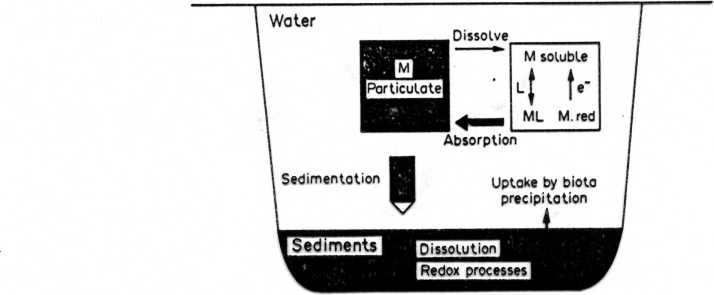
Atmospheric precipitalion
Ruvial infLow

M Dissolved

Fluvial outflow

M Particulate
1

Fig. 8.25 The transfer and fate of heavy elements in a lakę system.
Wyszukiwarka
Podobne podstrony:
100 200 amin 20 = 300 400 50$ 600 1.03 m/s mDistance (m) O 20 40 60 80 100 120 140 J.60 « Całculated
Databazove systemy 2014 Pocct studcntu 20 40 60 80 100 120 140 160 180 200
Wartość Yrms [mm/s] Ioz.6 999 Wartość Yrms [mm/s] loz.5 10 140 160 180 20U 220 Hz I 20 40 60 80 100
image 100 100 Wybrane problemy projektowania anten i szyków antenowych 0 0 20 40 6
A PKM2 high express»on o- PKM2 Iow expression T 0 T" 20 40 60 80 100 4
STRUKTURA WYDATKÓW W LATACH 2012 - 2015 2015 2014 2013 2012 0% 20% 40% 60% 80% 100% ■
acacia21 lilii! 1 I 1 I 1 I 1 I 1 I 1 I 1 I 1 I 1 I 1 iiiiiiiii 0’ 20 40’ 60’ 80’ 100 1 Dm lOm
P1050390 Rozpuszczalność gazów w wodzie II gaz 0° 20° 1_ 40° 60° 80° 100’ 11
IMGD10 20 40 60 80 procentowy stopie
Document (44) System zabierkowy podłużny z posadzką hydrauliczną przecinki od 40-60 m w odległości c
67858 lastscan13 (5) 0 20 40 60
Ł20 160 10 JO 40 60 ii • 100 140 W/ofoTTuenie300 m. I * * Rys. 34.
DSC04706 (3) Tablica 9919 Długość rur w metrach Rusztowania zewnętrzne rurowe o wysokości w m do 20
DSC05810 (2) co daje wartości: c Tablica £ 9 f 20° 40° 60° 80° 90° R
DSC04183 201) o -20 -40 -60 -80 Sztum Żabno Barie* :e 5 H—~- ~
więcej podobnych podstron