7a (45)

increase the speed of motor after a reaction temperaturę of about 60°C has been reached.
2.4. Expression of results
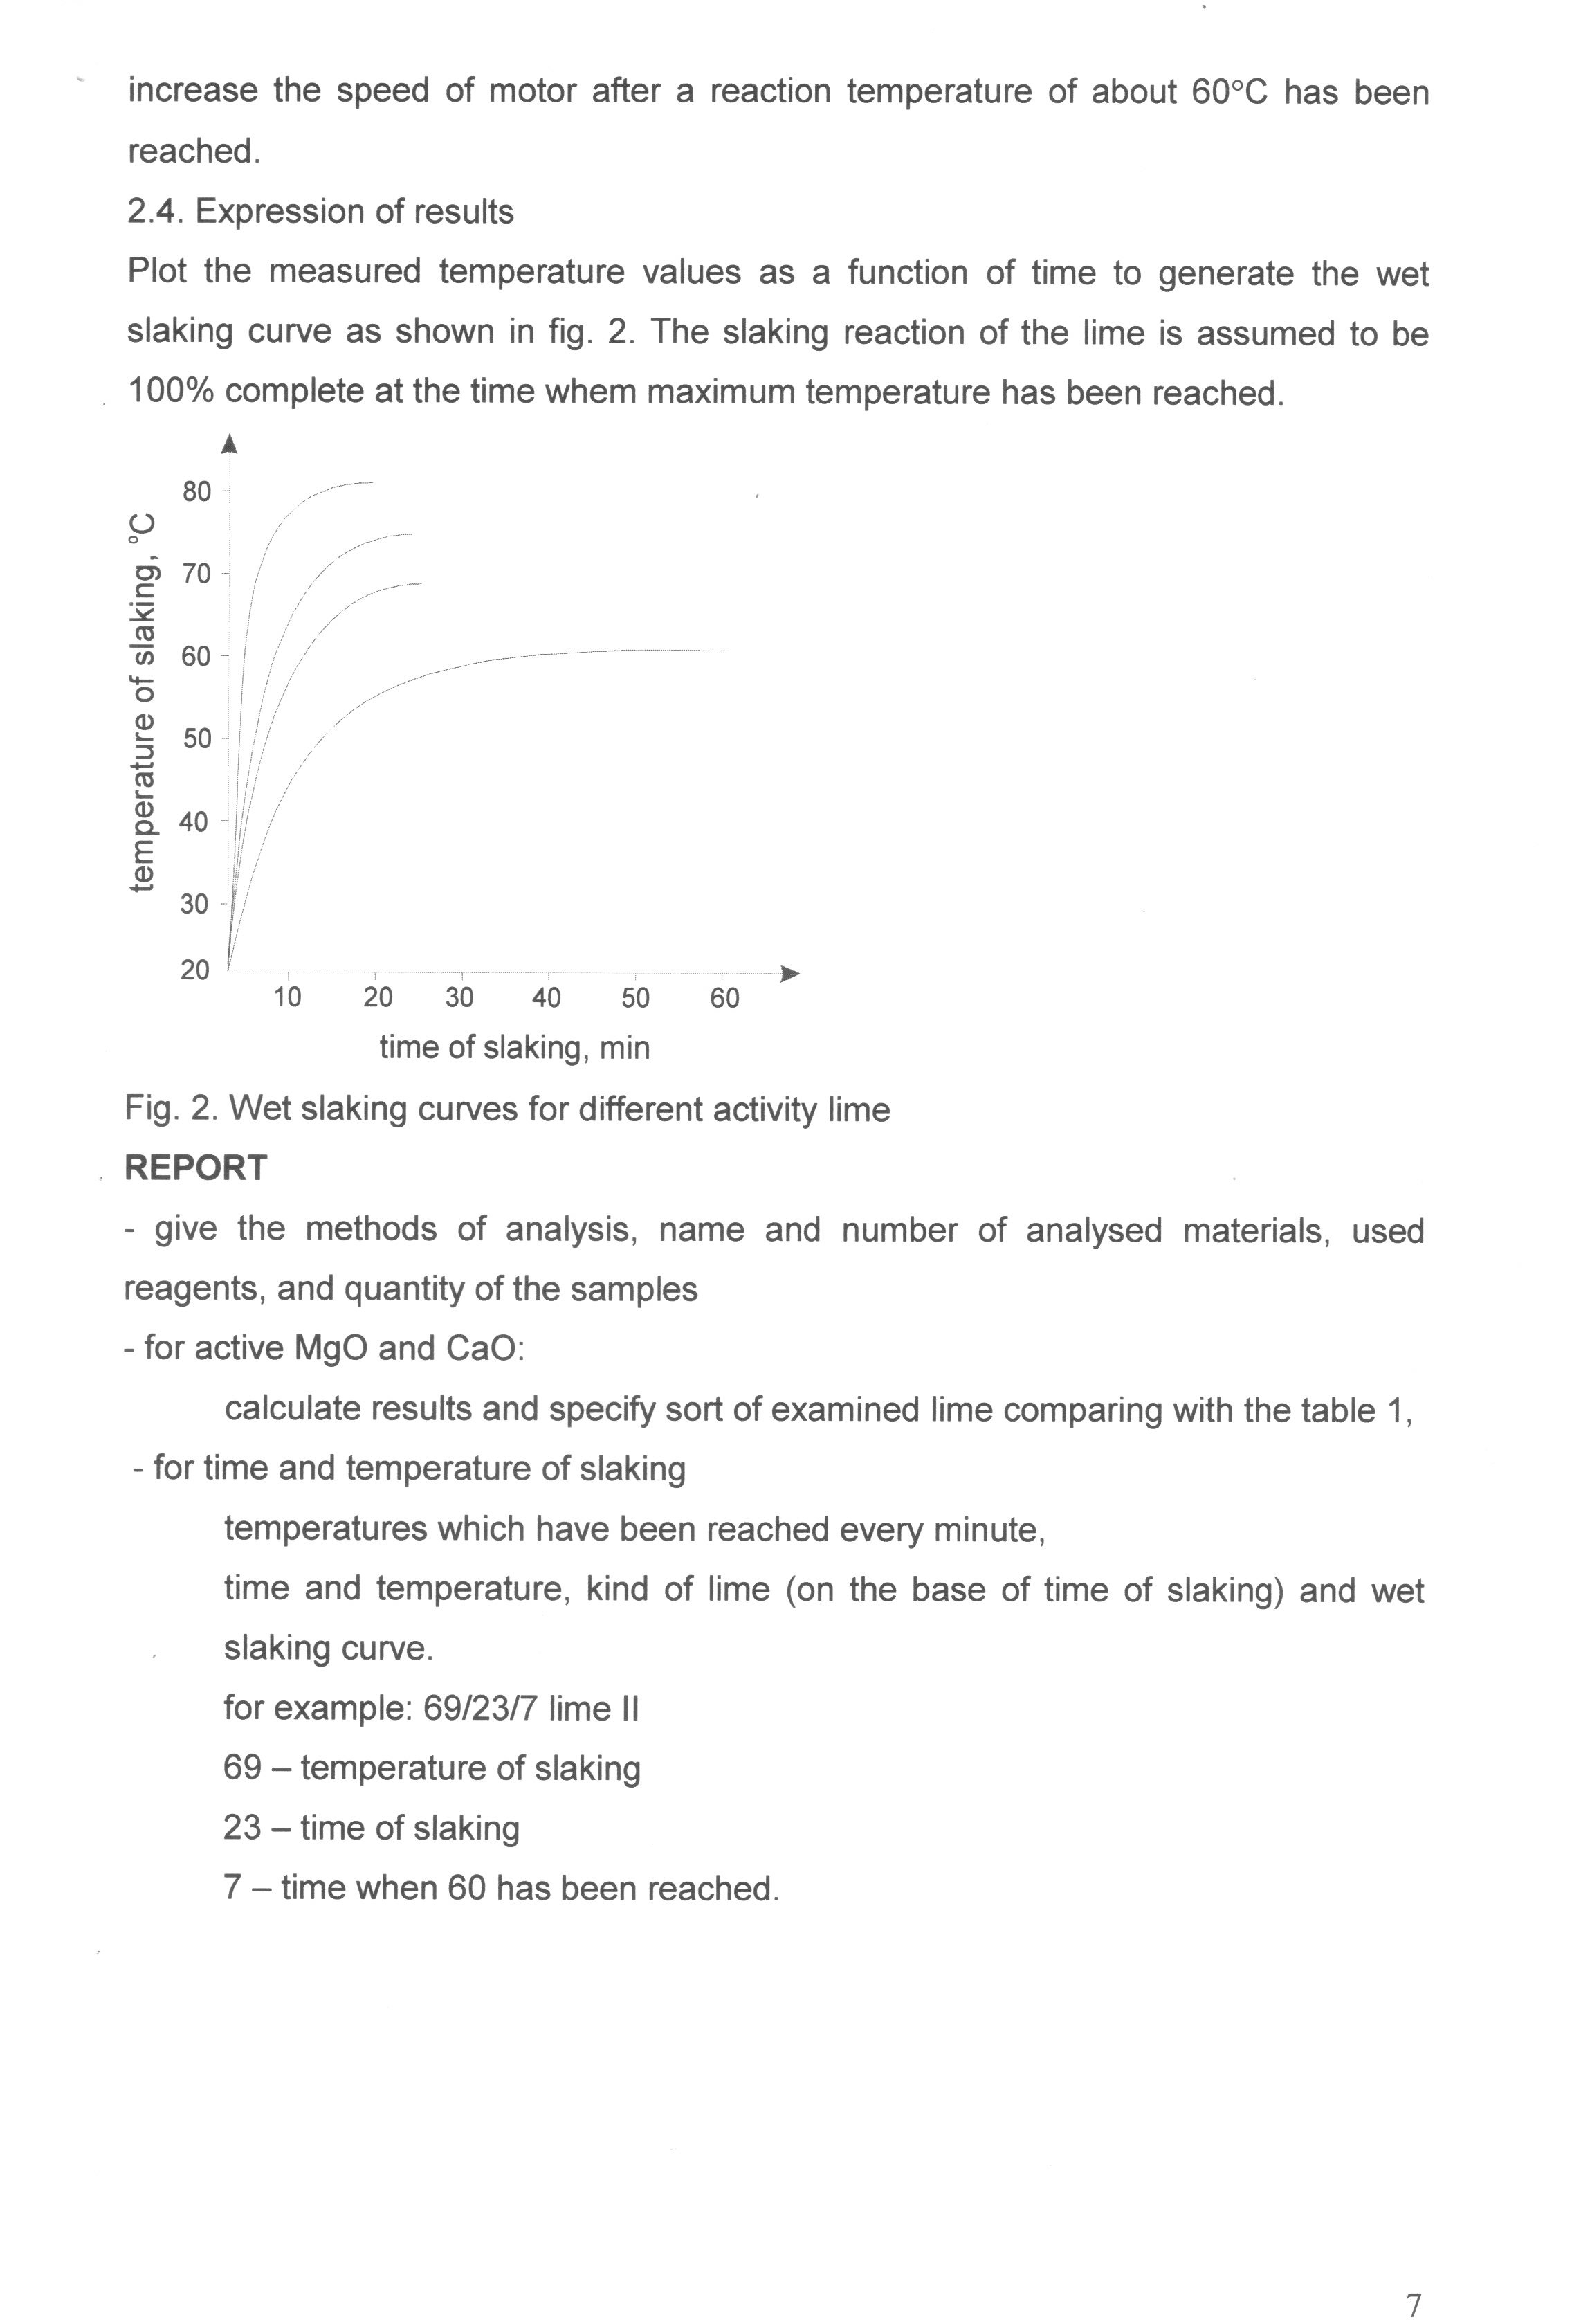
Plot the measured temperaturę values as a function of time to generate the wet slaking curve as shown in fig. 2. The slaking reaction of the limę is assumed to be 100% complete at the time whem maximum temperaturę has been reached.
A
80

<D
~ 30
20
10 20 30 40 50 60
time of slaking, min
Fig. 2. Wet slaking curves for different activity limę REPORT
- give the methods of analysis, name and number of analysed materials, used reagents, and quantity of the samples
- for active MgO and CaO:
calculate results and specify sort of examined limę comparing with the table 1,
- for time and temperaturę of slaking
temperatures which have been reached every minutę,
time and temperaturę, kind of limę (on the base of time of slaking) and wet slaking curve.
for example: 69/23/7 limę II 69 - temperaturę of slaking 23 - time of slaking 7 - time when 60 has been reached.
7
Wyszukiwarka
Podobne podstrony:
(31) In order to increase the availability of information on the use of medicinal products in t
IMG 140228�03 Garrison KeillorFaith at the Speed of Light L “Just in tcrms of aUocaiion of time rcso
mbs 124 MY BREATHING SYSTEM be found invaluable froin the point of view of increasing the rangę of e
Working in patient-facing roles or working outside of home significantly increases the likelihood of
13 5 Conflict Every negotiations cause potential conflicts. Premises thal increase the probability o
hammer of thor This mystic artifact can act once per tum. Its action can be used to increase the Pow
Wykres colo Click to increase the magnification of the entire page UTWORZONY PRZEZ PROGRAM EDUKACYJN
cw0020 Q
74 (50) linia środkowa Q. What is hairy, eats bananas and flies at twice the speed of sound?&nb
51 Annex 2.4 Page4 of 6 2000; and (III) to increase the prevalence of contraceptive use from 4.4% to
www.lawworks.org.ukl LawWorks is a national charity which increases the provision of free
11:30 11:45 8SP14. The role of transition duration in the perception of speech and nonspeech analogs
developed to increase the understanding of thc noise gencrated from engine drive chains. [Work suppo
What Is an Extended Yolume You can increase the size of an existing simple volume by extending the v
więcej podobnych podstron