2740390138
15
Diagnostyka - Diagnostics and Structural Health Monitoring 1(57)/2011 MEND ROK, MAJ, UHL, Laboratory Tests OfThe SHM System Based On Modal Filtration
ma
|
1_i |
■iF | |
|
C3 |
. . .-; r . .. | |

start data Processing command) and send Processing results.
The MDU can be accessed via Ethernet or USB, which is needed in system calibration pliase, or to read remotely processed results.
Analog signal processing module is shown in Figurę
2.
□ m ~
Fig. 2. Analog part of the Circuit measuring
The input analog signal is delivered from ICP accelerometer sensors mounted on examined object. ICP signal standard is based on 4-20 inA current signal transmission standard, which main advantage is the ability of transmitting signal (with 1 kHz frequency band wide) without any distortion at ranges of 100 m and morę.
4. DEDICATED SOFTWARE
The main goal of the software written for the described SHM system is the estimation of the modal filter coefficients. For this purpose, tlie application prorides the following functionalities:
• Geoinetrical model definition of the tested object.
• Measurement points definition, namely the assigmnent of specific points of a geometrie model to the sensors placed on an object.
• Execution of measurement and presentation of the results (tirne histories, PSD, FRF and coherence), and data archiving.
• Execution of modal analysis by:
- calculation of stabilization diagram,
- estimation and visualization of modę shapes for selected poles,
- estimation of modal filter coefficients and visuaIization of filtration results.
The application was created in the .Net Framework 3.5 environment with use of additional extemal libraries:
- Developer Express v9.1 (tables and standard application Controls)
- Steema TeeCliart for .Net v3 (cliarts)
- Intel IPP (signal spectrum calculation)
Ali calculations related to the modal analysis are performed by the Matlab engine. The application provides the ability to debug these functions from Matlab level. For this reason, at tlie user-specified location, inat-files are stored that contain input parameters for the appropriate Matlab functions.
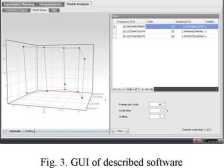
In Figurę 3 the graphical user interface of described software allowing for impulse modal testing and modę sliape visualization control is presented.
It was assumed tliat in order to fluently visualize the modę shapes it is necessary to refresh with a minimum speed of 30 fps. There are not available on the market sufficiently effective Controls to allow the visualization and animation of 3D models with the assumed speed. Therefore. implementation of such control was done by using the XNA environment. The control uses a graphics accelerator which allows for refresh at 60 fps at 10,000 points of geoinetrical model.
5. PROGRAM OF TESTS
The tested object was a cantilever beam madę of aluminum alloy. Its dimensions amounted 50 x 4 x 1000 mm. The object was divided into 9 measuring points eąually spaced every 100 mm, placed along the longitudinal axis of the beam. The points were designated blk: 1. .... blk:9 starting from the top. The beam was excited with the electro-dynamie shaker attached via stinger in point blk: 1. The excitation force was measured together with the acceleration of vibrations by the impedance head. In remaining points the acceleration of vibrations were measured by piezoelectric accelerometers. In Figurę 4 the measuring stand is presented.
Wyszukiwarka
Podobne podstrony:
14 Diagnostyka - Diagnostics and Structural Health Monitoring 1(57)/2011 MEND ROK, MAJ, UHL, Laborat
17 Diagnostyka - Diagnostics and Structural Health Monitoring 1(57)/2011 MEND ROK, MAJ, UHL, Laborat
8 Diagnostyka - Diagnostics and Structural Health Monitoring l(57)/2011 GONTARZ,
Diagnostyka - Diagnostics and Structural Health Monitoring l(57)/2011 9 GONTARZ,
10 Diagnostyka - Diagnostics and Structural Health Monitoring 1(57)/2011 GONTARZ,
Diagnostyka - Diagnostics and Structural Health Monitoring l(57)/2011 11 GONTARZ,
13 Diagnostyka - Diagnostics and Structural Health Monitoring 1(57)/2011 MENDROK, MAJ, UHL, Laborato
16 Diagnostyka - Diagnostics and Structural Health Monitoring 1(57)/2011 MENDROK, MAJ, UHL, Laborato
18 Diagnostyka - Diagnostics and Structural Health Monitoring 1(57)/2011 MENDROK, MAJ, UHL, Laborato
Diagnostyka - Diagnostics and Structural Health Monitoring 1(57)/2011 Spis treści / Contents Szymon
Diagnostyka - Diagnostics and Structural Health Monitoring 1(57)/2011 3 GONTARZ,
4 Diagnostyka - Diagnostics and Structural Health Monitoring l(57)/2011 GONTARZ,
Diagnostyka - Diagnostics and Structural Health Monitoring l(57)/2011 5 GONTARZ,
6 Diagnostyka - Diagnostics and Structural Health Monitoring l(57)/2011 GONTARZ,
Diagnostyka - Diagnostics and Structural Health Monitoring 1(57)/2011 GONTARZ, RADKOWSKI, Magnetic M
Diagnostyka - Applied Structural Health, Usage and Condition Monitoring’ 3(63)/2012 Cholewa, Amarowi
Diagnostyka - Applied Structural Health, Usage and Condition Monitoring’ 3(63)/2012
10 Diagnostyka - Applied Structural Health, Usage and Condition Monitoring’ 3(63)/2012 CISZEWSKI, BU
Diagnostyka - Applied Structural Health, Usage and Condition Monitoring’ 3(63)/2012
więcej podobnych podstron