2740390139
16
Diagnostyka - Diagnostics and Structural Health Monitoring 1(57)/2011 MENDROK, MAJ, UHL, Laboratory Tests OfThe SHM System Based On Modal Filtration

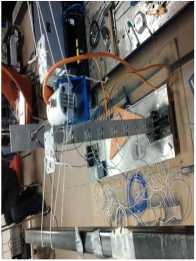
Fig. 4. Photo of the laboratoiy stand
Table 1. Comparison of beanTs modal parameters
|
MS |
NF- LMS [Hzl |
NF- MDU [Hzl |
MDC- LMS [%] |
MDC- MDU [%1 |
|
1 |
24.7 |
24.7 |
0.62 |
0.69 |
|
2 |
68.5 |
68.5 |
0.26 |
0.39 |
|
3 |
133.7 |
133.8 |
0.32 |
0.27 |
|
4 |
222.9 |
222.8 |
0.34 |
0.28 |
|
5 |
331.9 |
331.9 |
0.22 |
0.24 |
|
6 |
461.2 |
461.2 |
0.24 |
0.28 |
The excitation signal had a band noise character with freąuency rangę 0.1 - 512 Hz. The sampling freąuency was set at 1024 Hz, the length of recorded time histories amounted 200 s.
The following ineasureinents were performed:
- undamaged beam, ambient temperaturę 20° C, measuring system - Scadas Mobile / TestLab 8A,
- undamaged beam, ambient temperaturę 20° C,
- undamaged beam, ambient temperaturę 20° C,
- undamaged beam, ambient temperaturę 20° C, sensors reassembled,
- undamaged beam. ambient temperaturę 310 C,
- damaged beam (added mass 4 g in point blk:5), ambient temperaturę 20° C,
- damaged beam (added mass 4 g in point blk:9), ambient temperaturę 20° C,
- damaged beam (added mass 15 g in point blk:5), ambient temperaturę 20° C,
- damaged beam (added mass 15 g in point blk:9), ambient temperaturę 20° C,
Ali the measurements except the first one were performed with use of the tested measuring-diagnostic unit. Ali the results were evaluated with use of damage index proposed in [6]:
*/h-W-*■»!’*» (1)
DI -
\xrel(a)1da
where: ®/ - starting and closing freąuency of
the analyzed band,
xh xref - characteristic in the current and reference State respectively..
Additionally the visual assessment of modal filtration results was performed.
6. RESULTS OF EXPERIMENTS
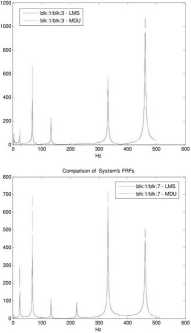
In this section the results of analyses will be presented. In the first step the measuring performance of the newly designed MDU was compared with the coimnercial modal analysis system provided by LMS Intl. In Figurę 5 the comparison between corresponding FRFs measured and estimated with use of MDU and LMS system. Then, on the basis of measurements performed in the reference State, modal analysis was performed and eigenfreąuencies, the corresponding modal damping ratios and modę shapes were estimated. Table 1 shows the identified modal parameters using the LMS system and the authors software.

Fig. 5. Comparison of beam’s FRFs obtained with use of two systems
Wyszukiwarka
Podobne podstrony:
13 Diagnostyka - Diagnostics and Structural Health Monitoring 1(57)/2011 MENDROK, MAJ, UHL, Laborato
18 Diagnostyka - Diagnostics and Structural Health Monitoring 1(57)/2011 MENDROK, MAJ, UHL, Laborato
8 Diagnostyka - Diagnostics and Structural Health Monitoring l(57)/2011 GONTARZ,
Diagnostyka - Diagnostics and Structural Health Monitoring l(57)/2011 9 GONTARZ,
10 Diagnostyka - Diagnostics and Structural Health Monitoring 1(57)/2011 GONTARZ,
Diagnostyka - Diagnostics and Structural Health Monitoring l(57)/2011 11 GONTARZ,
14 Diagnostyka - Diagnostics and Structural Health Monitoring 1(57)/2011 MEND ROK, MAJ, UHL, Laborat
15 Diagnostyka - Diagnostics and Structural Health Monitoring 1(57)/2011 MEND ROK, MAJ, UHL, Laborat
17 Diagnostyka - Diagnostics and Structural Health Monitoring 1(57)/2011 MEND ROK, MAJ, UHL, Laborat
Diagnostyka - Diagnostics and Structural Health Monitoring 1(57)/2011 Spis treści / Contents Szymon
Diagnostyka - Diagnostics and Structural Health Monitoring 1(57)/2011 3 GONTARZ,
4 Diagnostyka - Diagnostics and Structural Health Monitoring l(57)/2011 GONTARZ,
Diagnostyka - Diagnostics and Structural Health Monitoring l(57)/2011 5 GONTARZ,
6 Diagnostyka - Diagnostics and Structural Health Monitoring l(57)/2011 GONTARZ,
Diagnostyka - Diagnostics and Structural Health Monitoring 1(57)/2011 GONTARZ, RADKOWSKI, Magnetic M
Diagnostyka - Applied Structural Health, Usage and Condition Monitoring’ 3(63)/2012 Cholewa, Amarowi
Diagnostyka - Applied Structural Health, Usage and Condition Monitoring’ 3(63)/2012
10 Diagnostyka - Applied Structural Health, Usage and Condition Monitoring’ 3(63)/2012 CISZEWSKI, BU
Diagnostyka - Applied Structural Health, Usage and Condition Monitoring’ 3(63)/2012
więcej podobnych podstron