4788236469
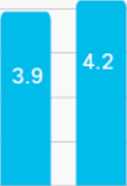
Figurę 1. Global Internet uscr growth
Figurę 1. Global Internet uscr growth
6% CAGR
2018-2023
Billions of Internet Users

6 5 4 3 2 1 0
2018 2019
Tabie 1. Internet users as a percentage of regional populatton
Global 51%
Asia Pacific 51%
Central and Eastem Europę 65%
Latln America 60%
Middle East and Afrlca 24%
North America 90%
Western Europę 82%

2023
66%
72%
78%
70%
35%
92%
87%
Source Cisco Annual Internet Report. 2018-2023
Wyszukiwarka
Podobne podstrony:
Figurę 11. Global public Wi-Fi hotspots growth by region 30% CAGR 2018-2023 Millions of Hotspots 201
S5002277 Figurę Z: as me snaon appnzawi iw» w w ... the rotat on of the part can actuafły puH the Tr
Frequency Rangę International Region 3 Allocation New Zealand Allocation Summary of Usage Reterences
Frequency Rangę International Region 3 Allocation New Zealand Allocation Summary of Usage References
Frequency Rangę International Region 3 Allocation New Zealand Allocation Summary of Usage References
Frequency Rangę International Region 3 Allocation New Zealand Allocation Summary of Usage References
Frequency Rangę International Region 3 Allocation New Zealand Allocation Summary of Usage References
Frequency Rangę International Region 3 Allocation New Zealand Allocation Summary of Usage References
Frequency Rangę International Region 3 Allocation New Zealand Allocation Summary of Usage References
SCAN0129 CHAPTER 5 T Crystalline Lens 93 A FIGURĘ 5-8 Fetal and adult lenses, showing sutures and ar
milo 01 16 Figurę 18 EXERCISE NO. 9 To Develop thc Mu»c!e» of tho Abdomen (This cxcrcise should not
Proceeding of the 2 nd International Conference Humań resources - the Main Factor of Regional DeveIo
both in local and global scalę. The article presents a verification and assessment of the effective
grzybica strzygąca Figurę 1: Erythematou s desquama-tive alopecia In parletoc-clpltal regi
więcej podobnych podstron