4788236481
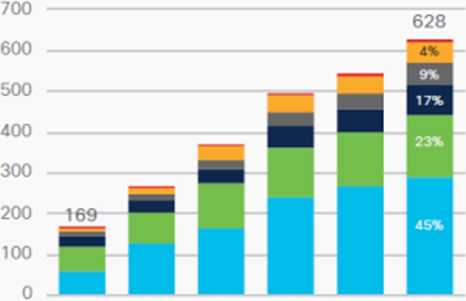
Figurę 11. Global public Wi-Fi hotspots growth by region
30% CAGR
2018-2023
Millions of Hotspots
2018 2019 2020 2021 2022 2023
* Middle East and Afnca represents 1 % of global public Wi-Fi hotspots by 2023
■ Middle East and Africa (30% CAGR)
■ Central and Eastern Europę (38% CAGR)
■ latin Amenca (37% CAGR)
■ North America (25% CAGR)
■ Western Europę (20% CAGR)
■ Asia Pacific (37% CAGR)
Source: Maravedis. Cisco Annual Internet Report. 2018-2023
Wyszukiwarka
Podobne podstrony:
28 (119) ► FIGURĘ 11-1 The submcrńble Alvin shcds light on hydrothemul vems at the Galapagos Kift, a
Figurę 1. Global Internet uscr growth Figurę 1. Global Internet uscr growth 6% CAGR 2018-2023 Billio
Figurę 8. Global mobile device and connection growth7 6 5Billions of Devices or Connections 3 3
.i AT&T Wi-Fi ^ 11:17 AM 77% (BI . Morę Find Done ♦> Transitions and
połączenie miecza na wrąb czołowy kryty Lech - Bud Nidzica 11 m f/yĄ Wi f&f fi V >S
f2 11 FIGURĘ 2.11 D w doping software using the Java API.
fig11 Figurę 11 Gold Hnafatafl piece from Tuse in Denmark
00046 ?c2509350e21c3447d8db6068221f3a 45 A Rule-Based Approach to Multiple Statistical Test Analysi
00073 ?669057b99e1a32461d685010d9b1f0 72Hembree & Zimmer Figurę 11. Adaptiye Filter Weights (tr
00381 ?c79f45a4235fae8108ab837f609112 385 Regret Indices and Capability Quantification Figurę 11. C
45 fractions obtenues (PRHex 1 a PRHex 7) sont presentees a la figurę 11. Les resultats de tests d’a
więcej podobnych podstron