6355787699
14 Diagnostyka’ l(45)/2008
RYBCZYŃSKI, Maps ofTolerable Misalignmenls of Bearings Applicable...
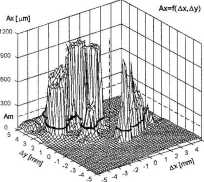
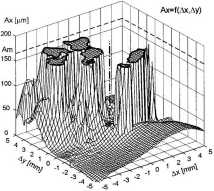
Fig. 2. The graphs showing vibrational response in the bearing 5 to displacements of the same bearing 5. Up: fuli scalę of bearing vibration. Down: vertical axis magnified and cut at a parameter permissible level. Weil visible are areas of prohibited bearing dislocations (shaded dark) at the limit level
4. VIBRATIONAL MAPS OF BEARING DISLOCATIONS
Ax=f(Ax, Ay) - relative vibration amplitudes in the direction of the flrst quarter bisector,
Ay=f(Ax, Ay) - relative vibration amplitudes in the direction of the second ąuarter bisector,
Vx=f(Ax, Ay) - RMS velocities of absolute vibrations in the horizontal direction,
Vy=f(Ax, Ay) - RMS velocities of absolute vibrations in the vertical direction,
Sample diagrams of this type are presented in Fig. 2. The figurę shows the sample function Ax=f(Ax, Ay), presenting the effect of dislocation of the bearing 5 on the relative horizontal vibration amplitudę observed in the same bearing 5.
In the diagrams, the base bearing position on the catenary, (i.e. when the misalignment defect is missing), is marked with a vertical linę starting from the centre of the dislocation piane, point Ax= 0, Ay=0. An arbitrary bearing dislocation by a vector [Ax, Ay] corresponds to certain values of the parameters Ax, Ay, Vx, Vy which can be read from the diagrams. On the _y-axis, the level representing the permissible limit for the earlier defined parameter A/im =165pm is marked. The Crossing of the surface presented in the diagram with the piane parallel to the x-y piane and situated at the permissible limit level gives the level linę shown in the upper part of the Fig. 2. Figures of this type were also prepared in a modified form, which cuts off the diagrams at the level of the parameter limit. As a result of this action the prohibited bearing dislocations are better visible and the distribution of the analysed parameter on the x-y piane is morę readable. The lower graph of Fig. 2 presents sample of this type, which correspond to those shown in the left graph.
The projection of a cut of the vibration graph on the limiting level onto the dislocation piane defines the region of prohibited bearing dislocations from the viewpoint of a given criterion. When, in any way, the bush centre falls into this region, the machinę should be stopped from operation as it means that the permissible limit for one of operating parameters was exceeded in one of the bearings.
The response of the machinę to the bearing misalignment primarily is presented in the form of three-dimensional graphs showing the intensity of vibrations of machinę elements as a function of bearing dislocation. In the most voluminous form the results of the research are presented in 49 sets of graphs of this type. Each set presents the distributions of all analysed parameters in one of the seven bearings as functions of individual dislocations of one of the seven bearings. Thus the effects of misalignment of 7 bearings on those 7 bearing vibrational characteristics can be presented using 49 sets of diagrams, having the form of a function: effect =f(Ax, Ay). By standard every set of the results contains four function graphs:
5. MAPS OF PERMISSIBLE BEARING DISLOCATION AREAS
From the practical point of view, of high usability are simplified figures showing the division of the area of the expected bearing dislocations into the sub-areas of permissible and prohibited dislocations. Diagrams of this type may be regarded as maps of permissible/prohibited bearing dislocation. They are presented in Figs 3-6. Figs 3 and 4 are calculated with respect to the limit of relative bearing vibration, A/im = 165 pm, and Figs 5 and 6 are calculated with respect to the limit of absolute bearing vibration, VRMs nm = 7,5 mm/s.
Wyszukiwarka
Podobne podstrony:
12 Diagnostyka’ l(45)/2008 RYBCZYŃSKI, Maps ofTolerable Misalignments of Bearings
16 Diagnostyka’ l(45)/2008 RYBCZYŃSKI, Maps ofTolerable Misalignmenls of Bearings
Diagnostyka’ l(45)/2008 RYBCZYŃSKI, Maps offolerable Misalignments of Bearings Applicable...MAPS OF
20 Diagnostyka’ l(45)/2008 RYBCZYŃSKI, Maps ofTolerable Misalignments ofBearings
Diagnostyka’ l(45)/2008 13 RYBCZYŃSKI, Maps ofTolerable Misalignments of Bearings
Diagnostyka’ l(45)/2008 15 RYBCZYŃSKI, Maps ofTolerable Misalignmenls of Bearings
Diagnostyka’ l(45)/2008 17 RYBCZYŃSKI, Maps ofTolerable Misalignmenls of Bearings
Diagnostyka’ l(45)/2008 19 RYBCZYŃSKI, Maps ofTolerable Misalignments of Bearings
18 Diagnostyka’ l(45)/2008 _RYBCZYŃSKI, Maps ofTolerable Misa/ignments ofBearings
14 Diagnostyka’ 4(48)/2008 KEKEZ, AMBROZIK, RADZISZEWSKI, Modeling of Cylinder Pre
10 Diagnostyka’ l(45)/2008 GUMIŃSKI, JASIŃSKI, RADKOWSKI, Small-Sized Test Bedfor
Diagnostyka’ l(45)/2008 Spis treści Joanna IWANIEC - AGH
Diagnostyka’ l(45)/2008 GUMIŃSKI, JASIŃSKI, RADKOWSKI, Small-Sized Test Bedfor
Diagnostyka’ l(45)/2008 GUMIŃSKI, JASIŃSKI, RADKOWSKI, Small-Sized Test Bedfor Diagnosing... broader
Diagnostyka’ l(45)/2008 GUMIŃSKI, JASIŃSKI, RADKOWSKI, Small-Sized Test Bedfor Diagnosing... into
Diagnostyka’ l(45)/2008 GUMIŃSKI, JASIŃSKI, RADKOWSKI, Small-Sized Test Bedfor
Diagnostyka’ l(45)/2008 GUMIŃSKI, JASIŃSKI, RADKOWSK1, Small-Sized Test Bedfor Diagnosing... Fig. 4.
14 Diagnostyka’ 3(47)/2008 ENGEL: Wkład Profesora Czesława CEMPELA w rozwój wibroakustyki Rys. 1.
Diagnostyka’ 4(48)/2008 DYBAŁA, GAŁĘZIĄ, MĄCZAK, Verification Of Doppler EffectRemovalMethodFor The
więcej podobnych podstron