7844055768

alpha300 series - measurement results
3. Healthy tissue (histopathological sample)
Figurę 4
Using the confocal Ra Microscope alpha500 R. sampl was measured using a 532 n laser for Raman imaging and 50x objective with a numerica aperture (N.A.) of 0.50.
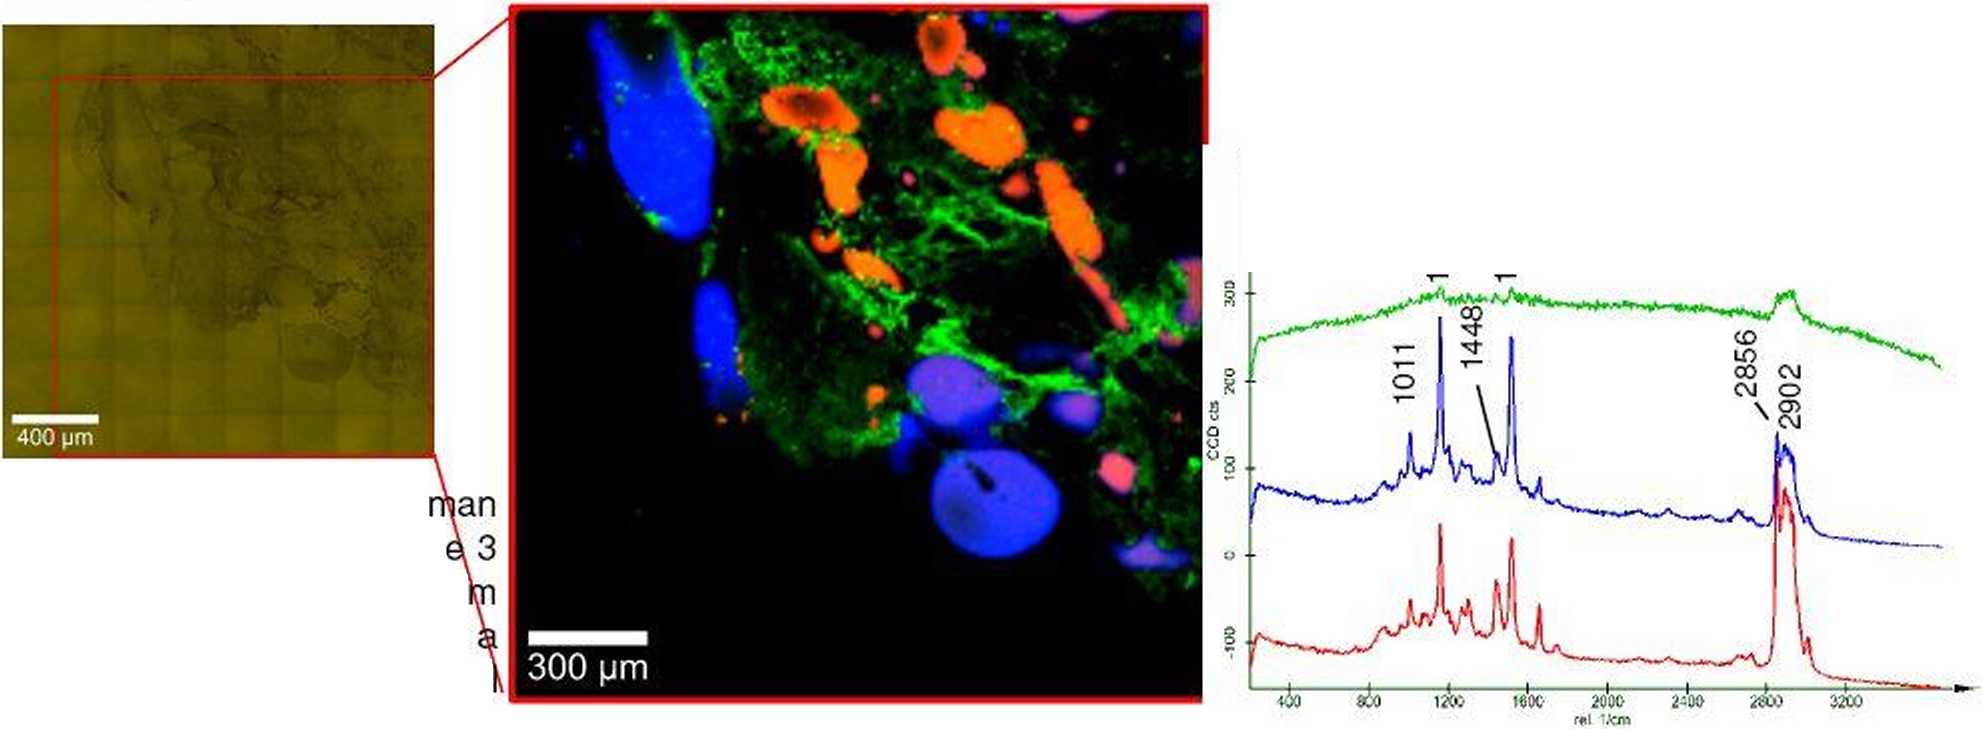
Figurę 4. (a) shows the stitching image (2x2 mm) of sample 3 composed of hundreds of single video images. (b) The Raman image (1.75x1.75 mm) of the region marked in (a) obtained by basis analysis from the average spectra, is shown in (c). These three spectra were averaged from three different areas in the sample. The spectra blue and red show differences in relative intensities of some Raman bands. The colors of the spectra correspond to the colors in the image. Mixed areas are displayed as mixed colors.
~WITt
: focus in
ec
innovations
(a) Stitching image: (b) Raman image (XY):
(c) Averaged spectra:

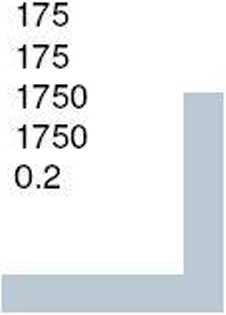
Image Scan (XY): Points per Linę: Lines per Image: Scan Width [pm]: Scan Height [pm]: Integration Time [s]:

Wyszukiwarka
Podobne podstrony:
alpha300 series - measurement results~WITec focus innovations1. Healthy tissue (from surgery) Figurę
alpha300 series - measurement results focus innovations1. Healthy tissue Figurę 1 (a) Stitching
k W SERIES MEASUREMENTS female positions • hcight 180 cm 71" • bust 85
Weronika DZIKOWSKA It is necessary to develop methods for transfer of results obtained by testing sa
□ /N Performance Measure Results X Performance Measures Dashboard Statistics Console Output Czas
00092 ?546ec4ad45fd72a0b658e111513581 91 A Very Simple Set of Process Control Rules Figurę 2 shows
00496 m975300683a0067149a0eec4755e4bb 503 Achieying Quality Results Through Blended ManagementAllia
1. INTRODUCTION The results of various accident scenario simulations for the two major MHTGR variant
1933League of Nałions — Treaty Series.99 be entrusted to a third Power designated by the Parties by
16 K. Damaziak et al. The statistical analysis of results was carried out using the statistical pack
Healthy Food Guide 14 07 bak THE MAGAZINE DIETITIANS RECOMMEND AUSTRALIAN PRACTICAL IDEAS FROM THE
więcej podobnych podstron