117828243
Low-Temperature TLC-MS of Essential Oils


(1)
275

20) 400 600 800
mn
100
% 50

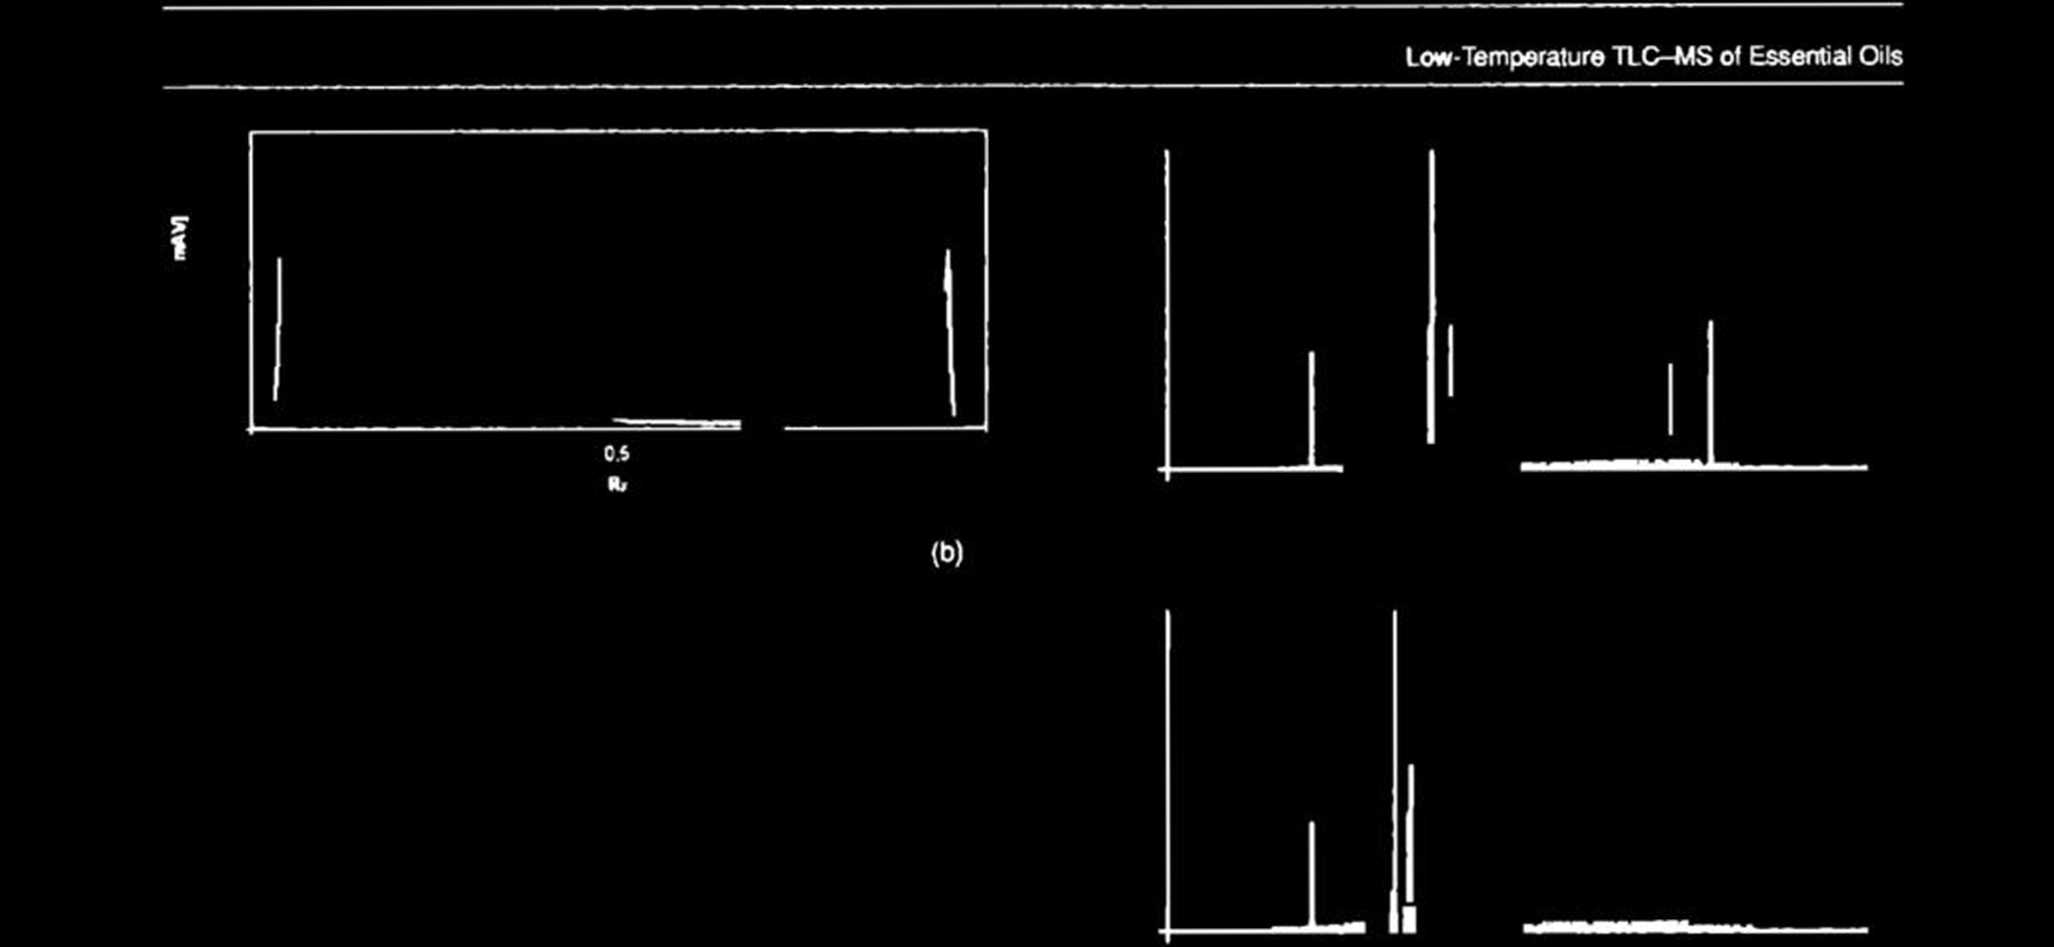
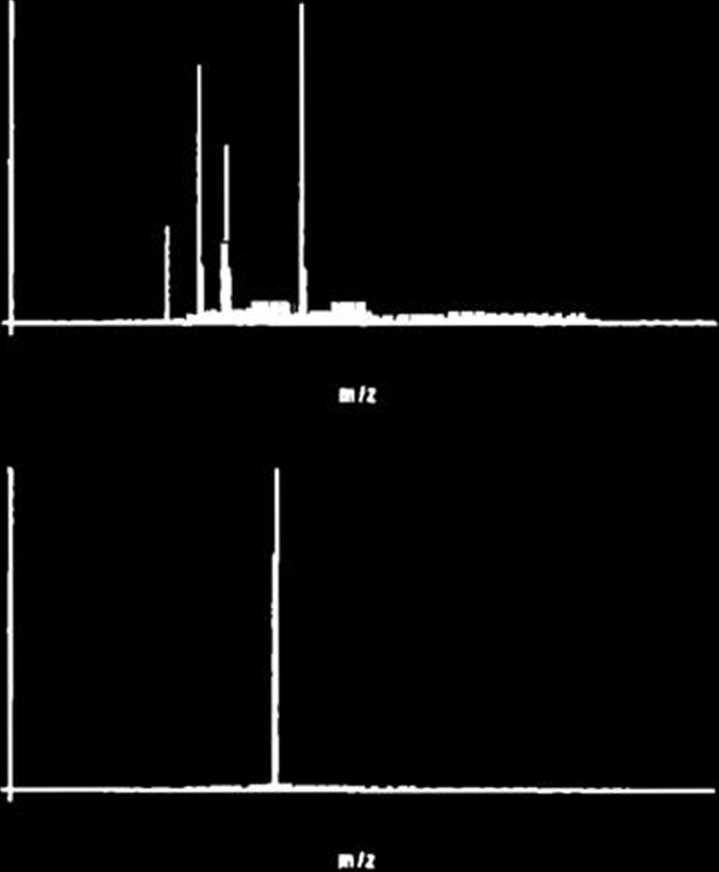
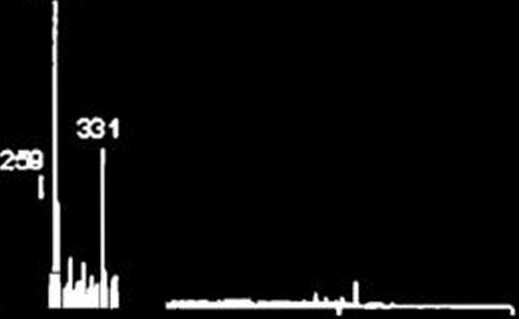
Figurę 2
Densit ogram (a), vldeoscan (b) obtained from the essenttal oii of S. staminea, and mass spectra of aeperated chromatographlc banda
(1H5).
plant materiał (ca. 0.1% v/w). 'rhus the firrt two sagę species (5. lavandulifolia and S. trilobd) can be regardcd as rich in cssential oils whereas the other three species (Shians, S. staminea; and S. nemorosa) yielded ca a factor of ten less cssential oil and, con-sequently, cannot be regarded as particularly oily species.
For TLC analysis 0.05 mL cssential oils from S. hians, S. sta-minea, and S. nemorosa were diluted to l mL with n-hexane (volumes of undiluted samples did not allow a sufficient number of analytical replicates). Essential oils from S. lavandulifolia and S. triloba werc used undiluted.
2.3 Thln-Layer Chromstography (TLC)
Thin-layer chromatography was performed on 10 cm * 20 cm glass plates precoatcd with 0.25-mm layers of silica gel 60 F,M
272
(Merck, Darmstadt, Germany; #1.05715). Essential oil samples werc applied to the layers, either as 15-pL volumes of w-hexane Solutions ofS. hians, S. staminea, and S. nemorosa essential oils or as 5-pL volumes of undiluted S lavandulifolia and S. triloba essential oils, by means of an AS 30 sample applicator (Desaga, Heidelberg, Germany). One-dimensional developmcnt of the chromatograms, to a distancc of 15 cm, at-10 i 0.5°C (inside a refrigerator), with toluenc-cthyl acetate 95:5 (v/v) as binary mobile phase [4|, was performed in DS sandwich chambers (Chromdcs, Lublin, Poland) prcviously saturated wfith mobile phase vapor for 15 min. The chromatograms were dried for 3 h in ambient air then scanned with a Desaga CD 60 densito-meter equipped with Windows-compatible ProQuant st)ftwfare (Desaga). Concentration profiles of the development lanes for the sagę samples were rccorded in reflectcd ultravio!et (UV)
Journal of Planar Chromatography 23 (2010)4
Wyszukiwarka
Podobne podstrony:
Low-Temperature TLC-MS of Essential Oils from Five Different Sagę (Sa/wa) Species Mieczysław Sajewlc
Low Temperalure TLC-MS of Essentiai Oils 200
Low-Temperature TLC-MS ol Essentiai Dis 200
Low-Temperature TLC—MS of Essential Oiis from the piąte before elution of the chromatographic bands
4Vapor Distillation of Essentials Oils from the Salvia Species Dried plant materiał (50 g) was place
TLC-MS VERSUS TLC-LC-MS FINGERPRINTS OF HERBAL EXTRACTS. PART I. ESSENTIAL OILS Mieczysław Sajewicz1
7 Low-Temperature Thin-Layer Chromatography with Mass Spectrometric Detection (LT TLC-MS) The result
Low Temperaturę Planar Chramatography-Densitometry 939Vapor Distillation of Essent
Essential Oils of Sagę Species 187 Fig. 1. Fingerprint gas chromalograms obtained from HS-GC-MS anal
POSTER SESSION. H28 LOW TEMPERATURĘ MEASUREMENTS OF SHIFT AND BROAD-ENING OF CO AND C02 LINES WITH N
Łon) Temperaturę Planar Chromatography-Densitometry 937INTRODUCTION Essential oils have been recogni
938 M. Sajewicz et nL Certain essential oils derived from sagę (e.g., S. Uwandulifolia) are composed
Essential Oils of Sagę Species 183ExperimentalPlant Materiał Samples of the two Salina species (S.
Essential Oils of Sagę Species 189 i Fig. 4.150 MHz l3C NMR spectrum of S. lavandulifolia in CDCb- E
image001 STARGATE Part O1*? c.1 T-cK Parts- The p oU:ms of bulV3r« a mMtef transr-itttł ".hsi c
Oznaczenia Example: XC2S50 - Device Type - I i PQ 208 C Temperaturę Rangę Number o
variable that combines the effects of frequency and temperaturę. In view of the fact that all
więcej podobnych podstron