117828246
Low Temperalure TLC-MS of Essentiai Oils

200 400 600 800
m/i

3
f, c-

0 200 400 600 800
mli
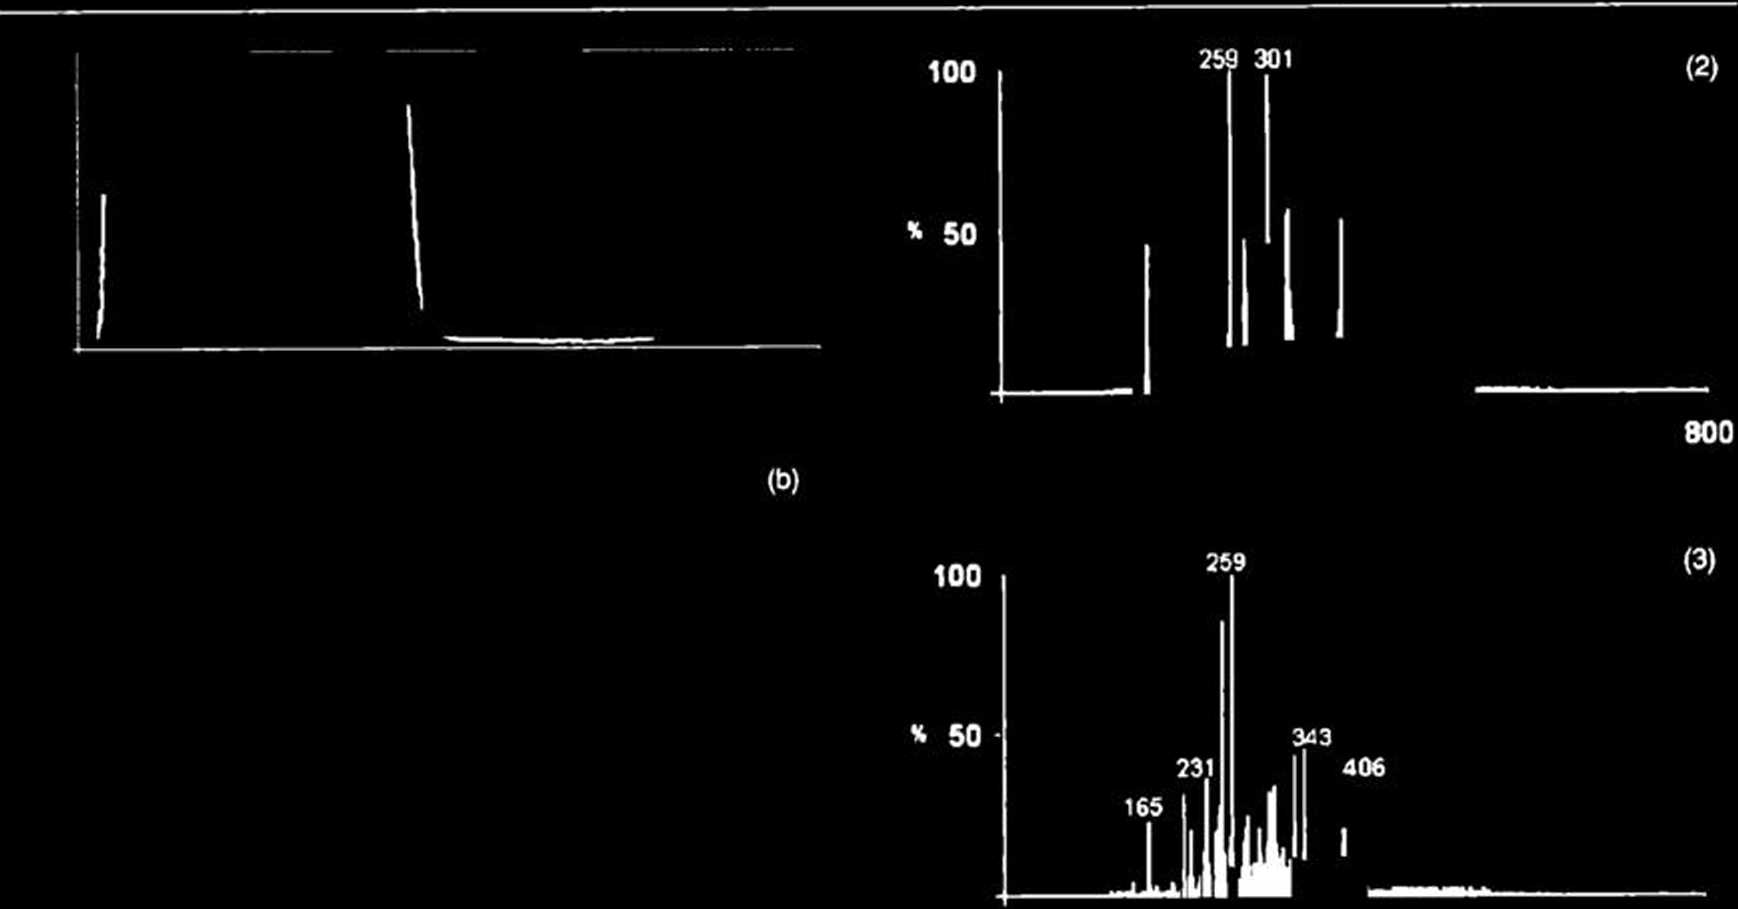
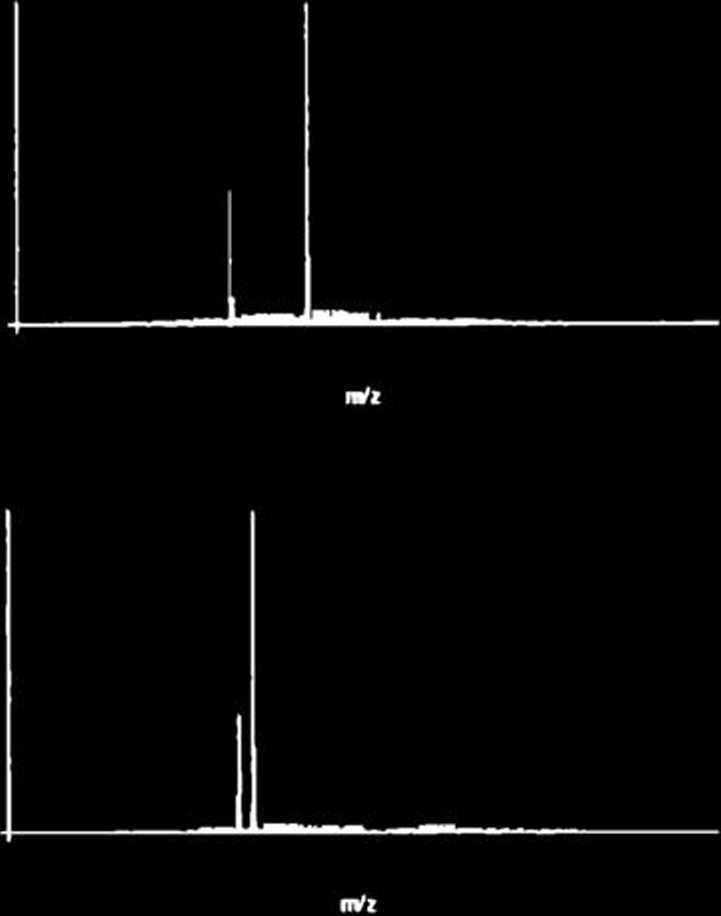
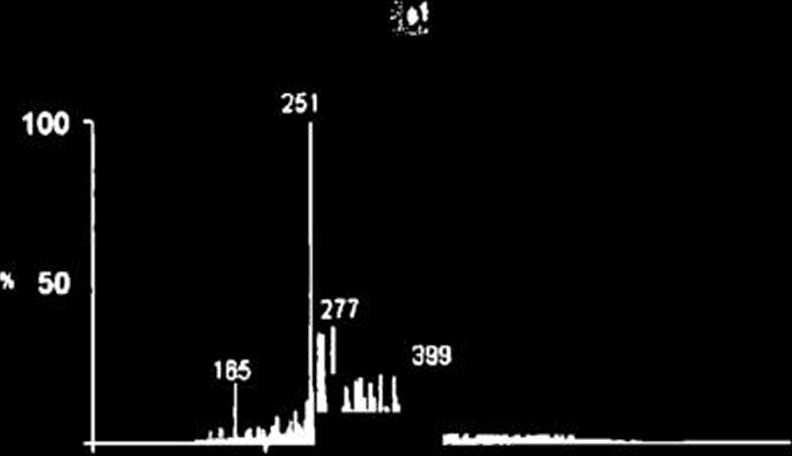
Figurę 5
Denstt ogram (a), vłdeo*can (b) obtaJned from the essentiai oll o! 5. nemorosa, and mass spectra of separated chromatographłc banda
(1H5)-
tions, which arc markcd with numeraJs on the densitograms and the videoscans. From visual inspection of the densitograms and the mass spectra it is clearly apparent that the species bclonging to the Sahia gcnus differ substantially in respect of their finger-prints and hence, their Chemical composition also.
An interesting fcature characterizes individual sets of mass spectra recorded for the different sagę species. It is readily apparent that the mass spectra of the fractions with the highest Ry value (i.e., the fraction 5 in Figures 2-5) fumish much sim-pler fingerprints than those closer to the origin. In Figurę l (S. lavanJulifolia\ this regularity was not observed though, because mass spectrum no. 4 was recorded for the sum of the two rather poorly separated fractions. Reproducibility of this characteristic pattern has been confirmed by muhiple repetition of the TLC-MS analysis. This shows that each essentiai oil con-tains greater amounts of high-polarity compounds (e.g.t ter-penoids), which are morę strongly retained in adsorption chro-matography, thus yiclding lowcr Rf values, than of low-polarity compounds (e.g., terpenes). It is also possible that the low-polarity components of the oils (rcpresented by peak 5 in Figures 2-5) are less strongly adsorbcd by the silica gel layer and, hence, at ambient temperaturę partially evaporate or sublimc
275
Journal of Planar Chromatography 23 (2010) 4
Wyszukiwarka
Podobne podstrony:
Low-Temperature TLC-MS of Essential Oils from Five Different Sagę (Sa/wa) Species Mieczysław Sajewlc
Low-Temperature TLC-MS of Essential Oils(1) 275 20)
Low-Temperature TLC-MS ol Essentiai Dis 200
Low-Temperature TLC—MS of Essential Oiis from the piąte before elution of the chromatographic bands
4Vapor Distillation of Essentials Oils from the Salvia Species Dried plant materiał (50 g) was place
TLC-MS VERSUS TLC-LC-MS FINGERPRINTS OF HERBAL EXTRACTS. PART I. ESSENTIAL OILS Mieczysław Sajewicz1
7 Low-Temperature Thin-Layer Chromatography with Mass Spectrometric Detection (LT TLC-MS) The result
Low Temperaturę Planar Chramatography-Densitometry 939Vapor Distillation of Essent
Essential Oils of Sagę Species 187 Fig. 1. Fingerprint gas chromalograms obtained from HS-GC-MS anal
POSTER SESSION. H28 LOW TEMPERATURĘ MEASUREMENTS OF SHIFT AND BROAD-ENING OF CO AND C02 LINES WITH N
Łon) Temperaturę Planar Chromatography-Densitometry 937INTRODUCTION Essential oils have been recogni
938 M. Sajewicz et nL Certain essential oils derived from sagę (e.g., S. Uwandulifolia) are composed
Essential Oils of Sagę Species 183ExperimentalPlant Materiał Samples of the two Salina species (S.
Essential Oils of Sagę Species 189 i Fig. 4.150 MHz l3C NMR spectrum of S. lavandulifolia in CDCb- E
image001 STARGATE Part O1*? c.1 T-cK Parts- The p oU:ms of bulV3r« a mMtef transr-itttł ".hsi c
facies auricularis sin sacri *✓/ © Department of Anatomy & eurobiotogy Medical llnh/erslty of G
Temperatura tworzywa nagrzewającego ustalona jest na 200 °C. Będę analizował temperaturę do jakiej n
więcej podobnych podstron