2949775530
12 Joanna Rakowska
Tab. 4. Structure of EU funding obtained by regional authorities from each Operational Programme 2007-2013
|
Self-government of |
Share of funding from Operational Programme (in %) | ||||
|
HC |
IaE |
IE |
ROP |
DEP | |
|
Dolnośląskie |
33,2 |
- |
2,5 |
64,3 |
n/a |
|
Kujawsko-pomorskie |
8,8 |
2,4 |
2,8 |
86,0 |
n/a |
|
Lubelskie |
8,1 |
1,2 |
1,2 |
35,7 |
53,8 |
|
Lubuskie |
14,1 |
- |
- |
85,9 |
n/a |
|
Łódzkie |
10,8 |
- |
1,6 |
87,5 |
n/a |
|
Małopolskie |
57,1 |
- |
- |
42,9 |
n/a |
|
Mazowieckie |
26,4 |
0,1 |
- |
73,5 |
n/a |
|
Opolskie |
28,4 |
- |
- |
71,6 |
n/a |
|
Podkarpackie |
4,7 |
- |
- |
51,4 |
43,8 |
|
Podlaskie |
7,1 |
- |
- |
67,0 |
25,9 |
|
Pomorskie |
17,7 |
17,0 |
4,9 |
60,3 |
n/a |
|
Śląskie |
25,2 |
- |
- |
74,8 |
n/a |
|
Świętokrzyskie |
5,8 |
20,2 |
18,6 |
55,4 | |
|
Warmińsko-mazurskie |
5,9 |
- |
- |
72,2 |
21,9 |
|
Wielkopolskie |
15,2 |
- |
- |
84,8 |
n/a |
|
Zachodniopomorskie |
3,3 |
24,0 |
- |
72,6 |
n/a |
Source: Author’s elaboration based on SIMIK MliR data

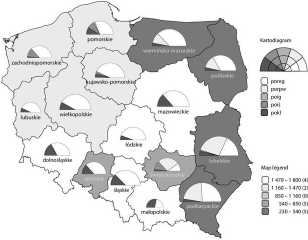
Fig. 1. The average value of EU funding obtained by regional self-governments per inhabitant (in PLN) and the structure of EU funding by OPs
Source: Author’s elaboration based on SIMIK MliR and Central Statistical Office data
governments), then projects aimed at the development of information technology (18%), and proj-ects connected directly with implementation of OPs (15%). Other categories of projects, connected with—e.g., labour market (5%), tourism and cultural services (4%), supporting enterprises and entrepreneurshłp (3%), social infrastructure and environmental protection (2.5 each), had a smaller share in obtained EU funding.
Wyszukiwarka
Podobne podstrony:
14 Joanna Rakowska Fig. 5. Fig. 5. Ranking of voivodships by their share in total EU funding obtaine
10 Joanna Rakowska Tab. 1. The number, total value and EU funding of projects carried out by regiona
17 Lublin, Narutowicza 30 lok 12, KW LU1I/312756/2 Regression of LN(zł/m2) by Data (R2=0,0020) Data
202 STRESS ANALYSIS Calculation of combining stress in the structure of airplane wings, etc,, by Kar
CCF20100109�003 Wlia t are iho common pa ragi a pli structures? The organizational structure of a pa
CCF20100109�003 Wliat aro tlto com/non paragraph structures? The organizational structure of a parag
Exploratory Study on Absorption and lnvestment of EU Structural Funds... 11 Tab.
12 Joanna Antczak constitute tax obligations. The main objeclive of the article is to present the im
Pamięć EPROM Structure of an EPROM memory celi 12
Exploratory Study on Absorption and lnvestment of EU Structural Funds... 15 Pomianek, I.M. 2006. “Sz
Barometr Regionalny Tom 13 nr 3 Spis treści / Table of Contents Joanna Rakowska Exploratory Study on
Joanna Rakowska economy in the times of regional and global crises, and enterprises and territorial
Exploratory Study on Absorption and lnvestment of EU Structural Funds...1 Methodol
1 l.Microcontrollers, architecture, programming tools. 2 12.Structure of microprocessor-based measu
40 Joanna Mi lala, Bogusław Król Rys. 1. Chemiczna struktura P-amyryny. Fig. I. Chemical structures
więcej podobnych podstron