6781097458
Diagnosis and deyelopment trends
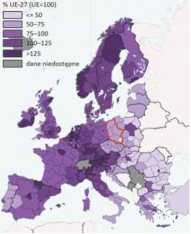
similar to the average value in Poland (Figurę 1), and these two regions significantly exceeded it (Dolnośląskie Voivodeship by 14.7% and Wielkopolskie Voivodeship by 5.3%). The situation in the rest of Western Poland is somewhat different. Lubuskie Voivodeship, Opolskie Voivodeship and Zachodniopomorskie Voivodeship reached a significantly lower level of GDP per capita (over 80% of the national average and around 50% of EU average) and a lower ratę of growth251.261
Map 2. Gross domestic product (GDP) per capita Chart 1. Gross domestic product per capita by
expressed in purchasing power parity (PPP) by NUTS 2 voivodeships - relative deviation from the average ualue
regions, 2010® in the country in 2009 and 2011

The projection of GDP per capita for Western Poland indicates that the two speeds of development of Western Poland will continue, and the threshold of 75% of GDP per capita of EU-27 in 2020 will be exceeded only by Dolnośląskie Voivodeship and Wielkopolskie Voivodeship271. Also, only in the case of these two voivodeships there are projections of an increase in the importance of their economies in 28 In 2011, the GDP generated in Western Poland accounted for 26% of total national GDP, Wielkopolskie Voivodeship and Dolnośląskie Voivodeship belonged to the leading voivodeships with the largest shares in GDP (respectiyely 9.3% and 8.6%).
261 % of average for EU-27, EU-27=100 (the difference in percentage points between 2009 and 2000, compared to the average for EU-27).
271 with average growth ratę in the European Union at the level of 1.5 - 2.5%. Lewandowska-Gwarda K., Ekspertyza dotycząca projekcji PKB per capita (wg PPS) na poziomie województw (NUTS-2) oraz wybranych podregionów (NUTS-3) do 2020 roku wraz z analizą konsekwencji ewentualnych zmian klasyfikacji NUTS dla polityki spójności po 2020 roku, 2011.
Wyszukiwarka
Podobne podstrony:
103 Poland of static penetratlon are glven* Owlng to the llmlted use in Poland of statlo pe-netromet
260 (41) 231 Mounts ing buckie frames and some loops apparently similar to the present ones. Ceramic
The geomorphological mapping in Poland is not being restricted to the registration and the location
Being surę that a waveform similar to the figurę should be seen on the scope* cSi cSb ® cSj cFSj cSb
75 (129) 144 The Viking Age in Denmark Figurę 38 Average weight ofthesilver-hoardsofthe period 900 t
CCF20100223�005 Fig. 21. Englńti [u:), lougue poation Fig. 2Z Position of the lips
6 Włodzimierz Bielecki, Krzysztof Kraska Similarly to the Computer software development, the embedde
Pleasc prepare to talk to the other student in oirfcr to discuss and dcdde which ways of advcrtising
scan0031 3 LyngsehV ALM ET Marinę UMS 2000 Technical System DescriptionUMS 2000 Extended The system
3 Termiaology of Ritual Bread 67 Bulgarian names for cakes, similar to the loaves for the cerem
Easy Tatting (9) Ice Crystal This is similar to the star suncatcher, but has many very large picots
PTDC0004 INTRODUCTION TO THE CENTRAL NF.RYOUS SYSTEM 7 of functions, these functions are not uniąue
image070 of the sky.” This chronicie, similarly to the First Novgorod Chronicie, places 01eg’s grave
The stack efficiency is shown in Fig. 9. The behavior is similar to the voltage, sińce these are dir
CCF20100223�005 u b. Long u, L«. (u:) Fig. 21. Engiiifi
00227 fa893f5d70e2a8634abfc718a817fdc 229Applications of the EWMA is scaled according to the percen
więcej podobnych podstron