
R E V I E W
Energy and greenhouse gas balance of bioenergy
production from poplar and willow: a review
S Y L V E S T R E N J A K O U D J O M O , O UA F I K E L K A S M I O U I and R E I N H A R T C E U L E M A N S
Department of Biology, Research Group of Plant and Vegetation Ecology, University of Antwerp, Universiteitsplein 1, B-2610
Wilrijk, Belgium
Abstract
Short-rotation woody crops (SRWC) such as poplar and willow are an important source
of renewable energy. They can be converted into electricity and/or heat using conven-
tional or modern biomass technologies. In recent years many studies have examined the
energy and greenhouse gas (GHG) balance of bioenergy production from poplar and
willow using various approaches. The outcomes of these studies have, however, gener-
ated controversy among scientists, policy makers, and the society. This paper reviews 26
studies on energy and GHG balance of bioenergy production from poplar and willow
published between 1990 and 2009. The data published in the reviewed literature gave
energy ratios (ER) between 13 and 79 for the cradle-to-farm gate and between 3 and 16 for
cradle-to-plant assessments, whereas the intensity of GHG emissions ranged from 0.6 to
10.6 g CO
2
Eq MJ
biomass
1
and 39 to 132 g CO
2
Eq kWh
1
. These values vary substantially
among the reviewed studies depending on the system boundaries and methodological
assumptions. The lack of transparency hampers meaningful comparisons among studies.
Although specific numerical results differ, our review revealed a general consensus on
two points: SRWC yielded 14.1–85.9 times more energy than coal (ER
coal
0.9) per unit of
fossil energy input, and GHG emissions were 9–161 times lower than those of coal
(GHG
coal
96.8). To help to reduce the substantial variability in results, this review
suggests a standardization of the assumptions about methodological issues. Likewise,
the development of a widely accepted framework toward a reliable analysis of energy in
bioenergy production systems is most needed.
Keywords: energy analysis, energy ratio, life cycle assessment, Populus, Salix, short rotation coppice
Received 16 April 2010 and accepted 8 September 2010
Introduction
The progressive depletion of fossil energy sources and
the growing concerns about global climate change and
air quality have increased the interest in renewable
energy sources that are potentially carbon dioxide
(CO
2
)-neutral and less polluting (Rubin et al., 1992).
The use of renewable energy is a way to reduce reliance
on fossil fuels, to mitigate greenhouse gas (GHG) emis-
sions, to increase energy resource diversification, and to
avoid depletion risks (De Vries et al., 2006). Among
renewable energies, bioenergy is considered to be rela-
tively inexpensive and a highly promising strategy as a
substitute for fossil fuels (IPCC, 2007). Biomass has
received a renewed interest during the last 20 years
and is attracting growing attention around the world as
an abundant and available energy source (Hall &
Scrase, 1998; Righelato & Spracklen, 2007). The diversity
of organic materials used as renewable bioenergy
sources has expanded and includes agricultural and
forestry residues, municipal solid and liquid wastes,
agro-industrial by-products, and cultivated biomass
sources. Among the cultivated biomass sources, dedi-
cated crops and especially short-rotation woody crops
(SRWC) are the most promising (Rowe et al., 2009).
SRWC such as poplar and willow are fast-growing
and high-yielding woody species which can be mana-
ged in a coppice system. This biomass can be burnt or
gasified to generate electricity and/or heat in combus-
tion or gasification plants (Hughes et al., 2007). One of
the advantages of SRWC is that they can be grown on
abandoned and/or contaminated land. Thus, produc-
tion does not necessarily have to compete with food
Correspondence: Sylvestre Njakou Djomo, tel. 1 32 3 2652827, fax
1
32 3 2652271, e-mail: sylvestre.njakoudjomo@ua.ac.be
GCB Bioenergy (2011) 3, 181–197, doi: 10.1111/j.1757-1707.2010.01073.x
r
2010 Blackwell Publishing Ltd
181
crops for the most fertile soils and their management is
usually less energy intensive than the one needed on
food crops (Tillman et al., 2006; Schmer et al., 2008).
However, to be ecologically and energetically viable, the
energy gain from SRWC must outweigh the energy
used for the production, transport, and conversion to
bio-electricity as well as significantly reduce some
impacts on the environment (e.g. GHG emissions).
A considerable number of studies has examined and
compared bioenergy production systems from an ener-
getic and environmental point of view using diverse
approaches. For example, Turhollow & Perlack (1991)
reported on CO
2
emissions from bioenergy crops using
an energy analysis (EA) approach. Mann & Spath (1997)
published a comprehensive life cycle assessment (LCA)
study of a biomass gasification combined-cycle power
system. Styles & Jones (2008) used a combined LCA and
economic approach to assess the environmental and
economic impacts of bioenergy chains. These and other
studies have advanced the understanding of the poten-
tial environmental impacts and of the energy balance of
bioenergy systems. However, their sometimes signifi-
cantly different outcomes and conclusions have gener-
ated controversial views among scientists, policy
makers, and the public forum (Whitaker et al., 2010).
This paper reviews and synthesizes published studies
on environmental impacts and the energy balance of
SRWC (for the production of heat and/or electricity)
where LCA, EA, or a combination of LCA and economic
approaches was applied. The objectives were (i) to
summarize the available information in the scientific
literature about the energy and GHG balance of bioe-
nergy production from SRWC; (ii) to identify and
investigate the mechanisms that frequently lead to
conflicting results while attempting to draw coherent
conclusions from the published studies, and (iii) to
highlight the shortcomings in the analysis of environ-
mental impacts.
Construction of literature source database
The ISI Web of Knowledge, Web of Science, and Science
Direct databases were queried for original studies pub-
lished in the literature between 1990 and 2009 that
reported on the environmental impacts, energy balance,
and/or sustainability assessment of SRWC for the pro-
duction of electricity and/or heat. The search was
further extended to include grey literature such as one
academic thesis, one report found by searching the
archives of Wageningen University in the Netherlands,
and the database of the US National Renewable Energy
Laboratory. The titles and abstracts of all papers were
first screened to determine their suitability; then, certain
inclusion/exclusion criteria were applied to the com-
plete articles. The bibliographies of the selected articles
or reports were also examined for additional references.
We attempted to contact key authors of papers that did
not include the essential information needed for this
review. Only published studies that reported on envir-
onmental impacts (mainly CO
2
and GHG emissions)
and/or energy balance, and that presented the assess-
ment methodology were selected. Articles reporting
only on economic data, secondary review papers,
papers on nonwoody crops, and papers not written in
English were excluded. The exclusion criteria were
applied hierarchically and articles were excluded on
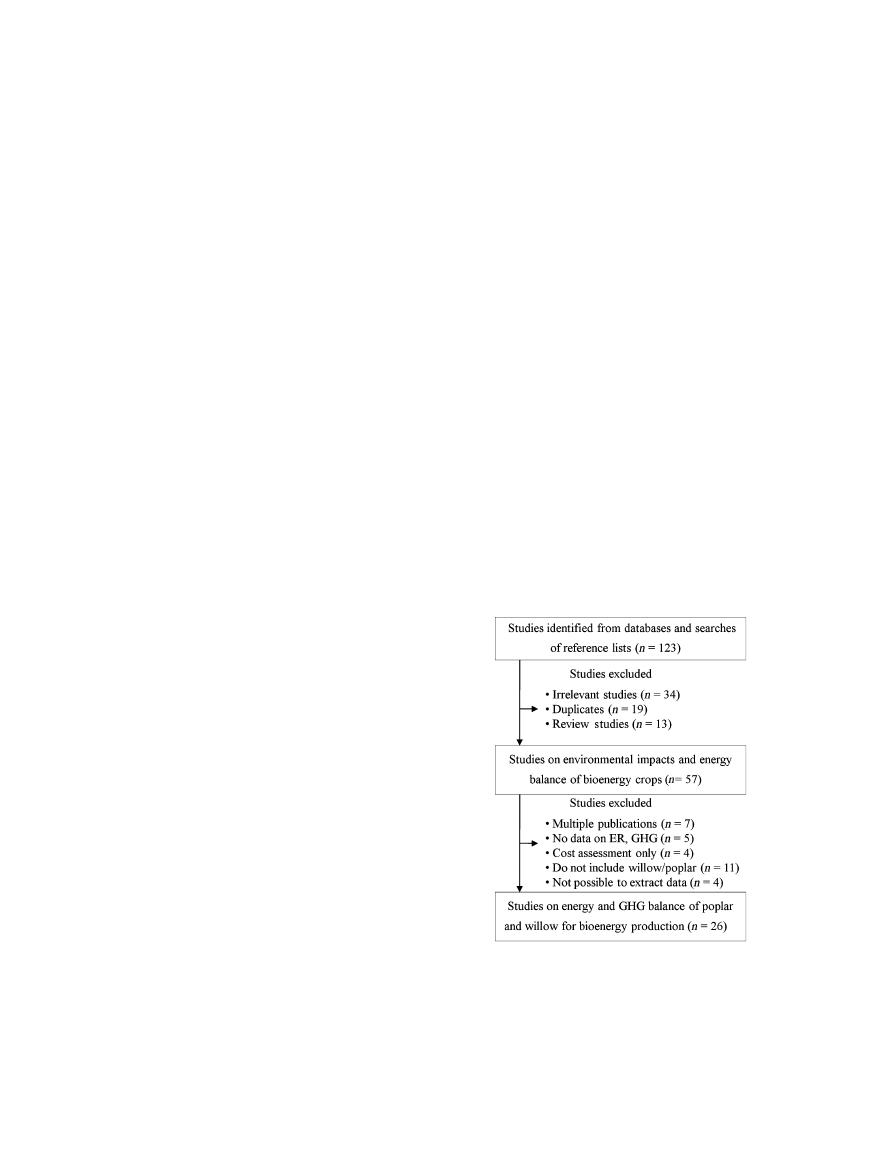
the basis of the first exclusion criterion met. A flow
chart of the selection process is provided in Fig. 1. Key
data from all included studies were then extracted and
converted into same units before they were entered into
the tables. The full spectrum of data categories and
studies used to construct the source database of this
review are presented in Table 1.
Types of life cycle studies
Two types of life cycle studies emerged from the
reviewed literature. The first type of assessment – the
so-called stand-alone assessment – describes a bio-
energy production system, often in an explanatory
way, in order to characterize some important environ-
mental impacts of that bioenergy production system. In
Fig. 1
Flow chart of the construction of the literature source
database. The boxes represent the selection processes (i.e., iden-
tification of study, screening, and selection). n represents the
number of studies. The horizontal arrows represent the studies
that were excluded after each stage whereas the vertical arrows
represent the link between selection processes.
182
S . N J A K O U D J O M O et al.
r
2010 Blackwell Publishing Ltd, GCB Bioenergy, 3, 181–197

T
able
1
Overview
of
the
methodology
,energy
indicators,
envir
onmental
impacts,
system
boundaries
and
functional
unit,
refer
ence
system,
types
of
life
cyc
le
studies
and
species
of
short-r
otation
woody
cr
ops
(SR
WC)
used
in
the
reviewed
studies
Methodology
Ener
gy
indicators
Impacts
studied
SB
and
FU
Conversion
technology
Refer
ence
system
T
ypes
of
life
cycle
study
SR
WC
species
Country
Refer
ences
EA
EE
CO
2
Cradle-
to-plant;
FU
5
ND
Co-combustion,
combustion
Coal
power
Comparative
Poplar
Belgium
V
ande
W
alle
et
al
.
(2007)
EA
EE,
NEY
–
Cradle-to-farm
gate;
FU
5
ND
–
–
Stand
alone
Poplar
Netherlands
Nonhebel
(2002)
EA
ER
CO
2
Cradle-to-plant;
FU
5
ND
Co-combustion
Coal
power
Comparative
W
illow
,
Poplar
Sweden
Boman
&
T
u
rnbull
(1997)
EA
ER
CO
2
Cradle-to-farm
gate;
FU
5
ND
–
–
Comparative
Poplar
T
ennessee
(USA)
T
u
rh
ollow
&
Perlack
(1991)
EA
ER,
ERE
CO
2
Cradle-to-farm
gate;
FU
5
ND
–
Fossil
fuel:
natural
gas,
oil,
diesel
Stand
alone
W
illow
,
Poplar
England
Matthews
(2001)
EA
ER,
NEY
–
Cradle-to-farm
gate;
FU
5
ND
–
–
Comparative
W
illow
Sweden
Borjesson
(1996a)
EA
ER,
NEY
C
O
2
Cradle-to-plant;
FU
5
1G
J
Co-combustion,
gasification
Coal
power
Comparative
Poplar
Belgium
Dubuisson
&
Sintzof
f
(1998)
EA
ER,
NEY
C
O
2
Cradle-to-farm
gate;
FU
5
ND
–
–
Comparative
W
illow
Sweden
Borjesson
(1996b)
EA
NEG
A
,
E
Cradle-to-farm
gate;
FU
5
ND
–
–
Comparative
Poplar
Germany
Scholz
&
Ellerbro
ck
(2002)
EA
NER
–
Cradle-to-farm
gate;
FU
5
ND
–
–
Stand
alone
Poplar
Pennsylvania
(USA)
Strauss
&
Grado
(1992)
EA
NEY
C
O
2
Cradle-to-plant;
FU
5
ND
Gasification
Coal/natural
gas
power
Comparative
W
illow
Sweden
Gustavsson
et
al
.
(1995)
EA
PNEY
–
Cradle-to-farm
gate;
FU
5
ND
–
–
Comparative
W
illow
Germany
Boehmel
et
al
.
(2008)
EA
and
ECA
ER
–
Cradle-to-farm
gate;
FU
5
ND
–
–
Stand
alone
Poplar
Italy
Manzone
et
al
.
(2009)
LCA
EE
GHG
*
,O
D
P,E
,
A,
HT
,
R
,
S
W
Cradle-to-plant;
FU
5
1M
J
Gasification
(with
CCS)
Coal
power
Stand
alone
Poplar
Italy
Carpentieri
et
al
.
(2005)
LCA
EE,
OEE
GHG
*
,O
D
P,A
,
E,
PO,
S
W
,
R
Cradle-to-plant;
FU
5
ND
Gasification
Electricity
mix
(50%
coal
and
50%
oil)
Comparative
Poplar
Italy
Rafaschieri
et
al
.
(1999)
LCA
ER
GHG
*
Cradle-to-plant;
FU
5
1h
a
Gasification
Natural
gas
power
Comparative
W
illow
Belgium
Lettens
et
al
.
(2003)
LCA
ER
GHG
*
Cradle-to-farm
gate;
FU
5
1G
J
–
Fossil
fuel:
Coal
Stand
alone
W
illow
the
Netherlands
V
an
Bussel
(2006)
Cont
inued
E N E R G Y A N D G R E E N H O U S E G A S B A L A N C E O F B I O E N E R G Y P R O D U C T I O N
183
r
2010 Blackwell Publishing Ltd, GCB Bioenergy, 3, 181–197

LCA
ER
GHG
w
Cradle-to-plant;
FU
5
ND
Gasification
Grid
electricity
Comparative
Poplar
Pennsylvania
(USA)
Adler
et
al
.
(2007)
LCA
ER
GHG
w,
L
U
Cradle-to-plant;
FU
5
ND
Co-combustion
Peat,
coal
power
and
conventional
cr
opland
Comparative
W
illow
Ir
eland
Styles
&
Jones
(2007)
LCA
NEP
C
O
2
Cradle-to-plant;
FU
5
1h
a
Gasification
Grid
electricity
Stand
alone
W
illow
Ir
eland
Goglio
&
Owende
(2009)
LCA
NER
GHG
w
Cradle-to-plant;
FU
5
1M
W
h
Gasification
Grid
electricity
Stand
alone
W
illow
New
Y
ork
(USA)
Heller
et
al
.
(2004)
LCA
NER
GHG
w,
A
,
E
Cradle-to-plant;
FU
5
1M
W
h
Gasification
Grid
electricity
Stand
alone
W
illow
New
Y
ork
(USA)
Keoleian
&
V
olk
(2005)
LCA
NER
GHG
w,
A
,
E
,
Cradle-to-plant;
FU
5
1M
W
h
Gasification
–
Stand
alone
W
illow
New
Y
ork
(USA)
Heller
et
al
.
(2003)
LCA
NER
GHG
w,
R
,
O
DP
,
HT
,
F
W
A
E,
MAE,
TE,
PO,
A
,
E
,
W
Cradle-to-farm
gate;
FU
5
3.93
TJ
and
1
h
a
–
N
atural
gas,
Brassica
Comparative
Poplar
Spain
Gasol
et
al
.
(2009)
LCA
NER,
EE
GHG
w,
E
,
R
,
S
W
Cradle-to-plant;
FU
5
1k
Wh
Gasification
–
Stand
alone
Poplar
Iowa
(USA)
M
ann
&
Spath
(1997)
LCA
and
ECA
ER
GHG
w,
L
U
Cradle-to-plant;
FU
5
ND
Co-combustion
Peat
and
coal
power
Comparative
W
illow
Ir
eland
Styles
&
Jones
(2008)
*
Only
CO
2
and
N
2
O
pollutant
gases
were
included.
wCO
2
,C
H
4
and
N
2
O
pollutant
gases
wer
e
included.
A,
acidification;
BD,
biodiversity;
CCS,
carbon
captur
e
and
storage;
E,
eutr
ophication;
EA,
ener
gy
analysis,
ECA,
economic
analysis,
EE,
energy
effi
ciency;
ER,
ener
g
y
ratio;
ERE,
energy
requir
ement;
EY
,
ener
gy
yield;
FU,
functional
unit;
FW
AE,
fr
eshwater
aquatic
ecotoxicity;
GHG,
gr
eenhouse
gas;
HT
,
human
toxicity;
LCA,
lif
e
cycle
assessment;
LU,
land
use;
MAE,
m
arine
aquatic
ecotoxicity;
NEB,
net
energy
budget;
NEG,
net
energy
gain;
NEP
,net
ener
gy
produ
ction;
NER,
net
energy
ratio;
NEY
,net
energy
yield;
ND,
not
defined;
ODP
,
ozone
depletion
potential;
OEE,
overall
energy
efficiency;
PNEY
,
primary
net
energy
yield;
PO,
photochemical
oxidation;
R,
resour
ce
use;
SB,
sy
stem
boundary
SW
,
solid
waste;
TE,
terr
estrial
ecotoxicity;
W
,
water
use.
T
able
1
Continued
184
S . N J A K O U D J O M O et al.
r
2010 Blackwell Publishing Ltd, GCB Bioenergy, 3, 181–197

contrast, comparative life cycle studies compare the
environmental impacts of bioenergy systems to other
alternative energy systems.
Techniques and approaches used
A wide range of techniques and approaches have been
used in the reviewed studies to assess the environmen-
tal effects and energy balance of SRWC (Table 1). These
approaches are summarized below.
EA
EA can be defined as a study that quantifies the energy
consumed and CO
2
emitted in the process of making a
product or providing a service (IFIAS, 1974). It includes
all processes needed to enable the manufacturing of a
product, starting with the procurement of raw materi-
als, and ending with the processing of waste. Each
process of the production chain is analyzed separately.
Energy and mass flow normalized per unit of product,
and finally mass and energy balances are calculated for
the chain as a whole. EA was one of the first techniques
used in the early and mid-1990s (Turhollow & Perlack,
1991) to provide more information on the total energy
used and the CO
2
emissions of SRWC systems.
LCA
Another widely used method is LCA. The LCA metho-
dology provides a consistent framework for the assess-
ment of environmental aspects and potential impacts
associated with a product or service (ISO 14040, 2006). It
quantifies the environmental impacts resulting from the
provision of a particular product or service (Guine´e et al.,
2002), and it expresses them relative to a ‘functional unit’
(i.e., a unit that measures the usefulness of this system). Its
principle may be summarized by the ‘cradle-to-grave’
(ISO 14040, 2006) approach, according to which all flows
of matter and energy into and out of the production
system are inventoried. The specificity of LCA is that it
avoids shifting the impacts from one area of protection to
another. LCA is a compilation of several interrelated
components: goal definition and scope, inventory analy-
sis, impact assessment, and interpretation (ISO 14044,
2006). Unlike EA, LCA studies include a wider range of
environmental impacts (e.g., acidification, eutrophication,
ozone depletion, human toxicity, ecotoxicity) in addition
to energy used and CO
2
or GHG emissions.
Combined or integrated approaches
The combined energetic-economic analysis (Manzone
et al., 2009) and combined LCA-economic analysis
(Styles & Jones, 2008) are other approaches used to
assess or to compare the environmental, energetic,
and economic sustainability of bioenergy production
systems or chains. These approaches integrate costs and
LCA information into a consistent framework model.
They differ from the two previously mentioned meth-
ods as they include – in addition to energy and envir-
onmental
impacts
–
producer
and
consumer
profitability, the financial valuation of externalities
(typically CO
2
avoidance benefits) associated with bio-
energy crop production, transport, and conversion, as
well as impacts so far insufficiently addressed.
System boundaries (SBs) and functional unit (FU)
The SB is the interface between the product (e.g.,
bioenergy system) and the environment (i.e., other
product systems). It delineates which unit processes
are included within the LCA. SBs vary among studies
in the reviewed literature and one of the most striking
features among studies is the number of stages in the
life cycle of bioenergy systems that are assessed and
compared against the lifetime energy output of the
system. Most of the cradle-to-farm gate assessments
include the acquisition of raw materials, cultivation
and harvesting, and sometimes transport and storage
at the farm gate or intermediary storage place (Table 1).
The cradle-to-plant studies include the transport of
biomass to the power plant, biomass fuel preparation,
conversion to electricity, and treatment of waste in
addition to the stages listed in the cradle-to-farm gate
studies. The spatial and temporal boundaries also differ
among the reviewed studies.
The FU describes the primary function fulfilled by a
product system, and indicates how much of this func-
tion is to be considered in the LCA study (Guine´e et al.,
2002). The FU is the reference unit that forms the basis
for comparisons between different systems. The FU in
the reviewed studies, depending of the goal and scope
of the studies, is expressed in terms of per unit land area
(1 ha), per unit energy content of biomass (1 GJ), or in
terms of per unit usable energy output (1 GJ or 1 kW h
1
electricity).
Conversion technologies
A number of biomass conversion technologies have
been reported in the literature for converting SRWC to
usable energy (i.e., electricity, heat, or both electricity
and heat). These conversion technologies can be
grouped into two types: (i) direct combustion technol-
ogies such as conventional combustion and co-combus-
tion and (ii) indirect combustion technology such as
gasification (Table 1). In the direct combustion system,
E N E R G Y A N D G R E E N H O U S E G A S B A L A N C E O F B I O E N E R G Y P R O D U C T I O N
185
r
2010 Blackwell Publishing Ltd, GCB Bioenergy, 3, 181–197

biomass from SRWC is directly burnt to produce high-
pressure steam to generate electricity, whereas in the
co-combustion system, the biomass is co-combusted
with coal as a small proportion of input fuel for the
generation of electricity or heat. Gasification processes
convert biomass from SRWC into combustible gases
that ideally contain the energy originally present in
the biomass. These gases are then burnt to produce
electricity and/or heat.
Reference systems
System analysis is possible by comparing the bioenergy
system with a targeted reference system (Schlamadin-
ger et al., 1997), which in most reviewed studies is
limited to a fossil fuel system. Five types of reference
systems – fossil fuel, biofeedstock (Brassica carinata),
fossil power plant, grid electricity, and previous land
use – have been used in the reviewed studies (see Table
1). In the cradle-to-farm gate assessment, harvested
biomass from SRWC is compared (on the energy con-
tent of the fuels) to fossil fuels such as coal and natural
gas. The land area (1 ha) is also used in the study of
Gasol et al. (2009) to compare SRWC with other bio-
energy systems such as the B. carinata cropping system
in addition to the energy content of the biofeedstock.
This comparison is expressed in terms of MJ ha
1
. In
one study (Styles & Jones, 2007) the reference system
also included the previous land use expressed in ha
yr
1
in order to determine the carbon emissions from
the change of land use.
In the cradle-to-plant assessment, the bio-power sys-
tem is compared with conventional power systems such
as a coal power plant, a natural gas power plant, a coal
or natural gas combined heat and power (CHP) plant,
or to regional grid mix electricity.
Environmental impacts
One of the primary incentives for producing bioenergy
is its capacity to reduce GHG emissions as compared
with fossil energy. However, as conventional energy
production systems, bioenergy production systems
cause environmental impacts. Environmental impacts
are the consequences of the physical interactions
between the studied system and the environment. In
practice, all environmental impacts can be classified in
several categories of environmental problems. These
impact categories range from global impacts such as
climate change (GHG balance), regional impacts such as
acidification, to local impacts such as eutrophication, or
ecotoxicity impacts. With regard to bioenergy from
SRWC, the most common environmental impacts
reported in the reviewed studies are GHG emissions,
and to a lesser extent acidification, eutrophication, solid
wastes, and resource use (Table 1). These impacts
depend on various factors such as the SRWC cultivation
practice, land management, location, and downstream
processing and distribution routes.
Energy performance indicators
In the reviewed studies over the period from 1990 to
2009, 10 energy metrics were used to quantify the net
renewable energy yield over the life cycle of SRWC
(Table 1). Often, these energy indicators are defined
differently but have the same meaning. These energy
indicators are summarized below.
Energy efficiency (EE)
The EE (Mann & Spath, 1997) or overall EE (Rafaschieri
et al., 1999) is defined as the ratio of the usable energy
(e.g., electricity) produced to the energy contained in
the biomass feedstock. Usually expressed as a percen-
tage, the EE gives the fraction of energy in the biofeed-
stock that is converted to the final energy product (i.e.,
electricity). A higher EE indicates a more efficient con-
version process.
Life cycle efficiency (LCE)
The EE as defined above does not include the energy
consumed by the upstream processes. With reference to
LCA, an appropriate energy metric found in the
reviewed studies for system efficiency is the LCE. The
LCE (Mann & Spath, 1997) or overall system efficiency
(Rafaschieri et al., 1999) is defined as the ratio of
the difference between the usable energy produced
and the energy consumed by the upstream processes
to the energy contained in the biomass feedstock. The
LCE can be negative, and a negative LCE indicates the
overall system energy deficit. The LCE and EE were
found mostly in studies using the cradle-to-plant
approach.
Energy ratio (ER)
Studies that used the cradle-to-farm gate approach
(Turhollow & Perlack, 1991; Dubuisson & Sintzoff,
1998; Matthews, 2001) defined the ER as the ratio of
the energy contained in biomass to the energy inputs to
produce the biomass feedstock. In the cradle-to-plant
studies, the net ER (Mann & Spath, 1997; Vande Walle
et al., 2007) was defined as the total usable energy (i.e.,
electricity, heat, or both electricity and heat) produced
by the system divided by the total energy input to drive
the system. Typically, only fossil energy inputs are
186
S . N J A K O U D J O M O et al.
r
2010 Blackwell Publishing Ltd, GCB Bioenergy, 3, 181–197

included in this ratio, whereas the renewable inputs,
including biomass feedstock itself, are not included.
This energy metric reveals the influence of the inputs
expressed in energy units to obtain either the biofeed-
stock (i.e., in the cradle-to-farm gate case) or the usable
energy product (i.e., in the cradle-to-plant case). The ER
is dimensionless and it illustrates how much energy is
produced for each unit of fossil fuel energy consumed.
An ER
o1 implies that the energy input is higher than
the produced energy output.
Energy requirement (ERE)
The ERE (Matthews, 2001) is the ratio between the
energy inputs to produce the biomass feedstock vs.
the energy contained in the biomass. It is thus the
inverse of the ER. The ERE of a bioenergy production
system is
o1 if the system produces more energy than it
consumes (Matthews, 2001).
Net energy yield (NEY)
The NEY (Borjesson, 1996a, b) or net energy budget
(Hanegraaf et al., 1998), also referred as net energy gain
(Scholz & Ellerbrock, 2002) or primary NEY (Boehmel
et al., 2008) or net energy production (Goglio & Owende,
2009) is the difference between the gross energy output
produced (i.e., the energy content of the biomass at the
farm gate) by the bioenergy system and the total energy
required to obtain it (i.e., the fossil energy input). In
bioenergy processes, this energy metric is normally
related to the unit of production (e.g., 1 ha). The NEY
combines productivity and EE into one value. A smaller
NEY means that the bioenergy system requires more land
to produce the same amount net of energy, when the
surface area is used as the unit of production.
Energy use efficiency (EUE)
Finally, another energy indicator used in the cradle-
to-farm gate approach to assess the direct and indirect
energy required to produce a unit of energy is the EUE.
The EUE (Boehmel et al., 2008) is defined as the ratio of
the primary NEY (the difference between the primary
energy yield and the energy consumption) to the energy
consumption. As in the case of ER, an EUE greater than
unity indicates that the system produces more unit
energy than is consumed by the biomass production
processes.
General characterization of the reviewed studies
The majority (19 of 26) of the reviewed studies were
undertaken in Europe, and the remainder in the USA.
Besides two studies that examined both poplar (Popu-
lus) and willow (Salix), a similar amount of studies
examined either poplar or willow. Fifteen of the 26
studies quantified and compared the energetic and
ecological performance of SRWC with fossil fuels or
other bioenergy systems, whereas 11 of the 26 evaluated
the performance of SRWC alone without comparisons.
Of the reviewed studies the LCA and EA approaches
were equally used (46% each), whereas the combined
approach was used less frequently (8%). Sixteen studies
made the cradle-to-plant assessment and the rest were
cradle-to-farm gate assessments. Some of the cradle-
to-plant assessments (10 studies) also presented the
results of the cradle-to-farm gate stages. Thus, data for
20 cradle-to-farm gate studies could be extracted and
analysed from the reviewed studies (Table 2). Of the
cradle-to-plant assessments, gasification appeared to be
the most applied conversion technology among the
main conversion technologies reported in the reviewed
studies to convert biomass to electricity and/or heat.
More than half (16) of the reviewed studies did not
explicitly refer to the FU, but instead normalized the
mass and energy flows per unit of product energy
output. Nevertheless, the resulting unit reflects the
concept correctly. Among the studies that clearly
defined the FU, the land area (1 ha) or energy unit
(1 GJ, 1 kW h) were chosen as the FU. All studies quan-
tified the energetic performance of SRWC, although
there were differences in the energy indicators used in
the assessments. More than three-quarters of all studies
provided information on the CO
2
or GHG emissions of
SRWC. However, in many cases only one or a few
pollutant gases contributing to this impact category
were included in the assessment. About a quarter of
the studies did not assess any environmental impacts.
Other important environmental impacts (non-GHG
impacts) were less studied. For example, six studies
included acidification, eutrophication, and/or resource
use impacts. Only three of the reviewed studies
included ozone depletion, photochemical oxidation
and solid waste impacts. Land use and water use were
reported the least (i.e., in only two studies).
Energy balance vs. environmental impacts
This section analyses and compares the range of results
presented in the reviewed studies. Owing to the limited
data extracted from the studies focusing on the cradle-
to-plant assessment, the focus of the analysis and com-
parison is restricted mainly to the cradle-to-farm gate
assessment. Given the small number of studies present-
ing results on impact category indicators other than
GHG emissions, they were not analyzed in detail. Table
2 provides the detailed technical results on the energy
E N E R G Y A N D G R E E N H O U S E G A S B A L A N C E O F B I O E N E R G Y P R O D U C T I O N
187
r
2010 Blackwell Publishing Ltd, GCB Bioenergy, 3, 181–197

T
able
2
Ener
gy
ratios,
CO
2
and
GHG
emissions,
biomass
yield
and
species
of
short-rotation
woody
cr
ops
(SR
WC)
reported
in
the
reviewed
studies
Ener
gy
ratio
CO
2
and
GHG
emissions
Biomass
Cradle-to-farm
gate
Cradle-to-
plant
Cradle-to-farm
gate
Cradle-to-plant
Y
ield
(t
ha
1
yr
1
)
Life
span
(years)
T
otal
harvestable
biomass
(t
ha
1
)
SR
WC
Species
Refer
ences
13
na
na
na
10
8
76
Poplar
Manzone
et
al
.
(2009)
15
na
na
na
16
15
na
Poplar
Strauss
&
G
rado
(1992)
16
na
1.3
kg
C
G
J
biomass
1
na
11.3
18
252
Poplar
T
u
rhollow
&
Perlack
(1991)
16
4
10.6
g
C
O
2
Eq
MJ
biomass
1
132
g
C
O
2
Eq
kW
h
1
8.8
23
202
W
illow
Styles
&
Jones
(2007)
19
3
n
a
n
a
4.2
20
74
Poplar
V
ande
W
alle
et
al
.
(2007)
20
na
3.8
kg
CO
2
eq
GJ
biomass
1
na
15.6
15
212
W
illow
V
an
Bussel
(2006)
21
na
0.7
kg
C
G
J
biomass
1
na
9
24
216
W
illow
Borjesson
(1996b)
22
na
1.1
kg
C
G
J
biomass
1
na
16.8
na
na
W
illow
Boman
&
T
urnbull
(1997)
22–26
na
1.7–1.9
kg
C
G
J
biomass
1
2.9
kg
C
G
J
1
10–15
23
235–345
Poplar
Dubuisson
&
Sintzof
f
(1998)
23
na
na
na
5
20
100
Poplar
Nonhebel
(2002)
26
na
na
na
9
n
a
n
a
W
illow
Gustavsson
et
al
.
(1995)
29
na
1.3
g
C
MJ
b
iomass
1
na
8–12
16
128–168
W
illow
Matthews
(2001)
32
na
9.8
g
C
O
2
Eq
MJ
biomass
1
na
10
25
250
W
illow
Lettens
et
al
.
(2003)
38
8
*
2.1
g
C
O
2
MJ
biomass
1
58
kg
CO
2
GJ
1
*
10
na
na
W
illow
Goglio
&
Owende
(2009)
48
na
0.5
kg
C
G
J
biomass
1
na
7
30
210
Poplar
Adler
et
al
.
(2007)
50
na
1.9–2.0
g
C
O
2
Eq
MJ
biomass
1
na
13.5
17
216
Poplar
Gasol
et
al
.
(2009)
50
na
na
na
6.9
20
138
Poplar
Scholz
&
Ellerbrock
(2002)
55
11
0.7
g
C
O
2
Eq
MJ
biomass
1
na
13.6
23
214.4
W
illow
Heller
et
al
.
(2003)
55
13
0.7
g
C
O
2
Eq
MJ
biomass
1
39
g
C
O
2
Eq
kW
h
1
13.6
23
214.4
W
illow
Heller
et
al
.
(2004)
55
16
0.6
g
C
O
2
Eq
MJ
biomass
1
46
g
C
O
2
Eq
kW
h
1
13.4
35
469
Poplar
Mann
&
Spath
(1997)
79
na
na
na
15.2
16
235
W
illow
Boehmel
et
al
.
(2008)
*
V
alues
obtained
after
allocation
of
impacts
to
electricity
produ
ction
only
.
GHG,
gr
eenhouse
gases;
na,
not
assessed.
188
S . N J A K O U D J O M O et al.
r
2010 Blackwell Publishing Ltd, GCB Bioenergy, 3, 181–197
indicators and on the GHG emissions. The main data on
SRWC included yield, the life span, total biomass
production, ER and CO
2
or GHG emissions. Yields
ranged from 4.2 to 16.8 ton ha
1
yr
1
and the life span
varied from 8 to 35 years (Table 2). The variation in
yield can be explained by the agronomic practices
which vary with intensity of production, the edaphic
and climatic conditions. The mean harvestable yield
was 11.5 ton ha
1
yr
1
and the median 11.7 ton ha
1
yr
1
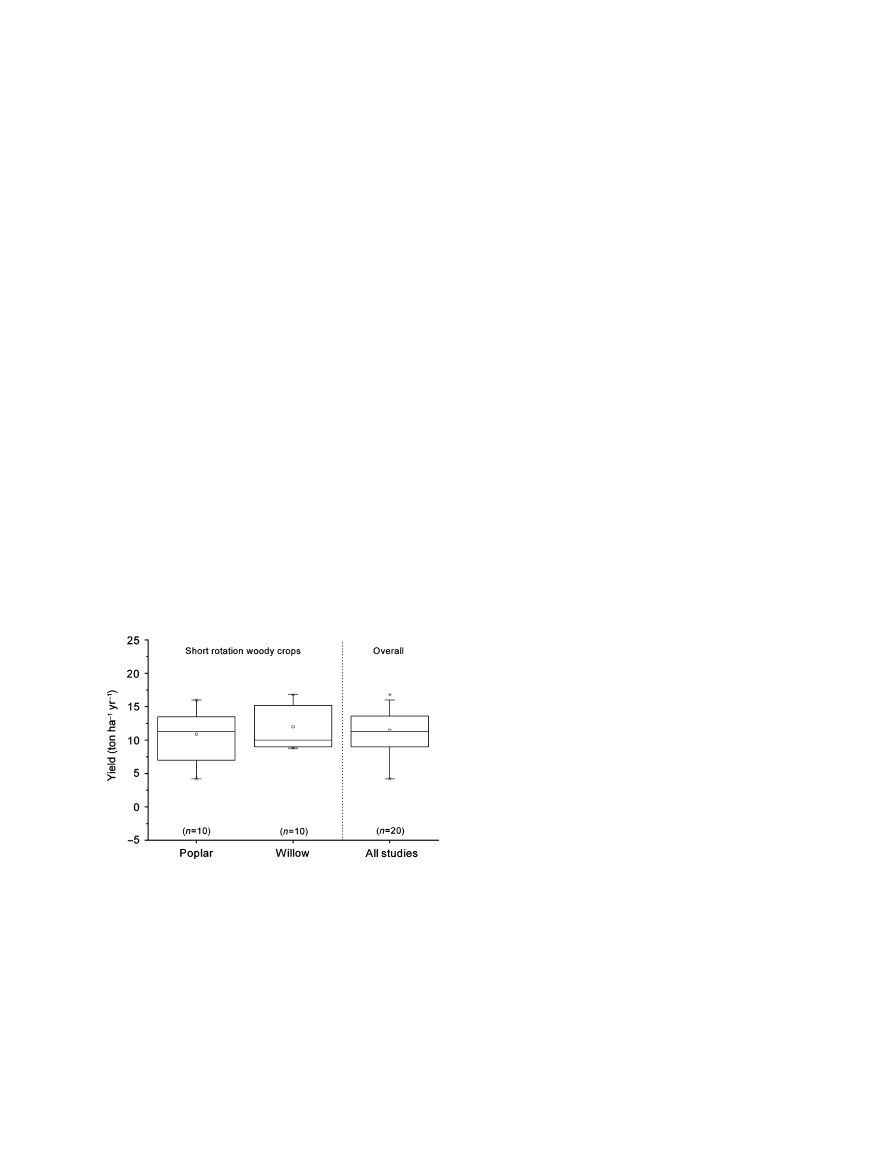
. With regard to SRWC, the mean and median
yields of poplar and willow were comparable (Fig. 2).
The ER values ranged from 13 to 79 for the cradle-to-
farm gate and from 3 to 16 for the cradle-to-plant assess-
ments, respectively. The ER value was lower if the final
output was quantified in terms of electricity generated
rather than as the energy content of the produced bio-
mass from SRWC. There was no exception to this finding.
This result is indeed consistent with the fact that expand-
ing the boundary beyond the farm gate to include con-
version to electricity should always result in a lower ER.
Assumptions about energy use in biomass production
and the efficiency of biomass conversion to electricity
had large effects on the cradle-to-plant ER. The highest
cradle-to-plant ER value (i.e., 16) was for the gasification
plant that had an electrical conversion efficiency of
37.2%. The direct biomass combustion technology had
a much lower efficiency (Z 5 27.7%) as well as ER value
(9.9) than the gasification technology. Despite its high
electrical efficiency (Z 5 37.5%), biomass co-combustion
technology had a low ER value (i.e., 4). This was mainly
due to the relatively high EREs for biomass production
that were (coincidentally) assumed in the studies that
used co-combustion as a conversion technology.
The mean and the median ER values of the reviewed
studies (cradle-to-farm gate) were 32.5 and 24.5, respec-
tively (Fig. 3). The variation in the ER values can be
attributed to differences in yield, to the types of fertili-
zer used and their application rates, and to major
differences in the method of harvesting.
Table 3 presents the processes that contributed to
energy input in the investigated bioenergy system of
each of the reviewed studies. The components (i.e.,
processes) within the investigated bioenergy systems
in the reviewed studies vary considerably. This varia-
bility illustrates the diversity of the systems in which
SRWC can be and are grown. The total energy input
ranged from 46.3 to 247.7 GJ ha
1
, whereas the energy
output ranged from 1418 to 6930 GJ ha
1
depending on
the life span. The energy input was higher in fertilized
bioenergy systems (i.e., intensive) than in unfertilized
(i.e., extensive) bioenergy systems. The comparison of
different energy consuming processes revealed that
harvesting and fertilization (i.e., fertilizer production
plus their application) accounted for the majority of the
energy input to the bioenergy system. Harvesting
accounted for 8–76% of the energy input in the bio-
energy production across the reviewed studies followed
by fertilization, which accounted for between 10% and
64% of the energy input, depending on the growing
conditions. Fertilizer production constituted the major
part (90%) of energy consumed in the fertilization
step. Herbicide treatment and weeding contributed
between 1% and 8% of the total energy input of the
bioenergy systems in the reviewed studies. Other
mechanical operations, such as tillage and planting or
the removal of stumps (grubbing up), required less
energy than harvesting and fertilization and mainly
concerned the planting of SRWC. They involved energy
inputs ranging from 2% to 19% for tillage and planting
and from 1% to 9% for the removal of stumps. The
contribution from the production of cuttings ranged
from 2% to 9% across the reviewed studies. Transport
is also an important component in the energy consump-
tion of bioenergy systems as its contribution ranged
from 2% to 15%. In general, harvesting and fertilization
processes were the major contributor to energy input in
the reviewed studies. However, in some studies pro-
cesses such as active drying and fencing had far-reach-
ing impacts on the energy input as well as the ER. For
example, in the study of Matthews (2001), the contribu-
tion of active drying and fencing totaled 53% (Table 3).
When these processes (i.e., active drying and fencing)
were excluded from the SB of the analysis, the resulting
Fig. 2
Comparison of the yield of the two tree species of short-
rotation woody crops (SRWC) analyzed in this study. The boxes
represent the interquartile range (IQR, i.e., the 25th to the 75th
percentile), the horizontal lines within the boxes represent the
medians, the small squares within the boxes represent the
means, the vertical lines drawn from the edges of the IQR boxes
represent the whiskers (i.e., the largest and smallest values
within 1.5 IQR), the horizontal lines on the whiskers represent
the outliers (i.e., values which are within 1.5 and 3 IQR lengths
from the upper and lower boundaries). The number n in this
figure represents the number of studies included in the analysis.
E N E R G Y A N D G R E E N H O U S E G A S B A L A N C E O F B I O E N E R G Y P R O D U C T I O N
189
r
2010 Blackwell Publishing Ltd, GCB Bioenergy, 3, 181–197
ER was 60 (Matthews, 2001). Similarly, the ER reported
by Goglio & Owende (2009) and that reported by Styles
& Jones (2007), respectively, increase from 38 to 45 and
from 16 to19 if the contribution of fencing was excluded
from their analyses. It is worth mentioning that active
drying of SRWC depends on the end use. Drying may
not be required if the produced biomass is dried on
farm; it could be performed at the conversion site (using
waste heat) or not be performed if the conversion
system can use wet chips.
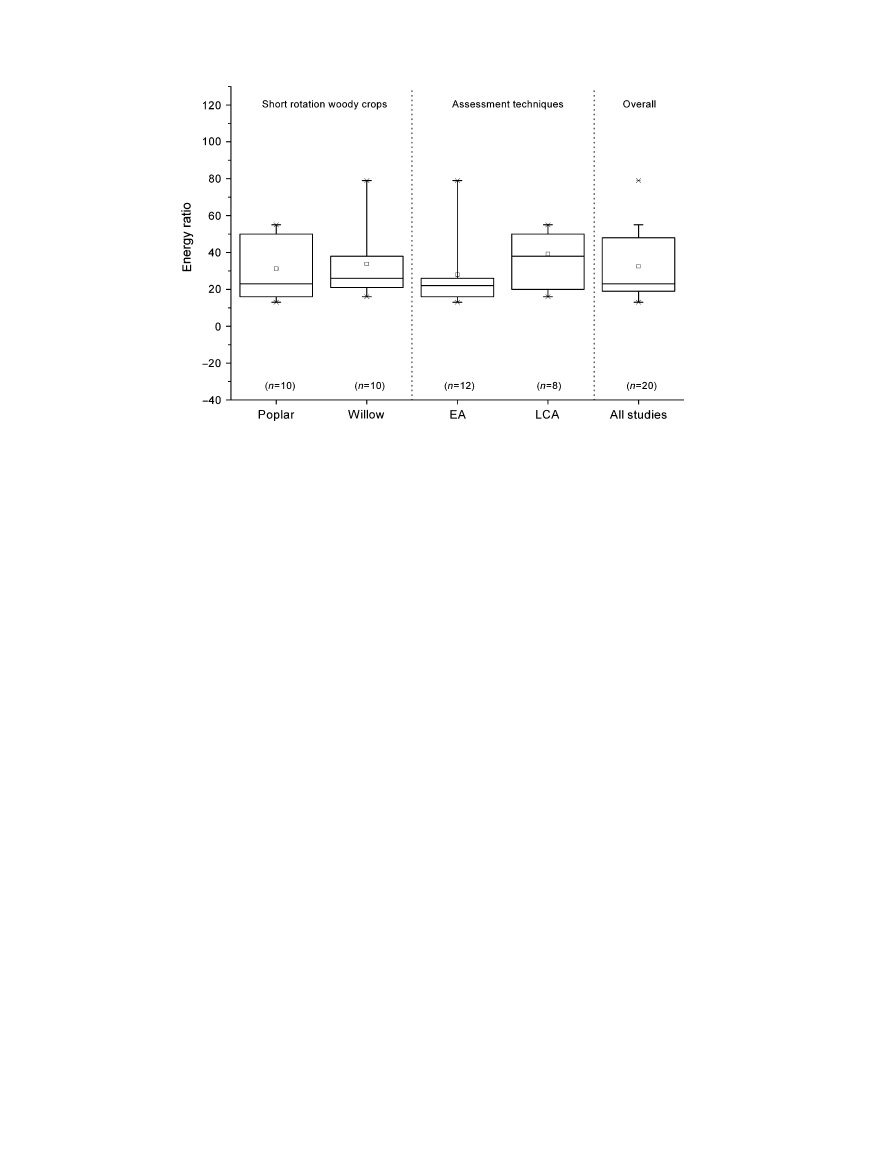
With regard to the techniques used, the cradle-
to-farm gate ER values ranged from 16 to 55 for LCA
and from 13 to 79 for EA, respectively. The EA techni-
que determined a lower mean (28) and median (22.5)
ER compared with LCA. The ER interquartile range
(IQR) is lower for the EA technique than for LCA, but
overlaps with it (Fig. 3). Results from the two techni-
ques varied because of the difference in the types and
sources of data, assumptions about farm inputs, and the
computation methods. Many LCA studies combine
primary data and sometimes secondary data available
in the life cycle inventory databases, whereas EA uses
data from producers. EA uses simple computational
tools (e.g., Microsoft
EXCEL
spreadsheets), whereas sim-
ple as well as complex dedicated tools (e.g.,
SIMAPRO
,
GABI
) are used in LCA to model the bioenergy system.
With regard to the type of species of the SRWC, the
ER values ranged from 16 to 79 for willow and from 13
to 55 for poplar, respectively. The mean and median ER
values for willow and poplar were found to be nearly
identical [i.e., 33.8 and 27.5, respectively, for willow vs.
31.2 and 23, respectively, for poplar (Fig. 3)]. Their ER
IQR and whisker also overlap. Thus, one can conclude
that, on average, willow and poplar have very similar
ER values.
In general and regardless of the techniques used, the
ER values reported in the reviewed studies for both
willow and poplar indicate a high ER (i.e., there is a
high energy return). On the basis of fossil energy inputs,
SRWC improve the effective use of this finite energy
source. Therefore, the cultivation of SRWC for bio-
energy production can be considered beneficial from
an energy perspective.
The intensities of GHG emissions ranged from 0.6 to
10.6 g CO
2
Eq MJ
biomass
1
for the cradle-to-farm gate and
from 39 to 132 g CO
2
Eq kW h
1
electricity for the cradle-
to-plant assessment. The intensity of GHG emissions
was larger when the final output was given as electri-
city generated rather than as the energy content of the
biomass from SRWC. This difference is simply due to
the efficiency of biomass conversion to electricity.
The gasification technology had the lowest intensities
of GHG emissions (39 g CO
2
Eq kW h
1
) due to its
high efficiency (Z 5 37.2%), followed by the direct com-
bustion technology (52.3 g CO
2
Eq kW h
1
). Co-combus-
tion technology (Z 5 37.5%) had the largest GHG
emission intensities. This high value of GHG emission
intensities for the co-combustion technology was due to
Fig. 3
Cradle-to-farm gate energy ratios (ER) of the reviewed bioenergy systems classified into types of short-rotation woody crops
(SRWC), assessment techniques, and overall studies. Twenty studies which presented data on ER were analyzed in this graph. The
whiskers boxes of this figure are explained in Fig. 2.
190
S . N J A K O U D J O M O et al.
r
2010 Blackwell Publishing Ltd, GCB Bioenergy, 3, 181–197

T
able
3
Cradle-to-farm
gate
energy
input
and
output,
contribution
of
energy
consuming
pro
cesses
(included
in
or
excluded
fr
om
the
system
boundaries),
and
species
of
short-
rotation
woody
cr
ops
(SR
WC)
reported
in
the
reviewed
studies
Cradle-to-farm
gate
ener
gy
(GJ
h
a
1
)
P
ro
cess
contribution
in
(%)
T
o
tal
input
T
otal
output
Capital
equipment
Cuttings
pr
oduction
T
ransport
T
illage/
planting
Herbicide/
weeding
F
ertilization
Irrigation
Fencing
Harvest/
chipping
Storage/
drying
Grubbing
up
SR
WC
Species
Refer
ences
46.3
1759.4
–
3.3
–
2.6
2.2
40.6
–
14.6
35.2
–
1.6
W
illow
Goglio
&
Owende
(2009)
49.5
3933.2
–
–
–
7.5
5.3
36.1
–
–
42.6
–
8.5
W
illow
Boehmel
et
al
.
(2008)
52.4
2622.1
–
n
a
Poplar
Scholz
&
Ellerbrock
(2002)
75.2
1418.0
–
n
a
n
a
n
a
n
a
n
a
n
a
n
a
n
a
n
a
n
a
Poplar
V
ande
W
alle
et
al
.
(2007)
79.0
1800.0
–
–
–
8.9
5.1
10.1
–
–
75.9
–
–
Poplar
Nonhebel
(2002)
84.2
4104.2
5.2
–
2.5
19.3
4.5
35.6
*
–
32.9
–
–
Poplar
Gasol
et
al
.
(2009)
84.4
4053.2
na
na
na
na
na
na
na
na
na
na
na
Poplar
Adler
et
al
.
(2007)
98.3
5434.9
3
9
2
3.1
4.3
39
–
–
38.4
–
1.2
W
illow
Heller
et
al
.
(2003)
105.0
3006.2
–
–
3
8
4
–
–
13
30
40
2
W
illow
Matthews
(2001)
113.6
1504.0
–
–
–
8.3
7.6
63.7
–
–
18.9
–
1.4
Poplar
Manzone
et
al
.
(2009)
115.0
3024.0
–
–
na
na
na
na
–
–
–
–
–
W
illow
Gustavsson
et
al
.
(1995)
123.7
1860.5
–
–
–
7.4
2.5
14.2
–
–
75.8
–
–
Poplar
Strauss
&
G
rado
(1992)
126.2
6930.3
1.8
–
–
–
–
15.4
–
–
82
w
–
–
Poplar
Mann
&
S
path
(1997)
140.9
4509.1
–
1.9
11.9
2.2
1.8
48.3
–
–
26.6
–
7.3
W
illow
Lettens
et
al
.
(2003)
155.0
3225.3
–
3.2
9.8
2.3
2.1
47.5
–
–
30.8
–
4.3
W
illow
V
an
Bussel
(2006)
184.9
4198.0
–
–
–
3.2
5.2
37.5
–
–
51.4
–
2.2
Poplar
Dubuisson
&
Sintzof
f
(1998)
202.0
4320.0
–
3.5
15.3
4.2
1
51.1
–
–
24.9
–
–
W
illow
Borjesson
(1996b)
21
1.7
4761.2
2.1
3.4
–
4.3
–
58.7
–
–
31.3
–
–
W
illow
Boman
&
T
urnbull
(1997)
234.4
3663.4
3.7
3.2
–
2.2
2
55.8
–
11.7
8
8.1
1
W
illow
Styles
&
Jones
(2007)
247.7
4027.3
1.2
–
10.4
8
3
24.2
–
–
53.1
–
–
Poplar
T
urholl
ow
&
Perlack
(1991)
The
sum
of
all
contributions
does
not
always
give
100%.
*
Irrigation
is
included
in
the
system
boundary
but
no
value
for
the
br
eakdown
is
available.
wThis
value
includes
the
contribution
of
all
farming
pro
cesses,
except
fertilization.
–,
the
pr
ocess
is
not
included
in
the
system
boundary;
na
5
not
assessed.
E N E R G Y A N D G R E E N H O U S E G A S B A L A N C E O F B I O E N E R G Y P R O D U C T I O N
191
r
2010 Blackwell Publishing Ltd, GCB Bioenergy, 3, 181–197

the relatively high GHG emissions in biomass produc-
tion that were (coincidentally) assumed in the co-firing
studies, and to the up- and downstream GHG emissions
from coal.
The wide range of cradle-to-farm gate CO
2
and GHG
emissions observed among the reviewed studies can be
attributed to the agrochemical input (mainly fertilizer),
assumptions about N
2
O linked to fertilizer input, the
carbon sequestration process (soil carbon and carbon
pools below ground), and the N
2
O and CH
4
associated
with the decomposition of leaves and litter (Table 4). The
types of fertilizer used differed among the reviewed
studies. Ammonium-based fertilizer (e.g., ammonium
sulfate), nitrate-based fertilizer (e.g., ammonia), and
urea are some types of fertilizer used in the reviewed
studies. Nitrogen fertilizer requirements varied from 40
to 138 kg N ha
1
whereas the emission factors associated
to fertilizer production varied substantially depending
on the production process.
Many reviewed studies overlooked N
2
O emissions
from fertilizer application; those that included N
2
O
used the IPCC methodology for direct and indirect
N
2
O emissions estimation (IPCC, 1996). Two studies
included the decomposition of leaves and litter in their
assessments and reported GHG emissions values ran-
ging from 1.1 to 1.3 g CO
2
Eq MJ
biomass
1
(Heller et al.,
2003; Van Bussel, 2006).
Few reviewed studies included the carbon sequestra-
tion process (soil carbon and carbon pools below-
ground) in their analyses. In the small number of
reviewed studies in which values are incorporated, data
ranged from 2.7 to 4.7 g CO
2
Eq MJ
biomass
1
(Table 4).
However, it is important to note that the sequestration
of carbon in soil is site-specific and depends on factors
such as existing soil carbon levels, climate, soil char-
acteristics, and management practices (Keoleian & Volk,
2005). Generally, SRWC would be expected to signifi-
cantly increase soil carbon in arable soils, but not in
grassland soils. It can therefore be argued that account-
ing for carbon sequestration is not always relevant, and
depends on SBs and displacement assumptions (even
when planted on tillage land SRWC may ultimately
displace grassland if arable production shifts onto
grassland).
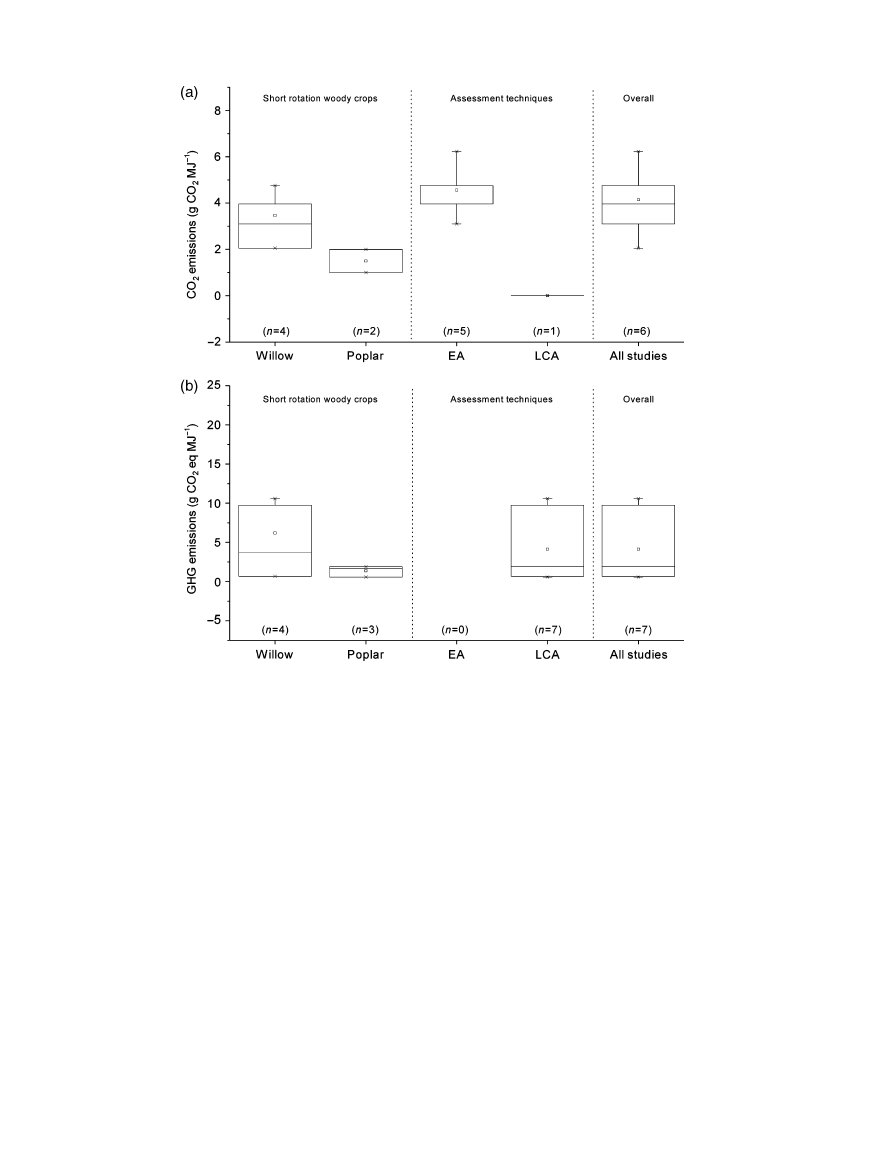
The intensities of CO
2
emissions ranged from 2.1 to
6.2 g CO
2
MJ
biomass
1
for EA, the mean CO
2
emission
intensities was 4.7 g CO
2
MJ
biomass
1
. EA studies solely
focused on CO
2
emissions from fuel combustion and
CO
2
emissions from farm material production and
overlooked the carbon sequestration process as well as
non-CO
2
GHG emissions such as N
2
O from fertilization
(Fig. 4a). The mean and median GHG emissions inten-
sities were 4.1 and 1.9 g CO
2
Eq MJ
biomass
1
for the LCA
technique, respectively (Fig. 4b).
With regard to the tree species in SRWC, the inten-
sities of CO
2
for willow ranged from 2.1 to 4.8 g CO
2
MJ
biomass
1
, whereas for poplar the range was 4.8–6.2 g
CO
2
MJ
biomass
1
. The mean and median CO
2
emissions
intensities for willow were 3.2 and 3.5 g CO
2
Eq
MJ
biomass
1
, respectively. For poplar, the mean and med-
ian CO
2
emission intensities were identical: 5.4 g CO
2
MJ
biomass
1
(Fig. 4a). The intensities of GHG emissions
ranged from 0.7 to 10 g CO
2
Eq MJ
biomass
1
for willow,
whereas for poplar the range was 0.6–1.9 g CO
2
Eq
MJ
biomass
1
. The mean and median GHG emissions were
higher for willow than for poplar (Fig. 5b). Based on
these data values and given the fact there was not
enough data for a meaningful comparison, it is difficult
to determine if the GHG as well as the CO
2
emission
intensities of willow and poplar were similar. However,
there was some evidence to suggest that these SRWC
species might be comparable (Fig. 4).
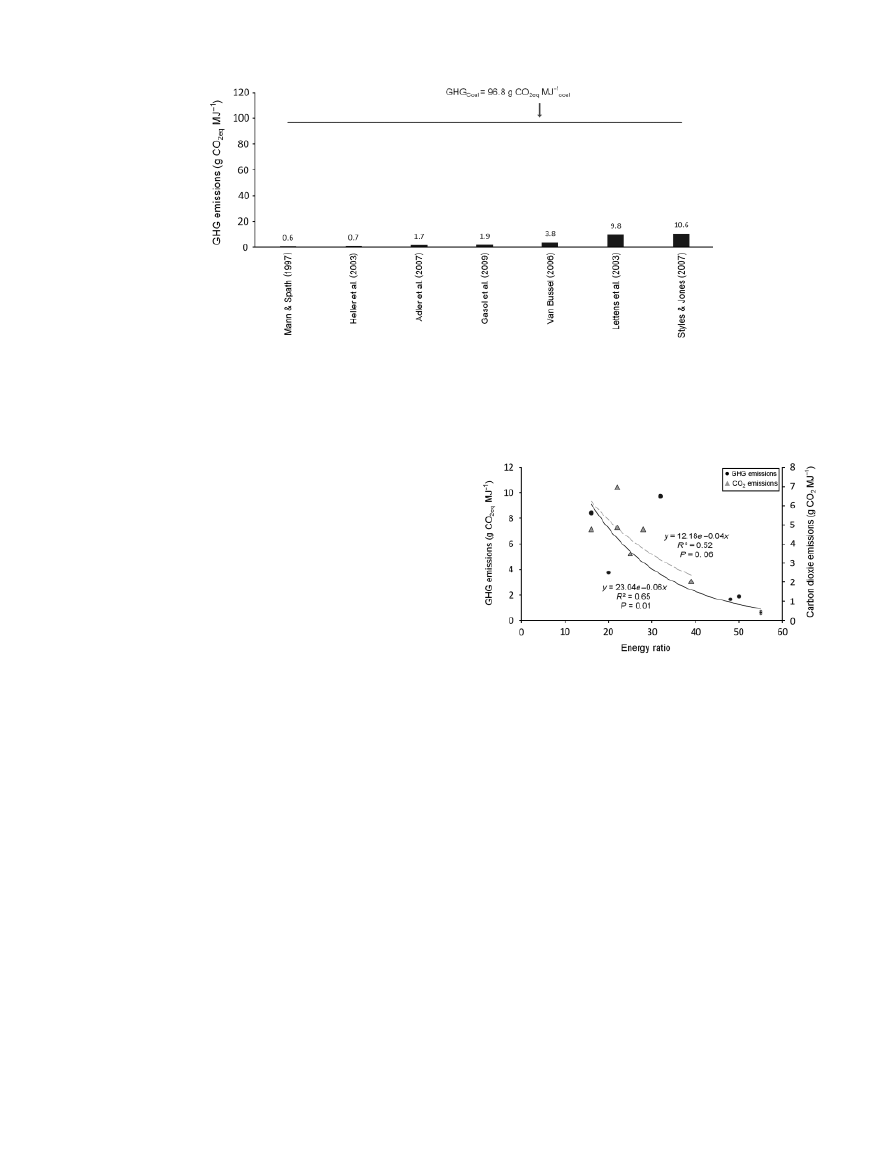
Irrespective of the differences among the reviewed
studies and assuming that the intensity of GHG emis-
sions from coal to be 96.8 g CO
2
Eq MJ
coal
1
(Frischknecht
et al., 2007), Fig. 5 shows that SRWC reduce GHG
emissions as compared to coal. The achievable GHG
emission reductions ranged between 90% and 99%.
GHG reduction ð%Þ
¼
GHG emission fossil chain GHG emission biochain
GHG emission fossil chain
100:
This demonstrates that SRWC reduce emissions and
should therefore be part of an overall strategy for
achieving the minimum target for GHG emissions
reduction (i.e., 50%) in the year 2017 as required by
the EU Renewable Energy Directive (EC, 2008).
The intensities of CO
2
or GHG emissions were related
to the ER for the reviewed studies as presented in Fig. 6.
The CO
2
or GHG emission intensity declined exponen-
tially as the ER increased. This finding confirms the
common knowledge that a reduction of GHG emissions
can be achieved via reduced energy input into the
system.
With regard to other environmental impacts – espe-
cially those that are characteristic of the agricultural
phases of SRWC cultivation such as acidification and
eutrophication – no average results can be provided
because of the small number of cradle-to-farm gate LCA
or EA studies that investigated these impacts. Never-
theless, one general observation can be made. For
SRWC, environmental impacts such as acidification
and eutrophication seem to be low. The cradle-to-farm
gate acidification impacts ranged from 15.7 to 23.5 mg
SO
2
Eq MJ
biomass
1
. These values were 20–30 times lower
than those of coal (476 mg SO
2
Eq MJ
coal
1
). The eutrophi-
cation impact values ranged from 2.4 to 3.3 mg PO
4
Eq
192
S . N J A K O U D J O M O et al.
r
2010 Blackwell Publishing Ltd, GCB Bioenergy, 3, 181–197

T
able
4
Cradle-to-farm
gate
CO
2
and
gr
eenhouse
gas
(GHG)
emissions,
contribution
of
sour
ces
and
sink
of
GHG
emissions
(included
in
or
excluded
fr
om
the
system
boundaries),
coppice
cycle,
and
species
of
short-ro
tation
woody
cr
ops
(SR
WC)
G
HG
reported
in
the
reviewed
studies
Cradle-to-farm
gate
CO
2
and
GHG
emissions
Sources
and
sink
o
f
GHG
emissions
(%)
Biomass
Net
total
T
otal
without
sequestration
Management
Agricultural
input
Fertilization
(N
2
O)
Decomposition
Carbon
sequestration
Coppice
cycle
SR
WC
Species
R
efer
ences
0.6
g
C
O
2
Eq
MJ
biomass
1
–
84.6
15.4
–
–
–
7
Poplar
Mann
&
S
path
(1997)
0.7
g
C
O
2
Eq
MJ
biomass
1
3.2
g
C
O
2
Eq
MJ
biomas
1
17.8
(86)
18.9
(91)
22.3
(107)
40.9
(197)
(
381)
3
W
illow
Heller
et
al
.
(2003)
1.7
g
C
O
2
Eq
MJ
biomass
1
na
na
na
na
na
na
10
Poplar
Adler
et
al
.
(2007)
1.9
g
C
O
2
Eq
MJ
biomass
1
–
49
39.4
11.6
–
–
5
Poplar
Gasol
et
al
.
(2009)
2.1
g
C
O
2
MJ
biomass
1
–
67.6
32.4
–
–
–
3
W
illow
Goglio
&
Owende
(2009)
3.1
g
C
O
2
MJ
biomass
1
–
50
50
–
–
–
na
W
illow
Borjesson
(1996b)
3.8
g
C
O
2
Eq
MJ
biomass
1
8.4
g
C
O
2
Eq
MJ
biomass
1
24.9
(55)
19.2
(42)
42.3
(95)
13.6
(30)
(
123)
2
W
illow
V
an
B
ussel
(2006)
3.9
g
C
O
2
MJ
biomass
1
–
44.8
55.3
–
–
–
6
W
illow
Boman
&
T
urnbull
(1997)
4.8
g
C
O
2
MJ
biomass
1
–
n
a
n
a
–
–
–
3
W
illow
Matthews
(2001)
4.8
g
C
O
2
MJ
biomass
1
–
72.8
27.2
–
–
–
n
a
Poplar
T
u
rholl
ow
&
P
erlack
(1991)
6.2–6.9
g
C
O
2
MJ
biomass
1
–
67
33
–
–
–
na
Poplar
Dubuisson
&
S
intzof
f
(1998)
9.8
g
C
O
2
Eq
MJ
biomass
1
–
9.7
13.6
76.8
–
–
3
W
illow
Lettens
et
al
.
(2003)
10.6
g
C
O
2
Eq
MJ
biomass
1
–
7.7
47.8
23.1
–
–
3
W
illow
Styles
&
Jones
(2007)
The
values
between
par
entheses
repr
esent
the
contribution
to
GHG
emissions,
when
carbon
sequestration
is
considered.
na,
not
assessed.
E N E R G Y A N D G R E E N H O U S E G A S B A L A N C E O F B I O E N E R G Y P R O D U C T I O N
193
r
2010 Blackwell Publishing Ltd, GCB Bioenergy, 3, 181–197
MJ
biomass
1
. SRWC performed slightly better in terms of
eutrophication impacts as compared to coal (5.2 mg PO
4
Eq MJ
coal
1
).
Lessons to be learned
Our review revealed that the estimation of the energetic
performance of bioenergy systems is complex. Not only
the methodologies were different, but also various
indicators were used for the evaluation of the energetic
performance of bioenergy systems. These indicators
prevented far-reaching conclusions from being drawn,
discouraged a more transparent view of bioenergy
systems, and did not facilitate immediate comparison
of studies. As the results of LCA studies are increas-
ingly being used to assist decision making at national
and international levels, it is of the utmost importance
to refine the ISO standards and to expand the LCA
methodology with guidelines on indicators and meth-
odologies to be used to estimate the energetic perfor-
mance of bioenergy systems.
In the reviewed studies, fossil fuels (e.g., coal, natural
gas) as well as biofeedstock (B. carinata) were used as
reference systems. This picture however, is incomplete.
To make sure that bioenergy systems do not deplete the
soil carbon stock, we recommend that the SB also
includes a reference land use. With this SB, it will be
possible to compare the land on which the SRWC are
grown to previous land use.
With regard to energy balance, three variables were
identified as the main sources of diverging results
among reviewed studies: the amount and types of
Fig. 4
Cradle-to-farm gate carbon dioxide (CO
2
) emissions (a), greenhouse gas (GHG) emissions (b) of the reviewed bioenergy systems
classified into types of short-rotation woody crops, assessment techniques, and overall studies. Thirteen studies which presented data on
CO
2
and GHG emissions were analyzed in this graph. The whiskers boxes of this figure are explained in the legend of Fig. 2.
194
S . N J A K O U D J O M O et al.
r
2010 Blackwell Publishing Ltd, GCB Bioenergy, 3, 181–197
fertilizer used, harvesting method, and assumptions
about the yield per hectare. With respect to GHG
balance the divergent results were due to assumptions
about N
2
O emissions, the type of fertilizer used and its
application rate, differences in the treatment of gases
that contribute to GHG, and the SBs. Harmonized rules
based on reasonable guidelines and assumptions on
methodological issues, and how to deal with the asso-
ciated uncertainty of key parameters would help to
reduce the variability of LCA results.
Although the two studies that included the contribu-
tion of N
2
O emissions from decomposition of leaves
and litter in their assessments indicated a high contri-
bution from decomposition of leaf-litter to GHG emis-
sions (Table 4), it is; however, important to mention that
all vegetation systems result in N
2
O loss from leaf fall.
Also, given that leaves and litter accumulate on the soil
surface, their decomposition in most cases will be
aerobic, and the emissions of N
2
O due to denitrification
(an anaerobic process) will be minimized (Heller et al.,
2003). Consequently, it is not always relevant to include
leaf-litter N
2
O emissions – certainly not relevant to
include all of it – in the LCA of bioenergy systems.
For example, emissions from leaf-litter should not be
accounted for when SRWC systems result in less litter
and associated N
2
O emissions compared with the
reference land use. In contrast, emissions from leaf-litter
should be accounted for when SRWC systems result in
more litter and associated N
2
O emissions compared
with the reference land use.
Insights from this review indicated that carbon
sequestration contributed to improve the GHG balance.
However, there are situations when this factor (i.e.,
carbon sequestration) should not be accounted for in
the analysis. This is the case when for example, SRWC
displaces land with high carbon stock such as grass-
land. In contrast, carbon sequestration should be
accounted for when SRWC displaces cropland, and if
the latter is not shifted to grassland. Carbon sequestration
should also be accounted for when SRWC are grown on
abandoned land that exhibit low soil carbon stocks.
The cradle-to-farm gate results from statistical analy-
sis showed that poplar and willow appeared to have
similar mean yield and ER values while the results for
the mean CO
2
and GHG emissions varied substantially.
This indicates different assumptions about fertilizer
emission rates, transport distance, and carbon seques-
tration between willow and poplar. The yield values
Fig. 5
Cradle-to-farm gate greenhouse gas (GHG) emissions for short-rotation woody crops (SRWC) as compared with coal. The
comparison is based on GHG emissions per MJ energy content of biomass and coal from seven studies. The bars represent the values of
GHG emissions of SRWC. The horizontal line above indicates the value of the reference system (i.e., coal).
Fig. 6
Carbon dioxide (triangle) and greenhouse gas (GHG)
(bullets) emissions as a function of energy ratio (ER). Each
symbol (triangles and bullets) represents one specific study.
The dashed and solid lines indicate the best fits through the
data. R
2
, correlation coefficient; P, level of significance.
E N E R G Y A N D G R E E N H O U S E G A S B A L A N C E O F B I O E N E R G Y P R O D U C T I O N
195
r
2010 Blackwell Publishing Ltd, GCB Bioenergy, 3, 181–197

demonstrated the smallest difference in the relative
variability (IQR) between the two SRWC species. The
ER also showed a much lower variation. One can
therefore have confidence in the results that compared
the energetic performance of willow and poplar
because their ER was less wide-ranging.
Difficulties arose in the course of this review. Inven-
tory data presented in some studies were incomplete
and the sources of data were not specified. Also, very
few studies presented a breakdown of the processes
contributing to the energy input or to GHG impacts.
We therefore recommend that future studies present
complete inventory data, specify their sources, and
when possible, make a breakdown of processes con-
tributing to energy use as well as environmental
impacts.
Conclusion
Despite the wide variation in specific numerical results
among the reviewed studies, it is possible to draw the
following conclusions: on average, SRWC yielded 36
times more energy than coal (ER
coal
0.9) per unit of
fossil energy input, and GHG emissions were 24 times
lower than those of coal (GHG
coal
96.8). Consequently
SRWC provide an opportunity to reduce dependency
on fossil fuels and to mitigate GHG emissions. Harvest-
ing and fertilization were the largest contributors to
energy use across the reviewed studies, and it was
found that harvesting consumed 1.2–1.3% more energy
than fertilization.
Despite the fact that SRWC can play an important role
in mitigating GHG emissions, some uncertainties linked
to evaluating the GHG emissions from individual bioe-
nergy systems remain. N
2
O emissions from fertilizer
application, carbon sequestration, and the reference
land use (baseline) pose the major challenges to provid-
ing a high degree of confidence in the calculated emis-
sions.
To reduce the high variability and create some more
consistency in the future studies, harmonized rules
based on reasonable guidelines and assumptions on
methodological issues are needed. This could be
achieved by limiting the freedom of choices for dealing
with carbon sequestration. It should for example not be
allowed to account for carbon sequestration in LCA
when SRWC displace land with high carbon stock such
as grassland. Likewise, when SRWC displaces crop-
lands, carbon sequestration should not be accounted
for should the latter shift to grasslands. Conversely,
carbon sequestration should be accounted for in LCA
when SRWC are grown on abandoned lands that exhibit
low soil carbon stocks.
Efforts should also be made to develop a widely
accepted framework toward a reliable analysis of EE
of bioenergy production systems. Finally, more research
is needed to address insufficient knowledge of the net
GHG emission fluxes from bioenergy systems.
Acknowledgements
The research leading to these results has received funding from
the European Research Council under the European Commu-
nity’s Seventh Framework Programme (FP7/2007-2013), ERC
grant agreement no. 233366 (POPFULL). O. El Kasmioui is a
research assistant of the Flemish Science Foundation (FWO,
Brussels). We acknowledge various authors (in particular Dr
David Styles and Dr Pietro Goglio) who have helped us by
providing more detailed information on their published results.
We also thank Dr Rhonda Fisher for checking English grammar
and language throughout this manuscript. Finally, we thank the
three anonymous reviewers for their constructive comments and
valuable suggestions on an earlier version of the manuscript.
References
Adler PR, Del Grosso SJ, Parton WJ (2007) Life-cycle assessment
of net greenhouse-gas flux for bioenergy cropping systems.
Ecological Applications, 17, 675–691.
Boehmel C, Lewandowski I, Claupein W (2008) Comparing
annual and perennial energy cropping systems with different
management intensities. Agricultural Systems, 96, 224–236.
Boman UR, Turnbull JH (1997) Integrated biomass energy sys-
tems and emissions of carbon dioxide. Biomass and Bioenergy,
13
, 333–343.
Borjesson PII (1996a) Emissions of CO
2
from biomass production
and transportation in agriculture and forestry. Energy Conver-
sion and Management, 37, 1235–1240.
Borjesson PII (1996b) Energy analysis of biomass production and
transportation. Biomass and Bioenergy, 11, 305–318.
Carpentieri M, Corti A, Lombardi L (2005) Life cycle assessment
(LCA) of an integrated biomass gasification combined cycle
IBGCQ with CO
2
removal. Energy Conversion and Management,
46
, 1790–1808.
De Vries BJM, van Vuuren DP, Hoogwijk MM (2006) Renewable
energy sources: their global potential for the first-half of the
21st century at global level: an integrated approach. Energy
Policy, 35, 2590–2610.
Dubuisson X, Sintzoff I (1998) Energy and CO
2
balance in
different power generation routes using wood fuel from short
rotation coppice. Biomass and Bioenergy, 15, 379–390.
EC 2008. Commission of the European Communities. Proposal for a
Directive of the European Parliament and of the Council on
the Promotion of the Use of Renewable Sources. COM (2008)
19 final, 2008/0016 (COD).
Frischknecht R, Jungbluth N, Althaus HJ et al. (2007). Implemen-
tation of life cycle assessment methods. Ecoinvent report No.3,
V2.0. Swiss Centre for Life Cycle Inventories, Du¨bendorf,
Switzerland.
Gasol CM, Gabarrell X, Anton A et al. (2009) LCA of poplar
bioenergy system compared with Brassica carinata energy crop
196
S . N J A K O U D J O M O et al.
r
2010 Blackwell Publishing Ltd, GCB Bioenergy, 3, 181–197

and natural gas in regional scenario. Biomass and Bioenergy, 33,
119–129.
Goglio P, Owende PMO (2009) A screening LCA of short rotation
coppice willow (Salix sp.) feedstock production system for
small-scale electricity generation. Biosystems Engineering, 103,
389–394.
Guine´e JB, Gorre´e M, Heijungs R et al. (2002) Handbook of Life
Cycle Assessment. Operational Guide to ISO Standards. Kluwer
Academic Plenum Publishers, New York.
Gustavsson L, Borjesson P, Johansson B, Svenningsson P (1995)
Reducing CO
2
emissions by substituting biomass for fossil
fuels. Energy, 20, 1097–1113.
Hall DO, Scrase JI (1998) Will biomass be the environment-
ally friendly fuel of the future? Biomass and Bioenergy, 15,
357–367.
Hanegraaf MC, Biewinga EE, van der Bijl G (1998) Assessing the
ecological and economic sustainability of energy crops. Bio-
mass and Bioenergy, 15, 345–355.
Heller MC, Keoleian GA, Mann MK, Volk TA (2004) Life cycle
energy and environmental benefits of generating electricity
from willow biomass. Renewable Energy, 29, 1023–1042.
Heller MC, Keoleian GA, Volk TA (2003) Life cycle assessment of
a willow bioenergy cropping system. Biomass and Bioenergy, 25,
147–165.
Hughes S, Partzch L, Gaskell S (2007) The development of bio-
fuels within the context of the global water crisis. Sustainable
Development Law and Policy, 62, 58–48.
IFIAS (1974) International Federation of Institutes of Advanced Study.
Methodology and Conventions of Energy Analysis. Workshop
Report 6. Stockholm, Sweden, 89 pp.
IPCC (1996) Guideline for National Greenhouse Gas Inventories
(Revised Version), volume 3, Agriculture, Land Use Change and
Forestry. Intergovernmental Panel on Climate Change.
IPCC (2007) Climate change mitigation. In: Contribution of Work-
ing Group 3 to the Fourth Assessment Report of the Intergovern-
mental Panel on Climate Change (eds Metz B, Davidson OR,
Bosch PR, Dave R, Meyer LA), Cambridge University Press,
Cambridge, UK.
ISO 14040 (2006) Environmental Management – Life Cycle Assess-
ment – Principles and Framework. International Organisation for
Standardization (ISO), Geneva, Switzerland.
ISO 14044 (2006) Environmental Management – Life Cycle Assess-
ment – requirements and guidelines. International Organisation
for Standardization (ISO), Geneva, Switzerland.
Keoleian GA, Volk TA (2005) Renewable energy from willow
biomass crops: life cycle energy, environmental and eco-
nomic performance. Critical Reviews in Plant Sciences, 24,
385–406.
Lettens S, Muys B, Ceulemans R, Moons E, Garcia J, Coppin P
(2003) Energy budget and greenhouse gas balance evaluation
of sustainable coppice systems for electricity production.
Biomass and Bioenergy, 24, 179–197.
Mann MK, Spath PL (1997). Life cycle assessment of a biomass
gasification combined-cycle power system. Report, National Re-
newable Energy Laboratory (NREL), NREL/TP-430-23076,
Golden, CO, USA, 102 pp.
Manzone M, Airoldi G, Balsari P (2009) Energetic and economic
evaluation of a poplar cultivation for the biomass production
in Italy. Biomass and Bioenergy, 33, 1258–1264.
Matthews RW (2001) Modelling of energy and carbon budgets of
wood fuels coppice systems. Biomass and Bioenergy, 21, 1–19.
Nonhebel S (2002) Energy yields in intensive and extensive
biomass production systems. Biomass and Bioenergy, 22, 159–167.
Rafaschieri A, Rapaccini M, Manfrida G (1999) Life cycle assess-
ment of electricity production from poplar energy crops
compared with conventional fossil fuels. Energy Conversion
and Management, 40, 1477–1493.
Righelato R, Spracklen DV (2007) Carbon mitigation by biofuels
or by saving and restoring forests? Science, 317, 902.
Rowe RL, Street NR, Taylor G (2009) Identifying potential
environmental impacts of large-scale deployment of dedicated
bioenergy crops in the UK. Renewable and Sustainable Energy
Reviews, 13, 260–279.
Rubin ES, Cooper RN, Frosch RA et al. (1992) Realistic mitigation
options for global warming. Science, 257, 148–266.
Schlamadinger B, Apps M, Bohlin F et al. (1997) Towards a
standard methodology for greenhouse gas balances of bio-
energy systems in comparison with fossil energy systems.
Biomass and Bioenergy, 13, 359–375.
Schmer MR, Vogel KP, Mitchell RB et al. (2008) Net energy of
cellulosic ethanol from switchgrass. Proceedings of the National
Academy of Sciences of the United States of America, 105, 464–469.
Scholz V, Ellerbrock R (2002) The growth productivity and
environmental impact of the cultivation of energy crops on
sandy soil in Germany. Biomass and Bioenergy, 23, 81–92.
Strauss CH, Grado SC (1992) Input–output analysis of energy
requirements for short rotation, intensive culture, woody
biomass. Solar Energy, 48, 45–51.
Styles D, Jones MB (2007) Energy crops in Ireland: quantifying
the potential life-cycle greenhouse gas reductions of energy-
crop electricity. Biomass and Bioenergy, 31, 759–772.
Styles D, Jones MB (2008) Life-cycle environmental and economic
impacts of energy-crop fuel-chains: an integrated assessment of
potential GHG avoidance in Ireland. Environmental Science and
Policy, 11, 294–306.
Tillman D, Hill J, Lehman C (2006) Carbon negative biofuels
from low-input high-diversity grassland biomass. Science, 314,
1598–1600.
Turhollow AF, Perlack RD (1991) Emissions of CO
2
from energy
crop production. Biomass and Bioenergy, 1, 129–135.
Van Bussel LGJ (2006) The potential of a short-rotation willow
plantation to mitigate climate change. Unpublished MSc
thesis, Wageningen University, Wageningen, the Netherlands,
51 pp.
Vande Walle I, Van Camp N, Van de Casteele L et al. (2007) Short-
rotation forestry of birch, maple, poplar and willow in Flan-
ders (Belgium). II. Energy production and CO
2
emissions
reduction potential. Biomass and Bioenergy, 31, 276–283.
Whitaker J, Ludley KE, Rowe R, Taylor G, Howard DC (2010)
Sources of variability in greenhouse gas and energy balances
for biofuel production: a systematic review. Global Change
Biology Bioenergy, 2, 99–112.
E N E R G Y A N D G R E E N H O U S E G A S B A L A N C E O F B I O E N E R G Y P R O D U C T I O N
197
r
2010 Blackwell Publishing Ltd, GCB Bioenergy, 3, 181–197
Wyszukiwarka
Podobne podstrony:
Herbs for Sports Performance, Energy and Recovery Guide to Optimal Sports Nutrition
Energy and security
Herbs for Sports Performance, Energy and Recovery Guide to Optimal Sports Nutrition
Energy and Fuels 2006, 20, 155 158, Novel Process for Recycling Waste Plastics To Fuel Gas Using a M
Energy and Nutritional Properties of the White Mulberry
Energy and CO2 analysis of poplar and maize crops for biomass production in Italy Włochy 2016
04 Wind Turbine Power, Energy And Torque
Energy Savers Tips on Saving Energy and Money at Home
Kto,blokuje tą wiedzę Antenna To Replace?tteries And Provide Unlimited Free Energy For Electric?rs
Free Energy Bedini Device And Method For Pulse Charging A Battery Patent Info 2004
Introduction to Prana and Pranic Healing – Experience of Breath and Energy (Pran
Glow Worm installation and service manual Energy Saver 60 UI
Power Converters And Control Renewable Energy Systems
Greenhill Fighting Vehicles Armoured Personnel Carriers and Infantry Fighting Vehicles
60 861 877 Correlation Between Heat Checking Resistance and Impact Bending Energy
Energy From The Vacuum concepts and principles ?arden
Glow Worm installation and service manual Energy Saver 80 UI
więcej podobnych podstron