
WESPAC 8, The Eighth Western Pacific Acoustics Conference, Melbourne, 7-9 April 2003
(Keynote lecture)
ROOM ACOUSTIC SIMULATION AND AURALIZATION –
HOW CLOSE CAN WE GET TO THE REAL ROOM?
Manuscript Number 1025J
Jens Holger RINDEL, Claus LYNGE CHRISTENSEN
Ørsted•DTU, Acoustic Technology, Technical University of Denmark
Building 352, DK-2800 Kgs. Lyngby, Denmark
E-mail:
ABSTRACT
The paper describes the state-of-the-art of room acoustic auralization and the results of
two different ways to validate the quality. The first method is an objective measurement of
room acoustic parameters from the simulated impulse response using a monaural
auralization filter. The measurement results are compared to the calculation results from
the simulation. The other method is a subjective comparison by listening to three different
binaural reproductions: The computer simulation, the recording with a dummy head in the
real room, and a convolution of the measured binaural impulse response with an anechoic
recording. This comparison has been made as part of a large project on Byzantine
churches and Sinan’s mosques in Istanbul.
KEYWORDS: Auralization, Room acoustics, Computer modelling
INTRODUCTION
Room acoustic auralization has many applications ranging from presentation of building design
proposals to research using listening tests. For most applications it is important to know how
reliable the auralization is, and to what extend the acoustical details are actually simulated. The
quality of the auralization is closely related to the quality of the room acoustic model used for
calculation of the impulse response. So, the first part of this presentation will give an example of
a very efficient method for this calculation. Next, the process of the auralization will be
explained, and finally the objective and subjective evaluation methods will be discussed. All
calculation methods are those currently applied in the ODEON room acoustic software.
CALCULATION OF SOUND REFLECTIONS AT A RECEIVER
Most modern room acoustic programs use some king of hybrid calculation method. The
calculation method referred to here is described in [1, 2, 3] except that in the current version of
ODEON, scattering of sound for early reflections is also taken into account.
The point response from a point source can be calculated either by a hybrid method, which
combines the image source method with a special ray-tracing /radiosity method, or by the ray-
tracing /radiosity method, only. The first method has proven to work well in rooms such as
auditoria that are not dominated by curved surfaces [4], whereas the latter method yields better
results in rooms dominated by curved surfaces such as churches or mosques with domes [5]. No
matter the calculation method, the calculations fall into two parts: First ‘phantom sources’ are
calculated using one of the methods in order to represent the sound reflected by the room. Then
it is determined which of these sources will contribute reflections at the receiver position (a
mathematical point) by checking whether or not the phantom source is visible from the receiver
position (a ‘visibility’ check). All reflections are represented by time of arrival, angle of
incidence, and strength in eight octave bands. When the reflections are used in the auralization
process they are treated the same way no matter how they were calculated.
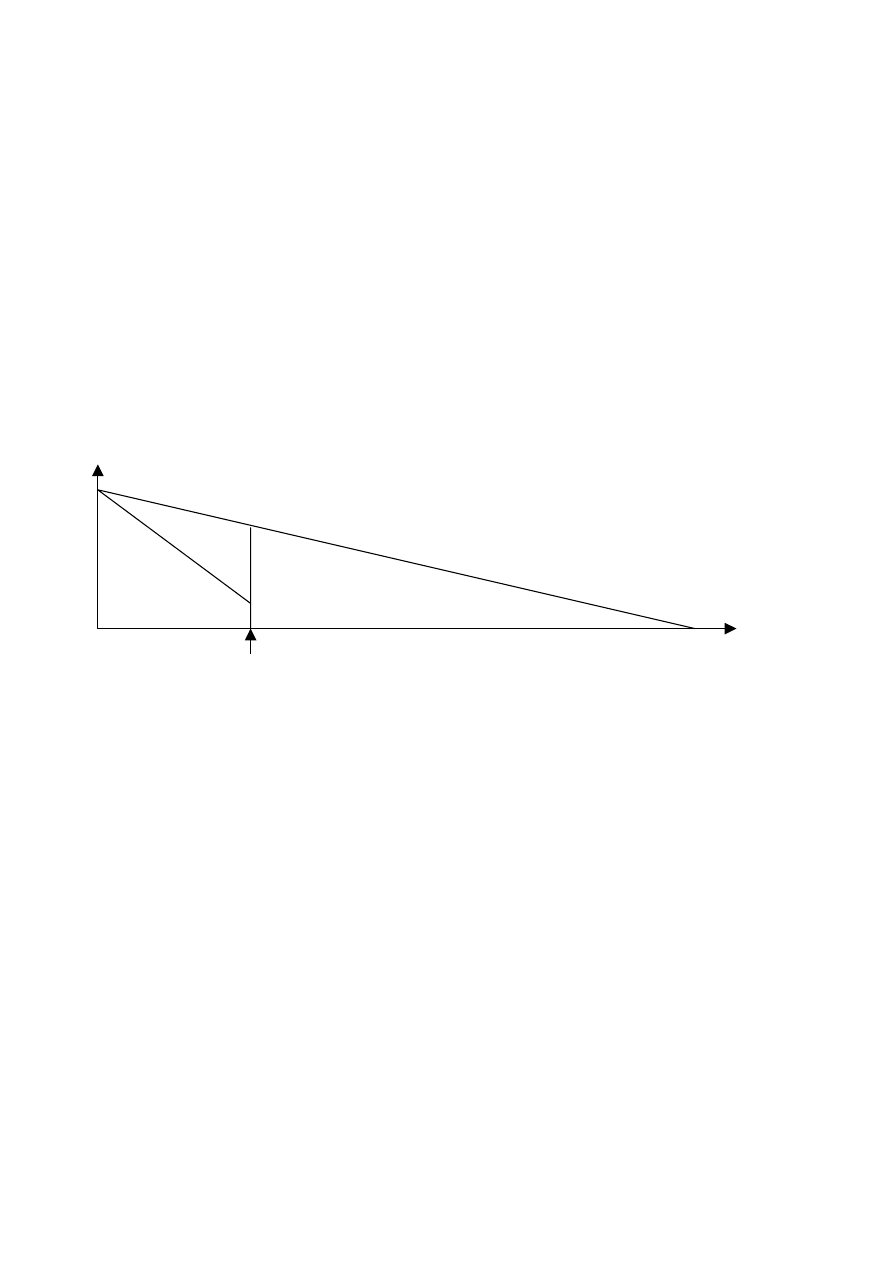
Figure 1. Summary of the hybrid calculation method as used in ODEON. Early reflections below a selected
transition order (TO) are calculated using a combination of the image source method (ISM) and early scattering
rays (ESR). Above the TO, reflections are calculated using a ray-tracing method (RTM) which includes scattering.
In the special case where the TO is set to zero, the method becomes a ray-tracing model. Note that all three methods
will, most likely, overlap in time.
Ray-tracing or hybrid calculation method. The transition order (TO) determines the reflection
order at which the calculation method changes from one method to the other. Typical values of
TO are 1, 2 or 3, but in some cases even a value of 0 may be preferred. Below TO the reflections
are calculated as a combination between image source method (ISM) and early scattering rays
(ESR).
In short the hybrid calculation method works as follows; rays are emitted from the point
source and the surfaces hit by the rays are used as mirroring surfaces to calculate the position of
the corresponding image source. The program keeps track on all detected image sources in order
to get one and only one contribution from each valid image source to a receiver. Above TO the
ray-tracing /radiosity method is used; each time a ray hits a surface, a secondary source is
generated at the point of incidence. The secondary source has a strength and a time delay as
calculated from the total reflection path from the original source to the secondary source. The
contribution to the impulse response in a receiver point is again determined from a ‘visibility’
check.
ISM
ESR
RTM
TO
Time
Energy

Scattering in an image source model. By nature the image source method does not include
scattering, so in order to include scattering in the early reflections, the calculation method used
for early reflections is in fact a hybrid method on its own. Each time an image source is
detected, an inner loop of scatter rays are started, taking care of the scattered sound which is
reflected from this image source /surface.
Example: If all scattering coefficients in a room are s = 0.4, the specular energy of a first
order image source is multiplied by (1-0.4) - and the specular energy of a second order image
source is multiplied by (1-0.4)*(1-0.4). The scatter rays handle the rest of the energy. Each time
an image source is detected, the associated reflecting surface will be treated like a surface
source, which will emit a number of early scatter rays [6]. The early scatter rays will be traced
from the current reflection order up to TO. At each reflection point of an early scattering ray,
including the starting point, a secondary scattering source is created.
Number of generated reflections. Below the transition order the growth rate of reflections is
proportional to t
3
(where t is the time [3]), because of the three dimensional nature of rooms.
This goes for the specular image source reflections as well as the secondary scattering sources.
Above the TO the reflection density is determined from the number of rays and is kept constant;
each time a ray hits a surface a secondary source is generated. Thus the number of rays must at
least be large enough to give a sufficient reflection density (some times only 1000 rays may be
sufficient). Scattering is included in the late reflections by calculating the reflected directions of
rays as a weighted vector-averaging between the specular direction and a random direction with
a propability distribution according to Lambert’s cosine law. The scatting coefficient s and (1-s)
are used as weight factors for the random direction and the specular direction, respectively.
A typical point response includes more than 100,000 reflections per source. A calculated
reflection is described by time of arrival, sound pressure level for each octave band, and angle of
incidence. Eight octave bands are used from 63 Hz to 8 kHz (the 16 kHz band being
extrapolated as a ninths octave band for auralization purpose only). These data are normally
used directly in the prediction either for direct investigation of the individual reflections or for
prediction of room acoustic parameters such as T
30
, EDT, C
80
, LF
80
etc. These parameters are
calculated from the integrated decay curve using energy summation.
THE AURALIZATION METHOD
The Binaural Room Impulse Response (BRIR) is the key to auralization. It is calculated as a part
of the point response as explained below. The BRIR can be used for auralization either by
listening directly to the generated BRIR, or by convolving it with an anechoic signal and
listening to the result. A number of such simulations can be combined together in order to form
multi channel auralization, e.g. with a number of simultaneous sound sources. A singer on the
stage and an orchestra in the pit on an opera house is one example.
Creating and using a BRIR. In order to create a binaural output from the reflection data some
signal processing has to be applied:
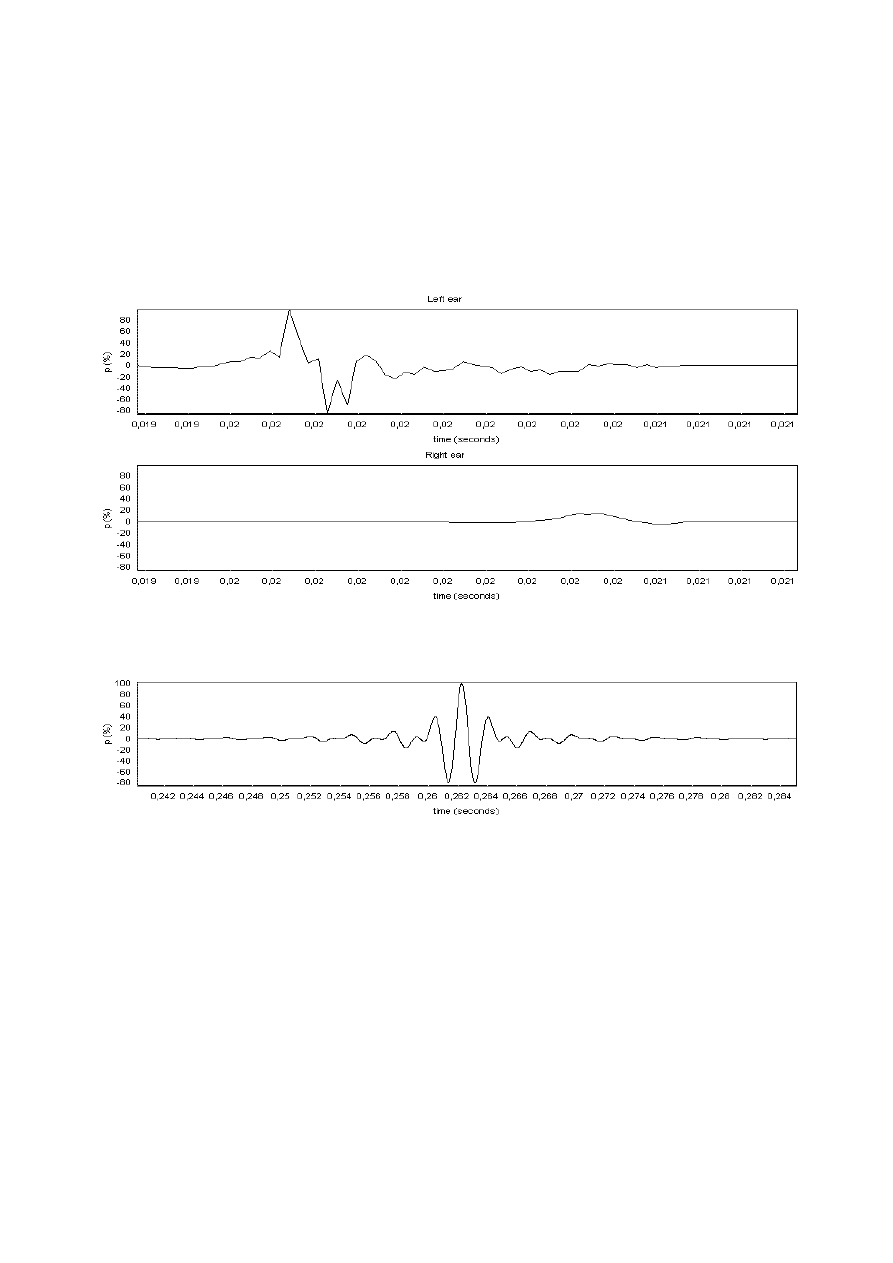
• Each reflection is represented by a left and right HRTF (Head Related Transfer
Function) taking into account the angle of incidence in order to form a binaural (two
channel) representation of the reflection, see Fig. 2.
• The HRTF is convolved with FIR filters of the Kaiser-Bessel type, one for each of the
nine octave bands from 63 Hz to 16 kHz, see Fig. 3, and the filters are attenuated
according to the level of the reflection in that band.
• All binaural octave band filters are superposed into one binaural representation of the
reflection, while a relatively simple algorithm [7] determines whether the reflection
should be added with or without a phase shift. This involves the acoustic impedance of
the surfaces and the angles of incidence on the surfaces.
• The process above is repeated for all reflections in the point response and all the
reflections are superposed into one resulting BRIR, inserting each binaural reflection
filter at the appropriate time of arrival.
Figure 2. Example of a set HRTF, for lateral incident sound arriving first to the left ear.
Figure 3. A Kaiser-Bessel filter for the 1 kHz octave band, used for representation of the octave band in the time
domain.
In total for a BRIR composed from 100.000 reflections this results in 2 channels * 9
octave bands * 100.000 reflections = 1.800.000 convolutions. However, because of
optimisations of the filtering process, the calculations needed are strongly reduced without
compromising the quality of the result. The calculation time needed to create a BRIR is
typically less than 30 seconds on a 600 MHz Pentium III.
Because of the large number of calculations it has sometimes been tried to simplify the
auralization process. However, using the complete filtering scheme as outlined above has
several advantages apart from leading to a very natural sounding auralization result. In addition
to the evaluation of reverberation time, level, speech intelligibility and clarity, the auralization
output also allows an evaluation of:
• Echo phenomena, including flutter echoes.
• Directivity and frequency response of sources.
• Envelopment, i.e. the impression of being surrounded by sound. This depends very much
on the lateral reflections arriving later than 80 ms after the direct sound [8].
• Frequency dependent reverberation time. The attenuation during the decay in a room is
time variant - usually the sound will get darker as the sound decays - a typical feature of
large rooms (cathedrals, mosques etc.).
• Modulated decay. Long decays in rooms such as cathedrals often have ripples on the late
decay rather than a smooth decay.
• Reduced clarity of sound behind columns and similar objects blocking the direct path of
sound.
Finally, because the filtering process includes all reflections and their properties, it is
possible to demonstrate virtually any important room acoustic effect, e.g. to demonstrate the
Haas effect, masking of echoes etc.
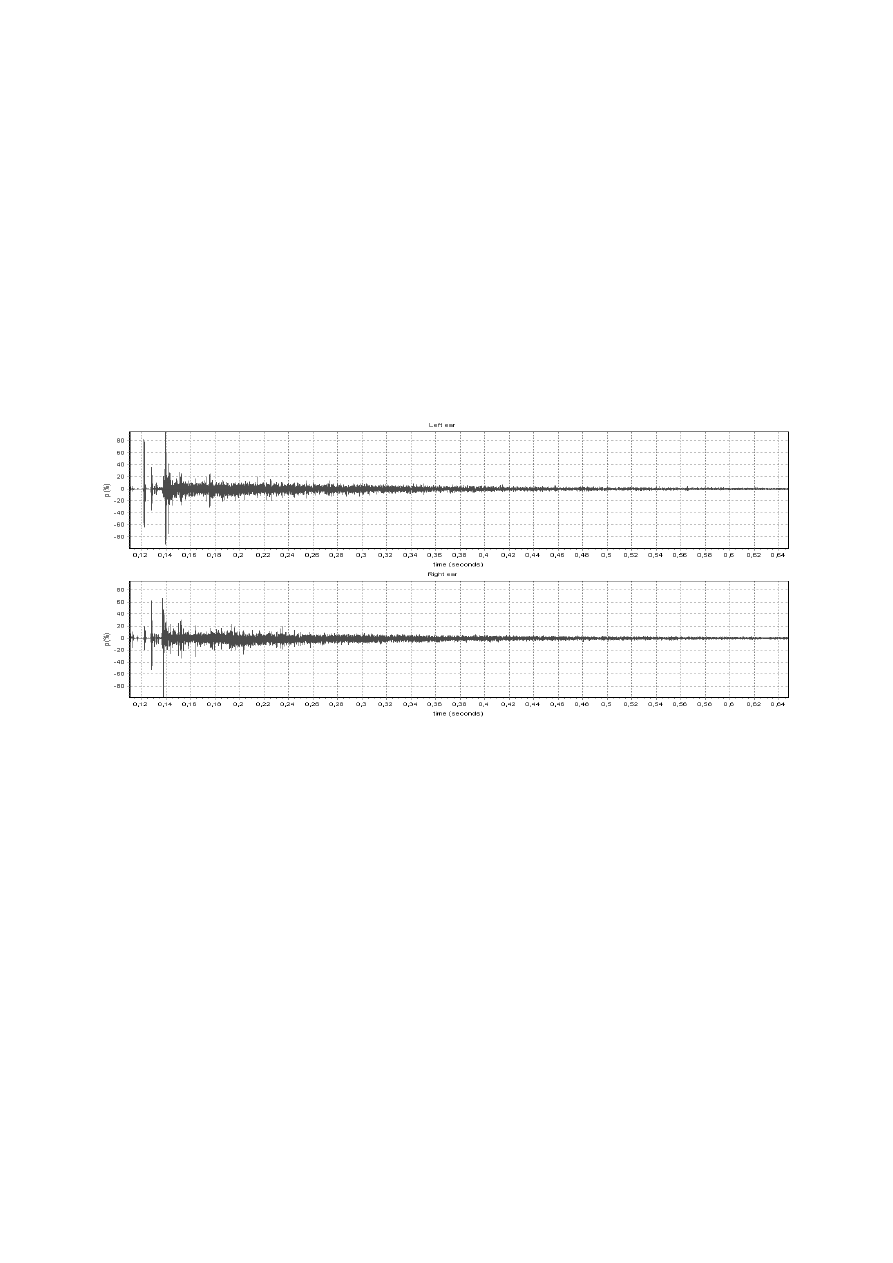
Figure 4. Resulting Binaural Room Impulse Response simulated in a chamber music hall at a distance of 17 metres
from the source. Only the first approximately 500 ms is shown.
OBJECTIVE VERIFICATION
A question that appears when using an auralization system is whether the system is actually
capable of auralizing the acoustic properties, which has been predicted by the room acoustic
program. A simple way of testing this is to measure the room acoustics parameters on the
impulse response filters created by the room acoustics program, using a room acoustics
measuring program to analyse the calculated impulse response. The room acoustic parameters
predicted by the simulation program are then compared with those measured on the auralization
filters. A special set of head related transfer functions (HRTFs) were used in order to model an
omni directional measuring probe rather than a dummy head. The reflections were combined in
the impulse response using random phase in order to simulate a simple DC filter, which would
normally be included in the HRTF filters.
Models of two very different rooms were used for the comparison; a very reverberant
church (the Grundtvig’s church, Copenhagen) and the Elmia multi purpose hall, Jönköping,
Sweden. The latter is the same room, which was used in the 2
nd
Round Robin on Room
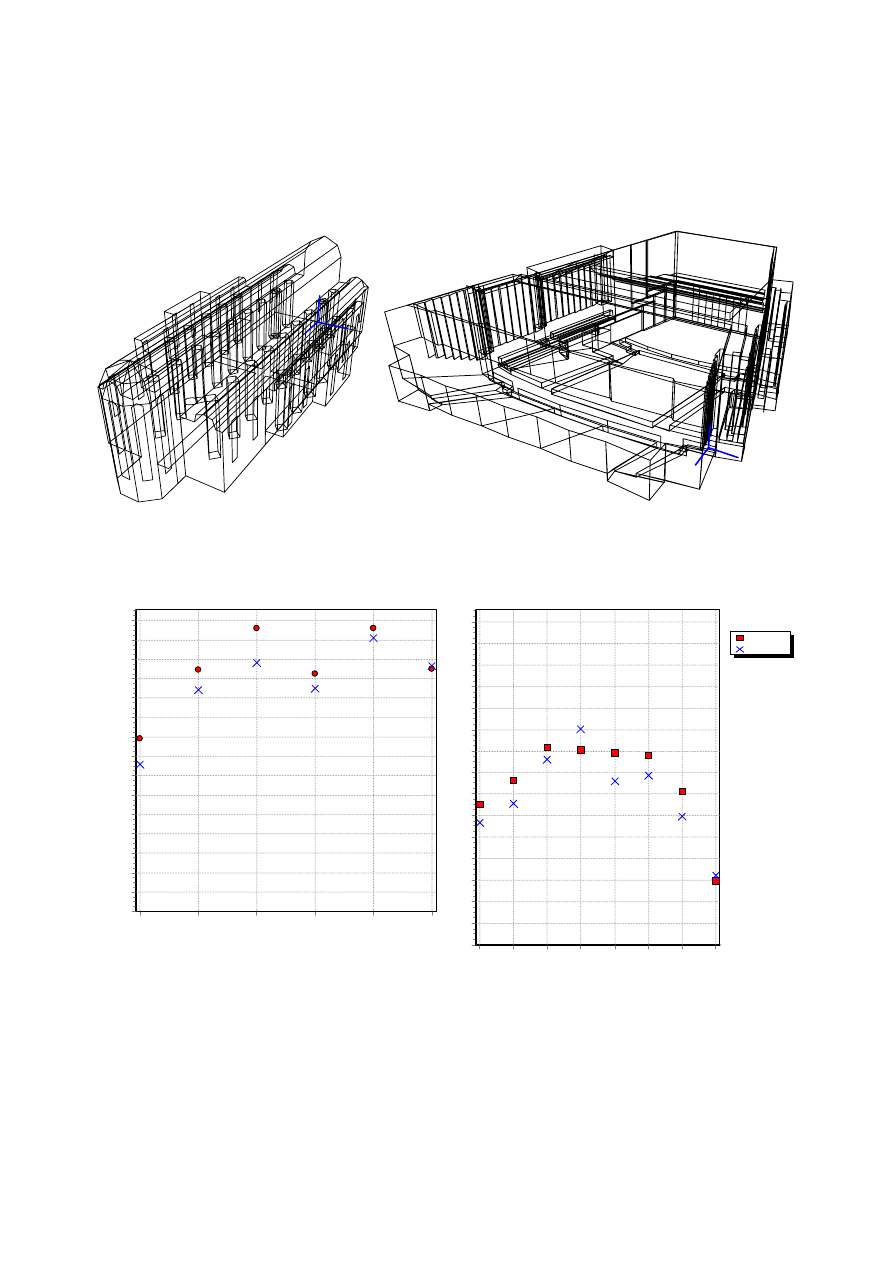
Acoustical Computer Simulation [9]. The two room models are shown in Fig. 5. Two receiver
positions were used in each room, one close to the source and another one far from the source.
In Fig. 6 is a comparison of one of the room acoustics parameters, the centre time Ts, predicted
by ODEON [10], and measured on the auralization filters using the DIRAC [11] measuring
software.
Figure 5. Sample rooms used for verification. A cathedral with a reverberation time of approximately 10 seconds
and a multi purpose hall with a reverberation time of approximately 1.8 seconds.
Ts at 1000 Hz
Distance
R1 at
5
.3
4 m
R
2
at
11
.8
3 m
R
3
at
12
.5
0 m
R
4
at
17
.8
0 m
R
5
at
20
.5
0 m
R
6
at
30
.6
6 m
(m
s)
150
140
130
120
110
100
90
80
70
60
50
40
30
20
10
0
Simulated
Measured
Receiver: 1
Frequency (Hertz)
63
12
5
25
0
50
0
10
00
20
00
40
00
80
00
Ts
(
m
s)
150
140
130
120
110
100
90
80
70
60
50
40
30
20
10
0
Odeon©1985-2003
Figure 6. The parameter Ts in the Elmia hall predicted by ODEON and measured from the simulated impulse
responses using the DIRAC program. Left: Six receiver positions at 1000 Hz. Right: Eight octave bands in receiver
position 1.
O
X
Y
Z
O
X
Y
Z

Results for other room acoustic parameters are listed in Table 1. It appears that the
predicted and measured values are in general very close; with one exception (EDT in the church
in the nearest position) the average errors are far below one subjective limen [9]. These
examples cover very different room acoustic conditions. It should be kept in mind that the test is
really a cross test of the auralization filters as well as the measuring program. Filters of the
Kaiser-Bessel type which were used here, do conflict with the way parameters are derived by a
measuring program, because these filter ‘fires’ before t=0 seconds, see Fig. 3. In the measuring
program the arrival of the direct sound is used to set the reference for the time scale, and it is
assumed the nothing should arrive before the direct sound. So, to some extend this may explain
the small deviations that can be observed in Table 1. However, that main conclusion from this
test is that in terms of room acoustic parameters, the auralization filters are in good agreement
with the prediction, i.e. the auralization can be assumed to offer a reliable acoustic
representation of the room acoustic prediction.
Grundvig’s church
d
s-r
= 5.6 m
Grundvig’s church
d
s-r
= 44.0 m
Elmia hall
d
s-r
= 5.3 m
Elmia hall
d
s-r
= 30.7 m
Room/
Parameter
ODEON DIRAC ODEON DIRAC ODEON DIRAC ODEON DIRAC
EDT
(s) 6.20 7.68 9.06 9.59 1.43 1.44 1.85 1.74
T30
(s) 7.61 7.94 7.32 7.85 1.97 1.98 1.83 1.85
C80
(dB)
-1.2 -0.7 -10.3 -10.3 3.3 4.7 -2.2 -2.2
D50
(-) 0.39 0.39 0.06 0.07 0.58 0.66 0.19 0.20
Ts
(ms) 362 353 670 712 79 64 137 139
Table 1. Room acoustic parameters at 1000 Hz predicted by ODEON and measured from the simulated impulse
responses using the DIRAC program.
SUBJECTIVE VERIFICATION
In order to verify that the quality of the auralization of room acoustics provided by ODEON is in
good agreement with the actual sound in real rooms, comparisons have been made as a part of
the CAHRISMA project [5, 12]. The CAHRISMA project is a research project related to
cultural heritage and is financed by the European Commission. The partners in the project are
from Turkey, Italy, France, Switzerland, Malta, and Denmark. The main purpose of the project
has been to create virtual restoration of some selected churches from the Byzantine period (6
th
century) and some selected mosques by the architect Sinan from the Ottoman period (16
th
century).
Two different types of comparisons have been made:
• In situ recorded song of live performing singer versus auralization from computer
simulation of the room
• Auralization created from in situ recorded impulse responses versus auralization from
computer simulation of the room.
The input to the verification process was anechoic recordings of song using an omni
directional microphone, recording of song in real rooms using a dummy head, and recorded
binaural room impulse responses. The Italian project partner from the University of Ferrara has
made all recordings.
Examples of in situ recordings versus simulations made with ODEON are available at the
internet address [12]. The examples for comparison include:

• In situ recordings of singes performing in a mosque with a reverberation time of
approximately 4 seconds
• Live song in a Byzantine church with a reverberation time of approximately 8 seconds.
For comparisons involving live dummy head recordings, the differences seem very small,
hardly audible. For comparisons between the auralizations from simulations and those from
recorded BRIRs the difference is indeed audible. The main reason is that the sound source acts
as a low-pass filter, so some high frequency information is missing in the measured BRIRs. This
means that the auralizations from simulations actually sound more natural than the auralizations
using the measurements from the real room. However, even so these examples do verify that
echoes and reverberation are simulated correctly.
CONCLUSIONS
It has been shown that the auralization method that has been developed in the ODEON room
acoustics program is capable of reproducing the predicted room acoustical properties. Room
acoustic parameters are well represented by the filters created for auralization, and that includes
the variation with position as well as with frequency. When listening to the auralizations and
comparing to dummy head recordings in the same position in the same room, the differences are
hardly audible. The auralization technique has matured to such a level, that the human ear can
hardly tell whether it is a simulation or not.
REFERENCES
1. G.M. Naylor, “Treatment of Early and Late Reflections in a Hybrid Computer Model for
Room Acoustics,” 124th ASA Meeting, paper 3aAA2 (New Orleans 1992).
2. G.M. Naylor, “ODEON - Another Hybrid Room Acoustical Model,” Applied Acoustics
38, 131-143 (1993).
3. J.H. Rindel, “Computer Simulation Techniques for Acoustical Design of Rooms,”
Acoustics Australia 23, 81-86 (1995).
4. M. Vorländer, “International Round Robin on Room Acoustical Computer Simulations,”
15
th
International Congress on Acoustics, Proceedings vol. II pp. 689-692 (Trondheim,
Norway, 1995).
5. C.A. Weitze, C. Lynge Christensen, J.H. Rindel and A.C. Gade, “Computer Simulation of
the Acoustics of Mosques and Byzantine Churches,” 17th ICA, Proceedings /CD-ROM
(Rome, 2001).
6. Claus Lynge Christensen and Hans Torben Foged, “A room acoustical computer model for
industrial environments - the model and its verification,” Euro-noise 98, Proceedings pp.
671-676 (München, 1998).
7. J.H. Rindel, “Modelling the Angle-Dependent Pressure Reflection Factor,” Applied
Acoustics 38, 223-234 (1993).
8. John S. Bradley, Gilbert A. Soulodre, “The influence of late arriving energy on spatial
impression,” J. Acoust. Soc. Am. 97, 2263 -2271 (1995).
9. Ingolf Bork, “A Comparison of Room Simulation Software – The 2
nd
Round Robin on
Room Acoustical Computer Simulation,” Acta Acustica 86, 943-956 (2000).
10. The ODEON home page
11. The DIRAC home page
http://www.acoustics-engineering.com
12. The CAHRISMA home page
http://www.at.oersted.dtu.dk/cahrisma.htm
Document Outline
Wyszukiwarka
Podobne podstrony:
Gade, Lisa, Lynge, Rindel Roman Theatre Acoustics; Comparison of acoustic measurement and simulatio
Michael Vorlander Internationa Round Robin on Room Acoustical Computer Simulations
Munster B , Prinssen W Acoustic Enhancement Systems – Design Approach And Evaluation Of Room Acoust
AES Information Document For Room Acoustics And Sound Reinforcement Systems Loudspeaker Modeling An
Articulation and acoustics Ladefoged and Johnson (2011; 8 17)
Iannace, Ianniello, Romano Room Acoustic Conditions Of Performers In An Old Opera House
DESIGN, SIMULATION, AND TEST RESULTS OF A HEAT ASSISTED THREE CYLINDER STIRLING HEAT PUMP (C 3)(1)
Nijs L , de Vries The young architect’s guide to room acoustics
IMPORTANCE OF EARLY ENERGY IN ROOM ACOUSTICS
Simulating and optimising worm propagation algorithms
Katz International Round Robin on Room Acoustical
Modelling Room Acoustics
Room Acoustics Acoustical Parameters Measurement
Computer Modelling with CATT Acoustic Theory and Practice of Diffusion Reflection and Array Modelin
Baudrillard Simulacra and Simulation
AJA Results of the NPL Study into Comparative Room Acoustic Measurement Techniques Part 1, Reverber
DESIGN, SIMULATION, AND TEST RESULTS OF A HEAT ASSISTED THREE CYLINDER STIRLING HEAT PUMP (C 3)(1)
więcej podobnych podstron