
Modeling and minimizing process time of combined convective and vacuum
drying of mushrooms and parsley
B. Zecchi
, L. Clavijo, J. Martínez Garreiro, P. Gerla
Instituto de Ingeniería Química, Facultad de Ingeniería, Universidad de la República, J. Herrera y Reissig 565, C.P. 11300, Montevideo, Uruguay
a r t i c l e
i n f o
Article history:
Received 30 August 2010
Received in revised form 19 November 2010
Accepted 28 November 2010
Available online 7 December 2010
Keywords:
Parsley
Mushrooms
Modeling
Vacuum drying
Convective drying
a b s t r a c t
The aim of this work was to obtain a technological and economic alternative for mushroom and parsley
dehydration combining convective and vacuum drying. Depending of product, this combination of tech-
nologies allows minimization of total drying time and avoids negative effects on quality of thermo-sen-
sitive products during drying. Experimental drying curves were determined in a cross-flow convective
dryer and in a cabinet vacuum dryer at 35, 45 and 55 °C. The most appropriate theoretical models were
obtained and applied for combined processes in order to minimize the overall drying time and avoid final
product damage. For parsley at the highest temperature (45 °C), reductions of 63% and 16% in drying time
were observed with the combined drying process compared to the sole convective and sole vacuum dry-
ing, respectively. This reduction in process time was obtained when dryer change was done at the inter-
mediate moisture condition that determines the highest drying rate during the whole combined process
of convective and vacuum drying. For mushrooms, convective drying throughout the process, at the high-
est temperature (55 °C) compatible with product visual quality, minimized drying time.
Ó 2010 Elsevier Ltd. All rights reserved.
1. Introduction
New trends in the development and improvement of processes
and products in the dehydrated food area lead to the combination
of different conventional and non-conventional drying technolo-
gies. The objective of this trend is to accomplish a drying strategy
that contemplates changes in product as its moisture decreases, by
adapting to its increasing thermo-sensitivity and thus avoiding
main damages in final product with an efficient and cost-effective
process appropriate to the product value in the market.
Depending on the product, one or more characteristics (aroma,
taste, texture, integrity, etc.) will define acceptance by the consum-
ers as well as the value of the product. Conventional convective
drying technologies produce negative effects in many natural ther-
mo-sensitive products, even for low temperatures when the mois-
ture of the product is low (
). In parsley, the main
problems are aroma degradation and yellowing, in comparison to
the fresh green product. For mushrooms, the main problems are
changes of color and texture (
Askari et al., 2009; Kotwaliwale
). Freeze-drying, which has been developed as a dehy-
dration process for high quality products, proves to be economi-
cally viable only for very high value products (
). For
these reasons, neither convective drying nor freeze-drying
constitute adequate technological solutions for the industrial pro-
duction of many of commercially important dehydrated products.
Numerous studies relate the final quality of dehydrated products
with drying process conditions (
Gothandapani et al., 1997; Kotw-
). These studies
show the sensitivity of mushrooms to temperature. High air dry
temperatures (T > 60 °C) cause darkening in color, hardening and
decrease in rehydration ability as showed by
. Although numerous modeling and experimental studies
have been carried out to investigate drying of mushrooms, few
works about heat and mass transfer phenomena models are re-
ported (
da Silva et al., 2009; Efremov, 2002; Jaya and Das, 2003;
). There are also few studies on parsley drying
technologies and quality (
Kavav Akpinar et al., 2006; Doymaz
). For the case of parsley drying, it is known that temper-
atures in excess of 60 °C cause a significant loss of herb volatile oils.
Drying of parsley at 40 °C with a large volume of air moving
through the material, reduces the loss of oils before color loss,
maintaining flavor in the dried flakes, but long drying time is re-
quired and the quality of the dehydrated product is usually not
good. In recent years some studies about combined drying pro-
cesses were published, (
Contreras et al., 2008; Cui et al., 2003; Fig-
). Most of them develop empir-
ical models, semi empirical models or surface response methodol-
ogy for the description of the process (
0260-8774/$ - see front matter Ó 2010 Elsevier Ltd. All rights reserved.
doi:
10.1016/j.jfoodeng.2010.11.026
⇑
Corresponding author. Tel.: +598 27122620; fax: +598 7107437.
E-mail address:
(B. Zecchi).
Journal of Food Engineering 104 (2011) 49–55
Contents lists available at
Journal of Food Engineering
j o u r n a l h o m e p a g e : w w w . e l s e v i e r . c o m / l o c a t e / j f o o d e n g

The objectives of this work were to study, model and minimize
the process time for a combination of convective and vacuum dry-
ing for mushrooms and parsley dehydration. The hypothesis is that
this combination can be an adequate technological solution for
reducing dehydration process time for many thermo-sensitive nat-
ural products. The predictive models formulated can be used as a
tool for determining process time, for process control or for evalu-
ation of the effect of modifications in the process variables.
2. Materials and methods
2.1. Drying experiments
Pleurotus mushrooms and Italian parsley were selected because
of their high market value as dehydrated products.
A convective cross-flow air dryer and a vacuum cabinet dryer
were used as experimental systems for determination of parsley
and mushrooms drying curves Samples of approximately 200 g of
fresh parsley and mushrooms were dried from fresh product mois-
ture (92.5% (wb) for mushrooms and 85% (wb) for parsley) to a fi-
nal moisture of 5–7% (wb).
For convective air-drying experiences, a cross-flow convective
dryer instrumented with controls for air velocity and tempera-
tures, was used. Sensors of air temperature and relative humidity
were installed and connected to data-logger for recording experi-
mental data of air conditions during drying (Vaisala, mod HMI
38, Finland). All tests were carried out with an air velocity of
1 m/s for three levels of temperatures (35, 45 or 55 °C). Samples
were weighted periodically during the drying process and loss of
weigh as function of time was computed.
Vacuum drying experiments were done in a vacuum cabinet
dryer, instrumented with temperature and pressure controls, and
a continuous weighting system with a load cell inside the cabinet
for data transmission (weight and time) to a remote balance dis-
play and a computer for data storage. Ambient conditions (T,
%HR) inside and outside the vacuum chamber were registered.
Experiences of vacuum drying were done for three different tem-
peratures (35, 45 and 55 °C) and at an operating pressure of 28
in Hg.
For all samples assayed, moisture content of initial and dehy-
drated product was determined gravimetric method at 105 °C
(
).
Data obtained from these experiments were fitted to models of
convective and vacuum drying in the whole range of products
moistures (from X
0
to X
F
).
In addition to experiments of drying in each individual dryer,
experiments combining both drying processes were carried out,
beginning with the fresh product in the convective dryer and end-
ing with the vacuum dryer. In this experience, same conditions of
temperature and air velocity for convective drying as well as same
conditions in temperature and pressure in the vacuum dryer were
set. The intermediate moisture for changing from convective dryer
to vacuum dryer was determined from drying rate curves and
models obtained for each drying technology, as discussed in Sec-
tion
.
At the end of each experience, dehydrated products’ visual
appearance (yellowing, darkening, and shrinking) was evaluated
qualitatively.
2.2. Mathematical modeling
Phenomenological models with diffusive control of drying pro-
cesses, for both convective and vacuum dehydration were formu-
lated. In structured foods, the common approach to modeling
mass transfer is to use an effective diffusion coefficient defined
by the Fick’s second law where the diffusion coefficient may be
dependent on the product moisture content. This effective diffusiv-
ity usually considers other simultaneous mechanisms of transport
as capillarity flow of liquid, vapor diffusion, hydrodynamic flow of
liquid and vapor due to pressure gradients and condensation–
evaporation in a receding front. Others factor as porosity and tor-
tuosity are also lumped in this effective coefficient. In this way,
we used the concept of effective diffusivity, D
e
, and Fick’s second
law to describe moisture transport during drying of parsley and
mushrooms:
@
X
@
t
¼
@
@
z
D
e
@
X
@
z
ð1Þ
In order to solve Eq.
, geometry, initial conditions and boundary
conditions must be established for the considered drying processes.
In many cases, the shape of the solid to be dried is very complex and
cannot be assimilated to any simple geometry, as occurs with
mushrooms or parsley leaves in a cross-flow air convective dryer
or in a cabinet vacuum dryer. The simplest assumption is to assim-
ilate the system geometry to an infinite plane of equivalent thick-
ness 2L, and the differential equation solution for average
moisture will be expressed as a function of the Fourier number
for mass (Fo = D
e
t/L
2
) where (D
e
/L
2
) is a parameter of the system
that will be determined.
Nomenclature
a
, b
models constant
D
e
effective diffusivity (m
2
/s)
D
0
initial effective diffusivity (m
2
/s)
db
dry basis
%e
absolute average error percentage
Fo
Fourier number (D
e
t/L
2
)
%HR
relative humidity percentage
L
half thickness of slab (m)
n
number of experimental values
P
pressure (in Hg)
t
process time (min)
t
0
initial time of drying process (min)
t
C,A
convective drying time to achieve intermediate mois-
ture (min)
t
C,F
convective drying time to achieve final moisture (min)
t
V,A
vacuum drying time (min)
t
V,F
vacuum drying time to achieve intermediate moisture
(min)
T
temperature (°C)
X
moisture content (kg water/kg dry matter)
X
average moisture content (kg water/kg dry matter)
X
A
intermediate moisture (kg water/kg dry matter)
X
calc
theoretical moisture calculated, Eqs.
(kg water/
kg dry matter)
X
e
equilibrium moisture content (kg water/kg dry matter)
X
exp
experimental moisture (kg water/kg dry matter)
X
F
final moisture (kg water/kg dry matter)
X
0
initial moisture content (kg water/kg dry matter)
wb
wet basis
z
spatial coordinate (m)
50
B. Zecchi et al. / Journal of Food Engineering 104 (2011) 49–55

Two possibilities were considered for the dependency of diffu-
sivity with moisture content of the solid: firstly, the effective diffu-
sivity remains approximately constant during the process, being:
D
e
¼ D
0
8
t P 0
ð2Þ
and secondly, diffusivity varies with moisture content and struc-
tural changes that occur in the solid during dehydration in the fall-
ing rate period. This variation can be considered as a functional
relationship between the effective diffusivity and the Fourier num-
ber (
D
e
¼ D
0
ð1 þ FoÞ
b
1
8
t P 0
ð3Þ
A homogenous and isotropic behavior of the product and a uniform
distribution of moisture in the sample at initial time were assumed.
This initial condition is:
X ¼ X
0
L 6 z 6 L;
t ¼ 0
ð4Þ
Two different hypotheses were considered for the boundary condi-
tions of the system: on one hand, the interface moisture content re-
mains constant in equilibrium condition during the process:
X ¼ X
e
z ¼ L;
t P 0
ð5Þ
and on the other hand, the interface moisture content changes rap-
idly but not instantaneously and it was assumed that the interface
condition varies exponentially with drying time, as moisture in the
solid decreases:
X X
e
X
0
X
e
¼ e
a
De
L2
t
z ¼ L;
t P 0
ð6Þ
Furthermore, the diffusion coefficient of water in the solid is a
transport property that usually depends on the temperature of
the product.
Integrating Eq.
for the different hypotheses about diffusivity
dependence and interface conditions, a set of solutions for the var-
iation of moisture content in space and time were obtained. The
average moisture in the whole solid, as a function of the process
time, was obtained by integrating with respect to space variable,
z, between limits L and +L, resulting in the following equations
(
):
Case 1: Constant surface concentration and constant effective
diffusivity.
X X
e
X
0
X
e
¼
8
p
2
X
1
n¼0
exp
ð2nþ1Þ
2
p
2
D
e
t
4L
2
ð2n þ 1Þ
2
ð7Þ
Eq. (7) results from solving Eq.
with constant diffusivity, Eq.
and initial and boundary conditions given by Eq.
and Eq.
and
then integrating for average moisture in the whole solid product.
Case 2: Constant surface concentration and variable effective
diffusivity.
X X
e
X
0
X
e
¼
8
p
2
X
1
n¼0
1
ð2n þ 1Þ
2
exp
ð2n þ 1Þ
2
p
2
4b
1 þ
D
e
t
L
2
b
1
!
!
ð8Þ
Eq.
, results from solving Eq.
with variable diffusivity, Eq.
and initial and boundary conditions given by Eq.
and Eq.
and
then integrating for average moisture in the whole solid product.
Case 3: Variable surface concentration and constant effective
diffusivity.
X X
e
X
0
X
e
¼ e
a
De
L2
t
tan
a
a
1=2
þ
8
p
2
X
1
n¼0
exp
ð2nþ1Þ
2
p
2
D
e
t
4L
2
ð2n þ 1Þ
2
1 ð2n þ 1Þ
2
p
2
4
a
h
i
ð9Þ
Eq.
, results from solving Eq.
with constant diffusivity, Eq.
,
and initial and boundary conditions given by Eq.
and Eq.
and
then integrating for average moisture in the whole solid product.
Case 1 represents the simplest type of diffusion process and the
analytical solution given by Eq.
is proposed very frequently for
modeling convective drying. Case 2 uses a variable diffusion coef-
ficient in time, allowing the consideration of the effect of changes
in moisture and structure that occur in the solid during drying,
affecting diffusivity value. Case 3, which considers a variable inter-
face condition, may be a good approach considering that surface
concentration changes rapidly but equilibrium conditions are not
established instantaneously at initial time.
The models representing drying curves, given by Eqs.
were tested for sole convective drying, sole vacuum drying and a
combination of both technologies for the whole dehydration pro-
cess for different operating conditions, in mushrooms and parsley
dehydration.
Computational
programs
for
non-linear
multiparametric
regression were developed using PC-Matlab 6.0 software. Fitting
was made using a computational program that minimizes the
absolute average error percentage between experimental and the-
oretical values. The numerical method used was Simplex, which
employs the Nealder–Mead algorithm for non-linear optimization
calculus, determining the resulting values of the parameters that
optimize the fitting of each theoretical model and the correspond-
ing experimental data (X, t).
The absolute average error percentage between theoretical
moisture and experimental value were calculated as:
%
e ¼
100
n
ffiffiffiffiffiffiffiffiffiffiffiffiffiffiffiffiffiffiffiffiffiffiffiffiffiffiffiffiffiffiffiffiffiffiffi
X
ðX
2
calc
X
2
exp
Þ
q
ð10Þ
Comparison between the absolute average error percentage calcu-
lated by Eq.
for each case (two products, two processes, three
levels of temperature and three theoretical models) allowed the
determination of the best model for the description of drying kinet-
ics for convective and vacuum drying.
2.3. Determination of the best combination of both processes
The combined process can be described by the combination of
the convective and vacuum drying individual kinetics models.
Using individual models, it is possible to determine the intermedi-
ate moisture (X
A
) of each product at which the change of dryer
should be carried out. This intermediate moisture was determined
as the moisture value at which the relative drying rate of both pro-
cesses was reversed. Changing of drying technology at this mois-
ture, results in minimizing the overall time of the combined
drying process. These intermediate moisture value that depends
on temperature, vacuum pressure, initial moisture content and
product, was selected in order to maintain the highest drying rate
during the whole combined process of convective and vacuum dry-
ing (from X
0
to X
F
).
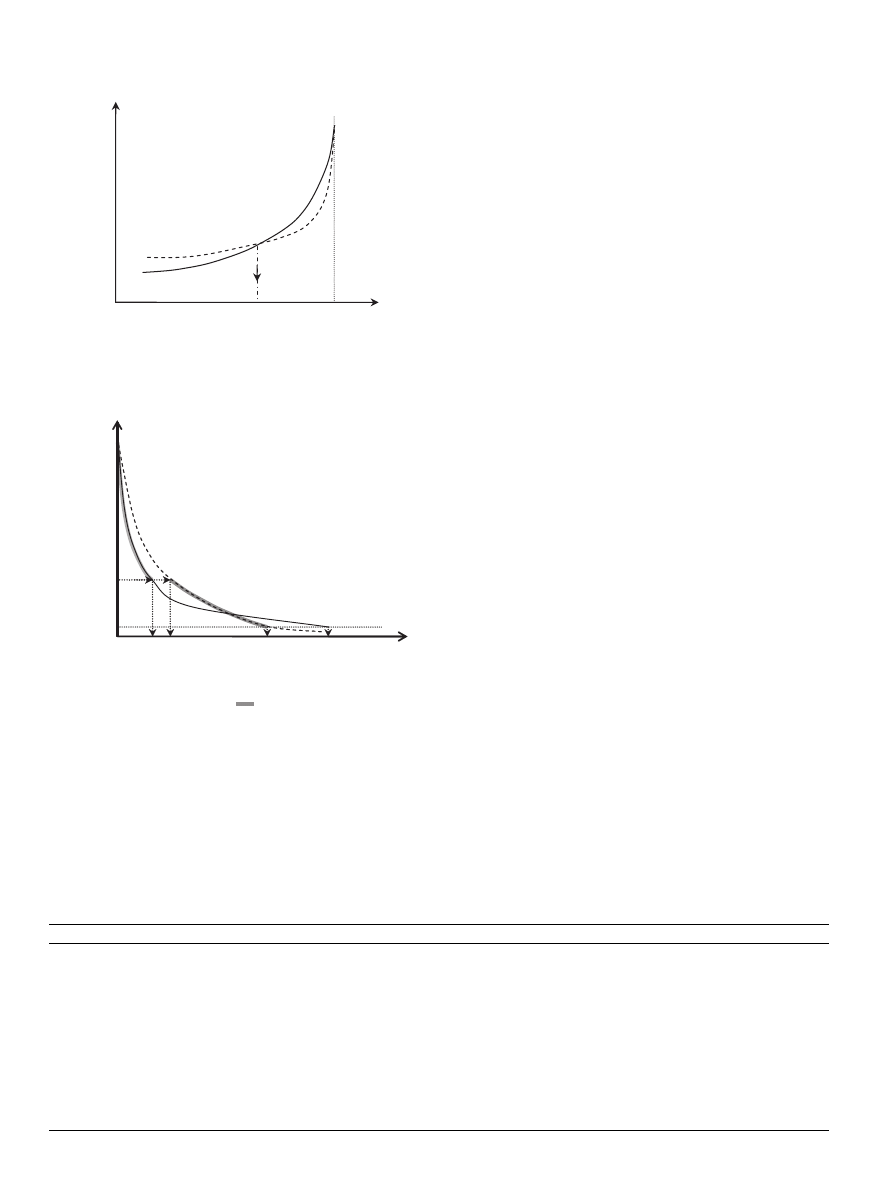
represent the procedure to determine the value of
intermediate moisture (X
A
) and minimum time for the whole com-
bined process.
From the drying rate curves (
) at the same temperature for
both processes, the intersection point (X
A
/X
0
) corresponding to the
same drying rates in both individual convective and vacuum dry-
ing processes is determined. A mathematical analysis of drying rate
curves functions shows that for dimensionless moisture values
higher than X
A
/X
0
, convective drying rate is higher than vacuum
drying. For dimensionless moisture values lower than X
A
/X
0
, vac-
uum drying is faster than convective drying. In this way, the faster
process is achieved when process starts with convective drying and
changes to vacuum drying at the intermediate moisture (X
A
). This
procedure determines the minimum time of combined process.
B. Zecchi et al. / Journal of Food Engineering 104 (2011) 49–55
51
Convective process time (t
C,A
t
0
) is required for reduction of
moisture from the initial value, X
0
to intermediate moisture, X
A
.
From convective drying curve, abscise value of point (X
A
/X
0
, t
C,A
)
determine t
C,A
(
). In this moment the change of dryer is done.
The vacuum drying is the second stage of combined drying process,
beginning when moisture of product reaches the intermediate
value X
A
. This process continues until the final moisture of the
product (X
F
) is reached at final time t
VF
. From vacuum drying curve,
abscise value of time (t
V,A
), corresponding to intermediate mois-
ture value X
A
of product can be determined (
). Vacuum drying
time results to be (t
V
,
F
t
V,A
).
When combination of convective and vacuum drying is per-
formed, the minimum total time required to achieve final moisture
of the dehydrated product, can be calculated as:
t ¼ ðt
C;A
t
0
Þ þ ðt
V;F
t
V;A
Þ
ð11Þ
When convective drying is the first stage of the combined process,
its initial time is t
0
= 0. So the convective drying time results to be
equal to t
C,A
, while for vacuum drying the required time is
(t
V
,
F
t
V,A
).
For combined process, the overall time required can be calcu-
lated from Eq.
where values of t
C,A
, t
V,A
, and t
V,F
, are calculated
from equations of models for each convective and vacuum process
as the abscise of points (X
A
, t
C,A
), (X
A
, t
V,A
), and (X
F
, t
V
,
F
).
When there is an intersection of drying rate curves, in the range
of drying moisture and processes temperature, combined process
time (t) results to be lower than required drying time from X
0
to
X
F
when only one of dryer technologies is used.
When sole convective dryer is applied, time required for dehy-
dration from X
0
to X
F
is (t
C,F
t
0
), while in case that only vacuum
drying is applied, time required is (t
V,F
t
0
) for the same range of
moisture (X
0
to X
F
) and temperature.
Initial moisture content of fresh product is normally a high va-
lue and convective drying results to be the fast technology in the
beginning of the process. As
shows, the saving time resulting
of combining convective and vacuum drying can be calculated as:
t
saved
¼ ðt
V;A
t
C;A
Þ þ ðt
C;F
t
V;F
Þ
ð12Þ
which is a positive number for the case that an intersection of dry-
ing rates curves exists at a moisture value in range of moistures and
temperature of the processes.
3. Results and discussion
3.1. Kinetics of convective drying, vacuum drying and combined
technologies
For each product (parsley and mushrooms) and for each drying
process (convective and vacuum) at three different temperatures,
drying curves and drying rate curves were determined.
The three different theoretical models proposed were fitted
with experimental data for each temperature. The parameters of
each model and the absolute average error percentage are listed
in
for parsley and mushrooms, respectively.
X/X
0
X
A
/X
0
-1
/X
0
d
X
/d
t
Vacuum
Convective
1
0
Dimensionless moisture, (X/X
0
)
Fig. 1. Scheme to determine the intermediate moisture for change of dryer.
Dimensionless moisture, (X/X
0
)
1
Time
X
F
/X
0
X
A
/X
0
t
C,A
t
V, A
t
0
t
V
,
F
t
C
,
F
Fig. 2. Scheme to determine the minimum time of combined process. Convective
(—) and vacuum (- - - -) drying curves, (
) first and second stage of combined
process.
Table 1
Parameters of different models determined for parsley drying.
Convective drying
Vacuum drying
Drying conditions
T (°C)
35
45
55
35
45
55
P (in Hg)
0
0
0
28
28
28
X
0
(g
H
2
O
/g
SS
)
7.41
5.67
7.63
6.37
6.19
5.69
Model 1
D
e
/L
2
10
3
(min
1
)
1.42
1.63
6.91
0.42
1.01
1.54
%e (abs, average)
5.8
3.6
3.3
1.7
2.4
7.1
Model 2
D
e
/L
2
10
3
(min
1
)
1.87
1.77
6.19
0.20
0.49
0.075
b
0.29
0.54
1.62
7.62
7.02
7.18
%e (abs, average)
1.8
3.3
2.1
7.4
7.7
1.8
Model 3
D
e
/L
2
10
3
(min
1
)
–
–
–
2.19
6.19
9.72
a
1
1
1
0.72
0.59
0.57
%e (abs, average)
–
–
–
0.3
0.5
0.9
For
a
?
1 (
a
> 10), Model 3 reduce to Model 1
52
B. Zecchi et al. / Journal of Food Engineering 104 (2011) 49–55
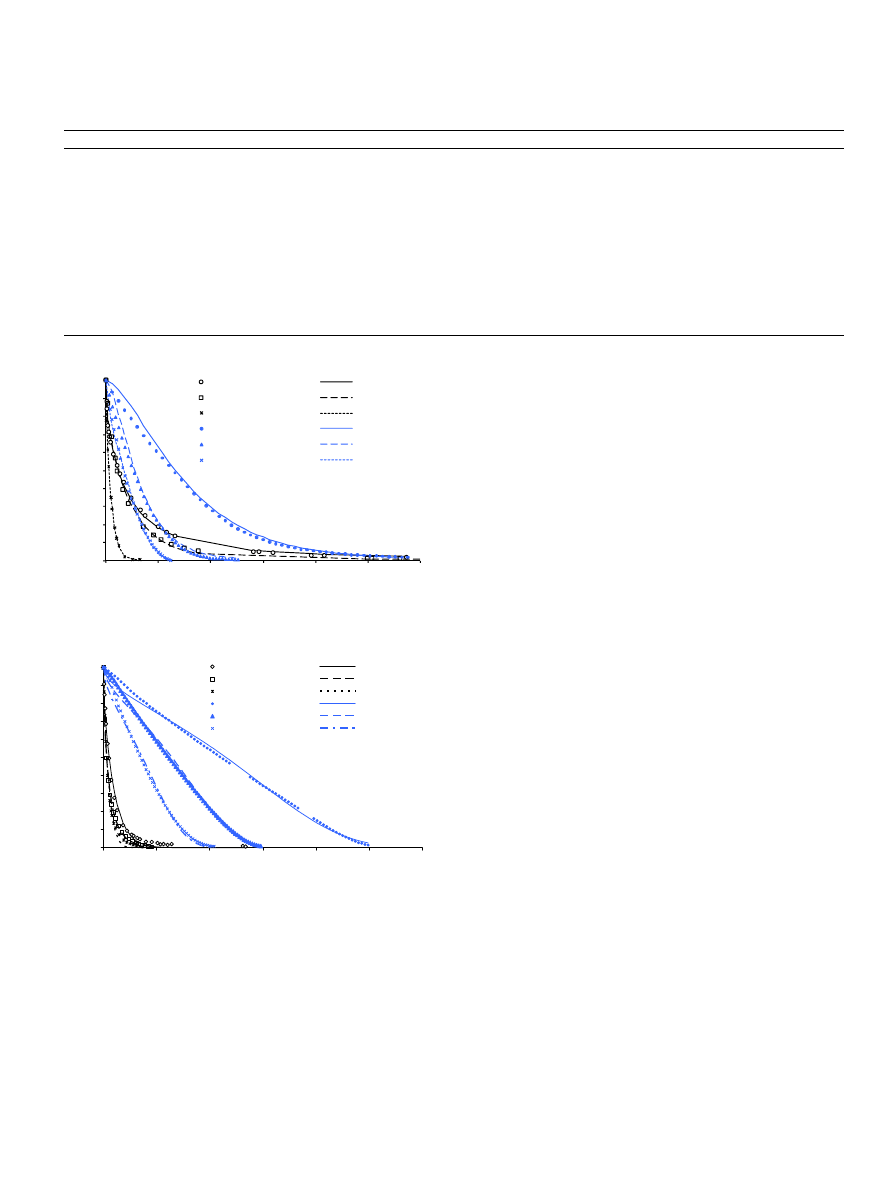
Experimental values and the theoretical curves corresponding
to the best models for the convective and vacuum drying are
shown in
for parsley and in
for mushrooms.
For both parsley and mushrooms and for all temperatures, the
best model in predicting the convective drying process was model
2, Eq.
, obtained for variable diffusion coefficient as function of
Fo number and constant surface concentration. For vacuum drying
at the same temperatures, model 3, Eq.
, which considers con-
stant effective diffusivity and exponential variation in time of the
surface moisture content, was the best one. Model 1, Eq.
, the
classical diffusion model with constant effective diffusivity and
equilibrium as surface condition, was not adequate for the descrip-
tion of any of the process at any temperature assayed.
The models selected for each case can predict the evolution of
average moisture in time with a percentage of absolute average er-
ror between 0.3% and 8.3%.
The combined dehydration process began with the convective
drying and followed by vacuum drying. Combining the individual
models determined for each process could represent the experi-
mental kinetics of the combined process.
show that drying rate increases when the process tem-
perature increases in both convective and vacuum drying. For the
same temperature, mushrooms convective drying was faster than
parsley convective drying. However, parsley vacuum drying was
faster than mushrooms vacuum drying. For high moistures, con-
vective drying occurred at higher rates than vacuum drying for
both products at all temperatures assayed. When moisture de-
creased, convective drying rate diminished faster than vacuum
drying rate. Both drying temperature (a constant parameter of
the processes) and product moisture (which decreases during the
process), determine simultaneously the instantaneous drying rate.
Evaluation of main characteristics of dehydrated products,
show important yellowing and texture damage for drying temper-
ature over 45 °C for parsley while darkening and shrinking are
important for drying temperatures over 55 °C for mushrooms. Vi-
sual appraisal showed that the highest temperature assayed that
determines highest drying rate for each process without apprecia-
ble damage was 45 °C for parsley and 55 °C for mushrooms.
3.2. Combination of processes for minimum overall time
show the curves obtained for convective and vac-
uum drying rates for parsley and mushrooms as function of dimen-
sionless moisture of the product. Intermediate moisture at which
relative rates of both processes was reversed is also indicated in
these figures. At this intermediate moisture, change of dryer
should be done. This situation was very clear in the case of parsley,
but not in the case of mushrooms, where the reversion of drying
rates did not occur for the range of temperatures studied.
At 55 °C mushrooms convective drying rate is high and its
reduction, when low moisture contents in the products is achieved,
is not enough for producing a reversion of drying rates in relation
with vacuum drying process. Convective drying at this tempera-
ture remains at higher rates than vacuum drying for the whole
moisture range and sole convective drying of mushrooms at this
temperature is the option that minimizes the drying time. Restric-
tions to this criterion will only be imposed by the maximum drying
temperature in order to avoid damage of the product.
shows the reduction of total time process when combined
convective and vacuum drying for parsley is used. Minimum time
of the combined process was determined, starting with convective
Table 2
Parameters of different models determined for mushrooms drying.
Convective drying
Vacuum drying
Drying conditions
T (°C)
35
45
55
35
45
55
P (in Hg)
0
0
0
28
28
28
X
0
(g
H
2
O
/g
SS
)
8.65
11.20
11.31
7.16
15.40
11.27
Model 1
D
e
/L
2
10
3
(min
1
)
3.85
6.29
7.19
0.25
0.42
0.78
%e (abs, average)
4.9
6.1
9.0
2.5
6.7
5.1
Model 2
D
e
/L
2
10
3
(min
1
)
3.72
7.36
6.14
0.069
0.12
0.26
b
1.19
0.33
1.92
21.51
22.73
15.18
%e (abs, average)
4.9
4.6
8.3
0.4
1.2
1.2
Model 3
D
e
/L
2
10
3
(min
1
)
–
–
–
0.63
1.17
1.95
a
1
1
1
2.23
2.11
2.24
%e (abs, average)
–
–
–
0.9
2.2
1.3
For
a
?
1 (
a
> 10), Model 3 reduce to Model 1
0.0
0.1
0.2
0.3
0.4
0.5
0.6
0.7
0.8
0.9
1.0
0
500
1000
1500
2000
2500
3000
X/
Xo
(
d
b
)
T i me (min)
Conv. Exp. 35ºC
Conv. Theo. 35ºC
Conv. Exp. 45ºC
Conv. Theo. 45ºC
Conv. Exp. 55ºC
Conv. Theo. 55ºC
Vac. Exp. 35ºC
Vac. Theo. 35ºC
Vac. Exp. 45ºC
Vac. Theo. 45ºC
Vac. Exp. 55ºC
Vac. Theo. 55ºC
Fig. 3. Experimental data and best theoretical model for convective and vacuum
drying of parsley, at different temperatures.
0.0
0.1
0.2
0.3
0.4
0.5
0.6
0.7
0.8
0.9
1.0
0
500
1000
1500
2000
2500
3000
Time (min)
X/Xo (db)
Conv. Exp. 35ºC
Conv. Theo. 35ºC
Conv. Exp. 45ºC
Conv. Theo. 45ºC
Conv. Exp. 55ºC
Conv. Theo. 55ºC
Vac. Exp. 35ºC
Vac. Theo. 35ºC
Vac. Exp. 45ºC
Vac. Theo. 45 ºC
Vac. Exp. 55ºC
Vac. Theo. 55ºC
Fig. 4. Experimental data and best theoretical model for convective and vacuum
drying of mushrooms, at different temperatures.
B. Zecchi et al. / Journal of Food Engineering 104 (2011) 49–55
53
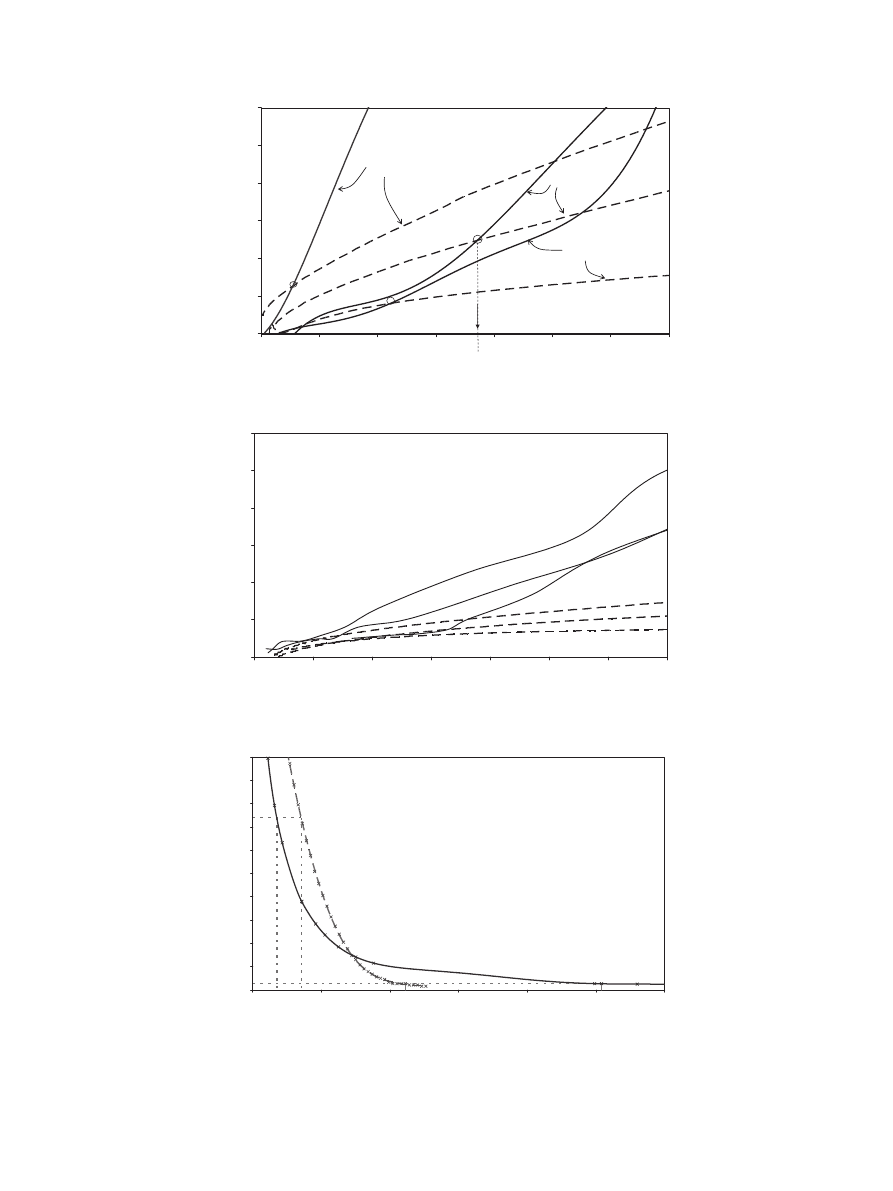
drying process and fresh product. It could be seen that when
operating at the maximum suitable drying temperature (45 °C),
the reversion of drying rates occurred at (X
A
/X
0
) = 0.37, which
corresponded to a product moisture of 67% (wb). For lower mois-
ture content, drying should be continued in a vacuum dryer at
45 °C, in order to dry parsley from a moisture content of 67% to
the final moisture content (7%) (wb). The minimum time of the
process was 930 min. Dehydration of parsley under same
0,0000
0,0005
0,0010
0,0015
0,0020
0,0025
0,0030
0
0.1
0.2
0.3
0.4
0.5
0.6
0.7
X/Xo (db)
-1/X
o dX/dt (min
-1
)
X/X
0
=0,37
55 ºC
45 ºC
35 ºC
Fig. 5. Convective (—) and vacuum (- - - -) drying rates of parsley as a function of dimensionless moisture of product at different temperatures.
0,0000
0,0005
0,0010
0,0015
0,0020
0,0025
0,0030
0
0,02
0,04
0,06
0,08
0,1
0,12
0,14
X/Xo (db)
-1/Xo dX/dt (min
-1
)
55 ºC
45 ºC
35 ºC
55 ºC
45 ºC
35 ºC
Fig. 6. Convective (—) and vacuum (- - - -) drying rates of mushrooms as a function of dimensionless moisture of product at different temperatures.
0
0,05
0,1
0,15
0,2
0,25
0,3
0,35
0,4
0,45
0,5
0
500
1000
1500
2000
2500
3000
Time (min)
X/X
0
(
db)
X
A
/X
0
=0.37
t
C,A
=175
t
V,A
=355
t
V,F
=1110
t
C,F
=2540
X
f
/X
0
=0.013
Fig. 7. Determination of minimum drying time of parsley combining processes. Convective (—) and vacuum (- - - -) drying curves of parsley for 45 °C.
54
B. Zecchi et al. / Journal of Food Engineering 104 (2011) 49–55

conditions lasted 2540 min for sole convective drying and
1110 min for sole vacuum drying. Therefore, the combined process
saved 63.4% of process time in relation to using convective drying
for the whole process and saved 16.2% of process time in relation to
using vacuum drying for the whole process.
Convective drying was the best technology for mushroom dehy-
dration considering process time and visual appearance of product.
Minimum process time was 342 min when drying fresh mushroom
(X
0
= 92.5% (wb)) in a convective dryer at 55 °C to final moisture
content (7%) (wb) while in a vacuum dryer for the same tempera-
ture and moistures, process time was 1050 min.
4. Conclusions
For vacuum and convective drying during the falling rate peri-
od, a set of simple diffusive models were developed assuming that
diffusion coefficient of water is constant or alternatively consider-
ing that water diffusivity is variable with drying time or Fourier
number (Fo = D
e
t/L
2
). Two different boundary conditions were con-
sidered: a constant equilibrium concentration at the interface for
the overall process and a variable surface concentration depending
on time (Fourier number). This types of models based on Fick’s law,
were successful in predicting convective and vacuum drying pro-
cess of parsley and mushroom. Model 2, obtained for variable dif-
fusion coefficient as function of Fo number resulted in the best
option for modeling convective drying for parsley and mushrooms
for the overall range of temperatures assayed. On the other hand,
Model 3 considering constant effective diffusivity and exponential
variation in time of the surface moisture content was the best op-
tion for modeling vacuum drying for parsley and mushrooms in the
overall range of temperatures assayed. These models were success-
fully used in determining the intermediate moisture for dryer
change in order to minimize and estimate the overall time of the
combined process.
The highest temperature assayed in this study, at which drying
could be performed without appreciable visual damage was 45 °C
for parsley and 55 °C for mushrooms. For parsley, an important
reduction of process time was achieved when convective and vac-
uum drying at the maximum suitable drying temperature (45 °C)
was combined. For mushrooms, when drying was performed at
the maximum temperature the most appropriate technology was
the dehydration process in a convective dryer, because the rever-
sion of the processes’ rates did not occur for this product and
temperature.
Future studies for other products should be carried out in order
to prove greater utility of the combined convective and vacuum
drying process.
Acknowledgements
The authors acknowledge financial support from PDT (Progra-
ma de Desarrollo Tecnológico – Ministerio de Educación y Cultura
– República Oriental del Uruguay).
References
Alvarez, P., Legues, P., 1986. A semi theoretical model for the drying of Thomson
seedless grapes. Drying Technology 4 (1), 1–17.
AOAC, 1990. Official Method of Analysis, 15th ed. Association of Official Analytical
Chemists, Arlington, Virginia.
Askari, G.R., Emam-Djomeh, Z., Mousavi, S.M., 2009. An investigation of the effects
of drying methods and conditions on drying characteristics and quality
attributes of agricultural products during hot air and hot air/microwave-
assisted dehydration. Drying Technology 27 (7), 831–841.
Contreras, C., Martín-Esparza, M.E., Chiralt, A., Martínez-Navarrete, N., 2008.
Influence of microwave application on convective drying: effects on drying
kinetics, and optical and mechanical properties of apple and strawberry. Journal
of Food Engineering 88 (1), 55–64.
Crank, J., 1998. The Mathematics of Diffusion, second ed. Clarendon Press, Oxford,
London.
Cui, Z.-W., Xu, S.-Y., Sun, D.-W., 2003. Dehydration of garlic slices by combined
microwave–vacuum and air drying. Drying Technology 21 (7), 1173–1184.
da Silva, C.K., da Silva, Z.E., Mariani, V.C., 2009. Determination of the diffusion
coefficient of dry mushrooms using the inverse method. Journal of Food
Engineering 95 (1), 1–10.
Doymaz, _I., Tugrul, N., Pala, M., 2006. Drying characteristics of dill and parsley
leaves. Journal of Food Engineering 77 (3), 559–565.
Efremov, G., 2002. Drying kinetics derived from diffusion equation with flux type
boundary conditions. Drying Technology 20 (1), 55–66.
Figiel, A., 2009. Drying kinetics and quality of vacuum–microwave dehydrated
garlic cloves and slices. Journal of Food Engineering 94 (1), 98–104.
Giri, S.K., Prasad, S., 2007a. Optimization of microwave–vacuum drying of button
mushrooms using response-surface methodology. Drying Technology 25 (5),
901–911.
Giri, S.K., Prasad, S., 2007b. Drying kinetics and rehydration characteristics of
microwave–vacuum and convective hot-air dried mushrooms. Journal of Food
Engineering 78 (2), 512–521.
Gothandapani, L., Parvathi, K., John Kennedy, Z., 1997. Evaluation of different
methods of drying on the quality of oyster mushroom (Pleurotus sp.). Drying
Technology 15 (6), 1995–2004.
Jaya, S., Das, S., 2003. A vacuum drying model for mango pulp. Drying Technology
21 (7), 1215–1234.
Kavav Akpinar, E., Bicer, Y., Cetinkaya, F., 2006. Modelling of thin layer drying of
parsley leaves in a convective dryer and under open sun. Journal of Food
Engineering 75 (3), 308–315.
Kotwaliwale, N., Bakane, P., Verma, A., 2007. Changes in textural and optical
properties of oyster mushroom during hot air drying. Journal of Food
Engineering 78 (4), 1207–1211.
Madamba, P., Libbon, F., 2001. Optimization of the vacuum dehydration of celery
(Apium graveolens) using the response surface methodology. Drying Technology
19 (3–4), 611–626.
Markowski, M., Bialobrzewski, I., 1998. Kinetics of vacuum drying of celery. Polish
Journal of Food and Nutrition Sciences 7/48 (4), 707–712.
Martínez-Soto, G., Ocanña-Camacho, R., Paredes-López, O., 2001. Effect of
pretreatment and drying on the quality of oyster mushrooms (pleurotus
ostreatus). Drying Technology 19 (3), 661–672.
Mujumdar, A., 1995. Handbook of Industrial Drying, second ed. Marcel Dekker Inc.,
NY.
Ratti, C., 2001. Hot air and freeze-drying of high-value foods: a review. Journal of
Food Engineering 49 (4), 311–319.
Reyes, A., Alvarez, P., Marquardt, F., 2002. Drying of carrots in a fluidized bed: I.
Effect of drying conditions and modelling. Drying Technology 20 (7), 1463–
1483.
Rodríguez, R., Lombraña, J.I., Kamel, M., de Elvira, C., 2005. Kinetic and quality study
of mushroom drying under microwave and vacuum. Drying Technology 23 (9),
2197–2213.
Sharma, G.P., Prasad, S., 2001. Drying of garlic (Allium sativum) cloves by
microwave–hot air combination. Journal of Food Engineering 50 (2), 99–105.
Walde, S.G., Velu, V., Jyothirmayi, T., Math, R.G., 2006. Effects of pretreatments and
drying methods on dehydration of mushroom. Journal of Food Engineering 74
(1), 108–115.
Xanthopoulos, G., Lambrinos, Gr., Manolopoulou, H., 2007. Evaluation of thin-layer
models for mushroom (Agaricus bisporus) drying. Drying Technology 25 (9),
1471–1481.
B. Zecchi et al. / Journal of Food Engineering 104 (2011) 49–55
55
Document Outline
- Modeling and minimizing process time of combined convective and vacuum drying of mushrooms and parsley
Wyszukiwarka
Podobne podstrony:
Electron ionization time of flight mass spectrometry historical review and current applications
UTC?te and time of solstices and equinoxes
02 Modeling and Design of a Micromechanical Phase Shifting Gate Optical ModulatorW42 03
Describe the role of the dental nurse in minimising the risk of cross infection during and after the
PROPAGATION MODELING AND ANALYSIS OF VIRUSES IN P2P NETWORKS
Preparation of garlic powder with high allicin content by using combined microwave–vacuum and vacuum
Modeling And Simulation Of ATM Networks
The Power Circuit Maximizing Strength and Power While Minimizing Training Time
Multiscale Modeling and Simulation of Worm Effects on the Internet Routing Infrastructure
Sean Michael Handcuffs and Lace In Time Of Need
Modeling and tool wear in drilling of CFRP
0415455065 Routledge Terrorism and the Politics of Response London in a Time of Terror Nov 2008
Modelling vacuum and convective dehydration of Vegetables (Patricia Gerla, Jorge Martínez Garreiro)
Thin layer modelling of the convective, microwave, microwave convective and microwave vacuum drying
Modeling and Control of an Electric Arc Furnace
Dehydration of Carrots by a Combination of Freeze Drying, Microwave Heating and Air or Vacuum Drying
więcej podobnych podstron