
Proceedings of the Seventh International Conference on Machine Learning and Cybernetics, Kunming, 12-15 July 2008
978-1-4244-2096-4/08/$25.00 ©2008 IEEE
3635
PROPAGATION MODELING AND ANALYSIS OF VIRUSES
IN P2P NETWORKS
CHAO-SHENG FENG
1,3
, ZHI-GUANG QIN
1
, LAURENCE CUTHBET
2
, LAURISSA TOKARCHUK
2
1
School of Computer Science &Engineering,University of Electronic Science and Technology of China, Chengdu Sichuan
610054,China
2
Department of the Electronic Engineering, Queen Mary, University of London, London E1 4NS
3
School of Computer Science, Sichuan Normal University, Chengdu Sichuan 610068, China
E-MAIL: csfenggy@126.com
Abstract:
To counter the attacks of virus in P2P file-sharing networks,
the model of virus propagation in P2P networks is proposed
based on deep analysis on the features of file sharing and virus
propagation. In order to examine the effects of different
parameters in this model, large scale simulating experiments
are carried out. The numerical analysis on the impact of
P2P-relatedfactors such as number of initially infected peers,
downloading rate, recovery rate, etc, shows that attack
performance of viruses is very sensitive to P2P system
parameters.
Keywords:
Viruses; Propagation modeling; P2P networks; File-sharing;
Simulation
1. Introduction
Millions of Internet users are using large-scale
peer-to-peer (P2P) networks to share content files today[1].
The widely-deployed P2P systems used by end users,
however, have strong security implications. First, the users
may have downloaded files embedded with malicious code.
Second, the P2P client software may contain vulnerabilities
that could be exploited by attackers. In particular, P2P
systems often have homogeneous client implementation.
For example, a recent study found that more than 75%
Gnutella clients run the same software [2]. A single
implementation weakness of a commonly used P2P client
thus results in a large vulnerable population. This situation
is attractive for adversaries to exploit the P2P networks
using Internet worms, which can automatically propagate
through the network using a single vulnerability without
human intervention. The compromised P2P nodes may be
used to capture end users’ sensitive information or be used
for further attacks, such as Distributed Denial of Service
(DDoS) [3].
In this paper we examine the behavior of viruses in P2P
networks. We adopt the epidemiological approach to
develop a dynamic model to describe the evolution of
infection. We consider the stochastic nature of the system
during our development of the model, but our models are
deterministic and focus on the expected behavior of the
system. This paper contributes as follows.
1) Propose a model of virus propagation, which can be
used to predict virus behaviors.
2) Use the numerical analysis tool, Matlab Simulink,
to analyze the effects of P2P system parameters on
virus propagation.
The rest of this paper is organized as follows. We simply
introduce the existing studies of virus propagation in
Section 2. In Section 3, we present a model of virus
propagation. In Section 4, we examine the effects of P2P
system parameters with simulation experiments. Finally
we conclude our work and point out the future works in
Sections 5.
2. Background
2.1. Existing modeling work on viruses
The advent of mathematical Epidemiology – the field of
biology which models how diseases spread in a population
– is generally credited to McKendrick and his seminal 1926
paper [4]. Previous work in applying epidemiology to
modeling how computer viruses and other malware spread
between machines dates back to the early 1990s: Kephart
and White published a paper [5] on the topic in 1991. More
recently, several authors have utilized epidemiological
models to study the spread of worms[6] and e-mail viruses
in the Internet [7]. There have been a number of recent
papers which model file propagation in P2P networks. Two
Authorized licensed use limited to: Queen Mary University of London. Downloaded on April 10, 2009 at 06:11 from IEEE Xplore. Restrictions apply.

Proceedings of the Seventh International Conference on Machine Learning and Cybernetics, Kunming, 12-15 July 2008
3636
notable examples include a 2005 paper by Dumitriu et al. [8]
which models the spread of polluted files in P2P
networks,and a 2004 paper by Qiu and Srikant [9] which
models the performance of the BitTorrent P2P protocol.
R.W. Thommes and M.J. Coates model the virus
propagation and the pollution file spreading, respectively, in
a 2005 paper[10].
2.2. Key features of p2p file-sharing networks
This section highlights the key features shared by
popular P2P Networks, including Kazaa, eDonkey2000,
and Gnutella [11]. Every peer connected to the network has
a shared folder containing all the files the user wishes to
make publicly available for download by others on the
network. When a user wants to download a file, he begins
by sending out a search request. Eventually he will receive
back a list of files matching the search criteria. The specific
manner in which this list is generated varies among the
various P2P networks, but in all cases the query response is
the result of the examination of the shared folders of a
subset of all peers connected to the network. Once the user
elects to download one of the files from the list, his client
attempts to set up a connection to a peer sharing the file and
begins receiving the file. Depending on the specific
network, the client may attempt to simultaneously
download different parts of the file from a number of peers
in order to expedite the operation. P2P clients typically save
new downloaded files in the shared folder – making them
immediately available to other users.
A number of viruses that exploit P2P networks have
already surfaced. The majority of these behave in a similar
fashion. Specifically, when a user downloads a file
containing the virus and executes it, a number of new files
containing the virus are created and placed in the client’s
shared directory. Some types of viruses, including Achar
[12] and Gotorm [13], generate a fixed list of filenames
when executed. More advanced viruses, such as Bare [14]
and Krepper [15], randomly pick the list of filenames from
a large pool of candidates.
3. P2P virus propagation models
The intent of our model is to predict the expected
behavior of a virus which spreads through a P2P network in
the form of malicious code embedded in executable files
shared by peers. Note that we use the term user in this paper
to refer to a person using a P2P client program. The term
peer is used to collectively refer to a P2P client and the user
directing its behavior.
This model classifies all peers as falling into one of three
classes: Susceptible, Exposed, or Infected.
Susceptible: Peers that are not sharing any infected files,
but are at risk of downloading infected files. The number of
peers in this category at time t is denoted by S(t).
Exposed: Peers that have downloaded one or more infected
files, but have not executed them. The number of peers in
this category at time t is denoted by E(t).
Infected: Peers that have executed an infected file. Upon
execution, a total of c infected files reside in the peer’s
shared folder. The number of peers in this category at time t
is denoted by I(t).
3.1. Model parameters and assumptions
Table 1: Notations in Models
N(t)
Number of all peers in the P2P network at time unit
t, here it is a constant. N(0)=50100.
S(t)
Number of susceptible peers at time unit t.
S(0)=50000.
I(t)
Number of infected peers at time unit t. S(0)=50.
E(t)
Number of exposed peers at time unit t. R(0)=50.
K(t)
Number of infected files at time unit t. K(0)=500.
M(t) Number of uninfected files at time unit t.
M(0)=100200.
h(t)
Probability of downloading an infected file at time
unit t,
)
(
)
(
)
(
)
(
t
K
t
M
t
K
t
h
+
=
.
s
λ
Average rate, in files per time unit, at which each
peer downloads new files.
01
.
0
=
s
λ
.
e
λ
Average rate, in peers per time unit, at which
infected peers return to be susceptible.
01
.
0
=
e
λ
.
r
λ
Average rate, in recoveries per time unit, at which
infected peers recover. A recovery occurs when all
infected files are removed, returning the peer state to
Susceptible.
001
.
0
=
r
λ
.
ei
p
Probability, at which an infected file on exposed
peers is successfully executed.
5
.
0
=
ei
p
.
c
When an infected file is successfully executed, c
infected files are generated in the file-sharing folder.
c=10.
For the purpose of simplifying analysis, we make the
assumptions as follows.
1) Each user put all files, which can be downloaded by
others, to his/her shared folder. And all users download
Authorized licensed use limited to: Queen Mary University of London. Downloaded on April 10, 2009 at 06:11 from IEEE Xplore. Restrictions apply.
Proceedings of the Seventh International Conference on Machine Learning and Cybernetics, Kunming, 12-15 July 2008
3637
files to their shared folder. Peers online refer to those P2P
clients which are running.
2) The number of peers online is invariable. In this
situation, no peers added or exited, and no new files are
added.
3) Time spent on statuses transition by any peer, is
invariable, which is call as a time unit.
4) When a peer is infected, c infected files reside the
peer’s shared folder and have c different names. All
infected peers share the same c infected files.
We are not concerned with the transfer of media files
which cannot contain malicious code, and do not model
them.
In order to formally analyze attack strategies and
epidemiological modeling of P2P viruses, we list the most
parameters in table 1, which will have an impact on virus
attack effects.
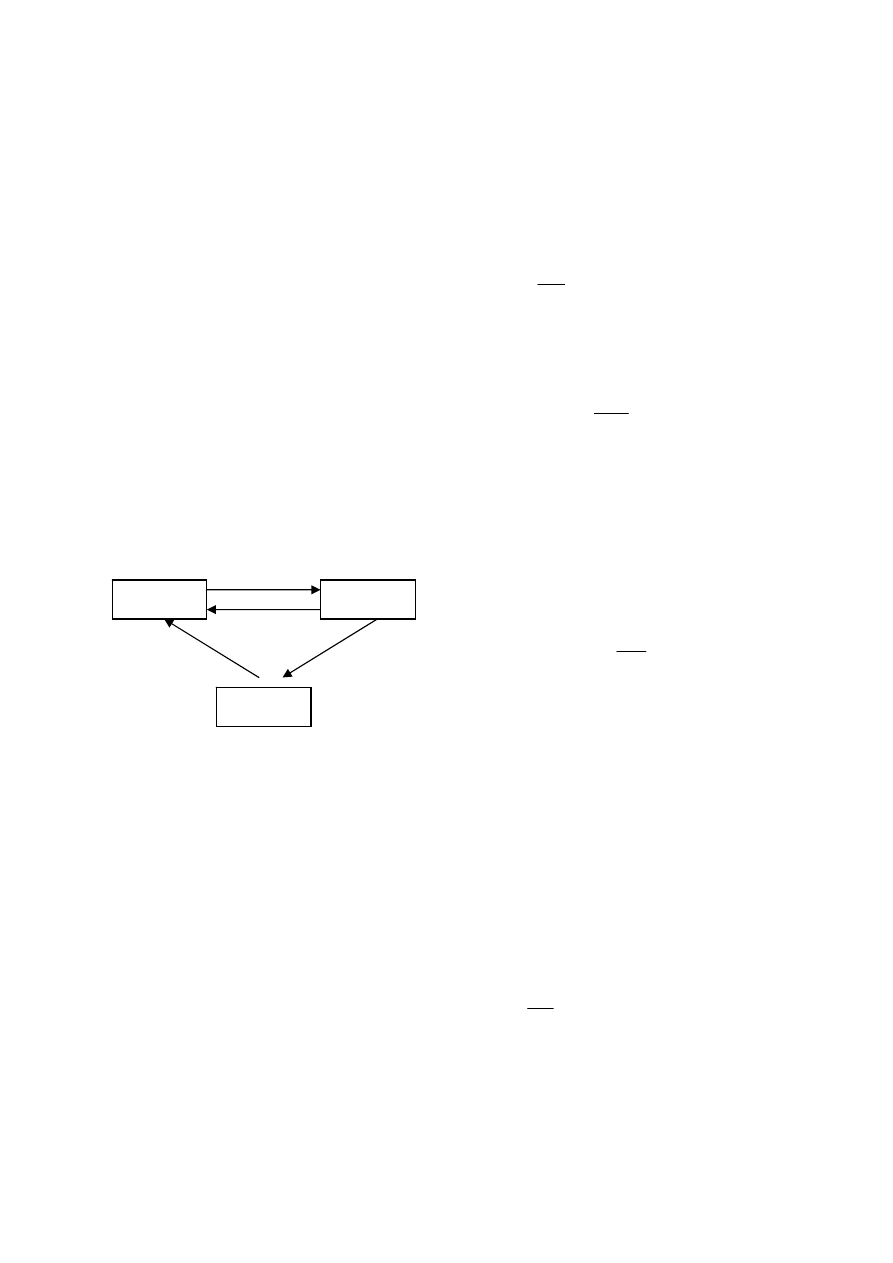
3.2. State transition of peers
Figure 1 State transitions of a peer
The following is the description of state transitions of a peer:
①
: Download an infected file.
②
:Fail to execute an infected file(at probability
ei
p
−
1
)
.
③
:Successfully execute an infected file(at probability
ei
p
)
④
:Delete all infected files.
3.3. Model of virus propagation
(1) Rate at which number of susceptible peers change
In a time unit, a susceptible peer downloads
d
λ
files,
while the probability of infected files downloaded is
)
(t
h
,
so the probability of a susceptible peer becoming exposed
is
)
(t
h
d
λ
. Thus, there are
)
(
)
(
t
S
t
h
d
λ
susceptible peers
which become exposed. At the same time, an exposed peer
fails to execute an infected file at probability of
ei
p
−
1
,i.e.
there are
)
1
)(
(
ei
e
p
t
E
−
λ
exposed peers returning to
susceptible. In addition, a portion of infected peers recovers
in a time unit. Recoveries occur at rate
)
(t
I
r
λ
.
Therefore, the overall changing rate of S(t) is :
(1)
)
1
)(
(
)
(
)
(
)
(
)
(
ei
e
r
s
p
t
E
t
I
t
h
t
S
dt
t
dS
−
+
+
−
=
λ
λ
λ
(2) Rate at which number of Exposed peers change
The rate at which the number of exposed peers increases
is the negative of the first term in (1). The rate at which
previously exposed peers become susceptible or infected is
)
(t
E
e
λ
. The overall rate is therefore:
( )
( ) ( )
( )
s
e
dE t
S t h t
E t
dt
λ
λ
=
−
(2)
(3)Rate at which number of infected peers change
When an infected peer recovers, the number of infected
peers decreases by one. Recoveries occur at rate
)
(t
I
r
λ
.
When an exposed peer successfully executes an infected
file, the number of infected peers increases by one. Since an
infected file is successfully executed at probability
ei
p
and the proposition of exposed peers executing infected
files is
e
λ
, the number of exposed peers becoming
infected is
ei
e
p
t
E )
(
λ
in an time unit. Therefore, the
changing rate of the number of infected peers is:
(3)
)
(
)
(
)
(
t
I
p
t
E
dt
t
dI
r
ei
e
λ
λ
−
=
(4) Rate at which number of infected files in the network
changes
There are four events which result in a change in the
number of infected files in the network: a peer downloads
an infected file, an exposed peer becomes infected, an
exposed peer returns to be susceptible, and an infected peer
recovers. The changing rate due to downloads is
)
(
)
(
t
h
t
S
s
λ
. An exposed peer always has one infected file
before becoming infected, meaning in all cases c − 1 new
infected files are created when an exposed peer becomes
infected. he changing rate is thus
)
1
(
)
(
−
c
p
t
E
ei
e
λ
. If
the infected file on an exposed peer is unsuccessfully
executed, the file will be deleted and the peer will return to
susceptible.The changing rate is
)
1
)(
(
ei
e
p
t
E
−
−
λ
. An
infected peer will always share c files, so a recovery results
in a reduction of c infected files. The rate is therefore
c
t
I
r
)
(
λ
−
. The overall changing rate of K(t) is therefore:
(4)
)
(
)
1
)(
(
)
1
(
)
(
)
(
)
(
)
(
c
t
I
p
t
E
c
p
t
E
t
h
t
S
dt
t
dK
r
ei
e
ei
e
s
λ
λ
λ
λ
−
−
−
−
+
=
(5) Rate at which number of uninfected files in the network
changes
Because the probability of downloading infected files is
)
(t
h
, so the probability of downloading uninfected file is
Susceptible
Exposed
Infected
①
②
③
④
Authorized licensed use limited to: Queen Mary University of London. Downloaded on April 10, 2009 at 06:11 from IEEE Xplore. Restrictions apply.
Proceedings of the Seventh International Conference on Machine Learning and Cybernetics, Kunming, 12-15 July 2008
3638
)
(
1
t
h
−
. Therefore, the overall changing rate of M(t) is:
(5)
))
(
1
)(
(
t
h
t
N
dt
dM(t)
s
−
=
λ
According to the analysis above, the model of viruses in
P2P networks is as follows.
)
(
)
(
)
(
)
(
Where
(6)
)
(
)
(
)
(
)
(
(5)
))
(
1
)(
(
(4)
)
(
)
1
)(
(
)
1
(
)
(
)
(
)
(
)
(
(3)
)
(
)
(
)
(
(2)
)
(
)
(
)
(
)
(
(1)
)
1
)(
(
)
(
)
(
)
(
)
(
t
K
t
M
t
K
t
h
t
I
t
E
t
S
t
N
t
h
t
N
dt
dM(t)
c
t
I
p
t
E
c
p
t
E
t
h
t
S
dt
t
dK
t
I
p
t
E
dt
t
dI
t
E
t
h
t
S
dt
t
dE
p
t
E
t
I
t
h
t
S
dt
t
dS
s
r
ei
e
ei
e
s
r
ei
e
e
s
ei
e
r
s
+
=
+
+
=
−
=
−
−
−
−
+
=
−
=
−
=
−
+
+
−
=
λ
λ
λ
λ
λ
λ
λ
λ
λ
λ
λ
λ
4.Simulations and analysis
4.1.Simulation description
In order to verify the validity of these models proposed
in this paper and examine the effects of P2P system
parameters, we carried out simulation experiments with
Simulink, an important component of the software Matlab.
The simulator first initializes various components, such as
the number of nodes and files. Almost all the nodes are
initialized to be susceptible and only quit a few nodes are
initialized to be infected.
In the next sections, we study how the virus propagates
under different parameters. In order to examine the effect of
some parameter, we put the results corresponding to varied
values of the parameter on the same plot. We summarize
common simulation parameters in Table 1, and we set the
default values of some parameters and variables. All
simulations use the default values in table 1 except for the
parameter being varied by individual.
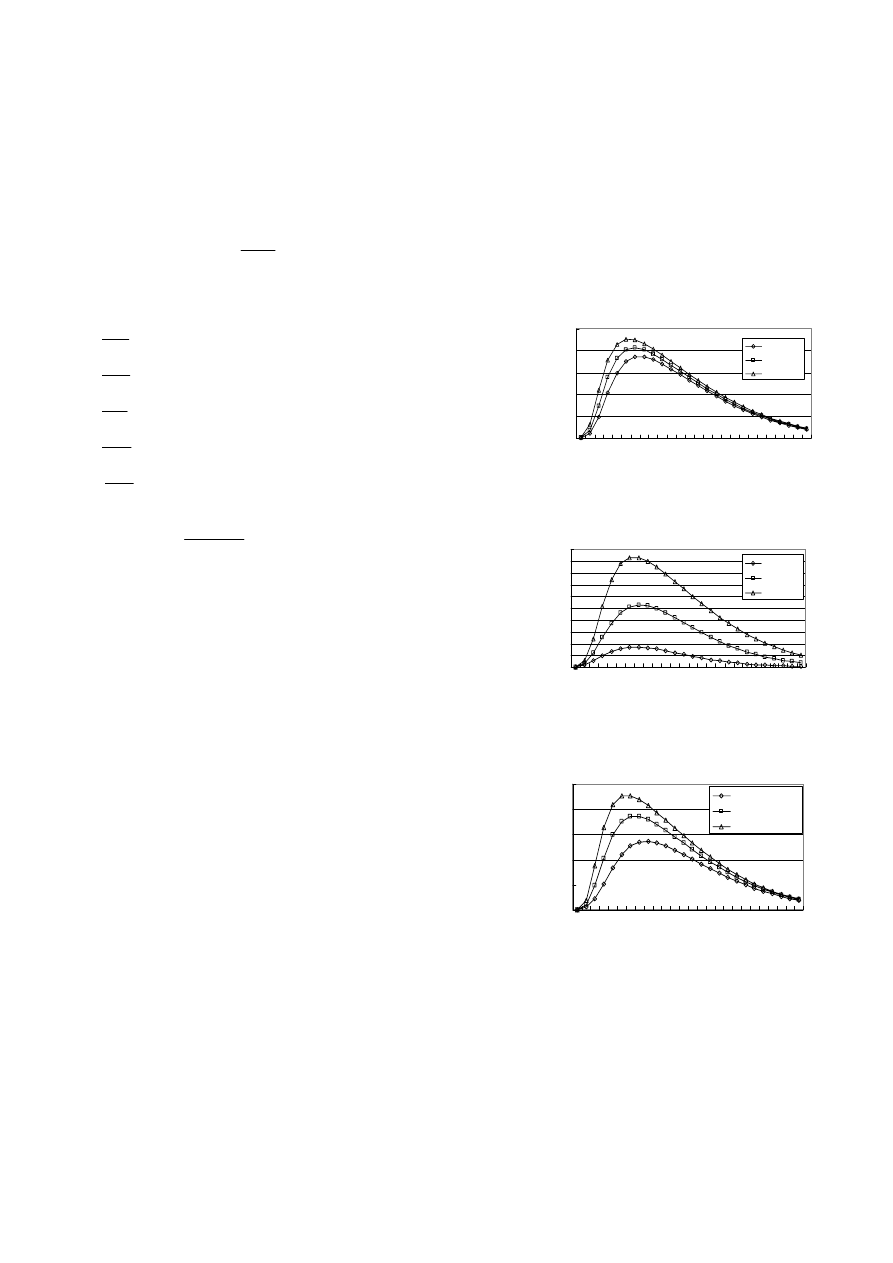
4.2 Analysis on simulation results
In figure 2-4, we examine the effects of varying the
initial extent of infection, varying probability of
successfully executing an infected file, and the varying
proportion of exposed peers executing infected files on the
evolution of the prevalence of infected peers in the network,
respectively. Figure 2-4 show that the more the initial
infected peers are and the bigger the probability of
successfully executing an infected file and the proportion of
exposed peers executing infected files are, the faster the
infectious prevalence rises and the sooner the prevalence
arrives at the peak. Note that for any one of the three
parameters, whatever its value is, the time when viruses
exist in the network is almost same.
0
5000
10000
15000
20000
25000
0
80
0
1600 2400 3200 4000 4800 5600 6400 7200 8000 8800 96
00
Time(time units)
Numb
ers o
f infe
cted
peers
I(0)=50
I(0)=100
I(0)=200
Figure 2: Comparison of infectious prevalence with
different I(0)
0
2000
4000
6000
8000
10000
12000
14000
16000
18000
20000
0
80
0
1600 240
0
3200 4000 48
00
5600 64
00
72
00
800
0
8800 960
0
Time(time units)
Nu
mbe
r o
f i
nfe
cte
d p
eer
s
P_ei=0.3
P_ei=0.4
P_ei=0.5
Figure 3: Comparison of infectious prevalence with
different
ei
p
0
5000
10000
15000
20000
25000
0
80
0
16
00
24
00
32
00
40
00
48
00
56
00
64
00
72
00
80
00
88
00
96
00
Time(time units)
Num
ber
of
i
nfe
cte
d p
ee
rs
lamda_e=0.005
lamda_e=0.01
lamda_e=0.02
Figure 4: Comparison of infectious prevalence with
different
e
λ
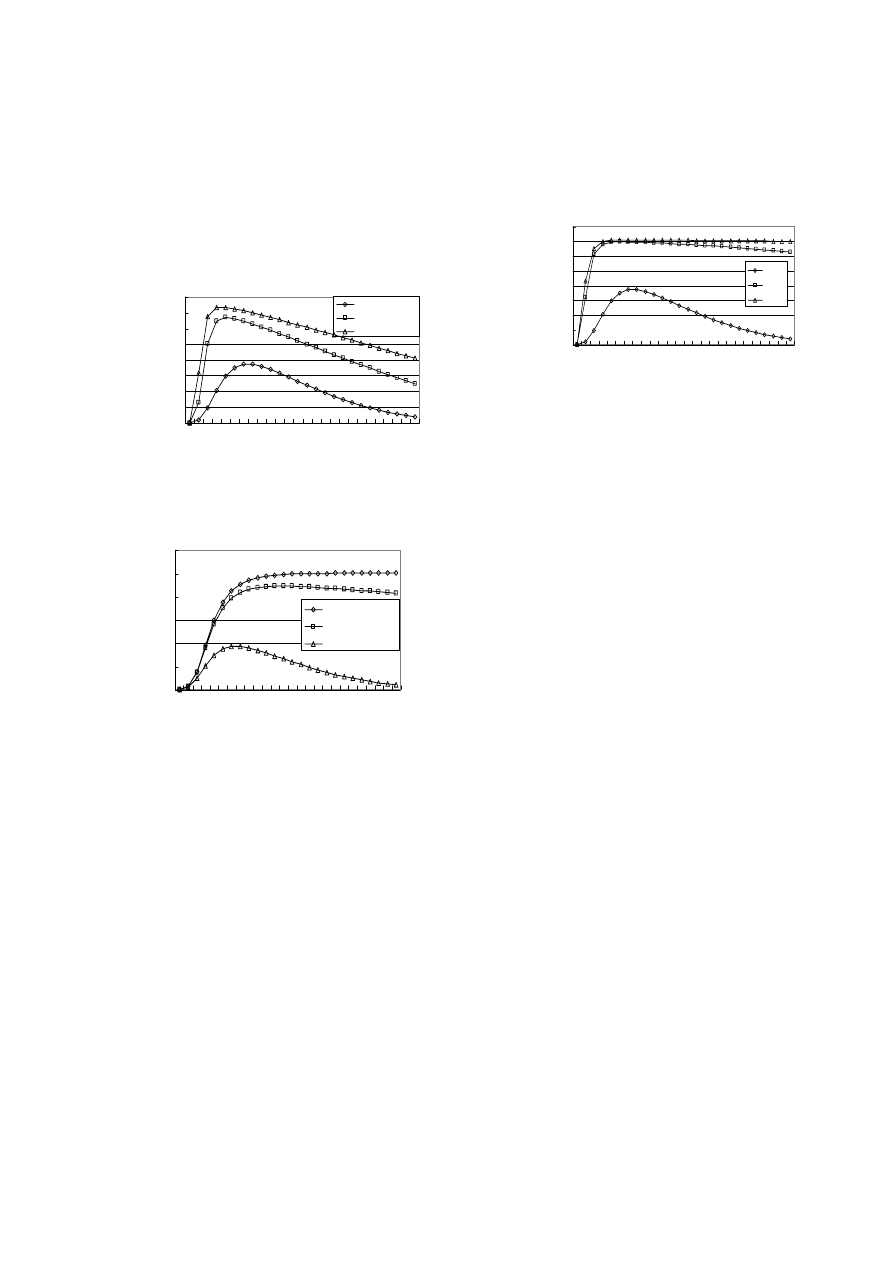
Figure 5-6 examine the effects of different
downloading rate and recovery rate on the evolution of
the prevalence of infected peers. Figure 5-6 shows that
the bigger the downloading rate is and the smaller the
Authorized licensed use limited to: Queen Mary University of London. Downloaded on April 10, 2009 at 06:11 from IEEE Xplore. Restrictions apply.
Proceedings of the Seventh International Conference on Machine Learning and Cybernetics, Kunming, 12-15 July 2008
3639
recovery rate is, the faster the infectious prevalence
rises and the sooner the prevalence arrives at the peak.
By contrast to figure 2-4, the time when viruses bring
effects on the network is different.
0
5000
10000
15000
20000
25000
30000
35000
40000
0
80
0
16
00
24
00
32
00
40
00
48
00
56
00
64
00
72
00
80
00
88
00
96
00
Time(time units)
N
umber of infecte
d peers
lamda_s=0.01
lamda_s=0.02
lamda s=0.03
Figure 5: Comparison of infectious prevalence with
different
s
λ
0
10000
20000
30000
40000
50000
60000
0
80
0
16
00
24
00
32
00
40
00
48
00
56
00
64
00
72
00
80
00
88
00
96
00
Time(time units)
Nu
mb
er
o
f
in
fe
ct
ed
p
e
er
s
lamda_r=0
lamda_r=0.0001
lamda_r=0.001
Figure 6: Comparison of infectious prevalence with
different
r
λ
Intuitively, the more malicious files a virus can generate
and the more popular their file names are, the more likely
other users will download these files and become infected.
Figure 7 confirms that the virus spreads faster with larger c
and reaches higher peak prevalence. As a reality check, the
Sanker virus that creates about 20 malicious files in
Kazaa’s shared directory had less than 50 infection reports
by Symantec. On the other hand, the Benjamin virus that
creates and shares about 2000 malicious files reportedly
infected more than 1000 nodes.
0
5000
10000
15000
20000
25000
30000
35000
40000
0
80
0
16
00
24
00
32
00
40
00
48
00
56
00
64
00
72
00
80
00
88
00
96
00
Time(time units)
Numb
er o
f inf
ecte
d
p
ee
rs
c=10
c=50
c=100
Figure 7: Comparison of infectious prevalence with
different c
According to the analysis on the result of simulation
experiments, it is easy to find that we can throttle the virus
propagation by means of controlling such parameters as
ei
p
and
s
λ
. The parameter
ei
p
is close related to whether
the peer has updated anti-virus software or is aware of the
common characteristics of virus files. Users must try their
best to use the newest version of anti-virus software, the
parameter
ei
p
thus becomes bigger. Because the bigger
the parameter
s
λ
is,
the longer the virus brings effects on
the P2P network, so when the virus becomes prevalent, we
must take efforts to reduce the downloading rate so as to
contain virus propagation.
5. Conclusions
In this paper, we aim at modeling P2P virus propagation.
Firstly, the related work is briefly reviewed and the features
of P2P file-sharing networks are addressed. And then we
deeply analyze the process of state transition of a peer in
P2P networks. Based on the analysis, a dynamic model to
describe the evolution of infection is proposed by adopting
the epidemiological approach. In order to examine the
effects of different parameters in this model, large scale
simulating experiments are carried out. The numerical
analysis on the impact of P2P-relatedfactors such as
number of initially infected peers, downloading rate,
recovery rate, etc, shows that attack performance of viruses
is very sensitive to P2P system parameters and the P2P
virus can be throttled by controlling such parameters as the
downloading rate. The future work will focus on improving
these models to make them to be valid in condition of
variable network size, peers adding or leaving, and new
files adding.
Authorized licensed use limited to: Queen Mary University of London. Downloaded on April 10, 2009 at 06:11 from IEEE Xplore. Restrictions apply.

Proceedings of the Seventh International Conference on Machine Learning and Cybernetics, Kunming, 12-15 July 2008
3640
Acknowledgements
The author would like to thank the anonymous
reviewers for their valuable comments and suggestions that
improve the presentation of this paper. This work is
supported by the National Natural Science Foundation of
China under Grant No.60473090 and a joint research
project funded by the Royal Society in the UK and by the
National Natural Science Foundation of China (NSFC)
under Grant No.60711130232. This work is also supported
by the important project of Sichuan Normal University of
China under Grant No.07ZD018.
References
[1] S. Staniford, V. Paxson, and N.Weaver. How to Own
the Internet in Your Spare Time. In Proceedings of the
11th USENIX Security Symposium, San Francisco,
CA, Aug.2002.
[2] D. Stutzbach, R. Rejaie, and S. Sen. Characterizing
unstructured overlay topologies in modern P2P
file-sharing systems. In Proceedings of the Fifth ACM
Internet Measurement Conference, pages 49–62,
Berkeley, CA, Oct.2005.
[3] Guanling Chen, Robert S. Gray. Simulating
non-scanning worms on peer-to-peer networks. In
Proceedings of the 1st international conference on
Scalable information systems, Hong Kong, China,
2006.
[4] A.G. McKendrick, “Applications of mathematics to
medical problems,”Proc. Edinb. Math. Soc., vol. 44,
pp. 98–130, 1926.
[5] J.O. Kephart and S.R. White, “Directed-graph
epidemiological models of computer viruses,” in Proc.
IEEE Symp. Security and Privacy,Oakland, CA, May
1991.
[6] C.C. Zou, W. Gong, and D. Towsley, “Code red worm
propagation modeling and analysis,” in Proc. ACM
Conf. Computer and Comm.Soc., Washington DC,
Nov. 2002.
[7] M. Liljenstam, Y. Yuan, B. Premore, and D. Nicol,
“Email worm modeling and defense,” in Proc. IEEE
Int. Symp. MASCOTS, Fort Worth,TX, Oct. 2002.
[8] D. Qiu and R. Srikant, .Modeling and performance
analysis of BitTorrent-like peer-to-peer
networks..Proceedings of ACM SIGCOMM,Portland,
OR, August 2004.
[9] D. Dumitriu, E. Knightly, A. Kuzmanovic, I. Stoica,
and W. Zwaenepoel, “Denial-of-service resilience in
peer-to-peer file-sharing systems,” in Proc. ACM
Sigmetrics, Banff, Canada,June 2005.
[10] R.W. Thommes and M.J. Coates, .Modeling Virus
Propagation in Peer-to-Peer Networks,. Technical
Report, Department of Electrical and Computer
Engineering, McGill University, June, 2005.
[11] D. Stutzbach, R. Rejaie, and S. Sen. Characterizing
unstructured overlay topologies in modern P2P
file-sharing systems. In Proceedings of the Fifth ACM
Internet Measurement Conference, pages 49–62,
Berkeley, CA, Oct.2005.
[12] Viruslist.com, “P2p-worm.win32.achar.a,”
http://www.viruslist.com/en/viruses/encyclopedia?viru
sid=23893, May 2003.
[13] Symantec, “W32.hllw.gotorm,”
http://securityresponse.symantec.com/avcenter/venc/d
ata/w32.hllw.gotorm.html,August 2003.
[14] Viruscan, “W32/bare.worm,”
http://www.virus-scan-software.com/latest-virus-softw
are/latest-viruses/w32bare-worm.shtml,2003.
[15] Sophos, “Sophos virus analysis: Troj/krepper-g,”
http://www.sophos.com/virusinfo/analyses/trojkrepper
g.html, July 2004.
Authorized licensed use limited to: Queen Mary University of London. Downloaded on April 10, 2009 at 06:11 from IEEE Xplore. Restrictions apply.
Wyszukiwarka
Podobne podstrony:
Code Red Worm Propagation Modeling and Analysis
Worm Propagation Modeling and Analysis under Dynamic Quarantine Defense
Email Virus Propagation Modeling and Analysis
Analysis of chlorobenzenes in soils by HS SPME and GC MS
Oedipus Rex Analysis of Bliss in Ignorance and Socratic Vi doc
Guide to the properties and uses of detergents in biology and biochemistry
Doll's House, A Interpretation and Analysis of Ibsen's Pla
02 Modeling and Design of a Micromechanical Phase Shifting Gate Optical ModulatorW42 03
extraction and analysis of indole derivatives from fungal biomass Journal of Basic Microbiology 34 (
improvment of chain saw and changes of symptoms in the operators
[41]Hormesis and synergy pathways and mechanisms of quercetin in cancer prevention and management
Death of a Salesman Breakdown and Analysis of the Play
Crucible, The Analysis of Struggles in the Play
Frankenstein Analysis of Society in the Novel
Guide to the properties and uses of detergents in biology and biochemistry
Mathematica package for anal and ctl of chaos in nonlin systems [jnl article] (1998) WW
The Rights And Duties Of Women In Islam
Speculations on the Origins and Symbolism of Go in Ancient China
więcej podobnych podstron