
Demystifying
Six Sigma
9872 Demystifying Six Sigma 2/22/03 8:52 PM Page i

This page intentionally left blank

American Management Association
New York • Atlanta • Brussels • Buenos Aires • Chicago • London • Mexico City
San Francisco • Shanghai • Tokyo • Toronto • Washington, D. C.
Demystifying
Six Sigma
A Company-Wide Approach to
Continuous Improvement
Alan Larson
9872 Demystifying Six Sigma 2/22/03 8:52 PM Page iii

This publication is designed to provide accurate and authoritative
information in regard to the subject matter covered. It is sold with the
understanding that the publisher is not engaged in rendering legal,
accounting, or other professional service. If legal advice or other ex-
pert assistance is required, the services of a competent professional
person should be sought.
Library of Congress Cataloging-in-Publication Data
Larson, Alan.
Six sigma demystified : a company-wide approach to continuous
improvement / Alan Larson.
p.
cm.
Includes bibliographical references and index.
ISBN 0-8144-7184-6
1. Total quality management. 2. Six sigma (Quality control standard)
3. Customer services—Quality control. I. Title.
HD62.15 .L372 2003
658.4'013—dc21
2002152003
© 2003 Alan Larson.
All rights reserved.
Printed in the United States of America.
This publication may not be reproduced,
stored in a retrieval system,
or transmitted in whole or in part,
in any form or by any means, electronic,
mechanical, photocopying, recording, or otherwise,
without the prior written permission of AMACOM,
a division of American Management Association,
1601 Broadway, New York, NY 10019.
Printing number
10
9
8
7
6
5
4
3
2
1
Special discounts on bulk quantities of AMACOM books are
available to corporations, professional associations, and other
organizations. For details, contact Special Sales Department,
AMACOM, a division of American Management Association,
1601 Broadway, New York, NY 10019.
Tel.: 212-903-8316.
Fax: 212-903-8083.
Web Site: www.amacombooks.org
9872 Demystifying Six Sigma 2/22/03 8:52 PM Page iv

v
Preface
ix
S
ECTION
O
NE
: T
HE
B
ASICS OF
S
IX
S
IGMA
1
Chapter 1
The Grass Roots of Six Sigma
7
Why It Had to Be Invented
7
The Birth of Six Sigma
9
Black Belts and Green Belts
13
The Required Components
17
Notes
18
Chapter 2
Creating the Cultural Structure
19
Senior Management Roles and Engagement
19
Organizational Development
23
Requirements for Change
27
Note
31
Chapter 3
Preliminary Tasks
32
What Do You Want?
32
Selecting Projects
34
Collecting Data
37
Identifying Required Teams
37
C O N T E N T S
9872 Demystifying Six Sigma 2/22/03 8:52 PM Page v

vi
C
O N T E N T S
S
ECTION
T
WO
: A S
IX
S
IGMA
C
ONTINUOUS
I
MPROVEMENT
T
EAMING
M
ODEL
39
Chapter 4
Step 1: Create the Operational Statement
and Metric
49
Operational Statement
49
Internal and External Defects
53
Metric 57
Variable Data
58
Attribute Data
60
Creating the Metric
63
Chapter 5
Step 2: Define the Improvement Teams
68
Identifying the Required Teams
68
Pareto Diagram
69
Staffing the Teams
73
Determining Required Skills and Knowledge
78
Roles and Responsibilities
78
Rules of Conduct
82
Notes
86
Chapter 6
Step 3: Identify Potential Causes
87
Flowcharting
87
Brainstorming
99
Fishbone Diagram
103
Prioritizing
105
Chapter 7
Step 4: Investigation and Root
Cause Identification
108
Action Plan
108
Check Sheet
112
Stratification
122
Histogram
126
Scatter Diagram
130
9872 Demystifying Six Sigma 2/22/03 8:52 PM Page vi

Chapter 8
Step 5: Make Improvement Permanent
138
Institutionalization
138
Work Method Change
142
Physical Change
142
Procedural Change
145
Training
145
Notes
148
Chapter 9
Step 6: Demonstrate Improvement
and Celebrate
149
Back to Focused Metric
149
Success of the Enterprise
151
Team Recognition
153
S
ECTION
T
HREE
: G
ETTING
S
TARTED
157
Chapter 10
Start Your Journey
159
Do Something
159
The Fallacy of Zero Defects
160
First Steps
163
Before and After
169
Chapter 11
Managing Change
170
Overview
170
Leadership
172
Participation
172
Training
175
A Six Sigma Change Management Model
175
Your Six Sigma Journey
181
Notes
181
Index
183
C
O N T E N T S
vii
9872 Demystifying Six Sigma 2/22/03 8:52 PM Page vii

9872 Demystifying Six Sigma 2/22/03 8:52 PM Page viii
This page intentionally left blank

ix
I was one of the original divisional quality directors at Mo-
torola chartered with developing, training, and deploying
the culture and methods of Six Sigma. We were able to re-
duce costs, improve efficiencies, and maximize customer
satisfaction in all operations. Within the manufacturing
operations, we reduced the cost of sales by 30 percent. In
administrative and service functions, we reduced cycle
times and cost by as much as 90 percent. In 1990 and 1991
our division was used as the internal benchmark for service
and administrative quality.
This success was based on creating a Six Sigma culture in
which goals and objectives were clearly defined and com-
municated, the creation of a six-step continuous improve-
ment model utilizing the JUSE (Japanese Union of
Scientists and Engineers) seven problem-solving tools, and
the effective management of the change. This book is writ-
ten so that others can learn and apply these techniques.
This book consists of three sections. Section One is about
how to identify the need for a Six Sigma program and how
to establish a Six Sigma culture. Section Two teaches a prag-
matic six-step continuous improvement model. This con-
tinuous improvement model can be learned and used by all
employees in manufacturing, administration, and service
operations. Section Three presents methods for managing
P R E F A C E
9872 Demystifying Six Sigma 2/22/03 8:52 PM Page ix

the change and a guide on what to expect during the phases
of implementation.
Benefits to the Reader
❑ How to establish a Six Sigma culture
❑ A simple and practical continuous improvement
model
❑ How to manage the change required for Six Sigma
This book is beneficial to all who are interested in im-
proving their performance and the performance of the
enterprise for which they work.
The first section will be most helpful to managers and
leaders—those who must define and create the Six Sigma–
based culture that will nurture a successful Six Sigma pro-
gram. A Six Sigma culture starts with a clear understanding
of who the customers are and what is required for complete
customer satisfaction. Data systems must be established to
measure and monitor customer satisfaction. Improvement
goals must be set, and programs must be initiated to achieve
the goals. Everyone must know their role in achieving com-
plete customer satisfaction and success for the enterprise.
Key Elements of Six Sigma
❑ Focused on Customer Satisfaction
❑ Data
❑ Reach-Out Goals
❑ Team Based
❑ All Employees Involved
❑ Clear Definition and Understanding of Roles
❑ Personal Growth
x
P
R E F A C E
9872 Demystifying Six Sigma 2/22/03 8:52 PM Page x

The second section of the book is helpful to all employ-
ees. This section is about how to establish improvement
programs that are customer focused, team based, and de-
ployed throughout the entire workforce. The six-step con-
tinuous improvement method is equally applicable to
manufacturing operations, administrative functions, and
service organizations. The program must be focused on
the key success initiatives of the company, which in turn
are focused on complete customer satisfaction in all aspects
of doing business. For some operations the customers will
be external to the company, and for others the customers
will be internal to the company. The tools and techniques
presented in this book are applicable in all cases.
In the second section the reader will learn the JUSE
seven tools of problem solving and how to apply these
tools in a six-step process for continuous improvement to
achieve Six Sigma performance levels.
JUSE Seven Tools
❑ Pareto Diagram
❑ Fishbone Diagram
❑ Check Sheet
❑ Histogram
❑ Stratification
❑ Scatter Diagram
❑ Charting
Section Three offers suggestions on how to start your
Six Sigma initiatives and how to manage the changes that
will occur.
Think continuous improvement. Without it, you are los-
ing ground. Without it, the best case is that you are holding
P
R E F A C E
xi
9872 Demystifying Six Sigma 2/22/03 8:52 PM Page xi

steady while your competitors are leaving you behind. The
more likely case is that your performance is deteriorating
while your competitors are improving. Systems left on their
own tend to atrophy. As the world has evolved to a global
market, competition has intensified. Superior product and
service will distinguish the winners from the losers.
Six Sigma and the continuous improvement model are
about tools and techniques that can be learned and suc-
cessfully used by all employees. I have trained, facilitated,
and coached this system to a very diverse group of enter-
prises. I use the term “enterprise” in the generic sense to
include companies, operations within companies, small
work groups, nonprofit organizations, retail operations,
food service, financial services, and sales. Any group of
people that is performing a service or creating a product
will benefit from this.
Six Sigma is about total employee involvement. Many
programs labeled Six Sigma include just a small portion of
the company’s total workforce. This results in getting very
limited benefit while most of your resources, and the in-
telligence they possess, remain unused. The beauty of Six
Sigma and the very core of its early development and suc-
cessful application was that it included all employees. The
major benefits of improved customer satisfaction, market
share gains, reduced operating costs, profit improvements,
and increased stock prices are fueled primarily by teams of
direct labor employees. The material presented is useful to
everyone within the enterprise from the senior executives,
who will be setting the vision and supporting the pro-
grams, to the shop floor or office cubicle people who are
performing the tasks.
Every enterprise exists to support a customer base. Cus-
tomers are the only source of income or funding. Satisfying
xii
P
R E F A C E
9872 Demystifying Six Sigma 2/22/03 8:52 PM Page xii

the customers beyond their expectations and better than
your competition must be closely tied to the survival of
every enterprise.
Six Sigma is about building quality into all of your
operations. The quality levels required today cannot be
achieved by inspecting quality in or by sorting good from
bad at final outgoing. The service industry never has had
the luxury of inspecting quality in. Every encounter in
service is a moment of truth where customer expectations
are either met or not. I refer to inspecting quality in as a
luxury because even if you could do it, your costs of man-
ufacturing would then be too high.
Six Sigma is about engaging the people who perform
the work to determine why performance levels are not as
good as they should be and to create the policies, proce-
dures, and work practices that will ensure complete cus-
tomer satisfaction. The benefits of having the workers
develop their own solutions include a sense of ownership
and pride. This also enables employees to utilize their in-
nate intelligence and existing skills sets, to learn new skills,
and to feel better about themselves and their roles in the
success of the company. High morale is a natural result of
using these methods.
The following quote is taken from one of Motorola’s
early Six Sigma teams. It is an excellent example of how
people thought about this program and the results that
they achieved. The members of this team were all direct
labor employees from the factory floor.
There’s a difference between interest and commitment. When
you’re interested in doing something, you do it only when it’s
convenient. When you’re committed to something, you accept
no excuses, only results.
P
R E F A C E
xiii
9872 Demystifying Six Sigma 2/22/03 8:52 PM Page xiii

9872 Demystifying Six Sigma 2/22/03 8:52 PM Page xiv
This page intentionally left blank

S E C T I O N O N E
The Basics of
Six Sigma
How to create a culture that thinks and operates in
terms of complete customer satisfaction. How to build
a workforce that is engaged and committed to the
success of the company.
1
9872 Demystifying Six Sigma 2/22/03 8:52 PM Page 1

1 August 1965
0115 GMT
North Atlantic off the coast of Norway.
Depth 200 feet. Speed six knots. Heading 010. At
the height of the Cold War, the American subma-
rine Sam Houston is on patrol carrying sixteen nu-
clear missiles with multiple warheads. Its role is as a
determent to Russia initiating a first-strike attack.
The Sam Houston, and submarines like her, has the
ability to retaliate with mass destruction.
0117 GMT
Loud noise and escaping steam in the en-
gine room. Throughout the ship power is lost to
lighting and operating systems. The machinist mates
report that the main valve to the starboard electrical
generator has failed. The chief of the watch reports
that the valve has been isolated and the steam leak
has stopped. The starboard generator is out of ser-
vice. Forward, the auxiliary electrician has turned off
power to all unnecessary loads. To keep the nuclear
reactor temperature and pressure in the safe area, the
operator has been adjusting control rod heights and
pump speeds. The conning officer has ordered a
depth change from 200 feet to 100 feet.
0118 GMT
“Conn, this is engineering. We have lost
the starboard generator. Damage has been isolated.
Damage assessment now in progress.”
“Conn, this is the captain. What’s the situation?”
“Engineering reports loss of starboard generator and
is assessing damage.”
0119 GMT
(Over the loudspeaker system): “This is the
captain. We have lost half of our electrical generation
2
S
E C T I O N
O
N E
9872 Demystifying Six Sigma 2/22/03 8:52 PM Page 2

capability. Rig ship for reduced power.” The cook
turns off all ovens and stovetops. All lights in crew’s
quarters are turned off. In the torpedo room, lighting
is reduced to a few emergency lights. Coffeepots are
killed. The missile technicians have activated emer-
gency backup power.
0122 GMT
Machinist mate reports that the main steam
valve to the starboard generator blew its packing.
Stores has been contacted and is searching for spare
parts.
0124 GMT
Stores reports that they have all necessary
spare parts on board. They have been collected and
are now being delivered to engineering. “Conn, this
is engineering. Repair parts are on their way. Ma-
chinist mates estimate repair time to be six hours.”
0125 GMT
“Captain, this is the Conn. Engineering re-
ports that repair parts are in hand and estimate repair
time of six hours.”
“Okay Conn, I’m on my way up.”
0130 GMT
From the Conn: “This is the captain. Con-
gratulations to everyone for a job well done. All
critical and necessary systems are operational. We
will remain on reduced power for approximately six
hours. That means we’ll be having a cold breakfast
this morning. Also, the smoking lamp is out until
further notice. We’ve all been through these things
before, and we’ll all be inconvenienced together.”
Yes, I was in the submarine service during the Cold War,
and yes, I am proud of my service. But why would I start a
T
H E
B
A S I C S O F
S
I X
S
I G M A
3
9872 Demystifying Six Sigma 2/22/03 8:52 PM Page 3

book on Six Sigma based on this experience? Because op-
erations like this are where a successful Six Sigma culture
starts. What is notable about a submarine crew is that it is
made up of diverse people with a variety of training and
skills. All are well trained and qualified for their respective
assignments. All realize that they are part of a larger whole
with an important part to play in the successful completion
of a mission. Although there is a hierarchy of command and
responsibilities, everyone has respect for each member of
the crew. Most importantly they realize that they will suc-
ceed or fail as a unit. Either the mission will be accom-
plished successfully and all hands will return safely to port
and loved ones, or none of them will. During the Cold War
two American submarines sank; there were no survivors.
Now, shift this to your work situation. Is there a hier-
archy of command and responsibility? Is the workforce
diverse, with different levels of education, training, and
knowledge? Is everyone well trained and qualified for their
respective assignments? The answer to these three questions
is most likely yes. However, if documentation of the train-
ing needs and job certification requirements for a qualified
employee at all job assignments is lacking, you must define
them and commence remedial action to bring the incum-
bent workforce up to minimal requirements.
Do all of the employees realize that they are part of a
larger whole? Do the employees realize what their roles
are and how they contribute to the success of the com-
pany? Does everyone have respect for each member of the
workforce? Is there a sense among all employees that they
will succeed or fail as a unit? Unless you have already es-
tablished a Six Sigma, or equivalent, culture, the answer to
these questions is probably no.
4
S
E C T I O N
O
N E
9872 Demystifying Six Sigma 2/22/03 8:52 PM Page 4

Six Sigma is about creating a culture where all of these
things are established and deployed throughout the entire
workforce. It is about providing a structure in which
everyone knows what is expected of them, what their
contributions are, and how to measure their own success.
It is about creating an environment where people feel
good about themselves. It is about providing the training
and tools that everyone will need to maximize their and
their team’s performance. It is about being results ori-
ented, fueled by continuous improvement, and focused
on customer satisfaction.
A Six Sigma culture contains:
❑ A diverse workforce with varying levels of
education
❑ Training programs to teach the required skills
❑ An understanding by everyone of their roles for
success
❑ A unified workforce where everyone feels like part
of a greater whole
❑ Mutual respect for everyone’s knowledge and skills
❑ A commitment to succeed
❑ A focus on customer satisfaction
T
H E
B
A S I C S O F
S
I X
S
I G M A
5
9872 Demystifying Six Sigma 2/22/03 8:52 PM Page 5

9872 Demystifying Six Sigma 2/22/03 8:52 PM Page 6
This page intentionally left blank

7
C H A P T E R 1
T h e G r a s s R o o t s o f
S i x S i g m a
Why It Had to Be Invented
In the mid-1980s Motorola was losing ground in every
market that they served. Customer dissatisfaction and
frustration with Motorola were epidemic. Operating costs
were too high, which led to dismal profits. In all cases the
lost market share was being taken over by Japanese com-
petitors. I remember Bob Galvin, Motorola’s CEO from
1970 to 1988 and chairman of the board from 1964 to
1990, saying that if the Japanese had not existed, we
would have needed to invent them. I interpreted this to
mean that someone had to give us a wake-up call.
Throughout its customer base, Motorola had a reputa-
tion for being arrogant. Bob Galvin was chagrined by an
article in one of the trade magazines, in which the head of
purchasing of one of our major customers for communi-
cations equipment was quoted as saying about Motorola,
9872 Demystifying Six Sigma 2/22/03 8:52 PM Page 7

“Love, love, love the product; hate, hate, hate the com-
pany.” Bob cited this quote several times to his leadership
team.
Motorola’s systems for doing business were not designed
for customer satisfaction. Contract reviews, responses to
requests for quote, invoicing, responses to customer com-
plaints, and most other administrative and service opera-
tions were victims of a system that allowed for apathetic
management and disinterested workers. The internal bu-
reaucracy fed on itself with little regard for serving the cus-
tomers. Response times were long, and responses usually
were not designed to satisfy the customer.
The quality and reliability of Motorola’s product were
also not what they should have been. Customers were re-
ceiving too many out-of-box failures. After the product
passed their incoming requirements, they often suffered
high levels of early-life failures. Warranty returns were a
major drain on profits. A wireless communications divi-
sion was suffering huge losses, threatened lawsuits, and
lost business with a major customer. The division quality
manager was tasked with determining what was causing
such poor field performance. His study of early-life fail-
ures discovered that they were predominately units that
had failed at final test and had to go back through a re-
work cycle.
Fortunately, the same Japanese that were destroying
Motorola in the marketplace also provided a benchmark
for how things could be done better. A group of senior
managers and executives were sent on a benchmarking
tour of Japan to study operating methods and product
quality levels. They discovered that Japan had a national
program for employee involvement and teaming, focused
8
T
H E
B
A S I C S O F
S
I X
S
I G M A
9872 Demystifying Six Sigma 2/22/03 8:52 PM Page 8

on improving operations to better serve the customers.
The Japanese had managed to use not only the muscle that
their employees provided but also their brains and knowl-
edge. They also discovered, no surprise here, that the
more complicated a product, the higher the opportunities
for failure.
Motorola’s problems were present in all of their busi-
ness units and product lines. Something had to happen,
and it had to be major, and it had to get positive results
quickly. Thus was born the need to create Six Sigma.
The Birth of Six Sigma
From its customers Motorola learned that they needed to
change their systems in all operations—manufacturing,
service, administration, and sales—to focus on total cus-
tomer satisfaction. From the Japanese they learned that in-
cluding all of your employees in the company brain trust
was an effective means of increasing efficiency and morale.
From the Japanese they also learned that simpler designs
result in higher levels of quality and reliability. From the
early-life field failure study they learned that they needed
to improve manufacturing techniques to ensure that prod-
ucts were built right the first time.
Motorola’s leaders pulled this together to establish the
vision and set the framework for Six Sigma. Posters were
hung up, and small cards were given to all employees (see
Figure 1-1).
Thus was Six Sigma launched in 1987. The corporate
leaders toured the world to all Motorola sites to explain
that this new initiative is going to be the operating mantra
of Motorola for the future. Bob Galvin personally traveled
T
H E
G
R A S S
R
O O T S O F
S
I X
S
I G M A
9
9872 Demystifying Six Sigma 2/22/03 8:52 PM Page 9

to most major sites worldwide. Of course, there was a lot
of skepticism. This looked like another program du jour.
“We’ll get excited about it, and two months from now
nobody will remember” was typical of the statements you
heard at all levels.
However, the corporate leaders did a very thorough job
10
T
H E
B
A S I C S O F
S
I X
S
I G M A
OUR FUNDAMENTAL
OBJECTIVE
(Everyone’s Overriding Responsibility)
Total Customer Satisfaction
KEY BELIEFS—how we will always act
• Constant Respect for People
• Uncompromising Integrity
KEY GOALS—what we must accomplish
• Best in Class
-People
-Marketing
-Technology
-Product: Software, Hardware and Systems
-Manufacturing
-Service
KEY INITIATIVES—how we will do it
• Six Sigma Quality
• Total Cycle Time Reduction
• Product, Manufacturing and Environmental
Leadership
• Profit Improvement
• Empowerment for All, in a Participative,
Cooperative and Creative Workplace
Figure 1-1. Motorola launch.
9872 Demystifying Six Sigma 2/22/03 8:52 PM Page 10

of deploying Six Sigma throughout Motorola around the
globe. They asked for Six Sigma reports, and they ex-
pected quality levels to be the first agenda item at all op-
erational reviews. Soon it became the modus operandi
throughout Motorola.
A key figure in all of this was Bill Smith. Bill was a high-
level quality leader who is credited with developing the
mathematics of Six Sigma. The arithmetic of Six Sigma was
created as a way of leveling the playing field throughout
Motorola. The concept of opportunities-for-error was
developed to account for differing complexities. An
opportunity-for-error is something that must be performed
correctly in order to deliver conforming product or service.
A product that took forty process steps to complete is obvi-
ously more difficult to build than a product requiring two
process steps. Likewise, an invoice consisting of forty line
items is more difficult to complete error free than an invoice
containing two line items. To adjust for the differences in
determining the numbers of opportunities for error among
assembly manufacturing, process manufacturing, adminis-
trative tasks, and services operations, formulas used were de-
veloped empirically. Thus, a manufacturing operation in
Malaysia could be fairly compared to an order-entry work
unit in Plantation, Florida. This was very important within
Motorola and was a key to its success at Motorola.
Sigma calculations are controversial. The premises of pro-
cessing attribute data (data that is discrete, such as good or
bad, win or loss, conforming or nonconforming) using the
normal curve and z-table associated with variables data (data
that is continuous and centered around a target value with
natural variation from the target) violate many of the rules
of statistics. The empirical formulas used to calculate oppor-
T
H E
G
R A S S
R
O O T S O F
S
I X
S
I G M A
11
9872 Demystifying Six Sigma 2/22/03 8:52 PM Page 11

tunities for error have the potential for overstating the com-
plexity of an operation, which in turn would lead to a de-
flated defect rate. Finally, the premise of accounting for
variation over time by adding 1.5 sigma to the actual z-table
sigma level looks fishy to many first-time observers. During
the early days of spreading Six Sigma to companies other
than Motorola, I made many presentations at conventions,
conferences, company-specific executive breakout sessions,
and suppliers to Motorola. At most of these the validity of
the sigma value calculation was challenged.
Peter Pande et al. state in The Six Sigma Way, “Overall,
you should think of Sigma-scale measures as an optional
element of the Six Sigma system. We know of quite a few
businesses—including some units of GE—that express
their overall measures as [a defect rate] and only occasion-
ally translate them to the Sigma scale.”
1
I agree with this.
Since I left Motorola, many of the Six Sigma–based sys-
tems that I have developed do not use a Sigma-value cal-
culation. It was important for Motorola and worked well
for them; however, you can achieve the same results by
driving for continuous improvement on any scale.
Bill Smith was far more than the developer of the Six
Sigma algorithms. He was the heart and soul of its de-
ployment throughout Motorola and was often referred to
as the father of Six Sigma. He had a deep understanding
of the contributions that the front-line workers made to
Motorola’s success. He was just as comfortable with the
dignitaries in Washington as he was coaching a group of
direct labor participants. I had the honor of working with
him and being mentored by him for two years. Unfortu-
nately, he died suddenly and prematurely from a massive
stroke. I can’t help but wonder where Six Sigma would be
12
T
H E
B
A S I C S O F
S
I X
S
I G M A
9872 Demystifying Six Sigma 2/22/03 8:52 PM Page 12

today if he had lived. Perhaps his greatest attribute was his
pragmatism.
In Total Quality Control, Armand Feigenbaum defines
“total quality management” (TQM) as follows:
A quality system is the agreed on, companywide and plantwide
operating work structure, documented in effective, integrated
technical and managerial procedures, for guiding the coordinated
actions of the people, the machines, and the information of the
company and plant in the best and most practical ways to assure
customer quality satisfaction and economical costs of quality.
2
In 1989 Bill Smith defined Six Sigma as:
Organized common sense.
Black Belts and Green Belts
Within the high-tech manufacturing operations within
Motorola, the practice of training some engineers and
technologists in advanced forms of experimental design,
data analysis, and process control was initiated in the early
1980s—prior to the introduction of Six Sigma. These in-
dividuals were known as local statistical resources (LSR).
Usually, they came from the process engineering or man-
ufacturing engineering groups. I was on the leading edge
of these initiatives at Motorola. Typically, one out of ten
engineers was trained as statistic resources for the engi-
neering and technical community. These individuals are
now referred to as black belts.
During this same time, factory workers were formed
into teams based on the Japanese model of quality circles.
These team members received some training and coach-
T
H E
G
R A S S
R
O O T S O F
S
I X
S
I G M A
13
9872 Demystifying Six Sigma 2/22/03 8:52 PM Page 13

ing in problem-solving methods and in the interpersonal
behaviors expected of team members. As an engineering
manager, I was a trainer, coach, and facilitator of these
teams. As the improvement efforts within Motorola
evolved, and following the introduction of Six Sigma,
these teams evolved into the total customer satisfaction,
or TCS, teams. Team members were trained on problem-
solving tools, continuous improvement models, and
teaming skills. These individuals were the precursors of
green belts.
The terms “black belt” and “green belt” were not ap-
plied to the Six Sigma program at Motorola until the
1990s. Since that time, as Six Sigma has grown to become
recognized as a leading-edge standard for companies in
manufacturing, service, and retail, many programs include
special-assignment employees with the title of black belt
or green belt. All too often, these individuals are external
to the operations that they support, which is a very ex-
pensive and less-than-optimum structure for instilling Six
Sigma. There is a high probability that such an approach
will disenfranchise most employees and give them a con-
venient avenue for abdicating their responsibilities. Short-
term benefits can be realized, but the long-term cultural
way of thinking about customer satisfaction and continu-
ous improvement will not be infused throughout the
greater workforce.
A highly effective and cost-beneficial method for de-
ploying green-belt and black-belt skills throughout an en-
terprise is to not create specialists with the title of black
belt and green belt, but rather to consider all of your em-
ployees as potential green belts. All employees are capable
of learning the skills and techniques required to become a
14
T
H E
B
A S I C S O F
S
I X
S
I G M A
9872 Demystifying Six Sigma 2/22/03 8:52 PM Page 14

green belt. From this “army” of green belts, select those
individuals who will receive the additional training re-
quired to become your black belts. Your first-line super-
visors and middle management associates are ideal
candidates; however, you will discover that some front-
line workers also exhibit the aptitude for becoming black
belts. These individuals who have an aptitude for facilitat-
ing and leading teams will require additional training in
influence management skills, coaching, teaming tech-
niques, program management, and running effective meet-
ings. Typically, 5 to 10 percent of the employees will be
needed as black belts.
In high-tech operations, a small number of individuals
trained in advanced statistical analysis and experimental
design will be needed. These individuals can also be called
black belts.
The goal of any enterprise should be to get all of its
employees trained in the techniques required to become a
green belt, including the seven problem-solving tools, the
six-step model for continuous improvement, and the in-
terpersonal skills required to effectively participate on a
team. All of these techniques are described in Section Two
of this book.
One of the lessons learned at Motorola was that the di-
rect labor teams drove the majority of the cost savings,
quality improvements, and higher customer satisfaction
levels. The people who actually perform the tasks are the
experts on the task. They have a sense of what is prevent-
ing them from doing a better job, and by utilizing the six-
step continuous improvement method, they can come up
with the solutions. Also, when the workers take on re-
sponsibility for their own performance, there is a sense of
T
H E
G
R A S S
R
O O T S O F
S
I X
S
I G M A
15
9872 Demystifying Six Sigma 2/22/03 8:52 PM Page 15

ownership and accountability. When they determine the
fixes and the changes that are necessary for improving
their operation, buy-in is a given. This pride of ownership
and improved performance leads to greater worker effi-
ciency and high morale.
According to Joyce Wycoff:
When an organization commits to creating an environment
which stimulates the growth of everyone in the organization,
amazing things start to happen: ideas pop up everywhere, peo-
ple start to work together instead of “playing politics”; new op-
portunities appear; customers begin to notice service and attitude
improvements; collections of individuals begin to coalesce into
teams.”
3
I have been involved in many successful programs. As
employees become more experienced and effective with
Six Sigma tools and the results come rolling in, something
magical happens. There comes a point in time when you
walk into the work area and you can feel the human en-
ergy, like static electricity, in the air. Those of you who
have had similar experiences know what I am talking
about. I hope that you who have not yet had this thrill
will soon experience it.
By infusing black belt and green belt skills throughout
the entire incumbent workforce, you are developing the
individuals who will create your Six Sigma culture. Every-
one will learn new skills and new ways of thinking about
how to optimize their performance. And, you will avoid
the long-term added expense of creating and funding
special-assignment job functions. And, you will be creating
an atmosphere of high morale, where all employees feel
16
T
H E
B
A S I C S O F
S
I X
S
I G M A
9872 Demystifying Six Sigma 2/22/03 8:52 PM Page 16
good about themselves and their contributions to the suc-
cess of the enterprise.
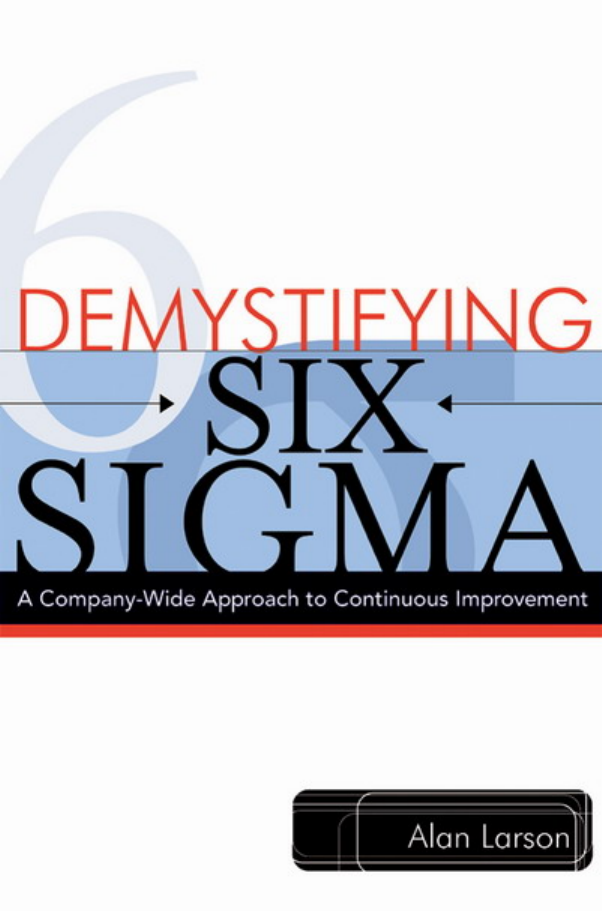
The Required Components
The chart in Figure 1-2 is from the first Six Sigma brief-
ing used to teach companies beyond Motorola what the
six key ingredients are for transforming from business as
usual to a Six Sigma culture. Chapter 2 contains more on
how to create this culture.
T
H E
G
R A S S
R
O O T S O F
S
I X
S
I G M A
17
Figure 1-2. Six Sigma components.
REWARD
AND
RECOGNITION
UNIFORM
MEASUREMENT
COMMUNICATION
TRAINING
FACILITATORS
SENIOR
EXECUTIVE
BEHAVIOR
SIX SIGMA
CULTURAL
CHANGE
9872 Demystifying Six Sigma 2/22/03 8:52 PM Page 17

The six components are:
Reward and Recognition is a system for celebrating the ac-
complishments of a team or work unit, including a
way to be honored in front of the workforce. Exec-
utive bonuses must be tied to the success of the Six
Sigma program.
Training must be provided to teach everyone the new skills
and knowledge required to implement Six Sigma.
Uniform Measurement requires that all work units in
manufacturing, administration, and service deter-
mine what is acceptable delivery to the customers.
Unacceptable deliveries are counted and converted
to a defect rate measurement.
Facilitators are the employees who have the aptitude and
receive the training required to work with others and
assist them in the transition to Six Sigma.
Communication must be provided so that everyone un-
derstands what is expected of them.
Senior Executive Behavior must model the expectations of
Six Sigma.
Notes
1. Peter S. Pande, Robert T. Neuman, and Roland R.
Cavanagh, The Six Sigma Way (New York: McGraw-Hill,
2000).
2. Armand V. Feigenbaum, Total Quality Control, 3rd
edition (New York: McGraw-Hill, 1951), p. 14.
3. Joyce Wycoff, Transformation Thinking (New York:
Berkley, 1995), p. 14.
18
T
H E
B
A S I C S O F
S
I X
S
I G M A
9872 Demystifying Six Sigma 2/22/03 8:52 PM Page 18

19
C H A P T E R 2
C r e a t i n g t h e
C u l t u r a l S t r u c t u r e
Senior Management Roles and Engagement
Six Sigma is a successful evolution of total quality man-
agement systems. Because total quality management or
Six Sigma provides a system for how you will run your
enterprise, it could just as appropriately be called “total
business management” or “total operational management.”
We probably have W. Edwards Deming and Joseph M. Ju-
ran to thank for these programs being identified under the
quality banner. Their groundbreaking programs and the
results they achieved in Japan led to American manage-
ment “rediscovering” them in the early 1980s.
This birth of their popularity was fueled by the dismal
business performance of American companies competing
with Japan, the same malady that prompted Motorola to
create Six Sigma. The essence of Deming’s teachings and
Six Sigma is that they bring together operating systems and
9872 Demystifying Six Sigma 2/22/03 8:52 PM Page 19

processes (either manufacturing, administrative, or service)
with a high degree of respect for the workers asked to per-
form within these processes, optimizing this combination
for serving the customer.
Of course, the answers were always there. American
management just wasn’t listening.
A good way to understand a Six Sigma–based total
quality management system is by defining the words in
terms of:
TOTAL
Everyone committed
QUALITY
Meeting the customers’ expectations
MANAGEMENT
Collaborative focus
Stated another way: Within a Six Sigma system, everyone
is committed to meeting the customers’ expectations through the
use of a collaborative focus.
Effective Six Sigma systems have many things in com-
mon. Employees at all levels within all operations, admin-
istrative departments, and service organizations know their
quality levels and are committed to making them better.
Everyone shares a common passion for success. Operating
policies and procedures are driven by customer satisfaction.
Customers like doing business with the company. There is
an atmosphere of high morale. Processes are repeatable and
under control; the outcome is predictable. This applies to
administrative and service functions as well as to manufac-
turing outputs. Product and service outputs, both internal
and external, are verified to meet customers’ needs.
Benchmarks for companies that have effective systems
in place are the winners of the Malcolm Baldrige National
20
T
H E
B
A S I C S O F
S
I X
S
I G M A
9872 Demystifying Six Sigma 2/22/03 8:52 PM Page 20

Quality Award. A study of the winning companies from
the first years of that award showed that they all had many
aspects of Six Sigma in place.
Commonalities of Malcolm Baldrige National Quality
Award recipients are:
1. All operations and functions concentrate on total
customer satisfaction. This applies whether serving
internal or external customers.
2. There are mechanisms in place to determine cus-
tomer satisfaction levels. Customer satisfaction is
constantly monitored, and programs are in place to
improve it.
3. The Quality Culture is cascaded down from the
senior management leadership team. They have
defined the corporate vision and have deployed it
throughout the company.
4. Senior management is involved with monitoring,
mentoring, and encouraging the new culture. They
constantly reinforce positive performance.
5. Supplier relations have changed from simply buy-
ing based on price alone to buying from the lowest-
cost-to-do-business-with suppliers. Suppliers are
expected to have systems in place to ensure deliv-
ery of defect-free parts or service on time.
6. The role of middle management is changed. Mid-
dle management is often the most threatened group
of employees. At the same time, they are often the
group expected to be most instrumental in facilitat-
ing and driving cultural changes.
7. There are internal controls in place to identify defects
and mistakes. There are active programs to eliminate
errors.
C
R E AT I N G T H E
C
U LT U R A L
S
T RU C T U R E
21
9872 Demystifying Six Sigma 2/22/03 8:52 PM Page 21

8. Benchmarking is used as a tool to drive improvement
of the company in all aspects of doing business.
9. There is some form of employee empowerment. Or,
at least, there is a system that allows and encourages
employees to use their intelligence and take the ini-
tiative required to make things better.
10. There are metrics in place to measure the quality
levels of all operations and functions. Attached to
these are programs for continuous improvement.
11. Training, training, training. As employees are asked
to assume new roles, to redefine what makes them
successful, to learn new skills, and to learn the new
cultural norms, training is imperative.
12. There are aggressive goals. People are challenged to
work more efficiently. They are taught the skills
and techniques required to achieve higher levels of
performance.
13. Teams are abundant. In some cases there are cross-
functional and multilevel teams. At the very mini-
mum, work units are identified as teams and are
taught the interpersonal skills required to function as
a team. Supervisors transition from the traditional
command-and-control role to the role of coach-
mentor-facilitator.
14. There is a reward and recognition system in place.
As new behaviors are expected from everyone, pos-
itive examples are recognized and celebrated.
First and foremost, senior management must determine
and create the culture that will enable all of these things to
happen. They must set the vision for the enterprise. For ex-
ample, in Alice’s Adventures in Wonderland, when Alice meets
the Cheshire Cat at a fork in the road, she asks the Cat,
22
T
H E
B
A S I C S O F
S
I X
S
I G M A
9872 Demystifying Six Sigma 2/22/03 8:52 PM Page 22

“Would you tell me, please, which way I ought to go from
here?” “That depends a good deal on where you want to
get to,” said the Cat. “I don’t much care where——” said
Alice. “Then it doesn’t matter which way you go,” said the
Cat.
1
Without a clearly defined and communicated vision
and key measures for success, your employees will be like
poor Alice, lost in a wonderland of strange creatures and
mad behavior.
Senior management must be resolved to do whatever it
takes to make the new culture work. They must be will-
ing and able to modify their own behaviors to model the
new rules and norms. They must be committed to the
long haul. The course must be set and held steady. It took
the Japanese twenty years to realize the benefits of their
quality programs. Under the tutelage of Deming and oth-
ers, the Japanese started these quality programs in the early
1950s. It wasn’t until the 1970s that the Japanese became
a major market-share holder in the United States.
Organizational Development
A key to the success of Six Sigma is that everyone in the
company must know what they contribute to the success
of the company. Everyone must have a clear understand-
ing of why they are employed and receiving a paycheck.
They must understand this in light of how their actions af-
fect the customers. Recently on a trip through the Mid-
west, I was listening to National Public Radio. The host
of the show, who was interviewing local farmers, asked
one farmer what he did. He answered that he fed the
world. He could have said any number of things such as
plow fields, repair tractors, or grow vegetables. But this
C
R E AT I N G T H E
C
U LT U R A L
S
T RU C T U R E
23
9872 Demystifying Six Sigma 2/22/03 8:52 PM Page 23

man understood his value-add contribution. This may be
somewhat more difficult within a large corporation, yet it
is even more important.
The leadership of the company must complete an artic-
ulate framework of how the company will function to serve
its customer base. One easy model for an Organizational
Development framework is the acronym MOST, which
represents Mission, Objectives, Strategies, and Tactics.
Mission
The company must make a clear and concise statement of
why it exists and the customers that it serves. The mission
statement may also include how the company serves the
customers’ customers. A good mission statement must con-
tain a description of what success will look like when you
are fulfilling it.
A mission statement is more concrete than a vision state-
ment. Whereas the vision has an ethereal quality, the mis-
sion statement must be reach-out yet achievable. A vision
has a sense of “In my next life I want to be. . . .” A typical
vision may read, “To be recognized by everyone world-
wide as the best company to work for.” It is doubtful that
three people living on the same block could agree on the
criteria for the best company to work for let alone the en-
tire population of the earth.
A mission statement may read, “To be the market leader
for headlights sold to American automakers.” Unless you
are already the market leader, this is an aggressive goal. It
can be measured, and you can ascertain when you are ful-
filling it. It also contains why the company exists—to
build and sell headlights—and the customers it serves—
American automakers.
24
T
H E
B
A S I C S O F
S
I X
S
I G M A
9872 Demystifying Six Sigma 2/22/03 8:52 PM Page 24

Objectives
Objectives are the quantifiable high-level goals of the com-
pany. They are the statements of how you will determine
and measure your success. They must be statements of what
you are striving to achieve; however, the numerical targets
should not be published. Competitors can gain damaging
insight into your business health, and customers will often
use this information to negotiate price reductions. The
company should hold the actual performance to objectives
in tight security.
Objectives might look like this:
Increase market share
Reduce manufacturing costs
Increase new product introductions
Reduce cycle times for product delivery and service
response
Zero safety incidents
Reduce water and air emissions
Improve profit
Improve quality in product, service, and administrative
functions
The number of objectives should be between five and
eight. If the list is too large, it becomes a laundry list of
wishes. If the list is too small, it can be limiting. You want
to provide a concise list around which all organizations can
focus their actions and priorities.
Strategies
Strategies are the means that you will use to accomplish
the objectives. Strategies define the expectations of your
C
R E AT I N G T H E
C
U LT U R A L
S
T RU C T U R E
25
9872 Demystifying Six Sigma 2/22/03 8:52 PM Page 25

culture. From these strategies your employees should have
a clear understanding of what is expected behavior.
Strategy statements may include:
❑ Respect for all people
❑ Cross-functional teaming
❑ Continuous improvement programs
❑ Superior services to our community, customers,
and employees
❑ State-of-the-art technology
❑ Open communication between employees at all
levels
❑ Training and personal growth for all employees
❑ Innovative manufacturing techniques
❑ High integrity
❑ A clean and safe work environment
❑ Exceeding customers’ expectations in all aspects of
doing business with us
The mission statement, objectives, and strategies are
typically generated by the senior management team at an
off-site location. A two-day session facilitated by an orga-
nizational development facilitator is an effective means to
accomplish this. Mission, objectives, and strategies must
come from the company leadership team. These are a top-
down communication of what is to be accomplished, how
success will be determined, and what means are to be used.
Tactics
Tactics are the actions that will be taken, within the strat-
egy guidelines, to accomplish the objectives and fulfill the
company’s mission. Once the mission, objectives, and
strategies have been communicated throughout the com-
26
T
H E
B
A S I C S O F
S
I X
S
I G M A
9872 Demystifying Six Sigma 2/22/03 8:52 PM Page 26

pany, each department and division must provide a de-
tailed action plan containing:
What will be done
Who is responsible for doing it
When it will be completed
These action plans form the foundation for what each
work unit is expected to get done daily, weekly, and
monthly throughout the year. These plans need to be tied
to at least one of the company objectives. In this way, every
employee throughout the company will have a clear un-
derstanding of what is expected of them, what their value
to the overall success of the company is, and why they are
employed.
A good action plan is posted and distributed to all af-
fected employees. Work units must review their perfor-
mance and progress on a regular time interval. Depending
on the volume and cycle time of work, work units should
review their performance weekly, biweekly, or monthly.
Division or department heads should review each work
unit at least once a month. This gives an opportunity to
provide feedback and to identify where barriers may need
to be removed, what resources need to be added, and
where management may need to spend more time assisting
their subordinates. Regular formal reviews also continue to
reinforce the concept that we are in this together.
Requirements for Change
In the late 1980s, Motorola received many requests from
conference organizers and individual companies for a brief-
C
R E AT I N G T H E
C
U LT U R A L
S
T RU C T U R E
27
9872 Demystifying Six Sigma 2/22/03 8:52 PM Page 27

28
T
H E
B
A S I C S O F
S
I X
S
I G M A
ing on what was entailed in establishing a Six Sigma culture,
on how the mathematics worked for determining a Sigma
level, and on the tools and techniques that led to the com-
pany’s success. In those briefings we initially presented the
“Required Components” fishbone diagram (see Figure 1-2
in Chapter 1), expanding on each of the six components
required for a Six Sigma cultural change. We also spent a lot
of time on how to measure defects and on the mathematics
of how to convert a defect rate into a Sigma value.
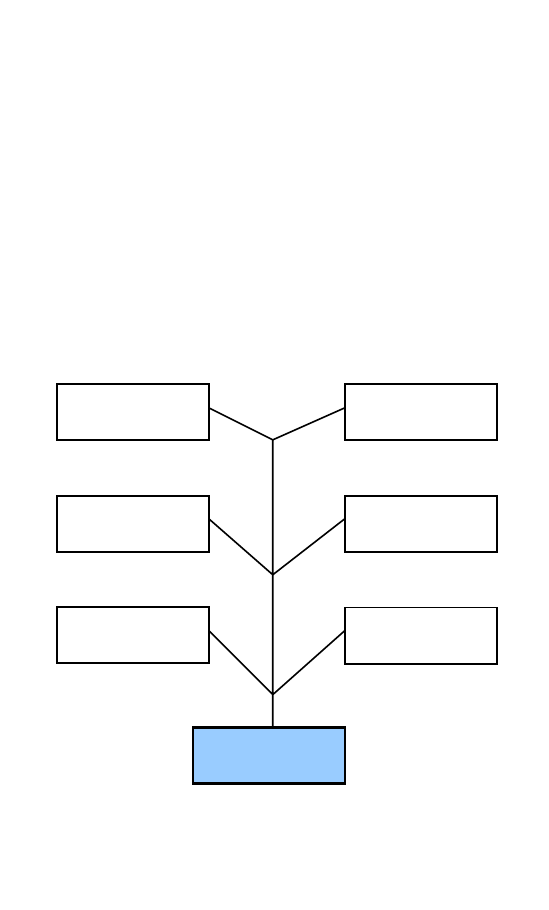
By the early 1990s, these companies realized that a
transition to Six Sigma would require changes and that
they would need to manage the change. We then began
getting questions about how we had managed this com-
plex change. In response, we developed the chart shown
in Figure 2-1, and used it in some of these briefings. The
elements of that chart are explained as follows:
❑ Vision. Vision is established by creating the vision
statement that sets the framework for the mission, objec-
tives, and strategies. All of this provides everyone with a
clear view of what is to be accomplished and how it is to
be accomplished. It is recommended that each division,
department, and work unit create their own mission state-
ment to indicate their role in fulfilling the company’s mis-
sion and their contributions toward accomplishing the
objectives. This will ensure that they understand the vision
as defined and communicated by senior management.
❑ Skills. Skills are instilled through training. Training
is perhaps the most important aspect of managing change.
People need to be taught the language, expectations, and
rules of the new culture. Technologists and engineers need
to be taught experimental designs and process control
techniques. Everyone needs to learn basic problem-solving
9872 Demystifying Six Sigma 2/22/03 8:52 PM Page 28

C
R E AT I N G T H E
C
U LT U R A L
S
T RU C T U R E
29
tools and a logical model for how to apply them to contin-
uously improve performance. Everyone must learn teaming
and interpersonal skills. Managers at all levels need to be
taught leadership skills—how to transition from control
management to facilitating leadership.
❑ Incentive. Incentive is instilled in senior management
by tying bonuses to the objectives and creating the new
culture within their infrastructures. Within senior man-
agement incentive plans, a minimum of 30 percent of
their bonus potential should be dependent on achieving
quality goals. For everyone within the middle ranks, pay
raises can be attached to how well their work units com-
plete action plans and meet their goals.
Vision
+
Skills
+
Incentive
+
Resources
+
Action
Plan
=
Change
Skills
+
Incentive
+
Resources
+
Action
Plan
=
Confusion
Vision
+
Incentive
+
Resources
+
Action
Plan
=
Anxiety
Vision
+
Skills
+
Resources
+
Action
Plan
=
Gradual
Change
Vision
+
Skills
+
Incentive
+
Action
Plan
=
Frustration
Vision
+
Skills
+
Incentive
+
Resources
=
False
Starts
Figure 2-1. Managing complex change.
9872 Demystifying Six Sigma 2/22/03 8:52 PM Page 29

Incentive for work unit members is accomplished
through a reward and recognition system. The system
should not include monetary rewards. At Motorola we
learned this lesson. It was virtually impossible to create a
monetary reward system that was equitable. For every em-
ployee who was motivated by receiving a bonus, at least ten
employees who didn’t receive a bonus were demotivated.
We did have great success with small rewards, such as
key chains, pins for your badge, two movie tickets, coffee
cups, and other similar items. The most effective means to
motivate workers was through recognition. Individuals and
teams were highlighted at monthly communication meet-
ings. Senior and middle managers would have an informal
coffee break with a team to discuss how things were going
and offer helpful suggestions. Teams that accomplished a
significant milestone were treated to lunch.
❑ Resources. Resources required to establish teams are
minimal. Members of continuous improvement teams need
to be provided one hour a week for team meetings and an
additional hour to work on team-specific projects. When
first confronted with losing their workers for two hours each
week, most managers are concerned about productivity. In
fact, in all cases that I was involved with, productivity actu-
ally went up. One manufacturing group that had 90
percent participation on teams actually saw a 30 percent
increase in productivity. An analysis showed that some
gains were attributable to improvements identified and im-
plemented by the teams. However, the greatest gains were
achieved because people were working more efficiently
and were making better use of their discretionary time.
Resources include expert help. In the early stages you
will require consultants, either internal or external, to as-
30
T
H E
B
A S I C S O F
S
I X
S
I G M A
9872 Demystifying Six Sigma 2/22/03 8:52 PM Page 30

sist the teams with start-up. People will need to be trained.
Teams will need to be facilitated. Managers will need to be
coached.
❑ Action Plans. Action plans are part of the organiza-
tional development plan. Divisions, departments, and
work units are required to generate action plans. As part of
their continuous improvement programs, teams are re-
quired to issue action plans. Once these action plans are
created, they must be worked and completed to schedule.
Action plans are “living documents.” This means that as
actions are completed, they are removed from the action
plan and archived. As new information is attained, new ac-
tion items need to be added. The operational structure
must provide for weekly and monthly reviews on how well
each entity is doing on completing their action items on
schedule and achieving the desired results.
The elements of a Six Sigma culture are:
❑ Active and visible senior management involvement
❑ A mission statement defining success
❑ Objectives and strategies
❑ Action plans detailing tactics
❑ A methodology for managing change
❑ Training
❑ Teams
Note
1. Lewis Carroll, Alice’s Adventures in Wonderland &
Through the Looking-Glass (New York: Bantam, 1981), p. 46.
C
R E AT I N G T H E
C
U LT U R A L
S
T RU C T U R E
31
9872 Demystifying Six Sigma 2/22/03 8:52 PM Page 31

32
C H A P T E R 3
P r e l i m i n a r y T a s k s
What Do You Want?
Before you embark on a major campaign to improve your
company and the skill levels of your employees, you need
to ask what it is that you are trying to accomplish and what
is required to get you there. If you want to be a cowboy or
cowgirl when you grow up, then you should learn how to
ride a horse and have someone teach you gun safety. On
the other hand, if you want to be a firefighter, start taking
lifesaving classes and learn the science of extinguishing
fires. This may sound silly, but if any program that you de-
cide to initiate is going to work, you must be committed
for a very long period of time. So, it is best to determine
that this is really something that you want to do.
Meet with the senior management team, and decide
what you want your culture to be. If you decide that you
want a Six Sigma–based culture, you need to be aware of
the essence of Six Sigma. A Six Sigma culture is one that
focuses on the voice of the customer. Your decisions, pro-
grams, and operating systems will be geared to total cus-
9872 Demystifying Six Sigma 2/22/03 8:52 PM Page 32

tomer satisfaction. Service, administration, and production
operating systems will be designed with the belief that the
customer is always right. Compensation and corrective ac-
tions for substandard product or unsatisfactory service will
be done quickly and in the customers’ favor. Customers
asking for satisfaction will not have to hear “no” followed
by the that’s-not-our-policy mantra.
Six Sigma cultures include teaming and empowerment.
When committing to a Six Sigma culture, you are com-
mitting to releasing a great deal of the historically cen-
trally held information and power. Employees at all levels
will have access to the information they need to make
sound judgments, and they will be trusted to do so. Time
will be made available during working hours for employ-
ees to meet and work on continuous improvement pro-
grams. The required training will be identified and
funded. You need to determine and communicate the
level of empowerment to which you are willing to go.
Before you launch a Six Sigma program, you need to
complete your organizational development. Vision, mis-
sion, objectives, strategies, and tactical expectations all need
to be documented and communicated. It is an excellent
idea to complete a cross-functional mapping (see Chapter
6, Step 3). Identify what it is that you do now, the “As Is”
situation. Then identify what you would like the system to
look like to be a more efficient, user-friendly system, the
“Should Be” situation. Then identify all of the actions that
must take place to transition from the “As Is” to the
“Should Be.” Complete these actions with urgency.
Determine who will be your initial green belts and black
belts. Chapter 1 listed some guidelines for the number of
black belts. As the program grows, every employee within
P
R E L I M I N A RY
T
A S K S
33
9872 Demystifying Six Sigma 2/22/03 8:52 PM Page 33

your company should be targeted to become a green belt.
This is the best way to create an environment where every-
one is a positive change agent. You need to identify the skill
levels and training required to create your army of green
belts and your cadre of black belts. Regardless of company
size or markets served, green belts need to learn the tools,
techniques, and model presented in Section Two. All enter-
prises require black belts with interpersonal, teaming,
coaching, facilitation, and basic problem-solving skills. The
type of business that you are in determines additional skills
required by black belts. If your manufacturing operations
are highly technical and controlled mainly by variable data,
then you will need black belts that have been trained in ex-
perimental design and advanced process control techniques.
You need to identify where you are going to get the re-
sources required to train and facilitate the establishment of
your Six Sigma culture. Internal resources need to be
identified and developed. External, experienced resources
are required during the first year or two. The program
should be designed so that external resources are utilized
to develop the internal resources. As the internal resources
are developed, the dependency on external resources
should be phased out.
Selecting Projects
Start with your customer data. Typically, every company
has file cabinets, or the electronic equivalent, full of his-
torical complaints and returns from customers. It is also
typical that very few companies use this data. The first
step is to convert this data into information. Go through
the data and determine the chronic reasons for the com-
34
T
H E
B
A S I C S O F
S
I X
S
I G M A
9872 Demystifying Six Sigma 2/22/03 8:52 PM Page 34

plaints. The useful tool to use here is a Pareto diagram.
(See Chapter 5, Step 2 for a detailed description of
Pareto diagrams.) This is an excellent way to prioritize
your programs. Usually you will find three to six big rea-
sons why your customers are unhappy with your product
or service.
Once you know the reasons for customer dissatisfac-
tion, determine what departments and work units are in-
volved in providing the product and service. Identify the
teams that will be needed to improve the performance,
and recruit team members from every unit involved. Pro-
vide the required training. Charter the teams with elimi-
nating errors and defects.
Another tool for gathering customer information is an
annual customer satisfaction survey, best conducted by a
third-party service provider experienced in interviewing
customers. These surveys will yield information that oth-
erwise will go unknown. Many customers will not com-
plain, often because they do not like the confrontation
associated with complaining. They quietly drift away to
one of your competitors.
A third-party provider can offer anonymity and put
customer representatives at ease. Experienced third-party
providers also can digest the information and deliver a re-
port with prioritized issues that you need to improve. An
annual customer satisfaction survey contains both closed-
ended questions and open-ended questions. A typical
closed-ended question may be, “Compared to other sup-
pliers, the timeliness and professionalism from Customer
Service is: (excellent (good (average (fair (poor.” Using 5
for excellent, 4 for good, 3 for average, 2 for fair, and 1 for
poor, the numerical scores for each of the questions are
P
R E L I M I N A RY
T
A S K S
35
9872 Demystifying Six Sigma 2/22/03 8:52 PM Page 35

summed. This provides the information necessary to pri-
oritize customer satisfaction improvement projects.
A typical open-ended question may be, “What three
things do you like least about doing business with XYZ?”
The patterns and issues in the subjective information con-
tained in the responses to such questions will provide ad-
ditional information, leading to customer satisfaction
improvement projects.
You also need to look at your financial performance.
Determine where you are spending too much money due
to poor quality. For example:
❑ How much of your cost-of-manufacturing is
caused by rework and repair?
❑ How much of your cost-of-manufacturing is
caused by in-process scrap?
❑ How much of your customer service budget is
used for doing damage control following customer
complaints?
❑ How much money are you spending on final
inspections because you can’t trust your operation
to produce defect-free product?
❑ How much business have you lost because of poor
service or product?
❑ How much could improved quality increase your
market share?
Every line item on your balance sheet is affected, either
positively or negatively, by your quality performance.
Capture your costs of poor quality and prioritize the need
for continuous improvement teams.
36
T
H E
B
A S I C S O F
S
I X
S
I G M A
9872 Demystifying Six Sigma 2/22/03 8:52 PM Page 36

Collecting Data
Remember that within a Six Sigma culture, decisions are
made and programs are established based on data. If you
don’t have the data that you need, establish some way to
start collecting it. Keep files of why customers are com-
plaining. If you lose a customer, follow up and get the real
answer to why they went to one of your competitors.
You need data to identify where your problems are. You
need data to establish a baseline of your historical perform-
ance. From this baseline, you need to set a goal of ten-fold
improvement every two years. This is the Six Sigma rate of
improvement standard. Then you need to monitor your
performance against your goal. If you are meeting or ex-
ceeding your goal, stay the course. If you are not meeting
your goal, regroup and redesign your programs.
Identifying Required Teams
You must take a cross-functional view of all parties in-
volved in delivering product or service. If customers are
chronically receiving product late, who is involved? It starts
with sales receiving the order and communicating a realis-
tic delivery date. Order entry personnel are responsible for
getting it into production. Production control people are
responsible for scheduling it properly. Production is re-
sponsible for operating a predictable factory flow. Factory
engineering must design the factory layout and machine
centers for optimum performance. Manufacturing Engi-
neering must design processes that are controllable and
predictable. Maintenance must keep equipment running.
Warehousing must have a system that allows product to
P
R E L I M I N A RY
T
A S K S
37
9872 Demystifying Six Sigma 2/22/03 8:52 PM Page 37

flow through quickly. Logistics must maintain an efficient
delivery system.
So, if one of your prioritized programs is to improve
customer on-time delivery, then you need to form a team
that includes members from sales, order entry, production
control, production, factory engineering, manufacturing
engineering, maintenance, warehousing, and logistics.
If this team decides that none of them are at fault, that
the real problem is the lousy product design that engineer-
ing gave them to build, then you need to add a representa-
tive from design engineering to the team. Any time a team
starts using the term “them,” someone from “them” needs
to be added to the team.
Things that must be done prior to creating your Six
Sigma program are:
❑ Determine what you want to accomplish
❑ Decide who will be black belts and green belts
❑ Define the training programs required for black-
belt and green-belt candidates
❑ Select the initial projects targeted for improvement
❑ Establish the required data collection systems
❑ Identify the required teams
38
T
H E
B
A S I C S O F
S
I X
S
I G M A
9872 Demystifying Six Sigma 2/22/03 8:52 PM Page 38

39
S E C T I O N T W O
A Six Sigma
Continuous
Improvement
Teaming Model
How to engage the entire workforce in the success of
an enterprise using customer-focused techniques and
quality-enhancing tools.
9872 Demystifying Six Sigma 2/22/03 8:52 PM Page 39

This section consists of a continuous improvement model
and the tools of improvement arranged in a logical flow to
get the desired results. The emphasis is on all employees.
This model and the basic tools utilized can be learned and
effectively applied by everyone. There are many statistically
based programs that are helpful for driving improvements
on very technical problems. These programs are good for
what they are designed to do. The limitation is that often
they only engage a small percentage of the workforce.
Typically, a few managers and a few technologists or engi-
neers will be involved. There are also some good problem-
solving techniques available that, all too often, are applied
only after a customer-upsetting incident has occurred.
The program presented in this section is designed with
easy-to-learn tools that enable all employees to be involved
in continuous improvement activities. This program is ap-
plicable to improving the performance in all work units
within manufacturing, service, and retail operations.
According to Kauro Ishikawa, Executive Director, QC
Circle Headquarters, Japan:
QC Circles [the early Japanese version of Continuous Improve-
ment Teams] are usually introduced into production workshops.
However, the Circle has already expanded beyond the produc-
tion floor, for example, to offices, sales departments, warehouses,
banks, insurance companies and so on. An increasing number of
nonproduction QC Circles now present their cases at QC Con-
ferences. Many people seem to think quality control deals only
with quality of products and manufacturing operations in gen-
eral. However, the QC Circle concept can be effectively intro-
duced to any kind of work or service.
1
These tools and this method can be learned by all em-
ployees within a company. It is a very simple, yet powerful,
40
S
E C T I O N
T
WO
9872 Demystifying Six Sigma 2/22/03 8:52 PM Page 40

method for giving all departments, work units, and individ-
uals a chance to be part of the solutions. It is imperative that
some up-front work is done in order to create the right cul-
ture where everyone knows his or her roles, responsibilities,
accountability, and how success will be measured. I have
been involved in companies where over 90 percent of the
employees were team members applying the tools and tech-
niques contained in this section. The most rewarding ancil-
lary effect of these programs has been the high morale that
they create. With a highly motivated workforce using the
right tools, customers enjoy doing business with you and the
financial results happen in a very positive way.
Another benefit to the methods contained in this sec-
tion is that they are designed to be used proactively. You
don’t have to wait for an upset customer before identify-
ing areas for improvement. Things can be good, and can
still benefit from improvements—what can’t? These tools
and techniques can also be used on problem areas of
chronic customer dissatisfaction. In such cases, the team
will start with a problem, improve it to the point where it
is fixed, and then continue on with any necessary im-
provements to make it the best-in-class benchmark for
other companies to envy.
Also, this is customer based and customer focused. Of-
ten there is confusion on who the customer is. Customers
can be either internal or external to a company. While it
is easy to identify external customers, it is more difficult to
identify internal customers. Every employee within an
enterprise must have a clear understanding of why they
are employed. Every employee in every enterprise must
either be doing value-add work to sell, build, and deliver
product or service to an external customer, or they must
be supporting those individuals in the value-add chain.
A S
I X
S
I G M A
C
O N T I N U O U S
I
M P ROV E M E N T
T
E A M I N G
M
O D E L
41
9872 Demystifying Six Sigma 2/22/03 8:52 PM Page 41

As part of understanding roles and responsibilities,
every work unit, and individuals within those work units,
must go through a process of identifying what they do.
What they do is their product, and for whom they do it is
their customer. Also, to perform these do’s, they have
needs, and the providers of their needs are their suppliers.
Each do/need pair is an interaction. Every Six Sigma
process is a closed-loop system of interactions where cus-
tomer satisfaction is understood, measured, and improved.
Some groundwork needs to be completed before em-
barking on continuous improvement projects within the
Six Sigma program. Once an enterprise has initiated a
Six Sigma program, work units and operations within
the enterprise must complete some preliminary steps
that ensure that the right things are being worked on.
Continuous improvement projects must be properly
prioritized such that the fruits of their labor will result
in improved customer satisfaction. It is important that
work units and operations view their activities as part of
a larger system. They must think beyond the confines of
what they do and think in terms of why they do the
things that they do and on whom they are dependent.
Before initiating a continuous improvement project, the
responsible work unit or operation must complete the
following steps:
1. Identify the product they create or the service they
provide.
2. Identify their customer(s), and determine the cus-
tomers’ needs.
3. Identify their suppliers and what they need from
the suppliers.
42
S
E C T I O N
T
WO
9872 Demystifying Six Sigma 2/22/03 8:52 PM Page 42

4. Define their process for doing the work.
5. Establish metrics for measuring the goodness of
their process and feedback mechanisms to deter-
mine customer satisfaction.
6. Ensure continuous improvement by establishing a
team that measures, analyzes, and completes fo-
cused action items.
Once they have completed the necessary groundwork,
it’s time to get started on the Continuous Improvement
program. The secret is to start small and build on your suc-
cesses. The program can start with one work unit working
on one performance indicator, or it can be rolled out to
encompass all work units within the company. If the latter
approach is chosen, you will still want to start small, with
perhaps one team per work unit. The goal is to attain
nearly 100 percent participation, but it is unrealistic to do
this immediately. It is recommended that you start with,
say, less than 20 percent of the workforce. The first team-
ing activities are going to be learning experiences for
everyone involved. As you go up the learning curve, in-
crease the number of teams.
A very positive way to increase participation is to pub-
licize the teams. Give them the opportunity to present the
work that they are doing. Giving each team a bulletin
board to showcase their results is an excellent motivational
tool for both the team members and those not yet on a
team. Give them the opportunity to present at monthly
communication meetings. “Success breeds success” is an
old adage, and it is as true today as it always has been. Let
the momentum of the program drive the success of the
program.
A S
I X
S
I G M A
C
O N T I N U O U S
I
M P ROV E M E N T
T
E A M I N G
M
O D E L
43
9872 Demystifying Six Sigma 2/22/03 8:52 PM Page 43
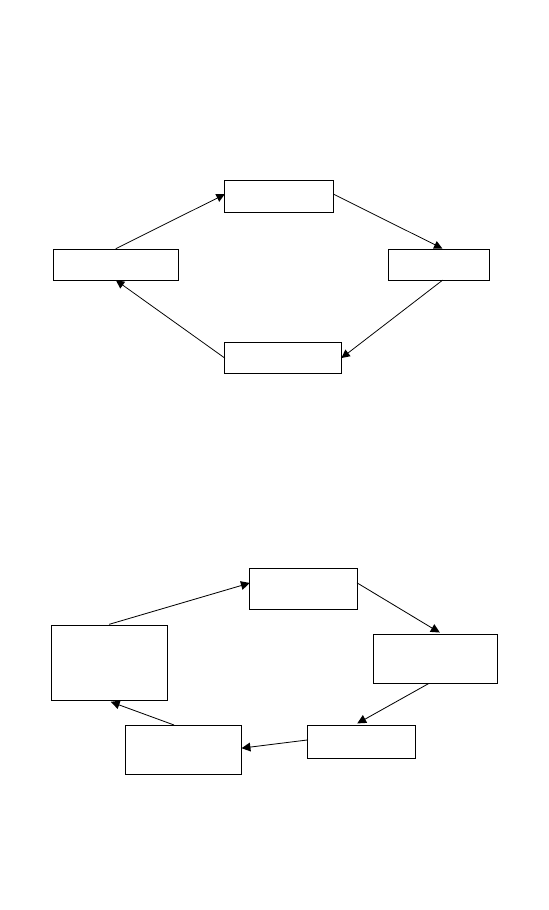
The basic cycle for continuous improvement teams is
shown in Figure S2-1.
Many Six Sigma programs include the DMAIC model,
an acronym for Define, Measure, Analyze, Improve, and
Control (see Figure S2-2).
44
S
E C T I O N
T
WO
Data
Information
Actions
Results
Figure S2-1. Continuous improvement cycle.
Define the
problem.
Measure by collecting
data and creating
metrics.
Analyze to identify
root causes.
Improve by
eliminating root
causes
Control by making
permanent changes
and reviewing
continuously.
Figure S2-2. The DMAIC model.
9872 Demystifying Six Sigma 2/22/03 8:52 PM Page 44

The continuous improvement model contained in Sec-
tion Two provides the transition from either the continu-
ous improvement cycle or the DMAIC model into a
practical, hands-on method for implementing improve-
ment programs and attaining desired results.
Most organizations have, literally, tons of data, and yet
very few of them are using it effectively. Within this con-
tinuous improvement teaming, you will learn how to
convert data into information. The tools that will be used
to do this are Pareto diagrams, histograms, scatter
diagrams,
and charting. Where more information is re-
quired, you will learn how to design and implement
check sheets
to gather the data required to provide the
sought-for information.
In the beginning of a Continuous Improvement pro-
gram, you only have visibility on the effect of things that
are not being performed well enough to provide high-
quality product or service to your customers. You will
learn how to use fishbone diagrams in conjunction
with brainstorming techniques to identify the causes that
are responsible for these poor effects. It is by eliminating
the causes of poor quality that quality is improved. If the
causes are isolated to a specific area, person, or time
period within your operation, you will learn stratifica-
tion
techniques to identify these unique causes and im-
prove them.
As identified by the Japanese in the late 1960s, the
above items shown in bold are known as the seven tools
of problem solving. These tools were brought to the
United States in 1968, and have been used very effectively
in improving the quality of services and goods. These
A S
I X
S
I G M A
C
O N T I N U O U S
I
M P ROV E M E N T
T
E A M I N G
M
O D E L
45
9872 Demystifying Six Sigma 2/22/03 8:52 PM Page 45

46
S
E C T I O N
T
WO
tools do not have to wait for a problem to occur before
utilizing them. You will be able to use them to improve
your operation and the output of that operation. Thus, we
can refer to them as the “Seven Tools of Continuous Im-
provement.”
The Seven Tools
1.
Pareto Diagram: A graph of rank-order defect data
used to prioritize continuous improvement proj-
ects and team activities.
2.
Fishbone Diagram: A framework used to identify
potential root causes leading to poor quality.
3.
Check Sheet: A form designed to collect data.
4.
Histogram: A graph of variable data providing a pic-
torial view of the distribution of data around a de-
sired target value.
5.
Stratification: A method of sorting data to identify
whether defects are the result of a special cause,
such as an individual employee or specific ma-
chine.
6.
Scatter Diagram: A graph used to display the effect
of changes in one input variable on the output of
an operation.
7.
Charting: A graph that tracks the performance of an
operation over time, usually used to monitor the
effectiveness of improvement programs.
You will learn how and when to use these tools within
a logical flow of improvement, from first becoming aware
of an operation needing improvement, through identify-
9872 Demystifying Six Sigma 2/22/03 8:52 PM Page 46

ing root causes, and ending with the action plans required
to eliminate the root causes. This will get you the desired
results.
Note
1. Kaoru Ishikawa, QC Circle Koryo (Tokyo: Union of
Japanese Scientists and Engineers, 1980), p. 14.
A S
I X
S
I G M A
C
O N T I N U O U S
I
M P ROV E M E N T
T
E A M I N G
M
O D E L
47
9872 Demystifying Six Sigma 2/22/03 8:52 PM Page 47

9872 Demystifying Six Sigma 2/22/03 8:52 PM Page 48
This page intentionally left blank

49
C H A P T E R 4
S t e p 1 : C r e a t e
t h e O p e r a t i o n a l
S t a t e m e n t a n d M e t r i c
Operational Statement
The operational statement is a very concise statement of
what you are going to improve. It must be written in sim-
ple language with a meaning that is common to everyone
who reads it. The simplest definition of an operational
statement is, “What’s wrong with what.” Or, in our us-
age, “What is not good enough about what.” Such is the
importance of getting a proper operational statement, that
it is not unusual for a team to take as many as three meet-
ings to arrive at an operational statement that meets all of
the criteria.
The three criteria for a good operational statement are:
9872 Demystifying Six Sigma 2/22/03 8:52 PM Page 49

1. It must be stated in terms of the effect of what it is that
you are improving.
2. It must be described in terms that have common mean-
ing and understanding.
3. It must define the limits of what is to be improved.
To elaborate on these criteria:
❑ Stated in terms of the effect of what it is that you are im-
proving. All interactions associated with the delivery of
product or service have an effect on the customers. You are
looking at where those effects are less than desirable. These
effects are the result of upstream causes. All operations,
whether in service or product delivery, either delivered to
an internal or external customer, have causes that end in re-
sults. These are all cause-and-effect relationships. The causes
are those things that are done while the work is being per-
formed. The objective of improvement programs is to
identify the causes that are not being done in a manner that
produces defect-free results and improve how the work is
being done. The approach is to build the quality in.
The first step in identifying causes is to start with the ob-
servable effects. At this point in time, it is all that you have
knowledge of. Start here with the effect. Later we will go
through a logical step-by-step process to identify the trou-
blesome causes and eliminate them. It is extremely impor-
tant that you identify the effect that you want to eliminate;
otherwise, you will be chasing the wrong causes. A problem
well defined is a problem well on its way to a solution.
❑ Described in terms that have common meaning and un-
derstanding. Vague statements, such as “The customers are
unhappy,” can have many different meanings. What makes
some customers unhappy may have no effect on other
50
A S
I X
S
I G M A
C
O N T I N U O U S
I
M P ROV E M E N T
T
E A M I N G
M
O D E L
9872 Demystifying Six Sigma 2/22/03 8:52 PM Page 50

customers. And, unhappy can mean many different things.
The statements must use objective language that speaks to
how well you are doing in delivering as promised to an
agreed-upon customer expectation.
An effective method for this is the “ask why” tech-
nique, in which you keep asking why until you reach a
point where the statement has an objective, understand-
able meaning. Some organizations that start with state-
ments like “The customers are unhappy” may in fact
never get past this point. They grasp at a few straws, jump
to a few false conclusions, and react to incidents as they
occur. Finally they fret over why they are losing so many
customers.
An “ask why” conversation may go like this:
“The customers are unhappy.”
“Why?”
“Because they don’t like our product.”
“Why?”
“They say our quality is unacceptable.”
“Why?”
“Too many units are getting to them in an unsatisfac-
tory condition.”
“Why?”
“The bottle caps are leaking.”
Now you have a workable what-is-not-good-enough-
about-what statement. Everyone knows what a bottle cap
is, and everyone knows what a leak is. We still need some
clarifying data that will identify the scope of the problem.
The team has just identified the problem that bottle caps
are leaking, and they need additional information. Does
the data exist from which they can draw this information?
If it does, they can do some basic data analysis to identify
S
T E P
1 : C
R E AT E T H E
O
P E R AT I O N A L
S
TAT E M E N T A N D
M
E T R I C
51
9872 Demystifying Six Sigma 2/22/03 8:52 PM Page 51

when it is, where it is, what it is, and how big it is. Has the
problem always existed, or did it appear recently? In what
regions does it affect customers? Is it local customers as
well as remote customers who receive long over-the-road
shipments? Do the caps always leak in the same manner, or
are some leaks around the seal and some due to cracks?
What is the incident rate? Does it affect 1 percent of the
product, or 20 percent, or 70 percent? When it happens,
does it affect every bottle within a product lot? Does it af-
fect every lot?
If this database does not exist, the team will have to set
up data collection points. They will also want to set up
some internal data collection points to determine where
in the process this problem first appears. Is it immediately
after bottle fill? Does it show up in the warehouse? Does
it not happen until the bottles are at the customer?
Depending on what the data reveals, the team will want
to modify the operational statements. If the data shows that
the leaking caps are isolated to one product line, Clean Hair
Shampoo, that the average failure rate is 9 percent of the
bottles, that in all cases the leaks are around the cap seal, and
that the problem is first detected at the end of the fill-and-
cap line, then the modified operational statement will be:
“Nine percent of the Clean Hair Shampoo bottles are
leaking around the cap seal at the output of the fill-and-
cap line.”
This statement provides a very clear understanding of
when it is, where it is, what it is, and how big it is.
Another example might be an internal service provider.
Within a company everyone wants their computer run-
ning with absolutely no problems during the time that
they are using it. When a problem occurs, they want the
52
A S
I X
S
I G M A
C
O N T I N U O U S
I
M P ROV E M E N T
T
E A M I N G
M
O D E L
9872 Demystifying Six Sigma 2/22/03 8:52 PM Page 52

MIS group to fix it immediately. There are not enough
MIS resources available to staff to the level required for
“immediately.” On the other hand, it is realistic to expect
an MIS department to fix problems within, say, fifteen
minutes. Thus, a good operational statement for an MIS
department could be, “Twenty percent of the trouble calls
take more than fifteen minutes to fix.”
❑ Define the limits of what is to be improved. You cannot
improve everything at once, but you can improve some-
thing at once. Often teams will want to take on a “world
hunger” problem, which will lead to frustration and fail-
ure. When it involves internal customers, you will get a
lot of pressure from everyone to fix all of their problems
right away. External customers generally understand that
as you initiate improvement programs, performance will
begin to improve, and they will begin to see improved
service from you.
Perhaps the MIS department is concentrated at division
headquarters and is only staffed during day-shift hours,
because that is when computers must be kept running at
peak efficiency. If this is the case, their operational state-
ment should be clarified to read:
“During day shift at division headquarters, 20 percent
of the trouble calls take more than fifteen minutes to fix.”
This statement provides a very clear understanding of
when it is, where it is, what it is, and how big it is.
Internal and External Defects
Once you have identified what is not good enough about
what, you have now identified your customer(s) and what
they consider a defect. The improvement techniques are
S
T E P
1 : C
R E AT E T H E
O
P E R AT I O N A L
S
TAT E M E N T A N D
M
E T R I C
53
9872 Demystifying Six Sigma 2/22/03 8:52 PM Page 53

the same for both internal and external customers. Most
units within a company service both types of customers.
Usually, Continuous Improvement programs start with
external customers. These are the ones that pay the bills.
Often you can put in some form of containment ac-
tions. These are stopgap inspections designed to catch the
noncompliances internally. These are costly in terms of
staffing and added cycle time. They are also not as effec-
tive as you would like them to be. There have been sev-
eral studies done showing that 100 percent inspection is
about 80 percent effective. You cannot inspect quality in; it
must be built in. That is the entire focus of Continuous Im-
provement programs.
Having said this, until you improve your performance, it
is necessary to do something to protect external customers
from noncompliances. With these inspection points brought
into your operation, you can now collect internal data to
provide the information that you will need to establish your
metrics and track progress. Thus, either internal defects or
external defects can be used to monitor and measure the
same problematic performance.
Remember, however, where you put in these contain-
ment actions. Once the process has been improved to an
acceptable level, remove them. Many companies leave
these containments in place, and the reason for them is
lost in antiquity. This failure to remove unnecessary in-
spections accounts for a lot of excessive costs, which have
a negative effect on the bottom line.
According to a story that appeared in Trivia by L.M.
Boyd, the British posted a military detachment on the
cliffs of Dover in 1803 to watch for Napoleon. He died in
1821. They stopped funding the guard unit in 1927.
54
A S
I X
S
I G M A
C
O N T I N U O U S
I
M P ROV E M E N T
T
E A M I N G
M
O D E L
9872 Demystifying Six Sigma 2/22/03 8:52 PM Page 54

Stories similar to this exist all too often in too many
companies.
Rule: Remove your containments when they are no longer
required.
Typically, people think of manufacturing depart-
ments when they think of defects reaching customers
and the need for Continuous Improvement programs.
While these activities are important, all departments
and work units within a company serve a variety of
both internal and external customers. Examples of the
type of Continuous Improvement programs that have
been utilized by administrative and support organiza-
tions are:
Administrative and Support Metrics
❑ Accounting
Journal voucher accuracy
❑ Continuous Improvement Teams
Cycle time of suggestions response
Number of suggestions accepted
Cost savings from suggestions
❑ Customer Service
Cycle time of return analyses
Accuracy of analyses
On-time delivery of reports
❑ Development Engineering
New product cycle time
S
T E P
1 : C
R E AT E T H E
O
P E R AT I O N A L
S
TAT E M E N T A N D
M
E T R I C
55
9872 Demystifying Six Sigma 2/22/03 8:52 PM Page 55

❑ Inventory Control
Piece part schedule accuracy
Count station accuracy
Stockroom inventory accuracy
Product on-time delivery
❑ Marketing
R.F.Q. cycle time
❑ MIS
Total released defects
Customer-found defects
Number of days to repair defects
Age of open failures
Number of failures per month
Operations software
Total released defects
Customer-found defects
Number of open problems
Age of open problems
Engineering cost to fix problems
Software failure rate
❑ Personnel
Performance reviews on-time percentage
❑ Purchasing
Open invoices in AP
Purchased material quality
Supplier base
56
A S
I X
S
I G M A
C
O N T I N U O U S
I
M P ROV E M E N T
T
E A M I N G
M
O D E L
9872 Demystifying Six Sigma 2/22/03 8:52 PM Page 56

Material cost savings
Approved lots
On-time delivery
Buyer cycle time
Procurement cycle time
❑ Quality Assurance
Accuracy
Timeliness of projects
Cycle time of projects
❑ Quality Control
Accuracy of quality reports
On-time delivery of reports
❑ Tooling
Requests done on time
❑ Training
Completion of training plans
Percent of certified personnel
Percent of hours trained to plan
Quality training percent completed
Metric
A metric is the measurement of performance; an improve-
ment metric is the measurement of performance over time.
Improvement metrics require that data be maintained on
the defect rate reaching customers or data from internal in-
spection or evaluation points. Defects are defined as any-
S
T E P
1 : C
R E AT E T H E
O
P E R AT I O N A L
S
TAT E M E N T A N D
M
E T R I C
57
9872 Demystifying Six Sigma 2/22/03 8:52 PM Page 57

58
A S
I X
S
I G M A
C
O N T I N U O U S
I
M P ROV E M E N T
T
E A M I N G
M
O D E L
thing that does not conform to the agreed-upon customer
requirements. Customer requirements must be established
realistically. Customers may want product delivered within
eight hours. If distance and shipping logistics make this im-
possible, then you must negotiate a realistic performance
requirement. In this case you find that the shortest possible
transit time is twelve hours. You and the customer must
agree that this will be your performance standard and the
customer’s expectation.
Once the agreed-to requirement standard has been de-
fined with the customer, and the evaluation point where
data will be collected has been determined, you are ready
to establish the continuous improvement metric. An im-
provement metric contains three elements:
1. A baseline is the average of historical performance
over the last several months. The time used to cal-
culate the baseline will be dependent on the vol-
ume of activity. The larger the database used, the
more accurate the baseline calculation will be.
2. A goal must be established. The historical Six Sigma
rate of improvement goal is a 10
× improvement
every two years.
3. Performance to goal must be measured on an on-
going basis.
Types of Data
Data falls into two categories. It is either variable data or
attribute data.
Variable Data
Variable data is data that is taken from a continuous
measurement system. It is also referred to as continuous
9872 Demystifying Six Sigma 2/22/03 8:52 PM Page 58

S
T E P
1 : C
R E AT E T H E
O
P E R AT I O N A L
S
TAT E M E N T A N D
M
E T R I C
59
data. It is data that can take on any value over the range
of the measurements. Measurements that are variable, or
continuous, are ones that measure length, volume, weight,
time, voltage, chemical impurities, etc. Given the sensi-
tivity of the measurement system, the values measured
can be any number. Human weight is reported in
pounds or kilograms; however, with today’s technology,
it is possible to measure weight to fractions of ounces or
grams.
Generally, variable data is taken on a product value that
is centered around an ideal target value. If you are selling
1
″ screws, then 1″ is the ideal target. When measuring
screw length, the value could be 0.095
″, 0.096″, . . .
1.004
″, 1.005″, or any value between 0.095″ and 1.005″.
To illustrate the point, the measurement range has been
limited to these values. Of course, if the process were less
in control than this, the measurement range values would
be broader. If the customer specification is a minimum of
0.098
″ and a maximum of 1.002″, then values outside of
these limits are considered nonconforming product or a
defect. Product within these limits is considered conform-
ing product, or a good unit.
Variable data will be treated in this go/no go manner. If
the value is within specification, it is good. If the value is
outside specification, it is bad. There are other techniques
that deal with variability reduction. Process characteriza-
tion studies and experimental designs can be employed to
increase the number of values closer to the target value. It
is rare that a continuous improvement team will encounter
the need for these other methodologies. If it occurs, these
other techniques are readily available and can be used on
an ad hoc basis.
9872 Demystifying Six Sigma 2/22/03 8:52 PM Page 59

Attribute Data
Attribute data is data that is taken on an outcome that
can only have a small, finite number of conditions. A
baseball game is either won or lost. These are the only
two choices: a win or a loss. There is no continuum of
possible values. It does not matter whether you won by
one point or seventeen points. If you produce products
in the four primary colors, then the only possible values
are red, blue, green, or yellow. If the customer ordered
red widgets, and the customer receives yellow widgets, it
is defective, or nonconforming, product. If the customer
receives red widgets, it is good, or conforming, product.
If you are guaranteed to have your meal within ten min-
utes, and you get it within ten minutes, it is conforming
service. If it takes more than ten minutes, it is noncon-
forming service.
Data Requirements
Data must be factual and based on actual observations or
measurements. It must be an indisputable fact that every-
one can agree on. The source of the information must be
reliable, either from an accredited laboratory or a trained
employee. It cannot be somebody’s in-laws who talked to
an old high school friend who said they heard that your
customers were receiving bad product. It must be repeat-
able, such that if the validity is challenged, it can be re-
peated or observed again. The saying is, “In God we trust;
all others bring data.”
You must ensure that the data you are using meets the
four requirements of observable, factual, reliable, and repro-
ducible.
60
A S
I X
S
I G M A
C
O N T I N U O U S
I
M P ROV E M E N T
T
E A M I N G
M
O D E L
9872 Demystifying Six Sigma 2/22/03 8:52 PM Page 60

Units
You must choose the units that you are going to use to
calculate the defect rate within a standard time period.
Defect rates are expressed in fraction defective, percent
defective, or parts per million (ppm). In one form or an-
other, all of these are fractional calculations. In order to
calculate these, you must use the same unit of measure-
ment in the numerator and denominator of the fractions
used in your calculations.
Take the example of an ice cream manufacturer mixing
ten 1,000-gallon batches of vanilla ice cream each day.
These batches are then divided into ten 100-gallon sub-
batches. Each 100-gallon sub-batch is packaged into one-
gallon containers, which must be filled to the proper
container weight as specified by the customer. When the
1,000-gallon batches are blended, they must have the
right proportion of ingredients, and they must contain no
contaminants. Problems can occur that would affect an
entire batch, e.g., wrong mix or contamination. Problems
can occur that would affect an entire sub-batch, such as
wrong containers being used. Or, problems can occur that
would affect an individual one-gallon container, such as
intermittent problems with the fill weight.
What are you going to use to calculate the defect rates?
If one batch is contaminated at batch mixing, then you
could calculate your defect rate for the day to be:
1 batch/10 batches = 1/10 = 10 percent =
100,000/million (ppm)
or
1,000 gal/10,000 gal =1/10 = 10 percent =
100,000/million (ppm)
S
T E P
1 : C
R E AT E T H E
O
P E R AT I O N A L
S
TAT E M E N T A N D
M
E T R I C
61
9872 Demystifying Six Sigma 2/22/03 8:52 PM Page 61

By keeping the units the same in both the numerator
(upper) and denominator (lower) of the calculation, you
arrive at the same correct answer, that the process de-
stroyed 10 percent of the product that day. If three of the
one-gallon containers had lids missing, then you would
calculate the defect rate for the day to be:
3 containers/10,000 containers = 3/10,000 = 0.03 percent =
300/million (ppm)
An administrative example is a department that proc-
esses one hundred invoices each day. Each invoice contains
twenty line items. They have committed to their cus-
tomers that the invoices will have no mistakes. At the end
of the day, the tally for that day’s performance is that four
of the invoices have mistakes. The manager reviews the
data and finds that ninety-six invoices were processed with
no mistakes, one invoice had one line item with an error,
two invoices had four line items each with errors, and one
invoice had two line items with errors. The department
could choose to calculate the defect rate two different
ways. In order to monitor the overall performance of the
department, the manager is interested in the accuracy of
the reports that went to the customers. He or she would
calculate the day’s defect rate as:
4 reports/100 reports =1/25 = 4 percent =
40,000/million (ppm)
The individual workers filling out the invoices would
be more interested in how well they perform all of the de-
tailed work that goes into successfully completing a cor-
rect invoice. They would calculate the day’s defect rate as:
11 line items/2,000 line items =11/2,000 = 0.55 percent =
5,500/million (ppm)
62
A S
I X
S
I G M A
C
O N T I N U O U S
I
M P ROV E M E N T
T
E A M I N G
M
O D E L
9872 Demystifying Six Sigma 2/22/03 8:52 PM Page 62

Both of these methods are legitimate. Each of the dif-
ferent ways speaks to the job function that is being mea-
sured. The important thing is that you choose your units
and stick with them over time. Remember that we are in-
terested in monitoring and measuring improvements. We
are not interested in comparing groups or individuals. It
would be silly to say that the workers are better people
than the manager is because their defect rate is only 0.55
percent while the manager’s is 4 percent.
Creating the Metric
By treating variable data as go/no go data and attributing
data as either good or bad, we are now ready to establish a
metric that is based on a defect rate. This universal method
of establishing a metric based on defects instills a mind-set
that an organization, work unit, or individuals within the
work unit must constantly strive to improve performance,
and it provides the foundation for doing this with objec-
tive, customer-focused data.
The metric must flow from the operational statement.
If your operational statement is, “Customers are receiv-
ing nonconforming product,” then a metric must be es-
tablished that measures the defect rate in terms of
number of defective units received by the customers, di-
vided by the total number of units received by the cus-
tomers. If your operational statement is, “Twenty percent
of the trouble calls take more than fifteen minutes to fix,”
then a metric must be established that measures the defect
rate in terms of number of trouble calls that take more
than fifteen minutes, divided by the total number of trou-
ble calls processed.
S
T E P
1 : C
R E AT E T H E
O
P E R AT I O N A L
S
TAT E M E N T A N D
M
E T R I C
63
9872 Demystifying Six Sigma 2/22/03 8:52 PM Page 63

You must also demonstrate how the improvement will
contribute to the overall success of the enterprise. It may
be tempting to work on how to ensure that your favorite
soda is always available in the break room vending ma-
chines, but this probably doesn’t tie into one of the objec-
tives or key performance indicators of the company. You
also must verify with your customers that they agree you
are working on the right things. If you improve that
which you have identified to improve, will the customers
be happier?
Using historical data, determine what the baseline
performance has been. Baseline performance is the his-
torical average defect rate. If you don’t have historical
data, start collecting data for some initial period of time
in order to set a baseline performance defect rate. From
this starting point calculate a performance goal. The
performance goal must be both aggressive and attainable.
It also needs to be ever-improving. Do not expect a
team to instantly go from a 10 percent defect rate this
month to zero next month. “Magic pill” goals result in
frustration, a sense of “we’re failing,” and ultimately in
failure of the entire program.
These programs, and goals associated with them, must
be continuous and long term. A goal that meets these re-
quirements is the Six Sigma rate of improvement goal.
The Six Sigma rate of improvement goal is a ten-fold
improvement every two years. Thus, if a team is at a 10
percent defect rate this month, two years from now they
should be at a 1 percent defect rate. If a team is at a 4,000
ppm defect rate this month, they should be at a 400 ppm
defect rate two years from now.
64
A S
I X
S
I G M A
C
O N T I N U O U S
I
M P ROV E M E N T
T
E A M I N G
M
O D E L
9872 Demystifying Six Sigma 2/22/03 8:52 PM Page 64

You must also decide the standard time units that will
be used for calculating the defect rate. Typically, teams
will calculate their performance on a weekly basis, and
management will want to see a monthly calculation. This
is case dependent based on the activity level. A good rule
of thumb is that there should be at least one hundred
units processed before calculating a defect rate. If a work
unit is producing twenty-five reports a week, it is best to
calculate defect rate monthly. If a work unit is producing
a hundred reports a week, the team can choose to calcu-
late performance weekly with a monthly calculation for
management. If a work unit is producing 200 reports a
day, it is still best to calculate weekly and monthly. Cal-
culating defect rates with too short a time span or not
enough activity between calculations will result in wide
swings that are both misleading and frustrating.
Metric Example
Operational statement: “Customers are receiving non-
conforming product.”
Historical data: Last year 12,373 units were shipped, and
545 units were defective.
Baseline performance: Defect rate = 545/12,373, or 4.4
percent
10
×/2 years improvement goal: Goal = 4.4 percent/10, or
0.44 percent
A graphic illustration of the improvement goal is shown
in Figure 4-1.
S
T E P
1 : C
R E AT E T H E
O
P E R AT I O N A L
S
TAT E M E N T A N D
M
E T R I C
65
9872 Demystifying Six Sigma 2/22/03 8:52 PM Page 65
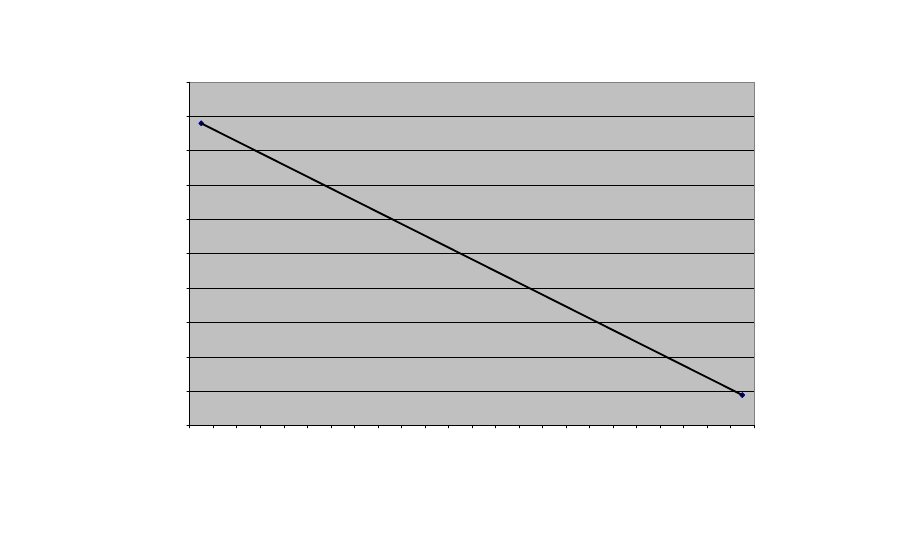
This Year
Next Year
Customer Received Defect Rate
0
0.5
1
1.5
2
2.5
3
3.5
4
4.5
5
jan
feb
mar
apr may
jun
jul
aug
sep
oct
nov
dec
jan
feb
mar
apr may
jun
jul
aug
sep
oct
nov
dec
% defective
Figure 4-1. Sample improvement metric.
9872 Demystifying Six Sigma 2/22/03 8:52 PM Page 66

Before you leave Step 1, have you:
❑ Written your operational statement?
❑ Put any required containment actions in place?
❑ Flagged your containments for later removal?
❑ Created your metric and trend chart?
❑ Established a method for collecting your data?
S
T E P
1 : C
R E AT E T H E
O
P E R AT I O N A L
S
TAT E M E N T A N D
M
E T R I C
67
9872 Demystifying Six Sigma 2/22/03 8:52 PM Page 67

68
C H A P T E R 5
S t e p 2 : D e f i n e t h e
I m p r o v e m e n t T e a m s
Identifying the Required Teams
When initiating a Six Sigma Continuous Improvement
program, you must prioritize improvement actions and
establish teams to work on the predominate reasons for
customers receiving defective products or unsatisfactory
service. Once a Continuous Improvement program is es-
tablished and running well—typically six to nine months
following initiation—effective teams will be in place.
The alignment then shifts from assigning team members
to problems to assigning problems to teams. During both
of these phases, problems must be addressed on a prior-
ity basis. The ideal tool to use for this activity is a Pareto
diagram.
9872 Demystifying Six Sigma 2/22/03 8:52 PM Page 68

Pareto Diagram
A Pareto diagram is a bar chart that displays the reasons for
defects, and the number of defects for each reason or cate-
gory. The Pareto diagram is based on the Pareto principle,
which states that 80 percent of all effects can be attributed
to 20 percent of the causes. These causes are referred to as
the significant few among the insignificant many.
Looking back at the sample metric in Step 1 (Chapter
4), we know that there were 545 defective units received
by the customer. The next step is to determine why they
were defective. We must determine the reasons for the de-
fects and count the number of defective units within each
category. We must choose a consistent time frame in
which to count the defects. This will ensure that we have
an apples-to-apples comparison. If you count defects for
some categories over an entire year and defects for other
categories for a month, the results will be skewed and mis-
leading. Choosing a time frame is situational dependent.
The time frame must be long enough to capture enough
defects to display the natural occurrence of defect reasons.
There is no hard-and-fast rule; however, a good rule of
thumb is to have at least fifty individual occurrences. The
larger the number of data points, the greater the distinc-
tion between categories. This will increase your confi-
dence that you have identified the significant reasons and
have prioritized your resources properly.
If historical data exists, as it does in most cases, look
back to the recent history and choose a time frame that
includes enough data points to provide the distinction
among defect categories. If historical data does not exist,
you will need to establish a check sheet (which will be de-
S
T E P
2 : D
E F I N E T H E
I
M P ROV E M E N T
T
E A M S
69
9872 Demystifying Six Sigma 2/22/03 8:52 PM Page 69

scribed in Step 4) to collect enough data to provide the
required distinction.
The metric example in Chapter 4 shows that there
were 545 defective units last year. It is not necessary to an-
alyze all of this data. For efficiency, you will very likely get
enough information from the last quarter of last year. In
this example, when the details are looked at for October,
November, and December of last year, they reveal the fol-
lowing categories and the number of defective units
within each category:
Category
Number of Defective Units
Broken Component
6
Fractured PC Board
34
High Resistance
14
Dented Case
77
Power Cord Missing
5
Illegible Markings
4
Total
140
Now, arrange this list with the most frequent occurrence
at the top descending to the least frequent occurrence.
Category
Number of Defective Units
Dented Case
77
Fractured PC Board
34
High Resistance
14
Broken Component
6
Power Cord Missing
5
Illegible Markings
4
Total
140
70
A S
I X
S
I G M A
C
O N T I N U O U S
I
M P ROV E M E N T
T
E A M I N G
M
O D E L
9872 Demystifying Six Sigma 2/22/03 8:52 PM Page 70

Start the Pareto diagram by drawing a horizontal axis
with the most frequent occurrence at the left and contin-
uing to the right in descending order of occurrence, as
shown in Figure 5-1.
The next step is to add a vertical axis with a scale high
enough to include the largest value. The highest number
of occurrences is 77, so the scale maximum will be set at
90 (see Figure 5-2).
You now have a clear picture of the reasons for your
customer complaints. Establishing a continuous improve-
ment team to eliminate the dented case and fractured PC
board defect rate will eliminate 79 percent of the prob-
lems getting to the customer. At this point you must de-
cide how many resources will be assigned to work on
continuous improvement projects. Ultimately, the goal is
to have 80 percent of the workforce participating on con-
tinuous improvement teams, but this takes time. Many
companies start small and build to the 80 percent level
over a one-year period. If you identify only enough re-
sources to support one team, you would create a team to
improve dented cases. If you identify enough resources to
support two teams, you would add a team to improve
fractured PC boards. If you identify enough resources to
support three teams, you would add a team to improve
high resistance.
S
T E P
2 : D
E F I N E T H E
I
M P ROV E M E N T
T
E A M S
71
Dented
Case
Fractured
PC Board
High
Resistance
Broken
Component
Power Cord
Missing
Illegible
Markings
Figure 5-1. Pareto diagram: horizontal axis.
9872 Demystifying Six Sigma 2/22/03 8:52 PM Page 71
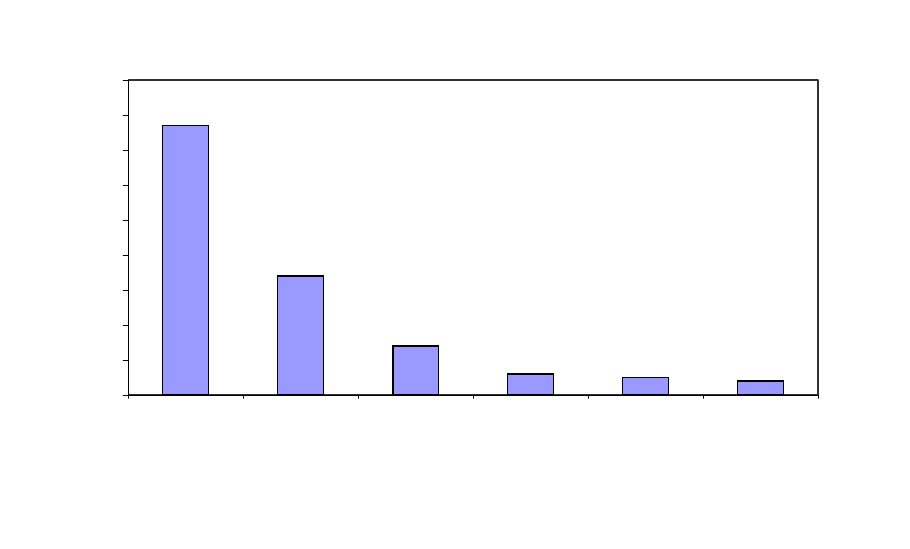
C u s to m e r N o n c o n fo rm a n c e s
0
1 0
2 0
3 0
4 0
5 0
6 0
7 0
8 0
9 0
D e n te d C a s e
F ra c tu re d P C
B o a rd
H ig h R e s is ta n c e
B ro k e n
C o m p o n e n t
P o w e r C o rd
M is s in g
Ille g ib le M a rk in g s
Figure 5-2. Pareto diagram of customer nonconformances.
9872 Demystifying Six Sigma 2/22/03 8:52 PM Page 72

Sub-Paretos
We have used the high-level data to categorize the reasons
for customer complaints, and have used that analysis to
identify the required continuous improvement teams.
Once the teams are established, they will often need to do
the next level of Paretos. These are called sub-Paretos.
Usually, two levels are sufficient; however, there will be
cases where three or more levels of Paretos need to be
completed. This technique complements the “ask why”
method of getting to a root reason for defects.
In this example, the dented case continuous improve-
ment team will want to look at the rejects and determine
where the dents are occurring. A Pareto analysis of this
data will focus the team in the right direction to ferret out
and eliminate the root cause(s) behind these defects.
There are any number of possible outcomes from this. If
one location, say the top left on the back of the case, is
dented at a much higher rate than anywhere else, then the
team would look for handling or packaging issues that
could lead to that result. If the dents are randomly and con-
sistently spread over the entire surface of the case, then the
team will have to investigate for causes affecting the entire
manufacturing, packaging, and shipping of the cases.
Staffing the Teams
Before you establish teams, you must get consensus from
all levels of management and supervision. Corporate sen-
ior management must agree that teaming is something that
they will support as part of the enterprise’s culture. Middle
managers must be aware that their roles will change, and
they must be willing to rethink how they lead people. Su-
S
T E P
2 : D
E F I N E T H E
I
M P ROV E M E N T
T
E A M S
73
9872 Demystifying Six Sigma 2/22/03 8:52 PM Page 73

pervisors must be willing to transition from a control man-
agement style to a participative management style.
The early attempts at continuous improvement teams
were based on volunteers. This had the drawback of often
not having the right skills, experience, and knowledge on
the team. Most of these teams accomplished little or failed
altogether. In forming teams, you must assemble the right
mix of education, experience, and knowledge. People can
be motivated to be on a team. The benefits of team par-
ticipation are improvements in personal skills, recognition
for one’s efforts, a sense of accomplishment, getting to
know more people from different organizations within
the company, and small concrete rewards such as movie
tickets or a night out on the town.
Motivation is the best way to staff a team. If this fails to
get everyone needed, the additional necessary people
must be “volunteered” army style. It has been my experi-
ence that initially about 20 percent of the workforce will
eagerly volunteer. Another 30 percent, perhaps the shy
ones, will eagerly say yes when asked. From this begin-
ning, the program will grow. People will see the cama-
raderie and high spirits of the team participants. This will
result in another 30 percent asking to be on teams. This
growth to the 80 percent participation level takes from six
months to one year. As the teams grow in number and the
percentage of employee participation grows, keep the
teams intact. After a team completes a successful continu-
ous improvement project, assign them a new project. Ul-
timately the Six Sigma program will reach the point
where teams themselves identify their next continuous
improvement project.
The last 20 percent are best to leave alone. If you force
74
A S
I X
S
I G M A
C
O N T I N U O U S
I
M P ROV E M E N T
T
E A M I N G
M
O D E L
9872 Demystifying Six Sigma 2/22/03 8:52 PM Page 74

everyone to be on a team, you are going to destroy the
very atmosphere that you are trying to create. An 80 per-
cent participation rate is sufficient to declare it a win, es-
tablish the culture, and reap the benefits.
Within many work units, workers perform as specified
by supervisors; however, it needs to be recognized that the
individuals performing the job know how best to do it.
These workers are aware of things that are preventing
them from doing the job better. There is a lot of native in-
telligence within all work units that must be utilized to
improve performance, maximize efficiency, and produce
the highest output quality. These work units have knowl-
edge that does not exist anywhere else in the organization.
If only asked, all workers, with very few exceptions, are
willing to apply their knowledge and energies to improve
performance of the company.
Team members must be trained on the improvement
tools and how to apply them for successful results; this
must be done when they are eager for the knowledge.
Some companies have conducted a massive training pro-
gram before launching an improvement team program.
This often leads to employees not understanding what it is
that they should have been learning, and forgetting most of
what they did pick up before ever getting a chance to use
it. The best programs are those where the improvement
team program and required training are launched simulta-
neously. Prior to this, it is advisable to have a cadre of fa-
cilitators trained and ready to assist the teams through their
first improvement project.
Team membership should be from three to eight par-
ticipants, including the leader. Arguably, two people could
comprise a team, such as in doubles tennis; however, this
S
T E P
2 : D
E F I N E T H E
I
M P ROV E M E N T
T
E A M S
75
9872 Demystifying Six Sigma 2/22/03 8:52 PM Page 75

is too few to achieve team synergy. Once a team grows to
ten members, it is best to break it into two smaller teams.
With ten or more people, some team members will drift
into anonymity and will not contribute to team activities
or success.
Managers can name the team leaders or the team can
select the team leader by consensus. Do not let a person
who is in a hierarchical position over any of the team
members become the team leader. This will only result in
delegation and management as usual. The role of the
leader is to pull the team members together as a team, call
the meetings, ensure attendance, ensure that the inputs
and workloads are shared by all team members, and inter-
face with the team champion when necessary. Once a
team has successfully completed their improvement activ-
ity, the existing team leader should step down and a new
one selected for the next project.
Be patient. In the beginning, you are going to need to
look at a lot of team glasses as “10 percent full.” This is
where leadership of the enterprise makes a huge impact.
Do not expect “magic pill” solutions.
Team member commitment is for two hours a week—
one hour of meeting time and an additional hour to com-
plete team actions. This is done during normal working
hours. I have been involved in programs where hourly
workers volunteered to come in on their own time without
compensation simply because they were excited and com-
mitted to what they were accomplishing. Managers may
worry, understandably so, about what will happen to the
productivity of their group if 5 percent of their time is fo-
cused on something other than their traditional work. In all
cases that I have experienced, productivity, as measured by
76
A S
I X
S
I G M A
C
O N T I N U O U S
I
M P ROV E M E N T
T
E A M I N G
M
O D E L
9872 Demystifying Six Sigma 2/22/03 8:52 PM Page 76

output per person-hour, has increased. After studying the
case where manufacturing costs decreased by 30 percent,
the work unit managers and director of manufacturing
came to the conclusion that all workers have a lot of discre-
tionary time during a normal workday and that this time
was being better utilized. When people are excited and
committed, they spend more time performing tasks central
to the success of the enterprise and less time “gathering
around the water cooler.” Also, as team-driven improve-
ments kick into place, operations become more efficient.
There is less scrap, less rework, less wasted motion, which
means that efficiency, and resulting cost improvements, is a
natural result of improvement team programs.
In the beginning there is resistance to team member-
ship. “I don’t have time.” “I’m too busy.” “We have to get
product out the door.” These are typical reactions before
people become involved. In the beginning they must be
reminded that things are not as good as they should be.
The challenge is to convince employees that if they keep
working forty hours a week doing things in a less than op-
timal way, they are always going to be working in a less
than optimal way. Dedicating two hours a week to im-
proving the status quo is going to improve their working
conditions.
John Cotter, a prominent sociotechnical system con-
sultant, found that “in a review of organizations that had
transitioned to teams in seven countries,
❑ 93 percent reported improved productivity.
❑ 86 percent reported decreased operating costs.
❑ 86 percent reported improved quality.
❑ 70 percent reported better employee attitudes.”
1
S
T E P
2 : D
E F I N E T H E
I
M P ROV E M E N T
T
E A M S
77
9872 Demystifying Six Sigma 2/22/03 8:52 PM Page 77

Determining Required Skills and Knowledge
When initiating a Continuous Improvement program,
you need to identify the team members required for each
improvement project. These do not need to be listed by
name; rather, they should be identified by job functions or
special skills needed. If a team will potentially be dealing
with very technical issues, then an engineer or technolo-
gist will be needed on the team. If the scope of operations
involved in producing the product or service involves
many different work units, then there must be a member
from each of these work units.
It is essential that the team is comprised of enough mem-
bers to handle the work assignments and action plans. If oc-
casionally short-term assistance is needed from people not
on the team, it is possible to obtain their assistance without
making them team members. The person could be invited
to one team meeting in order to provide the required in-
formation and answer questions, or a team member could
be assigned the action item to interview the person and
bring back the required information. Also, look for situa-
tions where permanent team members may need to be
added from other work units.
Roles and Responsibilities
Each continuous improvement team requires a team leader,
team recorder, and team members. In addition to these core
team members, a team also requires a champion and a fa-
cilitator.
Team Leader
The team leader, in conjunction with team members,
sets the schedule and venue for team meetings, and en-
78
A S
I X
S
I G M A
C
O N T I N U O U S
I
M P ROV E M E N T
T
E A M I N G
M
O D E L
9872 Demystifying Six Sigma 2/22/03 8:52 PM Page 78

sures that they are held. He or she heads the team meet-
ings, keeping the team focused on the continuous im-
provement project and monitoring progress against goals.
The team leader cooperatively assigns action items and
agrees on scheduled completion dates. When the team
needs assistance from the champion, the team leader con-
tacts the champion. A good team leader makes sure that
all team members are engaged and active in achieving the
goals that the team has established. The team leader must
also create an environment where all team members are
treated with respect and there is no fear within the team.
Team Recorder
The team recorder assists the team leader by keeping
meeting attendance records and meeting minutes. Fol-
lowing each meeting, he or she publishes the meeting
minutes, which must include the action plan and status of
completion to goal. The team recorder also keeps the
metric updated so that the team can monitor its progress
to goals.
Team Members
Team members must participate in the meetings, accept
action item assignments, and complete tasks to schedule.
During the meeting it is important that all team mem-
bers contribute ideas and information that will be bene-
ficial in achieving the desired improvements. Between
meetings each team member must spend a minimum of
one hour completing action items and working on team
objectives. Team members must treat each other with re-
spect. Everyone must feel comfortable voicing his or her
inputs.
S
T E P
2 : D
E F I N E T H E
I
M P ROV E M E N T
T
E A M S
79
9872 Demystifying Six Sigma 2/22/03 8:52 PM Page 79

Champion
The champion is a member of senior management. This
person sponsors the team, and is viscerally committed to
the team’s success. The champion provides financial sup-
port for the team’s activities. The amount of money is very
minimal. Expenses may cover a recognition lunch when
the team completes certain milestones, or a small reward
such as movie tickets or dinner for two for each team mem-
ber when they successfully complete their project.
The champion also is called on to break down barriers
when necessary. Teams often run into resistance, usually
from the middle management ranks. It is sad, but reality,
that some people become irrationally territorial and pre-
vent teams from implementing solutions affecting their
areas. Others are very image conscious, and are embar-
rassed when others uncover problems that they feel they
should have discovered.
The intent of adding teams is to cooperatively work with
everyone in the enterprise to achieve higher levels of per-
formance and success. When irrational roadblocks are en-
countered, the champion must assist the team by bringing
these to a mutually beneficial solution.
Often teams will identify solutions that alter the proce-
dures and practices of an entire operation or a work unit
within the operation. In order to implement such solutions,
policies must be changed, documents must be rewritten,
and/or physical changes need to be made. These broad
sweeping changes will require the champion’s assistance
and support.
Facilitators
Facilitators are key to the success of an effective continu-
ous improvement team program. Facilitators are especially
80
A S
I X
S
I G M A
C
O N T I N U O U S
I
M P ROV E M E N T
T
E A M I N G
M
O D E L
9872 Demystifying Six Sigma 2/22/03 8:52 PM Page 80

valuable during the early stages of development. The best
way to visualize the facilitator’s role is to look at the Blan-
chard Situational Leadership model.
2
Section Three of this
book contains a summary of how this model can be ap-
plied to the leadership of continuous improvement teams.
In the S1-Directing phase, when teams are forming and
learning new skills, training is required to give the people
the tools that they need, and structure is required to pro-
vide an opportunity for them to apply the new skills. In
the S2-Coaching phase, teams are developing but lack the
competencies required to be self-sufficient. Teams require
direction and encouragement. These two phases comprise
the primary realm of facilitators.
A good facilitator is familiar with all of the problem-
solving tools and the continuous improvement model to
tie the tools together in a focused, results-oriented man-
ner. A facilitator must have excellent people skills and
teaming skills. A facilitator is part trainer, part leader, part
coach, part mentor, and part cheerleader. He or she must
know when to be active and when to be passive—when
to step in and lead the team and when to sit back and let
the team run with the process.
It is important to train and create a cadre of facilitators
to aid the teams in working the continuous improvement
process, determine their goals, and achieve the desired re-
sults. It is best to identify and train these individuals early
in the program, preferably before forming teams and
chartering them with continuous improvement goals.
The facilitator is not a team member but acts as a guide
when the team needs assistance. In the early phases of a
team’s growth, the facilitator should attend every meeting.
As the team becomes experienced and effective in team
dynamics and the application of tools, the facilitator should
S
T E P
2 : D
E F I N E T H E
I
M P ROV E M E N T
T
E A M S
81
9872 Demystifying Six Sigma 2/22/03 8:52 PM Page 81

attend an occasional meeting to show continuing support.
The team must know that the facilitator is always on call
for consultation and assistance. The facilitator must be
knowledgeable of problem-solving tools and teaming skills.
Candidates to become facilitators can come from all
walks of life. They can reside within any work unit and
occupy any level within the company. Attributes to look
for in facilitators are excellent interpersonal skills, the
ability to listen, and being comfortable in a support role.
The candidates then need to be trained in interpersonal
skills, effective meeting skills, and continuous improve-
ment quality tools and techniques.
Facilitators work in conjunction with and support of
the team leader. They may need to step in to resolve con-
flicts in a healthy and positive manner. When a team is
stuck, the facilitator needs to ask questions, lead brain-
storming sessions, recommend a methodology required to
get to the next steps for team success, and engage the
champion if required.
Rules of Conduct
Teams must predetermine how they are going to resolve
conflicts, how decisions will be reached, what behaviors
are expected from each team member, and what behaviors
are considered inappropriate. There must be an atmos-
phere of mutual trust and a common vision of what the
goal is. A good operational statement will establish the
goal. It is imperative that each team member is committed
to the goals and feels that by attaining them things will
improve. During the meetings it must be understood that
each member will give and receive feedback.
82
A S
I X
S
I G M A
C
O N T I N U O U S
I
M P ROV E M E N T
T
E A M I N G
M
O D E L
9872 Demystifying Six Sigma 2/22/03 8:52 PM Page 82

Each team member must maintain an open mind. He
or she must listen to the ideas of others before comment-
ing on them. Discussion and clarification are healthy
within a team; belittling others’ ideas is not. The main
reason for forming a team is to bring together people with
very diverse backgrounds, different education levels, and
differing levels of experience. This requires that everyone
be respectful of one another and realize that, although
each team member’s perception may be different, their in-
put is sincere and valid.
Conflicts must be resolved quickly. This may require
the services of the team facilitator. Bring the issue out in
the open, and let each party state their position and the
reasons for their position. Then focus the team on the
team goals and why each position has some merit in
achieving those goals. Look for the common ground. Re-
mind the participants that they all share a common goal,
and ask how they can combine those different approaches
into a best solution.
Decisions must be reached with consensus. Consensus
has many definitions. It is not necessary that everyone em-
brace the decision with enthusiasm; however, it is im-
portant that everyone support it. The best definition of
consensus presented to me was by Dr. Jack Null, retired
Superintendent of Fowler School District, Phoenix, Ari-
zona, who stated that “everyone must, as a minimum, leave
here committed to not undermine the efforts of those sup-
porting this decision.”
Teams must work under the guidelines of good teaming
practices. The following ingredients for successful teaming
were taken from The Team Handbook: How to Use Teams to
Improve Quality.
3
S
T E P
2 : D
E F I N E T H E
I
M P ROV E M E N T
T
E A M S
83
9872 Demystifying Six Sigma 2/22/03 8:52 PM Page 83

1. Clarity of Team Goals. A team works best when
everyone understands its purpose and goals. If there
is confusion or disagreement, they work to resolve
the issues. The goals are the larger project goals as
well as individual goals, so everyone is focusing on
an agreed-upon outcome.
2. An Improvement Plan. Improvement plans help the
team determine what advice, assistance, training,
resources, etc., it may need. They guide the team
through determining schedules and milestones, and
celebrate successes. These plans are subject to revi-
sions as needed and have some form of documen-
tation describing the process steps.
3. Clearly Defined Roles. Teams operate most efficiently
when they tap everyone’s talent and each party un-
derstands their role in producing specific results.
This should establish shared responsibility.
4. Clear Communication. Clear communication means
good, open discussions occur insuring the informa-
tion [that] is passed between team members. This
involves the skills of responsive listening, clarifying
and confirming, and using appropriate questions.
5. Beneficial Team Behaviors. Team members should
initiate discussions, seek information and opin-
ions, suggest procedures for reaching goals, clarify
or elaborate on ideas, test for consensus, summa-
rize, encourage participation from everyone, keep
discussions from digressing, be willing to compro-
mise, ease tension in the group, and praise others’
achievements.
6. Well-Defined Decision Procedures. Decision making
should be discussed to decide the best ways of
making decisions. Options include consensus, de-
cision by a few, voting, polling, and majority rule.
84
A S
I X
S
I G M A
C
O N T I N U O U S
I
M P ROV E M E N T
T
E A M I N G
M
O D E L
9872 Demystifying Six Sigma 2/22/03 8:52 PM Page 84

7. Balanced Participation. Balanced participation recog-
nizes that every team member has a stake in the
group’s achievements; therefore, everyone should
participate in discussions, decisions, commitment,
and project success.
8. Established Ground Rules. Ground rules are written to
define what will and what will not be tolerated in the
group. From time to time review the ground rules,
adding, deleting, or revising them as needed. Be sure
to pay attention to them when resolving conflicts.
9. Awareness of the Group Process. All team members
must be aware of the group process—how the team
works together. This is being sensitive to nonverbal
communication and silence. These may mean that
someone is uncomfortable with the discussion,
does not trust what is being said, or has a different
view. They need to be inquired about so trust and
open communication can grow.
10. Use of the Scientific Approach. Teams that use the sci-
entific approach rely on good reliable data for de-
cision making. The scientific approach insists that
opinions are supported by data.
Before you leave Step 2, have you:
❑ Completed your Pareto diagrams?
❑ Completed any required sub-Paretos?
❑ Identified and assigned all required team members?
❑ Selected a team leader?
❑ Assigned a team champion?
❑ Assigned a team facilitator?
❑ Completed teaming skills training?
❑ Established team rules of conduct?
S
T E P
2 : D
E F I N E T H E
I
M P ROV E M E N T
T
E A M S
85
9872 Demystifying Six Sigma 2/22/03 8:52 PM Page 85

Notes
1. Kimball Fisher, Leading Self-Directed Work Teams (New
York: McGraw-Hill, 1993), p. 22.
2. Kenneth Blanchard, Patricia Zigarmi, and Drea
Zigarmi, Leadership and the One Minute Manager (New
York: William Morrow, 1985).
3. Adapted with permission from Peter R. Scholtes,
et al., The Team Handbook: How to Use Teams to Improve
Quality (Madison, Wis.: Joiner, 1988), pp. 6-10–6-22.
86
A S
I X
S
I G M A
C
O N T I N U O U S
I
M P ROV E M E N T
T
E A M I N G
M
O D E L
9872 Demystifying Six Sigma 2/22/03 8:52 PM Page 86

87
C H A P T E R 6
S t e p 3 : I d e n t i f y
P o t e n t i a l C a u s e s
Flowcharting
You now have “what is not good enough about what”
identified and improvement teams established. Before
you start the actions to improve “what is not good
enough about what,” you need to determine if you need
all of the steps, policies, and practices currently in place
to produce the service or product for your customer(s).
You do not want to waste time improving things that are
unnecessary or detrimental to delivery of high quality
performance. In addition to improving quality, elimi-
nating unnecessary steps will reduce costs and shorten
cycle times.
The best method for doing this is flowcharting. Even
for enterprises not engaged in a Continuous Improvement
program, it is a good idea to flowchart your operation at
9872 Demystifying Six Sigma 2/22/03 8:52 PM Page 87

least once every two years. Systems and practices left on
their own have a way of growing astray.
When you initially designed and implemented your
flow for producing the services and products that your
customers expect, you started out with a good solid plow
horse that could deliver straight rows all day long. You
think you still have a plow horse that just isn’t performing
like it used to. But, when you step back and do an objec-
tive, well-informed diagram, or flowchart, of what it is
that is actually being done on a daily basis, you discover
that your plow horse has metamorphosed into a camel. It’s
kind of ugly with unnecessary lumps, a bad disposition,
and a nasty habit of spitting at you at the most inoppor-
tune times. No wonder your rows are crooked. Flow-
charting will enable you to see the camel for what it is.
You can now restore the camel back to the horse you
thought you had.
You will not be wasting time improving a camel that
you didn’t want in the first place. You will be efficiently
using your time and resources in improving the horse that
you want and need in order to satisfy your customers.
There are two basic types of flowcharting—linear flow-
charting and interdepartmental flowcharting. Both of these
methods will initially yield an “As Is” status. You will then
need to identify what it “Should Be.” Before proceeding
with the next steps of continuous improvement, you must
reengineer your system from the “As Is” state to the
“Should Be” state; that is, you must change the camel into
your horse. And improve the horse.
For our flowcharting we will be using the simplest sys-
tem of symbols.
88
A S
I X
S
I G M A
C
O N T I N U O U S
I
M P ROV E M E N T
T
E A M I N G
M
O D E L
9872 Demystifying Six Sigma 2/22/03 8:52 PM Page 88

Wait or Queue: Waiting for information, parts,
or machine availability
Operation: A value-add step that must be
performed
Decision: A checkpoint or test that determines
next steps
Linear Flowcharting
This is the simpler of the two methods. A work-unit team
generally uses it where there is only one department in-
volved in producing the service or product. In this
method, we will concern ourselves only with the steps
that must be performed, in the order in which they are
performed, to get satisfactory service or product delivered
to the customers. By using this method, we are not con-
cerned with the hand-offs between departments, the dis-
connects that can exist, the confusion of who is
responsible for each step, or the redundancies that can ex-
ist when more than one department is involved.
The following example is an internal testing laboratory
that must complete reliability qualification testing before
new electronics parts are released to the marketplace. This
is an important final step following months of product
development. The expedient release of new products is
critical for new revenue generation and for maintaining a
competitive advantage in the marketplace. The opera-
tional statement for this work unit was, “50 percent of the
reliability qualifications take more than sixty days to com-
plete.” Sixty days was determined to be the realistic cycle
S
T E P
3 : I
D E N T I F Y
P
O T E N T I A L
C
AU S E S
89
9872 Demystifying Six Sigma 2/22/03 8:52 PM Page 89

time. This included stress tests that had to be conducted
for a minimum amount of time. In other words, sixty days
was the customers’ expectation, and the laboratory was
not consistently meeting customer expectations.
The team met and created the “As Is” flowchart for
processing reliability tests through the reliability labora-
tory (see Figure 6-1). Their first observation was that a lot
of time was wasted while test units waited for test plans,
test boards, and available equipment. The discussions cen-
tered on these delays and why they were occurring. Why
couldn’t they get the test plans with the test samples? Why
did they often need to order test boards instead of having
them in stock? And why was equipment not available
when needed? In this case, the customer was product en-
gineering, which was also the group that submitted the
units for testing. They wondered whether product engi-
neering could submit the test plans ahead of, or at least
with, the test units arrival.
The team arranged a joint meeting with representa-
tives from product engineering. When asked about the
test plans, product engineering indicated that they had
only five different test plans. It was decided that the reli-
ability laboratory would keep a controlled file of the test
plans. They were designated as plan A, B, C, D, and E.
When engineering submitted test units, they would des-
ignate which plan to use. One of the product engineers
asked why the lab did a pretest on the units. She stated
that all of the units had just completed a thorough testing,
and that only good units were submitted for reliability
testing. The lab personnel stated that they had always
done that and weren’t quite sure why. A subsequent re-
view of the data showed that there had not been any
90
A S
I X
S
I G M A
C
O N T I N U O U S
I
M P ROV E M E N T
T
E A M I N G
M
O D E L
9872 Demystifying Six Sigma 2/22/03 8:52 PM Page 90
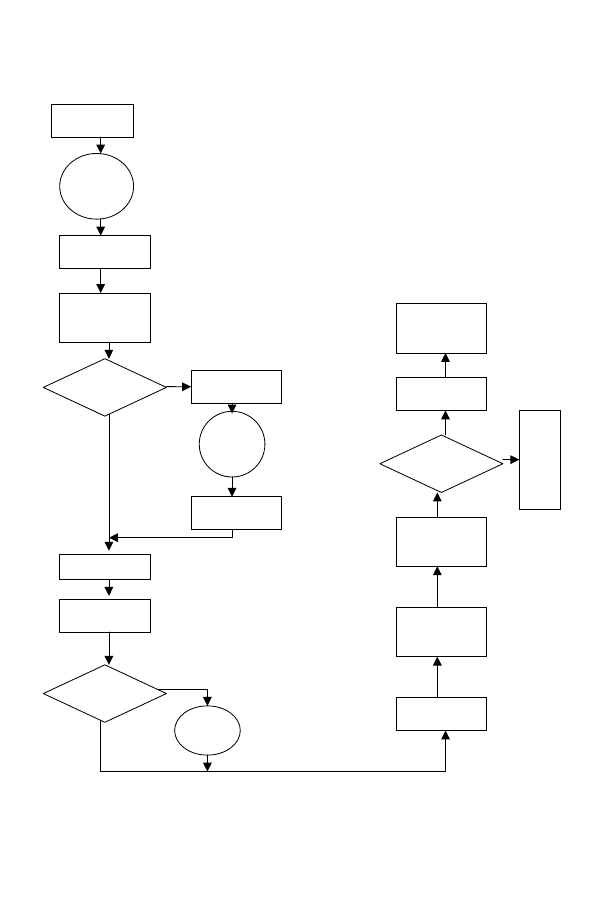
S
T E P
3 : I
D E N T I F Y
P
O T E N T I A L
C
AU S E S
91
<<Figure 6-1 – "As Is" flowchart for reliability testing>>
<<Figure 6-2
Receive
Test Units
Wait for
Test
Plan
Receive
Test Plans
Deliver Units
and Plan to
Scheduler
Queue
Boards
Available?
Order Test
Boards
Receive
Boards
Load Boards
Pretest
Units
Equipment
Available?
Queue
Complete
Reliability
Testing
Final
Performance
Testing
All Units
Pass?
Write Final
Report
Release
Product to
Market
Notify
P
rodu
ct
E
ngi
ne
er
ing
Schedule Tests
no
yes
no
yes
yes
no
Figure 6-1. “As Is” flowchart for reliability testing.
9872 Demystifying Six Sigma 2/22/03 8:52 PM Page 91

pretest rejects for over a year. The customer and the lab
personnel decided to eliminate pretesting the units.
The scheduler then asked whether there was some way
that the lab could get advance notice on when test units
would be submitted. Product engineering said that they
constantly had several products in design and develop-
ment, and that they had a good idea of when units of a
particular product would be submitted to the lab. In fact,
product engineering already had an internal report that
predicted when units would be submitted to the lab. It
was agreed that weekly they would send a copy of the re-
port to the lab scheduler.
Everyone was in agreement that it had been an excel-
lent meeting. It was felt that this was an excellent example
of getting the customer involved in the solutions neces-
sary to provide superior service.
The team then looked into why there was a shortage of
test boards. They had to work with the restricted number
of test boards that could be kept in inventory. When one
of the team members took the action item to ask the de-
partment manager about this, the manager chuckled and
said the restriction was put in place two years ago during
an industry downturn, when cost-cutting measures were
imposed. The restrictions no longer made sense. He chal-
lenged the team to provide him a proposal for min/max
inventory levels that were needed so that they would
never again have to wait for a test board. The team sub-
mitted the plan, and the department manager, after ensur-
ing that his budget covered the costs, approved the plan.
Subsequent financial analysis showed that this change
actually saved the company money. Due to the pressure to
get new products out the door as quickly as possible, lab
92
A S
I X
S
I G M A
C
O N T I N U O U S
I
M P ROV E M E N T
T
E A M I N G
M
O D E L
9872 Demystifying Six Sigma 2/22/03 8:52 PM Page 92

personnel had been placing expedite orders with the
board supplier. These orders had a 40 percent expedite
charge and were occurring at a high rate. On average, the
cost of boards had been higher than normal.
Following these changes to policies, practices, and pro-
cedures, the team created the “Should Be” flowchart (see
Figure 6-2) and implemented the changes in the reliabil-
ity laboratory. They still had plenty of things to improve,
such as internal scheduling, equipment maintenance,
staffing, and training, but now they wouldn’t be wasting
their time fixing things that weren’t needed or no longer
made sense.
Interdepartmental Flowcharting
The interdepartmental flowcharting method is used when
two or more departments or work units are involved in
producing the service or product. In this method, you
concern yourself with the hand-offs between depart-
ments, the disconnects that can exist, the confusion of
who is responsible for each step, and the redundancies that
can exist when more than one department is involved.
This example is of a small technical company that was
losing business because it took too long for the customers
to receive a response when they requested a quote. In
many instances, the customers received no response at all.
The request for quote, RFQ, should take no more than
three working days. The operational statement for this
team was, “It takes more than three days to respond to the
customer on 80 percent of the RFQs from customers.”
The team was composed of members from sales, cus-
tomer service, purchasing, production control, technical
support, and production. All of these departments were
S
T E P
3 : I
D E N T I F Y
P
O T E N T I A L
C
AU S E S
93
9872 Demystifying Six Sigma 2/22/03 8:52 PM Page 93
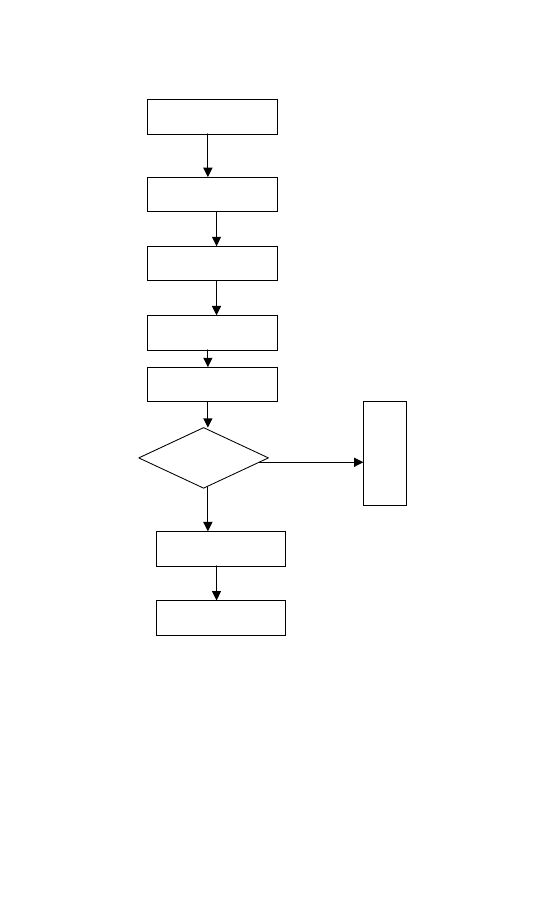
involved in processing a quote for delivery to the cus-
tomers. The team met and created the “As Is” flowchart
for processing a RFQ through the internal system (see
Figure 6-3). Their first observation was that the request
spent a lot of time traveling back and forth between cus-
94
A S
I X
S
I G M A
C
O N T I N U O U S
I
M P ROV E M E N T
T
E A M I N G
M
O D E L
Receive
Test Units
Schedule Tests
Load Boards
Complete
Reliability Testing
Final
Performance Testing
Write
Final Report
All Units
Pass?
Release Product
to Market
Notify
P
rodu
ct
E
ngi
ne
er
ing
no
yes
Figure 6-2. “Should Be” flowchart for reliability testing.
9872 Demystifying Six Sigma 2/22/03 8:52 PM Page 94

tomer service and other departments. One of the longest
delays in getting quotes out was the amount of time spent
by technical support when a nonstandard part was re-
quested. Further discussion revealed that less than 5 per-
cent of the requests were for nonstandard product. The
general guideline for process flows and system designs is
that if something occurs less than 10 percent of the time,
remove it from this flow and create a separate system to
handle these exceptions. Sales asked why so many RFQs
were entered through departments other than sales. The
sales account managers were adamant that all RFQs should
come through them.
The customer service manager stated that she was re-
sponsible for getting RFQs processed through the plant
and getting answers back to customers. RFQs were re-
turned to customer service at every step of the way so that
her people could keep track of where they were in the
process. After much discussion it was agreed that everyone
would trust the other departments to do what was neces-
sary to get the RFQs through the system as quickly as
possible. A standard flow for RFQs was developed with a
clear understanding of what each department needed to
do. Besides, as was pointed out by many team members,
this back and forth transfer to customer service was adding
a lot of unnecessary time. It was agreed that the RFQs
would transfer to the next department where value-add
input was required.
Everyone agreed that the account managers should re-
ceive and initiate all RFQs from their customers. They
were the people closest to the customers and had the
knowledge necessary to know which RFQs the company
did and did not want to respond to. When asked why the
S
T E P
3 : I
D E N T I F Y
P
O T E N T I A L
C
AU S E S
95
9872 Demystifying Six Sigma 2/22/03 8:52 PM Page 95
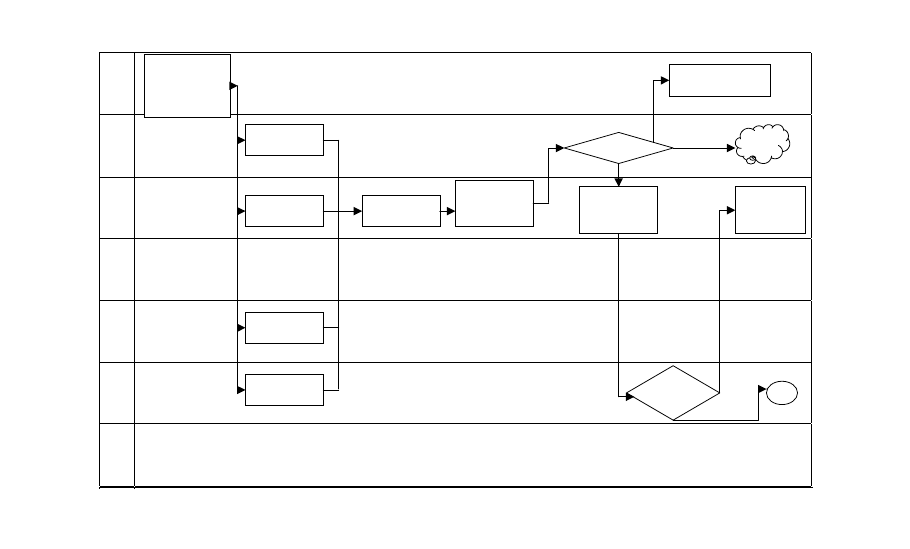
Cu
sto
m
er
Sales
yes
Cu
sto
m
er
Serv
ice
P
u
rc
ha
si
ng
P
rod
uc
ti
o
n
Co
ntr
o
l
T
ech
n
ical
S
u
pport
Yes
P
rod
uc
ti
o
n
Initiates a
Request
for
Quote
(RFQ)
Receives
RFQ
Receives
RFQ
Receives
RFQ
Receives
RFQ
Requests
Approval
from Sales
Collects all
RFQs
Approved
poof
Forwards to
Technical
Support
Standard
Part
Forwards to
Production
Control
A
Receives “No
Quote” Response
No
No
9872 Demystifying Six Sigma 2/22/03 8:52 PM Page 96
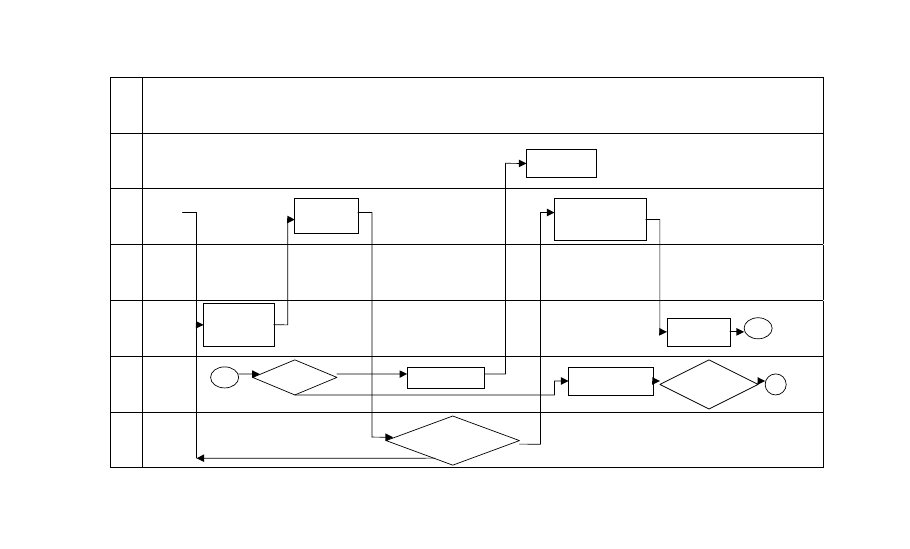
Cu
sto
m
er
Sales
Cu
sto
m
er
Serv
ice
P
u
rc
ha
si
ng
P
rod
uc
ti
o
n
Co
ntr
o
l
T
ech
n
ical
S
u
pport
P
rod
uc
ti
o
n
yes
Provides
Estimated
Delivery Date
Forwards to
Production
Approves
Delivery Date
Requests Pricing
from Production
Control
Provides
Pricing
B
A
Feasible
Informs Sales
Informs
Customer
Designs New
Product
New Parts
required
C
No
No
Yes
(continues)
9872 Demystifying Six Sigma 2/22/03 8:52 PM Page 97
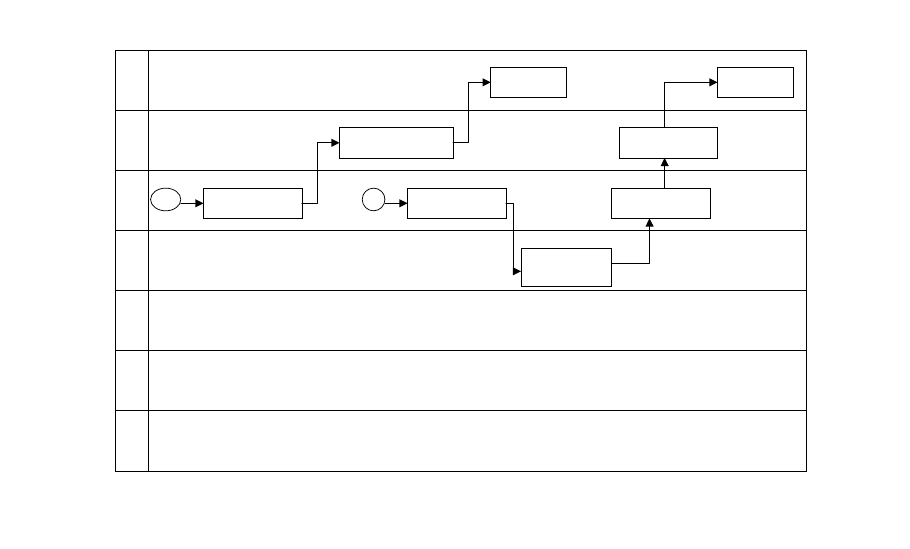
p
q
Q
g
, p g
Cu
sto
m
er
Sales
Cu
sto
m
er
Serv
ice
P
u
rc
ha
si
ng
P
rod
uc
ti
o
n
Co
ntr
o
l
T
ech
n
ical
S
u
pport
P
rod
uc
ti
o
n
B
Issues Quote
Forwards Quote
to Customer
Receives
Quote
C
Requests Costs
from Purchasing
Gets Pricing
from Vendor
Issues Quote
Forwards Quote
to Customer
Receives
Quote
Figure 6-3. “As Is” interdepartmental flowchart for RFQ.
9872 Demystifying Six Sigma 2/22/03 8:52 PM Page 98

present situation called for sales being bypassed so often, the
response was that the previous sales manager, no longer
with the company, had set a policy that he didn’t want his
people involved in what he considered a mundane task.
Everyone enthusiastically agreed that sales would be the
one-point contact for inputting RFQs.
Nonstandard requests would be directed to the techni-
cal support organization, and they were chartered to de-
velop a system for new product development that would
be independent of RFQs.
Production control developed standard pricing sheets
and gave them to customer service. Customer service
could now determine the pricing without the need for
production control involvement on every RFQ. Produc-
tion agreed to provide production control with weekly
updates of factory loading and standard throughput times.
With this new information, the production control peo-
ple could provide realistic delivery dates. Production was
still a little leery, but they said that they would give the
system a chance to work.
With all of these new changes to policies and practices
agreed to, the team then generated the RFQ “Should Be”
flowchart (see Figure 6-4). There was still a lot of work to
be done, but the team would not be spending energy try-
ing to fix an outdated and ineffective system. With just a
few of the departments now involved in processing RFQs,
the team was able to reduce the number of team members.
Brainstorming
In Step 3 we are transitioning from the known effect, “what
is not good enough about what,” to begin identifying poten-
S
T E P
3 : I
D E N T I F Y
P
O T E N T I A L
C
AU S E S
99
9872 Demystifying Six Sigma 2/22/03 8:52 PM Page 99

tial root causes. A root cause is something that if we eliminate
it or improve it, the situation and results will improve. Dur-
ing the flowcharting, we identified systemic problems and
fixed them. We are now identifying what could be wrong
with operations or individual tasks.
Brainstorming is a very simple and effective way to uti-
lize the collective intelligence and knowledge of the team
to identify all of the things that must be optimal in order for
the results to be error free. Before starting the brainstorm-
ing session, write the operational statement on a white-
board or flipchart where all team members can clearly see
it. Explain to the group that our objective is to identify all
things that can affect the performance of the operational
statement.
The rules of brainstorming are:
1. There are no bad ideas or inputs.
2. We will allow for the absurd.
3. Build off of others’ ideas.
4. No discussion or critique is allowed during the idea-
gathering phase.
The facilitator of the brainstorming:
1. Gets as many ideas as possible
2. Collects ideas as quickly as they come
3. Solicits inputs from each team member
4. Writes down every idea
5. Seeks clarification if necessary
6. Allows as much time as necessary to collect all inputs
100
A S
I X
S
I G M A
C
O N T I N U O U S
I
M P ROV E M E N T
T
E A M I N G
M
O D E L
(text continues on page 102)
9872 Demystifying Six Sigma 2/22/03 8:52 PM Page 100
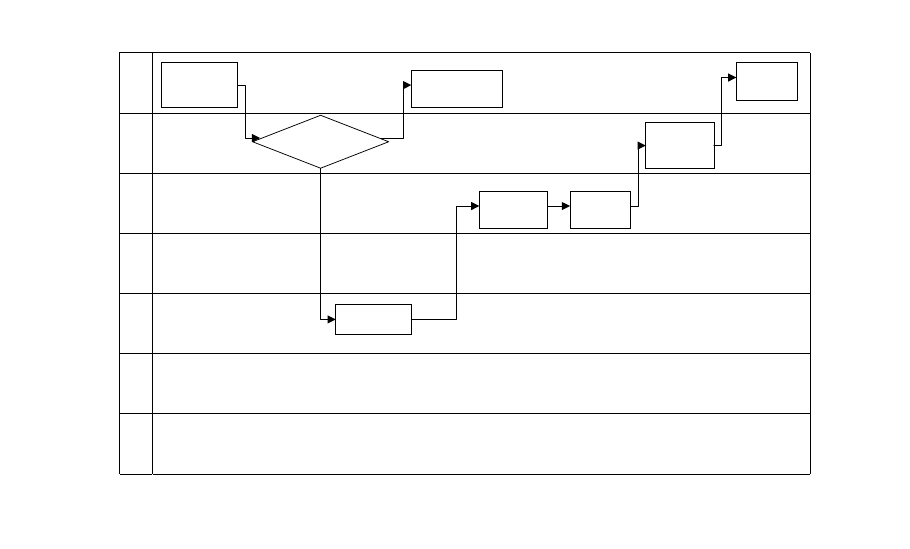
Cu
sto
m
er
Sales
No
Cu
sto
m
er
Serv
ice
Yes
P
u
rc
ha
si
ng
P
rod
uc
ti
o
n
Co
ntr
o
l
T
ech
n
ical
S
u
pport
P
rod
uc
ti
o
n
Initiates a
Request for
Quote (RFQ)
Do we
want to quote?
Receive a “No”
Quote Response
Provides
Delivery Date
Determines
Pricing
Generates
Quote
Forwards
Quote to
Customer
Receives
Quote
Figure 6-4. “As Is” interdepartmental flowchart for RFQ.
9872 Demystifying Six Sigma 2/22/03 8:52 PM Page 101

The steps of brainstorming are:
1. Display the operational statement.
2. State the objective.
3. Review the rules of brainstorming.
4. Give the team members a few minutes to think.
5. Solicit ideas from the team.
6. Write down inputs as fast they come in from any
team member.
7. If someone has not provided an input, ask him or
her for one.
8. After the team as a whole has run out of inputs, go
around the table and one-by-one ask each individ-
ual whether they have anything more to add. Keep
going around the table seeking input from each
team member until there are no new inputs.
9. Take a fifteen-minute break.
10. Ensure that there is common understanding on all
ideas. If necessary, clarify and restate some ideas.
11. With the agreement of the idea generator and team
consensus, eliminate the ideas that were thrown in
for fun, are not applicable to the operational state-
ment, or reflect a one-person issue that is not con-
ducive to improving team performance. Any of the
latter issues must be handled carefully by a skilled
facilitator.
12. With team consensus, group like ideas into one
statement.
The list of all items that could affect poor performance
as defined by the operational statement has now been
generated. At this point in time, all ideas have equal im-
102
A S
I X
S
I G M A
C
O N T I N U O U S
I
M P ROV E M E N T
T
E A M I N G
M
O D E L
9872 Demystifying Six Sigma 2/22/03 8:52 PM Page 102
portance. At the end of Step 3, we will prioritize the ideas
from the most likely to the least likely root cause.
Fishbone Diagram
An alternative, and often complementary, method for gen-
erating the list of potential root causes is the fishbone dia-
gram. In honor of its inventor, it is sometimes called an
Ishikawa diagram. The methods for collecting the ideas
and the rules for conducting a fishbone diagram session are
the same as those for a brainstorming session. The fishbone
diagram adds a structure to the generation of ideas. Some
people come up with ideas easier in the unstructured
brainstorming methodology, while others find it easier to
come up with ideas while looking at the structure of a fish-
bone diagram.
A blank fishbone diagram is shown in Figure 6-5. The
operational statement is written within the “head” of the
fish. The four major “bones” of the fish are created and
S
T E P
3 : I
D E N T I F Y
P
O T E N T I A L
C
AU S E S
103
Materials
Methods
Manpower
Machines
Operational
Statement
Manpower
Machines
Figure 6-5. Blank fishbone diagram.
9872 Demystifying Six Sigma 2/22/03 8:52 PM Page 103
labeled for the four generic inputs that are required to
successfully complete any operation in manufacturing,
administration, or services. These are materials, meth-
ods, manpower (we have kept the masculine form to
preserve the alliteration), and machines.
As team members come up with ideas, they are grouped
onto one of the major bones. These sub-bones can also
generate associated ideas that will become sub-bones to
the sub-bones. In this manner, the skeleton of the fish is
filled in. A simple example of a completed fishbone dia-
gram is shown in Figure 6-6.
Often teams will conduct both a brainstorming session
and a fishbone diagram. These are done at two separate
meetings at least one week apart. This gives everyone an
opportunity to participate using the methodology that
they are most effective with. A lot of the ideas will be re-
dundant; however, some additional ones will be gener-
ated that did not come up using the other method. At
the end of using either method or both methods, the
team will have generated a list of all of the things that
104
A S
I X
S
I G M A
C
O N T I N U O U S
I
M P ROV E M E N T
T
E A M I N G
M
O D E L
Materials
Methods
Bin contents
Logging of data
Boxes inadequate
Delays by shipper
Bar coding
Data entry counts
Invoice counts wrong
Scale calibration
Improper training
Missing tools
Manpower
Machines
7 percent of the
shipments to
customers contain
entry errors.
Figure 6-6. Sample fishbone diagram.
9872 Demystifying Six Sigma 2/22/03 8:52 PM Page 104

could be contributing to “what is not good enough
about what.”
Prioritizing
Generally, the two methods for idea generation will yield
somewhere between twenty-five and fifty ideas. Remem-
ber that you cannot do everything at once, but you can do
something at once. The team must prioritize its activities.
By using consensus and voting techniques, the team must
pare the list of likely root causes down to the three to five
most likely. It has been my experience that teams always
identify the correct items to improve. I know that they
were the correct ones because when they were improved,
the desired results were attained.
On flipchart paper taped to the wall, display all of the
ideas that were generated during brainstorming and/or
fishbone diagramming. Allow ample time and room for
consensus-building debates. When everyone is satisfied
that they understand each of the idea statements and how
they could bring about the desired results, begin the vot-
ing process. Each team member should be given ten votes.
Team members can vote for as many as ten different ideas,
or place all ten of their votes on a single idea, as they wish.
Votes can be cast by giving each team member ten sticky
dots which they will paste next to the ideas that they are
voting for. If you don’t have sticky dots, give each team
member a marking pen and have them cast their votes by
putting a total of ten hash marks next to the ideas that they
are voting for. Ties can be broken with a show-of-hands
vote.
Sometimes to get the required resolution, it is necessary
S
T E P
3 : I
D E N T I F Y
P
O T E N T I A L
C
AU S E S
105
9872 Demystifying Six Sigma 2/22/03 8:52 PM Page 105

to follow the first round of voting with a second round of
voting. It will be obvious to the team leader and facilita-
tor when this is required.
Here is an example of the output of a brainstorming
session. It was generated by a team that was aiming to re-
duce the amount of time it took to complete required
reliability testing on electronic parts, prior to release for
marketing.
Potential root causes generated from brainstorming and
fishbone diagramming were:
1. Lack of understanding
2. Work not distributed evenly
3. Computer incompatibility
4. Standard sample sizes
5. Standardize data analysis
6. Midstream changes
7. Grumpy people
8. Only one shift
9. Car problems—late for work
10. Inferior equipment
11. No documented processes
12. Delayed report writing
13. Engineer stressed out
14. Communication gaps
15. Lack of team work
16. Too many projects
17. Project process flow
18. Need new engineer
19. Need automation
106
A S
I X
S
I G M A
C
O N T I N U O U S
I
M P ROV E M E N T
T
E A M I N G
M
O D E L
9872 Demystifying Six Sigma 2/22/03 8:52 PM Page 106

20. Need operating instructions
21. Equipment calibration
22. Lack of training
23. Too many hurdles
24. Not in job description
25. Summary data late
26. Mailing list incomplete
27. Checklist for report content
28. No scheduling system
29. Lack of test fixtures
30. Special requests
After prioritizing the list, the top four items that the
team began action to improve were:
1. Checklist for report content
2. No documented processes
3. Communication gaps
4. Standardize data analysis
Before you leave Step 3, have you:
❑ Flowcharted the system?
❑ Completed action items identified from flow-
charting?
❑ Completed a brainstorming session?
❑ Completed a fishbone diagram?
❑ Prioritized the potential causes?
❑ Selected the three to five most likely potential
causes?
S
T E P
3 : I
D E N T I F Y
P
O T E N T I A L
C
AU S E S
107
9872 Demystifying Six Sigma 2/22/03 8:52 PM Page 107

108
C H A P T E R 7
S t e p 4 : I n v e s t i g a t i o n
a n d R o o t C a u s e
I d e n t i f i c a t i o n
Action Plan
You have identified “what is not good enough about what.”
You have gathered the necessary data. In most cases there
was historical data available, and in some cases teams had to
collect new data. Using Pareto charts, you have analyzed
the data to identify the major areas of customer dissatisfac-
tion. Using brainstorming and fishbone diagrams, you have
identified what the team believes to be the top reasons—
the root causes—that are affecting the desired results. By
getting to this point, the team has been busy and has com-
pleted many tasks. The emphasis now shifts to a focused in-
vestigation of the potential root causes. This requires a
focused action plan. Action plans have four major compo-
9872 Demystifying Six Sigma 2/22/03 8:52 PM Page 108

nents. They are WHAT is to be done, WHO will do it,
WHEN is it scheduled to be done, and what is the STA-
TUS of action items, especially the overdue ones.
An action plan document looks like this:
Actions
Responsible
Due Date
Completed
Status
WHAT is
WHO is it
WHEN is
Actual
Comments,
to be done
assigned to
completion
completion
historical
schedule
date
notes, etc.
For some action items, the responsible person(s) may be
the entire team. A team cannot assign action items to non-
team members. When information or action is required
from a nonteam member, one of the team members must
take responsibility to attain the information or action from
that person.
A sample action plan is shown in Figure 7-1. This ex-
ample is an abbreviated action plan of a team that was
chartered with eliminating nonconforming product from
reaching the customers. The team’s initial review of the
data showed that all of the nonconformances that oc-
curred were caused by human error. The output of their
brainstorming session and subsequent prioritization of
most likely causes was that working conditions and prac-
tices in the factory made it very difficult to do error-free
work. Notice that they concentrated their actions on
training, working conditions, factory cleanliness, and ease
of material handling.
Note that the team was concentrating its investigations
and fixes on building quality into the product. They did
not fall into the trap of assigning blame on an individual;
S
T E P
4 : I
N V E S T I G AT I O N A N D
R
O O T
C
AU S E
I
D E N T I F I C AT I O N
109
9872 Demystifying Six Sigma 2/22/03 8:52 PM Page 109
Action
Responsible
Due Date
Completed
Status
1. Read current procedures applicable to the operation
Team
Mo/Day/Yr
Completed by all except Mary. Her new
commit date is Mo/Day/Yr.
2. Provide ideas for more effective job training
Team
Mo/Day/Yr
3. Review forms in factory for completeness and
applicability
George
Mo/Day/Yr
Mo/Day/Yr
16 existing forms reviewed. 3 of them need
modification and updating.*
4. Create a training video for factory operators
Mary
Mo/Day/Yr
Mary to meet with manufacturing training
department.
5. Install a white-board to communicate procedural
changes
Ann
Mo/Day/Yr
6. Inform each operator of white-board location
Ann
Mo/Day/Yr
7. Present at weekly production meetings to keep
department informed of team activities
John
Ongoing
8. Modify transportation carts for universal use
Joyce
TBD**
Joyce to obtain commitment from
maintenance.
9. Design check sheets for final inspection
George
Mo/Day/Yr
Data will be collected and reviewed weekly.
10. Train final inspectors on use of check sheets and obtain
their commitment to use them
George
Mo/Day/Yr
11. Review product handling practices at manual operations
Mary
Mo/Day/Yr
12. Initiate factory cleanliness program
John
Mo/Day/Yr
* Now that this action item has been completed, it identified the need for new actions. There are three forms that need to be redone and installed on the factory
floor, which will create three new action items to be added to the list as actions 13,14, and 15.
** TBD stands for To Be Determined. Joyce can't provide a commit date until she has talked to the maintenance supervisor to see when he can schedule the
required modifications.
* Now that this action has been completed, it identified the need for new actions. There are three forms that need to be redone and installed on the
factory floor, which will create three new action items to be added to the list as actions 13, 14, and 15.
** TBD stands for To Be Determined. Joyce can’t provide a commit date until she has talked to the maintenance supervisor to see when he can sched-
ule the required modifications.
Figure 7-1. Sample action plan.
9872 Demystifying Six Sigma 2/22/03 8:52 PM Page 110

rather, they correctly concentrated on fixing the system.
There was a final inspection in place where detected re-
jects were removed and reworked for compliance before
they were shipped to the customer. It is well known that
you cannot inspect quality in, and even if you could, you
wouldn’t want to. It is a very expensive, nonvalue-add step
in any manufacturing flow. Also, the team was not placing
blame on any other employee in the company. They were
concentrating on root cause reasons of why nonconform-
ing product was being generated, and they were concen-
trating on positive solutions.
Fix Problems—Not Blame
Action plans are “living documents.” As the name sug-
gests, a living document has a life of its own. These Con-
tinuous Improvement programs often take months before
all the root causes are discovered, solutions are put in
place, and the desired results are obtained. As some actions
are completed, they will generate new actions. In the
sample action plan (Figure 7-1), completion of Action 3
resulted in the generation of three new action items. Also,
as the team gets deeper into the investigation phase, they
will discover new things that need to be done and new in-
formation that must be collected. All of this needs to be
captured into a single action plan. As actions are com-
pleted, drop them from the action plan by archiving the
old version. As needs for new actions are discovered, add
them to the action plan. The action plan archives become
the history of the team’s activities.
S
T E P
4 : I
N V E S T I G AT I O N A N D
R
O O T
C
AU S E
I
D E N T I F I C AT I O N
111
9872 Demystifying Six Sigma 2/22/03 8:52 PM Page 111

Check Sheet
As you continue with your investigation into root causes
that are preventing the desired performance, you will
need to collect and analyze data. The tool for collecting
data is the check sheet. The tools for analyzing the data are
stratification, histograms, and scatter diagrams. A check
sheet is a form used to collect data. You must understand
your purpose for collecting the data. What questions are
you trying to answer, or what are you attempting to get a
more detailed picture of? Before you design the form, you
must determine what kind of data you are attempting to
collect, where the data is to be collected, and the time pe-
riod over which you want to collect the data. You should
have a good idea of what your actions will be depending
on what the data shows you. This will help guide you in
how to design the check sheet form and where to collect
the data. You must also predetermine how you will com-
municate the data.
The steps in creating and utilizing a check sheet are:
1. Create the form to collect the data, i.e., the check
sheet.
2. Determine whether you want to collect data by
shifts, by production line, or by individuals.
3. Determine the collection points.
4. Place the check sheet in the active work area(s).
5. Train the workers in how to use the check sheets,
and obtain their commitment to fill in the requested
data diligently.
112
A S
I X
S
I G M A
C
O N T I N U O U S
I
M P ROV E M E N T
T
E A M I N G
M
O D E L
9872 Demystifying Six Sigma 2/22/03 8:52 PM Page 112

6. Collect the information. Check sheets should be
collected daily or weekly, depending on the activity
level and the amount of data that can be entered
into one check sheet form.
7. Continuously review whether the check sheet is
working as you intended. If not, modify it as nec-
essary.
8. Digest and analyze the data.
9. Determine the best way to display the data. Is it
better to convert it to a Pareto diagram, or a his-
togram? Will the data be used to identify stratifica-
tion within the operation?
10. Communicate the findings in your data, especially
to those who are collecting it for you.
11. Determine for how long you must collect the data.
Check Sheet Example 1
Your company makes bicycles that are sold through chain
stores. There have been many customer complaints about
defects, which have resulted in returned product. To get
real-time visibility of what types of defects are being pro-
duced in the factory, you initiate a final inspection and
place a check sheet there. Sales and customer service tell
you that there have been many reasons for the complaints.
They include bent tire rims, scratched paint, paint runs,
dents in the frame, bent frames, inoperative brakes, and
inoperative gears.
S
T E P
4 : I
N V E S T I G AT I O N A N D
R
O O T
C
AU S E
I
D E N T I F I C AT I O N
113
9872 Demystifying Six Sigma 2/22/03 8:52 PM Page 113

The check sheet looks like this and is placed at final in-
spection.
Final inspectors have been asked to place an X in the
occurrence column for each defect found.
The check sheets are collected each day, and a team
member has been keeping a running tally of the defects
observed at final inspection. After three weeks of data col-
lection and accumulation, the tallied check sheet looks
like this.
114
A S
I X
S
I G M A
C
O N T I N U O U S
I
M P ROV E M E N T
T
E A M I N G
M
O D E L
Final Product Defects
Location:
Final Inspection
Collection Time Period
Start Date
End Date
Defect
Occurrence
Bent Tire Rim
Scratched Paint
Paint Runs
Dents in Frame
Bent Frame
Inoperative Brakes
Inoperative Gears
Final Product Defects
Location:
Start Date
End Date
Final Inspection
Collection Time Period
mm/dd/yy
mm/dd/yy
Defect
Occurrence
Bent Tire Rim
XXXX
Scratched Paint
XXXXX XXXXX XXXXX
Paint Runs
XXXX
Dents in Frame
XXXXX XXX
Bent Frame
XXXXX XX
Inoperative Brakes
XX
Inoperative Gears
X
9872 Demystifying Six Sigma 2/22/03 8:52 PM Page 114

It is clear that these defects are occurring in the factory.
It is also clear that most of the defects are occurring in the
framing shop where the frames are built and painted. Paint
runs, bent frames, and dents in the frame can only occur
in the framing shop. Scratched paint could occur in the
framing shop or in subsequent assembly operations. It is
decided that a check sheet must be created and placed at
the point where frames are transferred from the framing
shop to assembly. Also, the manager of the framing shop
wants to be able to see which shifts are producing the de-
fective frames.
The team creates a check sheet for the framing shop
that looks like this.
Note: Use X for day shift, 0 for second shift, and T for third shift.
S
T E P
4 : I
N V E S T I G AT I O N A N D
R
O O T
C
AU S E
I
D E N T I F I C AT I O N
115
Framing Shop Outgoing Defects
Location:
Framing Shop
Collection Time Period
Start Date
End Date
Defect
Occurrence
Scratched Paint
Paint Runs
Dents in Frame
Bent Frame
9872 Demystifying Six Sigma 2/22/03 8:52 PM Page 115

After three weeks of data collection, the check sheet
looks like this.
Note: Use X for day shift, 0 for second shift, and T for third shift.
The incidence of scratches is much less than was found
at final inspection, which indicates that most of the scratch-
ing is occurring during assembly. The team will initiate an
investigation with the assembly workers to investigate this.
The paint runs and dents are prevalent on third shift. This
is the shift where most new hires start out, which suggests
a need for training. The team members will talk with the
third-shift personnel to determine why so many mistakes
are being made and what training or assistance they need
to rectify the problems. The bent frame occurrences are
spread evenly over the three shifts. This indicates some
problems with the jigs and presses used to form the
frames. The team will contact the maintenance depart-
ment to assist with investigating this.
Check Sheet Example 2
Your company makes sub-assemblies for the electronics
industry. The product is not standard; each customer has
116
A S
I X
S
I G M A
C
O N T I N U O U S
I
M P ROV E M E N T
T
E A M I N G
M
O D E L
Framing Shop Outgoing Defects
Location:
Framing Shop
Collection Time Period
Start Date
End Date
Defect
Occurrence
Scratched Paint
X T
Paint Runs
T T T T T X T T T T T T T T T
Dents in Frame
T T O T X T T T
Bent Frame
T T O X X O T
9872 Demystifying Six Sigma 2/22/03 8:52 PM Page 116

unique requirements for each order placed. The parts are
built to order, and cycle time is critical. Orders are re-
ceived, processed, and entered at headquarters in the
United States. The manufacturing process starts in the
United States, where sub-components are prepared, and
then shipped to Honduras for final assembly. From there
the sub-assemblies are distributed to a worldwide cus-
tomer base.
Your commitment, and the customers’ expectation, is
that orders will be filled within four working days. Perfor-
mance has not been good; over 10 percent of the orders
are shipped late. This is primarily caused by delays clearing
product through Honduran customs.
The shipping personnel in the United States are re-
sponsible for packaging and shipping the sub-components
with the proper paperwork. They are required to send a
“prealert” to the receiving personnel in Honduras so that
they are aware of incoming shipments and can make sure
that they are at customs to receive them as they clear. The
company always uses the same air carrier, and the ship-to
address is always the same.
Working together, the U.S. and Honduras shipping
and receiving personnel form a team to eliminate these
delays at Honduran customs. In order to clear customs,
each shipment must have the correct count of parts, the
value price of the shipment must be correct, the part
number and PO number must match between the pa-
perwork and the parts, and the shipment must contain
two sets of documents, one in Spanish and one in Eng-
lish. Also, to ensure fast delivery, the Honduran person-
nel must receive a “prealert.”
To determine why the product is being delayed at cus-
S
T E P
4 : I
N V E S T I G AT I O N A N D
R
O O T
C
AU S E
I
D E N T I F I C AT I O N
117
9872 Demystifying Six Sigma 2/22/03 8:52 PM Page 117
toms, the team pulls the records from the previous month
and creates a check sheet that looks like this.
A review of the records yielded this completed check
sheet:
Subsequent investigation found that the operating pro-
cedures controlling the shipments to Honduras did not
include the requirement for issuing “prealerts.” Some of
118
A S
I X
S
I G M A
C
O N T I N U O U S
I
M P ROV E M E N T
T
E A M I N G
M
O D E L
Product Delays at Customs
Location: Honduras
Collection Time Period
July Records
Reason
Occurrence
Wrong PO Number
No Prealert
Wrong Part Number
Wrong Count
No Spanish Description
Wrong Pricing
Product Delays at Customs
Location: Honduras
Collection Time Period
July Records
Reason
Occurrence
Wrong PO Number
XX
No Prealert
XXXXX XXXXX XXXXX X
Wrong Part Number
Wrong Count
XXXXX XXXXX XXXXX XXXXX XXXXX XXXX
No Spanish Description X
Wrong Pricing
X
9872 Demystifying Six Sigma 2/22/03 8:52 PM Page 118

the more experienced personnel knew that they were
needed, but not all employees did. The requirement for
“prealerts” was added to the operating procedures and all
employees were trained.
Another problem that surfaced was caused by the need
for speedy processing. Everyone in the warehouse knew
that cycle time was paramount. In an attempt to keep
things moving fast, they would send shipments even
though they did not have enough parts. All personnel were
now informed of the export regulation requirements, and
this practice was discontinued.
Check Sheet Example 3
Your department receives large runs of piping that must be
cut to length and delivered to final assembly, where they
are installed into the final product. The specification is that
each pipe must be 10 inches long plus or minus
1
⁄
4
inch.
Thus, the lower specification limit (LSL) is 9
3
⁄
4
inches, and
the upper specification limit (USL) is 10
1
⁄
4
inches. There
have been many complaints from assembly that the pipes
are not the correct length. Your customer, in this case an
internal customer, is angry.
You have gauging that is capable of measuring the
pipes to the nearest sixteenth of an inch. Because em-
ployees believed that the cutting jig was accurate enough
to make outgoing measurements unnecessary, they never
used the gauge. It is now apparent that each piece must
be measured before it leaves the shop, and you need to
get data that will indicate what the underlying problem
may be.
S
T E P
4 : I
N V E S T I G AT I O N A N D
R
O O T
C
AU S E
I
D E N T I F I C AT I O N
119
9872 Demystifying Six Sigma 2/22/03 8:52 PM Page 119
You create a check sheet that looks like this.
After a week of measuring all of the pipes leaving the
cutting shop, the check sheet filled in like this.
120
A S
I X
S
I G M A
C
O N T I N U O U S
I
M P ROV E M E N T
T
E A M I N G
M
O D E L
Gas Pipe Section Length
Location:
Collection Time Period
Start Date:
End Date:
Cutting Shop
dd/mm/yy
dd/mm/yy
Measurement
Occurrence
<9
1
⁄
2
XXX
9
1
⁄
2
XXXXXXXXX
Gas Pipe Section Length
Location:
Collection Time Period
Start Date:
End Date:
Cutting Shop
Measurement
Occurrence
<9
1
⁄
2
9
1
⁄
2
9
9
⁄
16
9
5
⁄
8
9
11
⁄
16
9
3
⁄
4
9
13
⁄
16
9
7
⁄
8
9
15
⁄
16
10
10
1
⁄
16
10
1
⁄
8
10
3
⁄
16
10
1
⁄
4
10
5
⁄
16
10
3
⁄
8
10
7
⁄
16
10
1
⁄
2
>10
1
⁄
2
9872 Demystifying Six Sigma 2/22/03 8:52 PM Page 120

The data shows that, in general, the process is capable
of producing pipe lengths to specification, and for some
reason about 17 percent of the pipes are too short for use.
The pipe lengths were produced on two cutting machines
operated for one eight-hour shift each day. Subsequent
investigation (see “stratification” examples below) showed
that the short pipes were being produced from one ma-
chine (Machine 1) and were most prevalent toward the
end of the day. Further investigation revealed that this ma-
chine produced the most parts.
The operator of Machine 1 took great pride in his abil-
ity to produce more parts than his coworker. He had re-
ceived recognition and praise from management for his
S
T E P
4 : I
N V E S T I G AT I O N A N D
R
O O T
C
AU S E
I
D E N T I F I C AT I O N
121
9
9
⁄
16
XXXXXXXXXX
9
5
⁄
8
X
9
11
⁄
16
X
9
3
⁄
4
XX
9
13
⁄
16
XXXXXXXXXXXXXX
9
7
⁄
8
XXXXXXXXXXXXXXXXXX
9
15
⁄
16
XXXXXXXXXXXXXXXXXXXXXXXXXXXX
10
XXXXXXXXXXXXXXXXXXXXXXXXXXXXXXXXXXX
10
1
⁄
16
XXXXXXXXXXXXXXXXXX
10
1
⁄
8
XXXXXXXXXXXX
10
3
⁄
16
XXXXXXX
10
1
⁄
4
X
10
5
⁄
16
10
3
⁄
8
10
7
⁄
16
10
1
⁄
2
>10
1
⁄
2
9872 Demystifying Six Sigma 2/22/03 8:52 PM Page 121

high productivity rate. Unfortunately, it was discovered
that as the day wore on and he was not achieving the out-
put that he expected of himself, he would omit the criti-
cal step of cleaning the end plates that clamped the pipe in
place. Cutting oil and shavings debris would collect on
these plates, and if not cleaned between every cut, the
piping would be mounted short. After being counseled on
the results of his actions and trained, the operator imme-
diately began religiously following all necessary steps, and
the problem went away.
Stratification
Stratification means to look for differences in the sources
of variation observed on the output of an operation. Usu-
ally, the first step in establishing a check sheet or in ana-
lyzing the output data is to think of the output as coming
from one homogeneous process. However, this is seldom
the case. Most likely there is more than one worker pro-
ducing the product or service. There may be inputs from
different suppliers, different inputs to the process, or mul-
tiple machines. The quality of the product or service may
depend on the shift on which it was produced or on the
time of day within the shift that it was produced.
You will need to consider these variations in the process
and analyze your data accordingly. Sorting data by varia-
tions in worker, supplier, input, machine, shift, time of day,
and/or date will provide stratified information. In the
Check Sheet Example 3, after reviewing the initial data, the
team decided to look for stratification. Using the same
check sheet, they used different symbols to indicate the two
machines that were producing the lengths of gas pipe. This
showed that stratification was occurring.
122
A S
I X
S
I G M A
C
O N T I N U O U S
I
M P ROV E M E N T
T
E A M I N G
M
O D E L
9872 Demystifying Six Sigma 2/22/03 8:52 PM Page 122

Stratification Example 1
Note: O = Machine 1
X = Machine 2
Clearly all of the nonconforming parts are coming
from Machine 1. This information is a big step toward
identifying the root cause of the problem.
To determine whether there was any variation caused
by the time of day that the pipes were cut to length, the
team then decided to take a closer look at the output from
S
T E P
4 : I
N V E S T I G AT I O N A N D
R
O O T
C
AU S E
I
D E N T I F I C AT I O N
123
Gas Pipe Section Length
Location:
Collection Time Period
Start Date:
End Date:
Cutting Shop
dd/mm/yy
dd/mm/yy
Measurement
Occurrence
<9
1
⁄
2
OOO
9
1
⁄
2
OOOOOOOOO
9
9
⁄
16
OOOOOOOOOO
9
5
⁄
8
O
9
11
⁄
16
O
9
3
⁄
4
XO
9
13
⁄
16
XXXXXXOOOOOOOO
9
7
⁄
8
XXXXXXXXXXOOOOOOOO
9
15
⁄
16
XXXXXXXXXXXXXXXXOOOOOOOOOOOOOOOO
10
XXXXXXXXXXXXXXXXXXXXXXXXXXXOOOOOOOOOOOO
10
1
⁄
16
XXXXXXXXXXXXOOOOOO
10
1
⁄
8
XXXXXXXXXOOO
10
3
⁄
16
XXXXXOO
10
1
⁄
4
X
10
5
⁄
16
10
3
⁄
8
10
7
⁄
16
10
1
⁄
2
>10
1
⁄
2
9872 Demystifying Six Sigma 2/22/03 8:52 PM Page 123
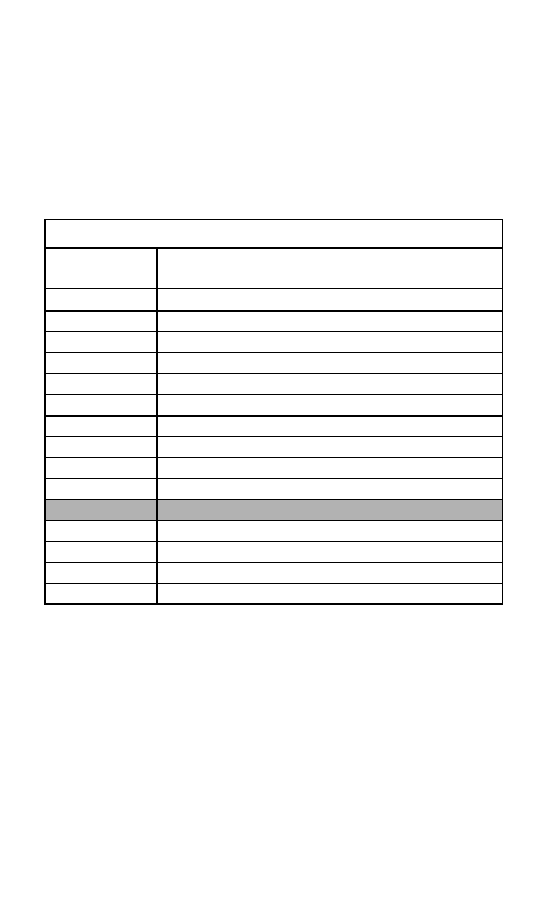
Machine 1. The normal shift hours were from 7
AM
until
4
PM
, with an hour off for lunch from noon to 1
PM
. They
decided to fill in the check sheet using numbers to indi-
cate the hour during which the pipes were cut.
This further stratification of the data indicates that the
short lengths are being produced from Machine 1 predom-
inantly in the late afternoon. Armed with this, the team was
able to quickly identify the root cause and implement a per-
manent corrective action.
Stratification Example 2
In another example, the supervisor of production control
inventory utilized stratification. The system that was in
place was for the receiving dock to accept large shipments
124
A S
I X
S
I G M A
C
O N T I N U O U S
I
M P ROV E M E N T
T
E A M I N G
M
O D E L
Gas Pipe Section Length
Location:
Collection Time Period
Start Date:
End Date:
Cutting Shop
dd/mm/yy
dd/mm/yy
Measurement
Occurrence
<9
1
⁄
2
11, 2, 3
9
1
⁄
2
1, 11, 1, 2, 2, 3, 3, 2, 11
9
9
⁄
16
2, 2, 2, 3, 3, 2, 3, 11, 2, 3
9
5
⁄
8
3
9
11
⁄
16
3
9
3
⁄
4
3
9
13
⁄
16
3, 2, 10, 7
9
7
⁄
8
7, 7, 8, 8, 8, 9, 10, 11
9
15
⁄
16
7, 8, 8, 8, 8, 9, 9, 9, 9, 10, 10, 10, 10, 11, 11, 11
10
7, 8, 8, 9, 9, 9, 9, 10, 10, 10, 9
10
1
⁄
16
7, 7, 8, 9, 10, 11
10
1
⁄
8
7, 7, 11
10
3
⁄
16
7, 9
10
1
⁄
4
9872 Demystifying Six Sigma 2/22/03 8:52 PM Page 124

of piece parts each day that had to be dispersed to three
production lines. Upon receipt, the receiving dock would
e-mail production control asking for instructions on the
number of piece parts to be delivered to each production-
line inventory point. The commitment was that this in-
formation would be provided within ten minutes. To
keep inventory costs minimal while maintaining produc-
tion flow, the quickness of this response was critical.
The receiving dock manager received complaints that
many of these responses were not happening within ten
minutes. After she contacted the supervisor of inventory
control about this, he decided to establish check sheets on
the response times for each of the three people assigned
the responsibility for these responses. This initial data col-
lection by individual would provide stratification. A re-
view of the data provided the following information.
S
T E P
4 : I
N V E S T I G AT I O N A N D
R
O O T
C
AU S E
I
D E N T I F I C AT I O N
125
Inventory Dispersal Instructions Response Time
Location:
Collection Time Period: Last Two Months of Data
Inventory Control
Response Time
Bob
Mary
Gene
<5 min
X
5 min
X
X
6 min
XXX
XX
XXXXX
7 min
XXXXXXX
XXX
XXXXX
8 min
XX
XX
XXX
9 min
XX
X
X
10 min
11 min
X
12 min
13 min
XX
14 min
XX
>15 min
X
9872 Demystifying Six Sigma 2/22/03 8:52 PM Page 125

The data shows that all responses over ten minutes
were processed by Mary. Can you conclude from this
that Mary is a poorer performer than Bob or Gene? No!
Mary was the most experienced and knowledgeable em-
ployee, and investigation revealed that the requests that
were incomplete or had erroneous information were
passed to Mary for processing. It turned out that the root
cause of these problems actually resided with the receiv-
ing dock personnel. When they e-mailed the requests,
they often inputted wrong part numbers or wrong quan-
tities. The manager of the receiving dock thanked
inventory control for this information and initiated a
corrective action team of her own.
Histogram
Histograms are another tool for graphically displaying
data. They are used exclusively for variable data. The data
that is displayed on a histogram can come from a check
sheet or from historical data. Cases where you will apply
histograms include manufacturing operations where a di-
mension or measurement is distributed around a central
target value with upper and lower specification limits.
They also include cases from manufacturing or adminis-
trative operations where you are attempting to stay either
above or below a minimum or maximum value.
A histogram is used to compare the distribution of data
to what is expected, compare the distribution to the spec-
ification, and determine what the data image is telling you.
In Sample 1 (Figure 7-2), the process is centered on tar-
get and is within specification limits. This is the ideal data
footprint.
126
A S
I X
S
I G M A
C
O N T I N U O U S
I
M P ROV E M E N T
T
E A M I N G
M
O D E L
9872 Demystifying Six Sigma 2/22/03 8:52 PM Page 126
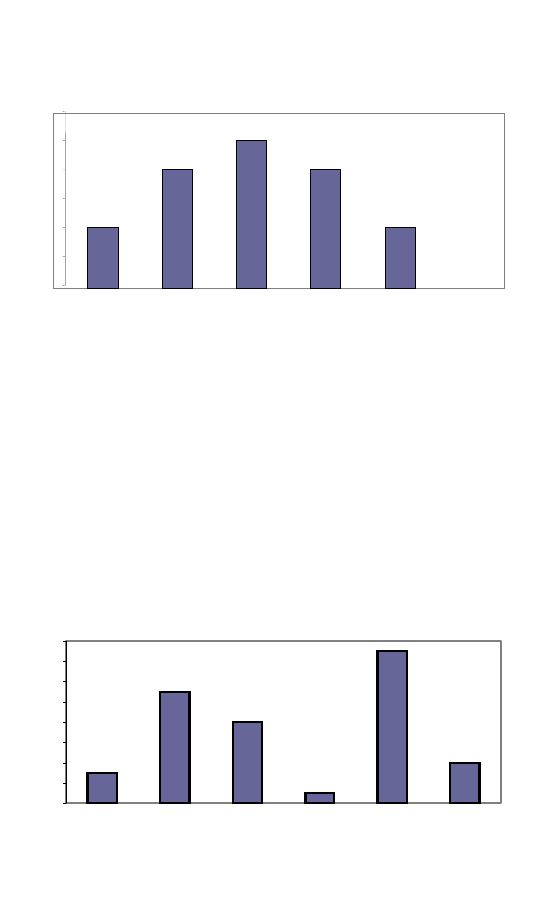
In Sample 2 (Figure 7-3), the process output is being
defined by two sets of circumstances. A stratification study
must be completed.
In Sample 3 (Figure 7-4), the process is, for the most
part, in control and within specifications; however, several
of the outputs are abnormally high. An investigation must
be completed to determine and eliminate the root cause
of these special results.
When creating a histogram, it is important to sort
the data into the right number of groups. If you spread
S
T E P
4 : I
N V E S T I G AT I O N A N D
R
O O T
C
AU S E
I
D E N T I F I C AT I O N
127
target
0
5
10
15
20
25
30
Figure 7-2. Sample histogram 1.
0
2
4
6
8
1 0
1 2
1 4
1 6
Figure 7-3. Sample histogram 2.
9872 Demystifying Six Sigma 2/22/03 8:52 PM Page 127
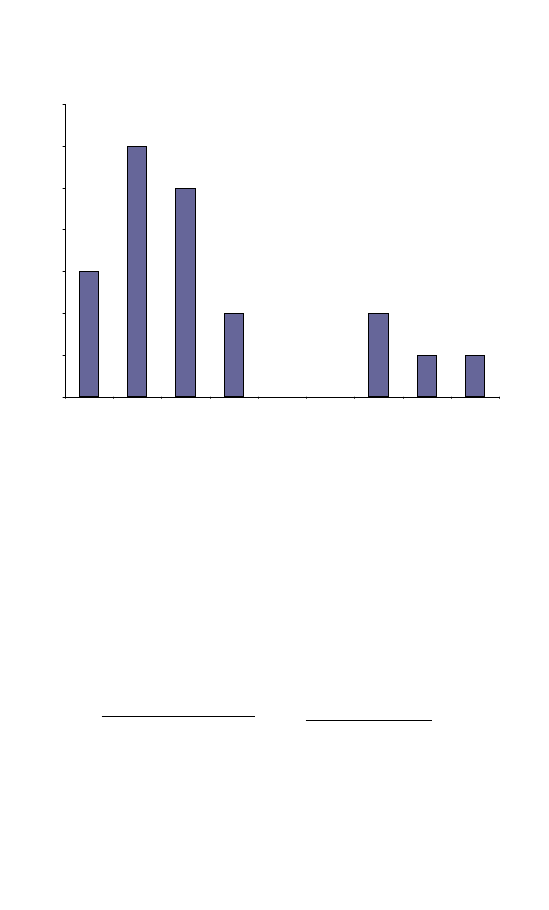
the histogram out with too many groups, you will end
up with a flat distribution that will provide no picture of
what the data distribution looks like. Similarly, if you
have too few groups, the data will all be bunched to-
gether. Again, you will have no picture of the data dis-
tribution.
The rule of thumb on how many groups to separate the
data into is:
Number of Data Points
Number of Groups
<50
5 to 7
50 to 100
6 to 10
100 to 250
7 to 12
>250
10 to 20
128
A S
I X
S
I G M A
C
O N T I N U O U S
I
M P ROV E M E N T
T
E A M I N G
M
O D E L
0
2
4
6
8
1 0
1 2
1 4
A
B
C
D
E
F
G
H
I
Figure 7-4. Sample histogram 3.
9872 Demystifying Six Sigma 2/22/03 8:52 PM Page 128

Histogram Example
Take an example of a process that is designed to fill con-
tainers to a weight of 150 pounds. The team wants to de-
termine whether the process is targeted correctly and
whether the process is under control. The team weighs
the contents of forty-two containers and obtains the fol-
lowing data:
Container Content Weight in Pounds
102
138
132
114
125
123
164
103
162
131
186
192
192
116
187
134
142
137
147
153
144
163
147
151
158
158
182
176
146
143
154
136
154
127
172
145
146
168
156
155
177
196
The first step in creating a histogram is to determine
into how many divisions we want to group the data and
the range of each division. Using the rule of thumb for
histograms, these forty-two data points will be split into
five divisions.
The next step is to determine the overall range of the
histogram. The lowest reading is 102 and the highest
reading is 196, so the overall range of the histogram will
be from 100 to 200. The range is 100 pounds wide, and
we want to divide it into five divisions. By dividing 100 by
5, we determine that each division will be 20 pounds
wide. Thus, the divisions will be:
S
T E P
4 : I
N V E S T I G AT I O N A N D
R
O O T
C
AU S E
I
D E N T I F I C AT I O N
129
9872 Demystifying Six Sigma 2/22/03 8:52 PM Page 129

100 to 120 pounds
120 to 140 pounds
140 to 160 pounds
160 to 180 pounds
180 to 200 pounds
Next we need to count how many data points are in each
division.
Division
Data Points
Total
100–120
102, 103, 114, 116
4
120–140
138, 136, 132, 131, 134, 127, 125, 123, 137
9
140–160
147, 158, 154, 146, 153, 158, 144, 154, 156, 155,
142, 147, 146, 151, 143, 145
16
160–180
164, 168, 162, 163, 176, 172, 177,
7
180–120
192, 187, 186, 192, 196, 186
6
The histogram is built by creating bars the width of
each division and the height of the total count within
each division.
The sample histogram in Figure 7-5 provides a good
picture of how the process is running. It is centered on the
target of 150 pounds, and looks to be a normal distribu-
tion around that target. However, a plus and minus fifty-
pound variation seems too high. The team will need to
determine how to make the process more repeatable so
that container weights are more consistent.
Scatter Diagram
When applying the six steps of continuous improvement,
you are investigating what is not good enough about a sys-
tem for accomplishing tasks or producing product or ser-
vice. Flowcharting, brainstorming, and fishbone diagrams
130
A S
I X
S
I G M A
C
O N T I N U O U S
I
M P ROV E M E N T
T
E A M I N G
M
O D E L
9872 Demystifying Six Sigma 2/22/03 8:52 PM Page 130

study the causes of poor performance at the system level.
Stratification and histograms study the causes of poor per-
formance at the individual operation or process step. Scatter
diagrams study the specific effect that one input variable
will have on the output of an operation or process step.
When creating a scatter diagram, you control one of
the input variables to a process or operation and measure
the performance of one of the output variables. The in-
put variable is referred to as the independent variable. It
is the x value and will be dispersed along the horizontal
axis of the graph. The output that is being measured is the
dependent variable. It is the y value and will be dispersed
along the vertical axis of the graph (see Figure 7-6).
Scatter Diagram Example
Your department is manufacturing specialty chemicals.
The customers have been complaining that there is too
much variation in concentration. The specification, and
customers’ requirement, is that concentration variation
shall be less than 5 percent. Your team has been working
to improve the performance. One of the things that you
S
T E P
4 : I
N V E S T I G AT I O N A N D
R
O O T
C
AU S E
I
D E N T I F I C AT I O N
131
0
2
4
6
8
10
12
14
16
18
100-120
120-140
140-160
160-180
180-200
Figure 7-5. Sample histogram 4.
9872 Demystifying Six Sigma 2/22/03 8:52 PM Page 131

suspect is that the higher the temperature of reaction the
wider the variation. At present the reaction temperature
is set at 110°C. You want to know how variation is af-
fected by either raising or lowering the reaction temper-
ature. The reaction temperature will be set at 100°C,
105°C, 110°C, 115°C, and 120°C. At each of these tem-
peratures, ten batches will be processed and variation
from batch to batch will be determined.
132
A S
I X
S
I G M A
C
O N T I N U O U S
I
M P ROV E M E N T
T
E A M I N G
M
O D E L
Y Ax
is
X Axis
Controlled Variable
Measured Variable
Independent Variable
Dependent Variable
The “X” value
The “Y” value
Horizontal Axis
Vertical Axis
Figure 7-6. Scatter diagram.
9872 Demystifying Six Sigma 2/22/03 8:52 PM Page 132
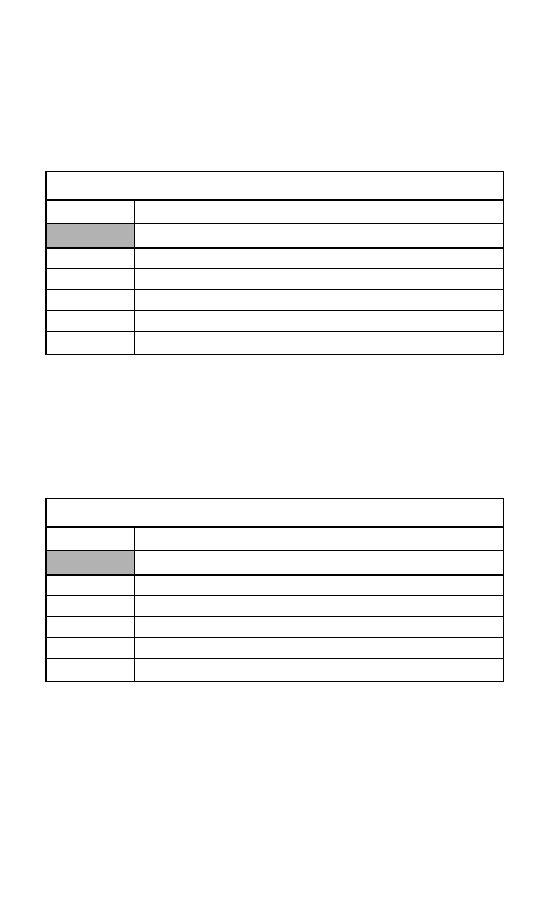
The form that you create to collect the data looks
like this.
After running the ten batches at each temperature and
determining the variation from batch to batch, the filled-
out form looks like this.
The scatter diagram created from this data (Figure 7-7)
confirms the team’s suspicion that the higher the temper-
ature, the greater the variation. Also, by looking at the
scatter diagram, it is easy to see that the temperature must
be kept below 105°C to keep the variation below 5 per-
S
T E P
4 : I
N V E S T I G AT I O N A N D
R
O O T
C
AU S E
I
D E N T I F I C AT I O N
133
Concentration Variation Study
Temperature
Percent Variation from Batch to Batch
1–2
2–3
3–4
4–5
5–6
6–7
7–8
8–9
9–10
100°C
105°C
110°C
115°C
120°C
Concentration Variation Study
Temperature
Percent Variation from Batch to Batch
1–2
2–3
3–4
4–5
5–6
6–7
7–8
8–9
9–10
100°C
2
3
1
1
2
1
3
2
1
105°C
3
5
4
5
3
3
3
5
4
110°C
4
4
4
5
6
6
7
6
5
115°C
5
5
6
4
7
6
7
5
4
120°C
7
8
6
8
7
8
8
6
7
9872 Demystifying Six Sigma 2/22/03 8:52 PM Page 133
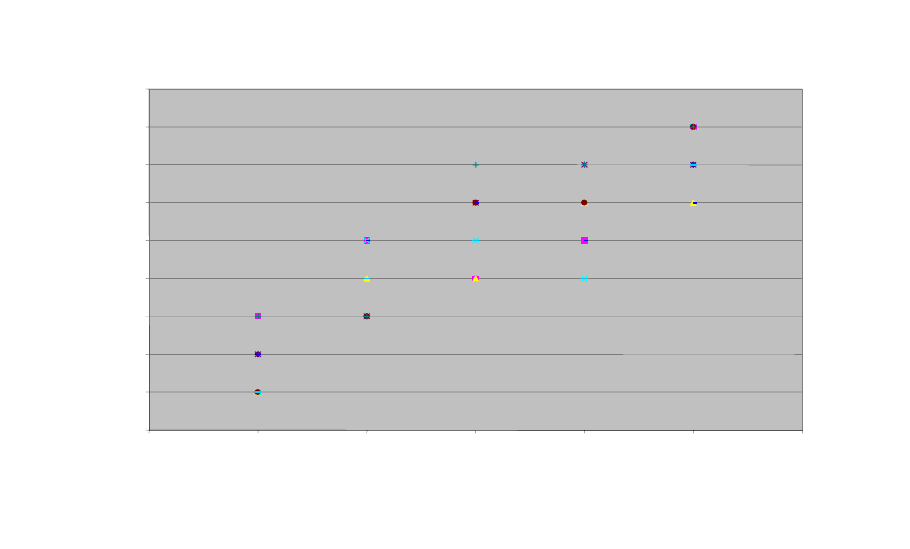
Batch to Batch Variation
0
1
2
3
4
5
6
7
8
9
95
100
105
110
115
120
125
Temperature in °C
%
V
a
ri
a
ti
o
n
Figure 7-7. Batch-to-batch variation.
9872 Demystifying Six Sigma 2/22/03 8:52 PM Page 134

cent. At 105°C there is a risk that the variation could go
above the 5 percent limit. At 100°C the variation is com-
fortably within the 5 percent limit.
The team will need to meet with management and
the team champion to discuss the next steps. Lowering
the temperature from 110°C to 100°C will solve the
variation problem, but it will slow down the production
rate. Working with production and engineering, the
team will need to decide the best course of action to
provide the best product to the customer while main-
taining the required output rate.
In this example, there are forty-five paired points: nine
each at five temperatures. The rule of thumb for scatter di-
agrams is, to get a true picture of the effect, you must have
a minimum of thirty paired points.
The outcome of a scatter diagram can be a positive cor-
relation, a negative correlation, or no correlation (see Fig-
ure 7-8). With a positive correlation, as the independent
variable is increased, the dependent variable will increase.
With a negative correlation, as the independent variable is
increased, the dependent variable will decrease. With no
correlation, as the independent variable is increased, the
dependent variable will neither increase or decrease but
will remain randomly dispersed.
Before you leave Step 4, have you:
❑ Created an action plan and completed all actions?
❑ Created any required check sheets?
❑ Completed stratification studies?
❑ Analyzed data using histograms?
S
T E P
4 : I
N V E S T I G AT I O N A N D
R
O O T
C
AU S E
I
D E N T I F I C AT I O N
135
9872 Demystifying Six Sigma 2/22/03 8:52 PM Page 135

136
A S
I X
S
I G M A
C
O N T I N U O U S
I
M P ROV E M E N T
T
E A M I N G
M
O D E L
Depen
den
t Variable
Independent Variable
Positive Correlation
…
…
…
...
…
Depen
den
t Variable
Independent Variable
…
…
…
…
…
Negative Correlation
No Correlation
Depen
den
t Variable
Independent Variable
..
..
..
. … . . .
.
..
.
. ..
.
.
. ..
. ..
.
Figure 7-8. Scatter diagram outcomes.
9872 Demystifying Six Sigma 2/22/03 8:52 PM Page 136

❑ Analyzed data using histograms?
❑ Analyzed data using scatter diagrams?
❑ Identified the root causes?
❑ Verified that elimination of the root causes resulted
in improvement?
❑ Achieved your improvement goals?
S
T E P
4 : I
N V E S T I G AT I O N A N D
R
O O T
C
AU S E
I
D E N T I F I C AT I O N
137
9872 Demystifying Six Sigma 2/22/03 8:52 PM Page 137

138
C H A P T E R 8
S t e p 5 : M a k e
I m p r o v e m e n t
P e r m a n e n t
Institutionalization
It is imperative that the overall goals and objectives of the
business, centered on complete customer satisfaction, fuel
all teaming activities. Also, all Continuous Improvement
programs are driven by data. This starts with the initial data
that determines what is not good enough about what. Un-
desirable effects are prioritized using a Pareto diagram. Ini-
tial teams are formed using this analysis. The teams then
use a variety of data collection and analysis techniques to
determine the root causes of less-than-desirable results.
Teaming changes the culture of the enterprise. By
pulling all employees at all levels together, with one com-
mon vision of what is important and what is required to
9872 Demystifying Six Sigma 2/22/03 8:52 PM Page 138

continually strive for better and better performance, morale
will improve. Work life will change for all people that use
these techniques. Work will become a more productive and
satisfying experience. According to Kimball Fisher, “I have
seen people at every level of the organization—even though
it sometimes meant personal inconvenience—decide to do things
differently when confronted with the facts.”
1
Team members, predominantly drawn from the hands-
on employees, will learn new skills. They will experience
a renewed sense of their contributions to the company’s
performance. As they achieve breakthrough performance
and realize that they have learned new skills and have
done things that were previously unheard of, they will
gain confidence and walk a little taller. Communication
with management will improve. They will gain a deep,
satisfying appreciation of what is expected of them and
knowledge of how their efforts contribute to the com-
pany’s success.
Middle managers are often perceived, by themselves, to
be the most threatened in their positions. Thus, they are
often the most resistant to embrace a teaming culture.
Those that stick with the process, learn their new roles,
and attain the skills necessary for management in an open
and sharing manner are the ones that reap the largest ben-
efits. I was in middle management when teaming was first
introduced at Motorola. Typical of people in similar situa-
tions, I was confused on what this new role would be and
what the new rules would be. Over a course of two years,
I had to reinvent myself from a command-and-control
manager to a teaming manager. The journey had its rough
spots; however, the rewards were immense. Sharing infor-
mation and providing employees with the knowledge that
S
T E P
5 : M
A K E
I
M P ROV E M E N T
P
E R M A N E N T
139
9872 Demystifying Six Sigma 2/22/03 8:52 PM Page 139

they needed to improve working conditions and depart-
mental performance created an atmosphere of high morale
and an understanding that we are all in this together.
A new breed of managers is emerging in America. This new
breed has discovered and applied a form of management (that)
is responsive to the changing nature of the workforce and the
pressures of competition. This is a social invention of such sig-
nificance that it cannot be ignored by any organization inter-
ested in its own long-term survival and growth.
2
Senior management, owners, and stockholders are huge
beneficiaries. As performance increases, costs go down, cus-
tomers become happy, sales increase, profits increase, and
the company’s image in the marketplace and community
becomes very positive. The worth of the company and the
wealth of the stockholders increase.
GE utilizes Six Sigma, and Jack Welsh is a fan.
What I believe in more than anything is that the whole idea of
leading is to get every mind in the game. If employees feel their
ideas count and feel that their jobs are exciting and see the con-
nection between their job performance and the stock’s perfor-
mance, the linkages are all lined up together.
Jack Welch
3
By focusing on a common set of objectives and mea-
suring performance with data and facts, the barriers be-
tween organizations break down. In the old days of
opinions, when it was “their” fault or “if only department
xyz would do their job right,” a lot of behavior was driven
by opinions—most of them unfounded. With data-driven
programs, everyone can see their own performance as well
140
A S
I X
S
I G M A
C
O N T I N U O U S
I
M P ROV E M E N T
T
E A M I N G
M
O D E L
9872 Demystifying Six Sigma 2/22/03 8:52 PM Page 140

as the performance of others objectively. It is not a matter
of doing wrong; rather, it is a matter of recognizing that
things are not as good as they should be and taking the
challenge to fix it for everyone’s success.
The key to a successful Six Sigma program is that it is
customer focused. If you think that you know what the
customers need, but you haven’t verified it with the cus-
tomers, contact them and make sure that the team is con-
centrating on the right goals and objectives. Once a team
is focused on customer satisfaction, internal conflicts be-
come unnecessary.
Everyone will naturally evolve to doing their jobs dif-
ferently and better. It becomes a new way of thinking
which fuels a rich cultural change. As a culture moves
from an atmosphere of employees who come to work en-
couraged not to think, do what they are told, and leave at
the end of the day having performed at the minimal level
required to get the job done to an atmosphere where em-
ployees are encouraged to use all of their skills, use their
mental abilities, constantly think of better ways to do the
job, understand the linkage between their performance
and the success of the company, and leave at the end of the
day knowing that they did their best and that their contri-
bution mattered, the feel of the work environment
changes in a very positive way.
I have been involved in several of these transitions, and
at some point in the evolution, you walk in one day, and
you can feel the energy and camaraderie like static elec-
tricity in the air. Those of you who have been similarly in-
volved know that feeling. Those of you who have not yet
experienced it are in for a big treat. This metamorphosis
affects all employees at all levels.
S
T E P
5 : M
A K E
I
M P ROV E M E N T
P
E R M A N E N T
141
9872 Demystifying Six Sigma 2/22/03 8:52 PM Page 141

“I’ll believe it when I see it,” is wrong. When we understand
the impact of our paradigms, we understand that, “I will see it
when I believe it.”
4
Work Method Change
The methods and standards for doing work will change.
As teams of people become familiar with the power of
data, work units will naturally establish charts to monitor
their performance. Control charts may be put into place
in both manufacturing and administrative operations.
Closed-loop feedback systems will be utilized to monitor
customer satisfaction levels.
Employees with new knowledge, new skills, and re-
newed confidence will take both pride and ownership in
their performance. These workforces will have some level
of empowerment to initiate changes. Empowerment comes
with accountability. The teams will understand this and be
confident that they can shoulder this new responsibility.
You will find that organizations can be flattened. No one
will lose his or her job, but there will be a reassignment of
work to get accountability closer to where the work is
done. Over time, this reassignment will result in smaller
workforces accomplishing more than their predecessors.
Physical Change
As the team studies and analyzes the operation to get to the
root cause(s) that is (are) preventing the output to customers
from being in line with absolute customer satisfaction, they
may discover that the flow of work is problematic. As was il-
142
A S
I X
S
I G M A
C
O N T I N U O U S
I
M P ROV E M E N T
T
E A M I N G
M
O D E L
9872 Demystifying Six Sigma 2/22/03 8:52 PM Page 142

lustrated in the flowcharting section in Chapter 6 (Step 3),
often the work flow has grown over the years to a point
where it no longer makes sense, no one is quite sure why
things are being done the way they are other than “we’ve al-
ways done it that way.”
Simple physical changes can simplify and streamline an
operation. These changes will eliminate unnecessary work
and help to mistake-proof the process. Like the example in
flowcharting, most administrative processes are rife with
unnecessary and redundant operations. Often the required
change is to have a department closest to the action per-
form the task.
Look at your manufacturing flows. Years ago I was in-
volved in the processing of semiconductors. There were
eleven steps in the manufacturing flow where product had
to go through photo-imaging. Run rates were slow, and
mistakes that led to rework were too high. A factory flow
study performed on the photo-imaging process revealed
that the product queued at several points in the process. It
also revealed that on each pass through photo-imaging,
the product traveled 2,500 feet. This was within a factory
floor space of approximately 50 feet by 75 feet. At almost
no cost, one table and one cleaning bench were resituated
within the factory. The distance traveled by the product
was reduced to 500 feet, and the errors causing rework
were reduced from 4 percent to less than 1 percent.
I was also involved with a team that was working on
eliminating processing errors within a chemical plant. Par-
tially processed product was getting to the middle of the
factory where the errors would be found and the product
returned for expensive rework. One of the root problems
S
T E P
5 : M
A K E
I
M P ROV E M E N T
P
E R M A N E N T
143
9872 Demystifying Six Sigma 2/22/03 8:52 PM Page 143

was that the raw material arrived in the middle of the fac-
tory. From there it had to travel east to begin processing.
Product in process would then travel west to continue its
journey to the end of the line and ultimate delivery to a
customer. Of course, as the raw material traveled east and
the product in process traveled west, they would bump
into each other and some percentage would get mixed.
Again, the simple solution was to stage the raw material at
the far-east end of the factory so that everything flowed in
a continuous journey from east to west.
In a 1960s sit-com titled The Tycoon, Walter Brennan
played the owner of a manufacturing business, a pragmatic
individual who had worked his way to the top with a lot
of common sense and a keen understanding of people. In
one episode, he could not get the required productivity or
quality level out of a line within the factory. He hired four
high-powered consulting firms to come up with what was
wrong and recommend the required changes. The con-
sulting firm that submitted the winning proposal would
get a lucrative contract. All came back with highfalutin
ideas that were very expensive, and Walter was not con-
vinced that any of them would work.
Working late one night struggling with how to fix the
problem, Walter ran into a young man who was working
nights as a janitor while attending college during the day.
Walter shared his dilemma with the young man, who
agreed to take a look at the problem. The next night he
reported that what was needed was a left-handed operator
at one of the workstations. Walter implemented the idea,
and, as the plot would have it, the problem was solved.
That was forty years ago and it was fiction, but the lesson
of a little common sense going a long way is timeless.
144
A S
I X
S
I G M A
C
O N T I N U O U S
I
M P ROV E M E N T
T
E A M I N G
M
O D E L
9872 Demystifying Six Sigma 2/22/03 8:52 PM Page 144

Required physical changes usually consist of changing
the layout of a factory or administrative work flow. Often a
simple relocation of one or two workstations is all that is re-
quired. Remember all of the Kan-Ban cell manufacturing
that was popularized in the 1980s? These were very effec-
tive in improving productivity and quality. There are rare
occasions when a new piece of equipment may be required.
Procedural Change
Most work flows and operational practices are governed by
some form of documented procedure. These have names
like standard operating procedure (SOP) or work instruc-
tions or processing procedure or department policy. For
most companies today, being registered to ISO-9000, or
equivalent, is a condition of doing business. These systems
all require some form of controlled documentation.
All too often so-called experts write these procedures.
These experts come in the form of outside consultants or
internal technologists or management representatives. A
better way to generate these documents is to have a team
comprised of those doing the work and the experts work-
ing together to generate the required documents. Thus, a
system of continuous improvement teams is the best struc-
ture for rooting out less-than-adequate documents and fix-
ing them.
Training
When you are developing your training programs and
identifying the required courses, think in terms of what
it is that you expect the trainees to do with the new in-
S
T E P
5 : M
A K E
I
M P ROV E M E N T
P
E R M A N E N T
145
9872 Demystifying Six Sigma 2/22/03 8:52 PM Page 145

formation and skills. An effective training program is
well thought out ahead of time, with a clear understand-
ing of how you expect employees to apply the new skills
and what improvements in performance you expect to
attain.
The best way to train adults is to ask questions instead
of giving answers. A group of adult workers has an im-
mense amount of native intelligence that any good
trainer taps into and utilizes for the learning of the group.
This is all part of instilling the awareness that each of us
can contribute more to the success of our operations.
When a group of people realize that they are training
themselves, they feel a kinship with the new skills. There
is no longer a need to ask, “Is this the program of the
month?”
The initial training is best done in groups of twenty or
less. Some of the subjects, such as the seven tools of
problem solving, will take more than one such session.
The bulk of the training is what happens after these ini-
tial seminars. You must have a cadre of facilitators and
coaches ready to lead the transformation process. These
people must have the ability to step in and ask the right
questions at the right time. They must know how to
give feedback working with the group rather than talking
to the group.
Continuous improvement team members require train-
ing in problem-solving tools, a logical approach to using
the tools, how to work as an effective team member, and
how to communicate their activities and achievements.
The following chart is one example of a training curricu-
lum for team members.
146
A S
I X
S
I G M A
C
O N T I N U O U S
I
M P ROV E M E N T
T
E A M I N G
M
O D E L
9872 Demystifying Six Sigma 2/22/03 8:52 PM Page 146

S
T E P
5 : M
A K E
I
M P ROV E M E N T
P
E R M A N E N T
147
Subject
Problem-Solving
Tools
Six-Step Model
Team Building
Effective
Presentations
Time
16 hours
16 hours
16 hours
8 hours
Content Overview
❑ Use a case study. Better yet, use an in-
house project.
❑ Present each of the JUSE seven tools of
problem solving, and have participants
create one example of each.
❑ Present the model and explain logic of
flow.
❑ Stress need to complete each step before
proceeding to the next step.
❑ Walk through an example with the par-
ticipants.
❑ Discuss different styles.
❑ Provide exercises for conflict resolution.
❑ Present consensus-building techniques.
❑ Practice feedback techniques.
❑ Discuss coaches and champions and how
and when to use them.
❑ Present how to manage change.
❑ Provide effective meeting requirements.
❑ Show examples of teamwork and
accomplishments.
❑ Demonstrate the importance of listening
skills.
❑ Present roles of upper management,
middle management, coaches, facilita-
tors, team leaders, and team members.
❑ Present how to deliver effective presen-
tations.
❑ Discuss how to prepare for different
audiences.
❑ Have each participant prepare and pre-
sent a practice session.
❑ Debrief presentations.
Required Team Member Training
9872 Demystifying Six Sigma 2/22/03 8:52 PM Page 147

Before you leave Step 5, have you:
❑ Established a method to continue monitoring per-
formance?
❑ Written or amended documents as required?
❑ Completed any required changes to work flow?
❑ Completed all required training?
Notes
1. Kimball Fisher, Leading Self-Directed Work Teams (New
York: McGraw-Hill, 1993), p. 39.
2. John H. Zenger, Ed Musselwhite, Kathleen Hurson,
and Craig Perrin, Leading Teams (Burr Ridge, Ill: Irwin,
1994), p. 21.
3. Jean Sherman Chatzky, “GE’s Genius Speaks,” USA
Weekend, Sept. 14–16, 2001.
4. Fisher, Leading Self-Directed Work Teams, p. 87.
148
A S
I X
S
I G M A
C
O N T I N U O U S
I
M P ROV E M E N T
T
E A M I N G
M
O D E L
9872 Demystifying Six Sigma 2/22/03 8:52 PM Page 148

149
C H A P T E R 9
S t e p 6 : D e m o n s t r a t e
I m p r o v e m e n t
a n d C e l e b r a t e
Back to Focused Metric
The metric that you created in Step 1 is the metric that
you have been using throughout the entire root-cause
identification and actions to bring performance to an ac-
ceptable level. Using this metric, you must demonstrate
that you have achieved your goal.
Figure 9-1 illustrates an example of a team that started
out with only 10 percent of the documents in their area
revised to eliminate the errors causing customer dissatis-
faction. They set a goal to have all documents completed
within seven months. As their metric shows, they met
their goal.
9872 Demystifying Six Sigma 2/22/03 8:52 PM Page 149
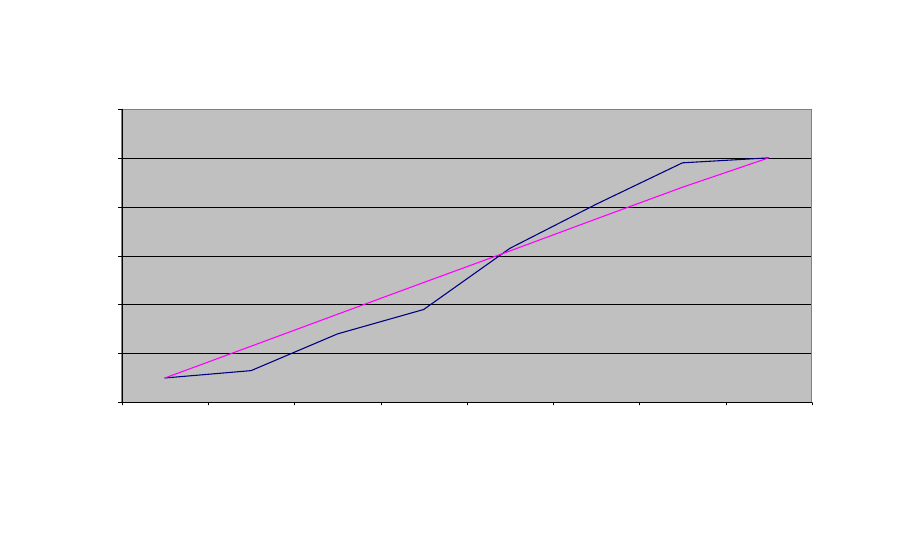
Percent of Documents Revised
0
20
40
60
80
100
120
Jun
Jul
Aug
Sep
Oct
Nov
Dec
Jan
Date
goal
Figure 9-1. Achievement metric.
9872 Demystifying Six Sigma 2/22/03 8:52 PM Page 150

Success of the Enterprise
The team must demonstrate how their accomplishments
contributed to the overall success of the larger enterprise,
whether it is a department, a division, a company, or a
corporation. Usually, a team must demonstrate how their
accomplishments contribute to the success of a company
or corporation; however, if a Six Sigma Continuous Im-
provement program is initiated on a limited basis, such as
in one department, then the team’s accomplishments can
be linked to that department’s success. In our example, the
team had to explain how revising their documents would
contribute to improved customer satisfaction. In this case,
the old, out-of-date documents were forcing operators to
perform tasks in ways that were not optimal, and they
were producing a lot of nonconforming product for their
customers. Working in conjunction with other teams
within the department that were improving other aspects
of the operation, the team was able to show that as they
revised the documents, the operators were producing
fewer defective parts.
This is why it is important to do the required organiza-
tional development work before you initiate a Six Sigma
program. The enterprise must have stated and published
objectives that guide the activities of the team. Objectives
are provided by the senior management of the enterprise.
Typical objectives are:
1. Increase market share
2. Reduce manufacturing costs
3. Increase new-product introductions
4. Reduce cycle times for product delivery and ser-
vice response
S
T E P
6 : D
E M O N S T R AT E
I
M P ROV E M E N T A N D
C
E L E B R AT E
151
9872 Demystifying Six Sigma 2/22/03 8:52 PM Page 151

5. Zero safety incidents
6. Reduce water and air emissions
7. Improve profit
8. Improve quality in product, service, and adminis-
trative functions
Every team must identify at least one such objective
that their project is going to positively impact. Tactics are
the bottom-up created action plans that are provided by
every work unit, division, or department. The teams’ op-
erational statement, activities, and action plans become
part of the tactics for the enterprise.
In the example of the team that created easy-to-use, cor-
rect, and clear documents for the manufacturing of prod-
uct, their project and actions directly affected several of the
typical objectives. When manufacturing is creating defec-
tive parts, there is a negative impact on costs, cycle time,
and customer-received product. By having a positive im-
pact on the reduction of defective parts, this team is helping
to reduce manufacturing costs, reduce cycle times, and im-
prove profits. Thus, at least three of the objectives are ger-
mane to the team’s efforts.
Reducing the number of defective parts produced will
also reduce the number of products that must be reworked.
This can have a positive effect on water and ventilation us-
age; therefore, there could also be a positive effect on the
reduction of water and air emissions. Also, when manufac-
turing is producing defective parts, not all of them are go-
ing to be detected internally before they are delivered to
the customer; therefore, the team’s activities could have a
positive impact on improving the quality of the product.
152
A S
I X
S
I G M A
C
O N T I N U O U S
I
M P ROV E M E N T
T
E A M I N G
M
O D E L
9872 Demystifying Six Sigma 2/22/03 8:52 PM Page 152

It is extremely important within a Six Sigma program
culture that the systems and the people blend together
into an integrated unit. Managers must know what em-
ployees are doing to contribute to the success of the en-
terprise, and individual employees must know what they
are doing to contribute to the success of the enterprise.
This creates a highly effective unit at all levels within an
atmosphere of high morale.
Team Recognition
Team recognition is something that must be done through-
out the entire course of continuous improvement activities.
The most precious thing that you as a senior manager or
executive can give is your time. Drop in on a team meeting
once in awhile. See what they are working on; give some
verbal praise and encouragement. Find out the break
schedule for team participants and take a break with them.
Ask them what they are working on. Show interest.
One very successful program that I was part of included
weekly coaching sessions from the director of operations
and the director of quality. We committed from 1
PM
un-
til 2
PM
every Wednesday afternoon to meet with teams.
There was no set agenda. Everyone knew that during that
time we would be in a conference room located near the
factory floor. Team leaders or entire teams would come
in, ask questions, share concerns, and get answers.
Other forms of team recognition include giving each
team a bulletin board to display their activities and progress.
These bulletin boards should be mounted along a major
hallway where most employees pass them at least twice a
S
T E P
6 : D
E M O N S T R AT E
I
M P ROV E M E N T A N D
C
E L E B R AT E
153
9872 Demystifying Six Sigma 2/22/03 8:52 PM Page 153

day. Also, during regularly scheduled monthly communica-
tion meetings, schedule five to ten minutes for one or two
teams to make a presentation of their project. If you have an
internal newsletter, provide a column where team activities
and accomplishments can be highlighted.
Team recognition is included here in Step 6 because
this is the point where a team has successfully completed
a program and achieved the desired results. This is now
the point where team members receive formal recogni-
tion in front of their peers. The recognition can be sched-
uled as special stand-alone meetings or as part of regular
communication meetings. The important thing is the
recognition, not the size or monetary value of the prize;
at Motorola we learned that large monetary awards were
actually counterproductive.
The best recognition programs consist of small, escalat-
ing tokens of appreciation. Programs that I have seen
work consist of a series of pins to wear on one’s employee
badge, such as a yellow ribbon for the first successfully
completed program, a red ribbon for the second, and a
blue ribbon for the third. Another program that worked
was movie tickets for two for each team member every
time a Continuous Improvement program was success-
fully completed.
WARNING: Do not tie the size of the award to the fi-
nancial impact on the company. This is a recipe for disaster.
You may motivate one team, but you are guaranteed to de-
motivate everyone else. Also, you will discover that every
team has at least one budding accountant who wants to
question how the financial value was determined.
Besides, this is not what you are striving for. You want
everyone engaged in driving improvement throughout the
154
A S
I X
S
I G M A
C
O N T I N U O U S
I
M P ROV E M E N T
T
E A M I N G
M
O D E L
9872 Demystifying Six Sigma 2/22/03 8:52 PM Page 154

entire enterprise. You do not want to send a message that
eliminating typos in work orders is any more or less im-
portant than eliminating product defects.
Before you leave Step 6, have you:
❑ Received management’s approval?
❑ Received customer verification that the
improvements have taken place?
❑ Recognized the team members?
❑ Publicized and celebrated the success?
❑ Given the team members a token reward?
S
T E P
6 : D
E M O N S T R AT E
I
M P ROV E M E N T A N D
C
E L E B R AT E
155
9872 Demystifying Six Sigma 2/22/03 8:52 PM Page 155

9872 Demystifying Six Sigma 2/22/03 8:52 PM Page 156
This page intentionally left blank

157
S E C T I O N T H R E E
Getting Started
The considerations for how to initiate the program
required to transition to a Six Sigma culture and how
to effectively manage the change process.
9872 Demystifying Six Sigma 2/22/03 8:52 PM Page 157

9872 Demystifying Six Sigma 2/22/03 8:52 PM Page 158
This page intentionally left blank

159
C H A P T E R 1 0
S t a r t Y o u r J o u r n e y
Do Something
During the late 1980s there was a meeting within Mo-
torola where a division VP was briefing his staff on the
problems that he wanted fixed and projects that he wanted
initiated. This was part of the Six Sigma rollout for the di-
vision. One of the division staff members said, “Bill, we
can’t do everything at once.” To which Bill replied, “I’m
not asking you to do everything at once. (Pause) I am ask-
ing you to do something at once.”
The staff member’s reaction was typical and to be ex-
pected. Everyone is busy, and the transition to a Six Sigma
system is asking for a lot of change and a lot of new mate-
rial to learn. How can I be expected to participate in the
organizational development, set standards for my depart-
ment’s performance, start tracking defects against those
standards, transform defect rate into something called a
Sigma value, determine all of the new skills that my people
will require, identify the required training, schedule people
for training, set aside time each week for people to work
9872 Demystifying Six Sigma 2/22/03 8:52 PM Page 159

on Continuous Improvement programs, share information,
change from what I think is a pretty good manager into
something they call a leader, and what is a black belt and a
green belt anyway? On top of everything else, do I have to
start martial arts classes in the evening?
All of the above questions are racing through peoples’
heads while they try to absorb all of this new stuff, know-
ing full well that they will still be expected to keep the
product moving, or ship product, or make sales calls or pur-
chase supplies or process accounts receivable, or perform
the dozens of other tasks that people do every day to keep
the company running.
And, Bill’s response was spot-on. The answer is to do
something. The point is to start somewhere and to keep
building all of the required pieces. Be committed to the
fact that this is going to take awhile. There are no magic
pills. The adage of eating an elephant one bite at a time
applies here. Remember that in order to eat an elephant
one bite at a time, you have to start with a first bite.
The Fallacy of Zero Defects
In 1967, I was a crew member aboard the submarine USS
Sam Houston as she went through the Naval Shipyard in
Portsmouth, New Hampshire. The date is significant be-
cause it was shortly before this that the USS Thresher sank
on her shakedown cruise following repair and retrofit in
the same shipyard. The Thresher went down with all hands.
The Navy did scores of what-if tests to try to determine
why the Thresher sank. I don’t know if they ever found an
answer that they were 100 percent sure of, but I do know
that a lot of our operating systems were improved to en-
compass a lot of contingencies. The shipyard went on a
massive campaign to improve their quality of work.
160
G
E T T I N G
S
TA RT E D
9872 Demystifying Six Sigma 2/22/03 8:52 PM Page 160

The first day that we docked in the shipyard, I met a civil-
ian welder who had a huge button about three inches in di-
ameter pinned to the front of his bib overalls. The button
was yellow with the letters “ZD” emblazoned on it in bold
black type. I asked him what the button was for. He replied,
“ZD stands for Zero Defects. I was awarded this button be-
cause I didn’t make a mistake for a whole year.” I was very
impressed and congratulated him on his achievement.
I worked with this gentleman for fifteen months. He
was a wonder to all of us. He was the most creative person
that I have ever experienced. Week after week he could
put in forty hours on the job and never do a lick of work.
It was amazing to watch him. He would pull his welding
cable to some remote corner within the bowels of the ship
and sit down with his transistor radio held against the ca-
ble, using it as an antenna. For months he did absolutely
nothing that could be interpreted as work.
A year passed, and sure enough, he showed up with a
huge yellow pin emblazoned with “ZD, 2 years.” He had
now gone two consecutive years without making a mis-
take. When you don’t do anything, it is easy to not make
mistakes or produce faulty product.
Six Sigma is about continually looking for ways to im-
prove your personal performance and your work unit’s
performance. It has room for making some errors or pro-
ducing some bad product or performing some service be-
low standard. Precisely, it allows for you to have three
defects for every million opportunities that you have to
make a mistake. This is a very important tenet of Six
Sigma. Besides, unless you produce a gazillion widgets or
perform a gazillion tasks every month, three out of a mil-
lion is virtually zero-defect performance.
When doing the mathematical calculations of dividing
S
TA RT
Y
O U R
J
O U R N E Y
161
9872 Demystifying Six Sigma 2/22/03 8:52 PM Page 161

the number of bad products received by customers by the
total number of products received by customers, just one
defect in the numerator will result in a number much
greater than three parts per million. When a similar calcu-
lation is done for service or administrative work units, the
results will be similar. When dividing the number of un-
satisfactory service encounters by the total number of
service encounters, one defect in the numerator will result
in a number much greater than three parts per million.
So, as you begin your program to transition your oper-
ation to one that is governed by Six Sigma, be prepared to
make mistakes. If you are like the rest of us, you will make
plenty of them. Don’t be like our shipyard welder who, in
order to make no mistakes, did nothing. Do things, and
make your mistakes. When you make a mistake, embrace
it. Dissect it and learn what you can from it. They say that
mistakes are life’s greatest learning opportunities. As en-
terprises evolve from an okay system to a Six Sigma sys-
tem, there are many obstacles that need to be overcome.
Remember that one of the tenets of Six Sigma is contin-
uous improvement, so don’t expect to start off as an ex-
pert. As the program grows, lessons will be learned and
performance will improve.
The largest challenges are those that each individual
must wrestle with in making his or her own personal tran-
sition. Everyone will need to learn a new way of looking
at how they do their work. Ultimately a successful Six
Sigma culture consists of individual employees who apply
new thinking and new skills on how to improve their own
performance and the performance of the company.
Just as with a program or project, you must set high
standards for your personal performance, continually mon-
itor your performance, and take actions to improve your
162
G
E T T I N G
S
TA RT E D
9872 Demystifying Six Sigma 2/22/03 8:52 PM Page 162

performance. The attainment of Six Sigma is not a desti-
nation; the quest for Six Sigma is a never-ending journey.
First Steps
The decision to convert to a Six Sigma culture requires a
commitment to do it, and it requires the courage to be
prepared to make mistakes. Yes, Six Sigma is a program
focused on customer satisfaction that will result in better
product and service; however, it is much more than this.
It is a cultural change that will affect every employee in
the enterprise. People will begin to think differently. They
will look at their involvement at work, and at the world in
general, with a different perception.
The good news is that form follows function and func-
tion follows form. What this means is that you need to
provide the rules, models, vision, and structure defining
the new form. This newly defined form will enable peo-
ple to start functioning under the new expectations. Once
people begin to function in a new manner and way of
thinking, they will then begin to influence the form and
evolve it to a higher level. This in turn drives higher lev-
els of functioning, which will then create a higher defini-
tion of form. This natural evolution will enable everyone
to grow together.
Be prepared for this to take time. Once the leadership of
an enterprise has decided that it will convert to a Six Sigma
culture, senior management must define when, where, and
how it will be done. A vision must be created. Roles and
responsibilities must be defined. Accountability methods
must be determined. Organizational development work
must be completed such that business objects are established
and communicated in a manner that will enable the align-
S
TA RT
Y
O U R
J
O U R N E Y
163
9872 Demystifying Six Sigma 2/22/03 8:52 PM Page 163

ment of all subsequent projects to the success of the enter-
prise. Initial training requirements must be determined.
Depending on the size of the enterprise and the scope of
deployment, this usually takes from one to three months.
Next are the rollout, communication, and training phases.
Depending on size, scope of deployment, and resources ap-
plied, this usually takes from one to six months. Now the
initial projects can be identified and teams established to
start the continuous improvement projects.
Typically, it will take individual teams one to two months
before achieving any improvement in performance. Teams
chartered to improve very complicated or highly technical
operations may take longer. Once a team starts to achieve
some initial improvement in performance, performance
will improve at a high rate. The complexity and scope of
most continuous improvement team projects require six
months to achieve a Six Sigma level of performance.
Be prepared to stay the course. Programs that are initi-
ated for small enterprises or limited to a small work unit
within a large enterprise will begin to see results in three
months, and there will be jubilation about outstanding
results in about eight months. Programs that are initiated
corporatewide at several locations will begin to see results
in about a year, and there will be jubilation about out-
standing results in about fifteen months (see Figure 10-1).
When creating a Six Sigma culture, it is important to
stay focused on the critical components of a Six Sigma
164
G
E T T I N G
S
TA RT E D
Scope of Six Sigma
Program
Time to See Initial
Results
Time to See Outstanding
Results
Small
3 months
8 months
Large
11 months
15 months
Figure 10-1. Timing for positive return on investment.
9872 Demystifying Six Sigma 2/22/03 8:52 PM Page 164

culture (Figure 10-2). All Six Sigma cultures must start
with a focus on customer satisfaction. You must know
who your customers are and what it takes to satisfy them.
Systems must be established to collect and analyze data.
Decisions are made based on data. The program must in-
clude team-based continuous improvement projects. Us-
ing data analysis techniques, projects will be prioritized
and initiated based on customer satisfaction issues and fi-
nancial considerations. There must be a strong emphasis
on employee involvement. Employees from all areas
within the enterprise will staff continuous improvement
teams. Financial improvements must be realized at all lev-
els. Manufacturing costs should decrease, the time and ex-
pense of performing service or administrative functions
should improve, profits should improve, and stock prices
should improve. Six Sigma must be viewed as a perma-
nent cultural change for the enterprise.
The initial steps required to create a Six Sigma pro-
gram are:
1. Decide that you want a Six Sigma culture. This is not a
trivial decision. The decision to create a Six Sigma culture
S
TA RT
Y
O U R
J
O U R N E Y
165
Figure 10-2. Six foundation stones of Six Sigma.
1. Customer Satisfaction
2. Decisions Based on Data
3. Continuous Improvement
4. Employee Involvement
5. Financial Improvements
6. Permanence
9872 Demystifying Six Sigma 2/22/03 8:52 PM Page 165

is going to challenge the way that you have done things in
the past. Six Sigma is going to challenge your personal be-
liefs, and it is going to redefine the rules and expectations
for all employees. Some employees will not successfully
make the transition; there will be career casualties.
2. Define and publicize key business objectives. It is impor-
tant that you define what your key business objectives are.
Once these are established, a system to publicize them
must be put in place. Posting them on bulletin boards at
key locations throughout the work areas is a good way to
do this. Departments or work units must document their
objectives in support of the key business objectives. It
must be very clear how the activities of each employee
group are tied to the success of the enterprise.
3. Define the new culture. Depending on the size of the
enterprise, the scope of deployment, and the type of busi-
ness that you are in, successful Six Sigma programs can
take different shapes and forms. They all must comply
with the six foundation stones of Six Sigma (see Figure
10-2). From this foundation, based on your core values
and markets served, create a unique program that best
serves your needs. Retail and service companies require a
basic set of quality improvement tools focused in logical
progression to achieve ever-improving results. In addition
to these tools, companies involved in high-tech manufac-
turing also require advanced techniques for process con-
trol, experimental techniques, and data analysis. Other
companies serve a customer base, such as the military or
automotive manufacturers, with other requirements that
must be assimilated into the Six Sigma program. All of this
must be considered and articulated into a clear vision of
what the new culture will look like.
166
G
E T T I N G
S
TA RT E D
9872 Demystifying Six Sigma 2/22/03 8:52 PM Page 166

Some of the old expectations, rules, and standards of
acceptable behavior are no longer applicable. These must
be expunged from the new culture. New expectations,
rules, and standards of acceptable behavior must be de-
termined and incorporated into the new culture de-
scription. The description of the new culture provides a
30,000-foot aerial map for everyone to orient against. It
must be communicated to all employees. As Yogi Berra
said, “If you don’t know where you’re going, you could
wind up someplace else.”
4. Deliver the required training. Employees within the scope
of the Six Sigma culture need to learn new ways of thinking
and new skills. As the new culture is defined, you must iden-
tify what new behaviors and what new skills are expected of
the workforce. Target trainee groups must be identified, and
a gap analysis must be completed to identify the required
training. A training program must be initiated, a curriculum
must be designed, and training must be delivered.
5. Prioritize key initiatives. You can’t improve everything
at once; however, you can begin to improve some things at
once. The key is to choose the right things to improve:
those things that have the potential for the quickest return
on your investments of time, money, and human resources.
Measurements of customer satisfaction, internal failures,
and financial performance must be determined. If there is
no historical data, data must be collected. A Pareto analysis
must be completed to identify the major issues. This will
determine the charters and make-ups of the initial projects.
6. Establish macro metrics. You must determine how
you are going to measure the effectiveness of the conver-
sion to Six Sigma. High-level metrics include a way to
track the achievement of business objectives. Determine
S
TA RT
Y
O U R
J
O U R N E Y
167
9872 Demystifying Six Sigma 2/22/03 8:52 PM Page 167

baseline performance, establish rate-of-improvement
goals, and plot your performance to goal. These macro
metrics need to be reviewed at least monthly. If you are
performing to goal, stay the course. If you are not im-
proving fast enough, rethink and redesign your improve-
ment projects.
7. Create the initial teams. Teams must be assigned to all of
the prioritized improvement projects. Team leaders, cham-
pions, and team members need to be identified. Some proj-
ects require work unit teams, and some projects require
cross-functional teams. Each team needs to establish a met-
ric for its performance that ties to one of the macro metrics
established earlier.
8. Set up a system to review performance. Leadership and
management people must be held accountable for sup-
porting and deploying the Six Sigma initiatives. Every
monthly or quarterly operational review must include a
report on how Six Sigma is being utilized. Teams must be
held accountable for achieving continuous improvements
on measurable results. Management must establish a for-
mal review process that reviews each team’s performance
on a regular schedule.
9. Identify coaches and facilitators. The change required to
establish a Six Sigma culture requires people who are
spokespersons and role models for the behaviors and skills
sets. Coaches are members of senior management that en-
courage team activities and reinforce positive behaviors.
Facilitators are individuals who have an aptitude for Six
Sigma, possess excellent interpersonal skills, and are com-
fortable working in a support role. Facilitators provide
guidance for team behaviors and assist teams in the appli-
cation of quality improvement tools.
168
G
E T T I N G
S
TA RT E D
9872 Demystifying Six Sigma 2/22/03 8:52 PM Page 168

10. Determine how positive team accomplishments will be
made visible. Employees who are participating on teams and
achieving positive results in support of the business objec-
tives need to be recognized. A bulletin board where each
team can display their project performance should be
placed in a central location where all employees are likely
to see it. Management must announce the small rewards
that are awarded to a team that accomplishes a significant
milestone or completes a project. What these rewards are
and how they will be publicized need to be included as
part of the transition process.
Before and After
It takes a lot of concentrated effort from a lot of people to
complete the transition to a Six Sigma culture, and it is
worth every step of the way (see Figure 10-3).
S
TA RT
Y
O U R
J
O U R N E Y
169
Pre-Six Sigma
Post-Six Sigma
Employees perform task by
rote
Employees think of better
ways to perform tasks
Employees work as
individuals
Employees work as team
members
Departments work in
isolation
Departments work cross-
functionally
Focus is internal
Focus is external
Customers’ contractual
requirements are met
Customers’ desires are
fulfilled
Customers are satisfied
Customers are thrilled
Quality is inspected in
Quality is built in
Thinking is that things are
okay
Thinking is that things need
improvement
Many decision are based on
opinion
All decisions are based on
factual data
Profits are okay
Profits are maximized
Figure 10-3. Pre- and post-Six Sigma.
9872 Demystifying Six Sigma 2/22/03 8:52 PM Page 169

170
C H A P T E R 1 1
M a n a g i n g C h a n g e
Overview
The transition from the existing culture within any enter-
prise to a Six Sigma culture requires three components:
leadership, participants, and training. Each of these fol-
lows an evolutionary path from initial unfamiliarity with
the required knowledge and skills to a mastery of the
knowledge and skills. The situation within each enter-
prise is unique. Some enterprises will already have many
of the components required for Six Sigma in place, and
some enterprises will be starting from a situation that re-
quires a lot of development. Regardless of the starting
point, as the leaders and participants absorb new knowl-
edge, learn new skills, and apply them in a new way of
working together, there will be periods of uneasiness.
As it is with the successful implementation of any ma-
jor initiative, good leadership is crucial. In many existing
situations, the leaders and managers must transition from
9872 Demystifying Six Sigma 2/22/03 8:52 PM Page 170

control-centered management to participative leadership.
Leaders must be sensitive to the development stages of the
employees who are participating in the transition. Knowl-
edge and skills will not be absorbed and effectively utilized
instantaneously. As the skill levels of the participants in-
crease, the role of leadership will change.
Coincidental with transitional challenges faced by the
leaders, the participants are going through their own tran-
sitional challenges. In all cases with which I have been in-
volved, employees were eager to participate in a Six Sigma
culture, and they were willing to learn and apply the things
necessary to improve their performance. With very few
exceptions, people like the idea of working in teams. Hav-
ing said this, after so many years of working as individuals,
the learning process takes time. In the process of evolving
from eager anticipation to effective teams, participants go
through periods of frustration and adjustment.
The training process from presentation of the new
knowledge and skills to the point where the results of the
training are realized also is an evolutionary journey. There
are too many instances of too many companies spending
money on training and never providing an opportunity to
use the training, which means that there is no return on
the training investment. Training programs must be de-
signed to encompass the transition from being taught
skills, to actually learning the skills, to utilizing the skills,
to achieving new results by applying the new skills.
Fortunately, each of the three required components—
leadership, participants, and training—have existing four-
phase models that overlap and intertwine in a comple-
mentary manner.
M
A N A G I N G
C
H A N G E
171
9872 Demystifying Six Sigma 2/22/03 8:52 PM Page 171

Leadership
The leaders of a Six Sigma transition have two challenges.
They have their own personal learning of new skills and
new ways of thinking in terms of customer satisfaction
and continuous improvement, and they must assist em-
ployees in making the same transition. The One-Minute-
Manager Situational Leadership II model
1
is an excellent
guide for thinking about the development stages of your
employees and the changing role of leaders throughout
the transition from the existing operating system to a Six
Sigma system.
Depending on the development level of individual em-
ployees, there are four phases of leadership styles: directing,
coaching, supporting, and delegating. The leader’s appro-
priate role changes for each of these phases is illustrated in
Figure 11-1.
Participation
The Forming/Storming/Norming/Performing (F/S/N/P)
model,
2
shown in Figure 11-2, provides useful insight into
what should be anticipated when employees are learning
new skills and behaviors within a new culture. The
F/S/N/P model provides a roadmap for what to expect in
terms of teaming behavior and group effectiveness.
Knowing that groups of individuals often start slow and
go through a period of misbehaving before they get into
an effective work unit will prevent you from becoming
discouraged. More importantly, this gives you the oppor-
tunity to proactively plan how you will manage through
these phases.
172
G
E T T I N G
S
TA RT E D
9872 Demystifying Six Sigma 2/22/03 8:52 PM Page 172

Pha
se
Marked By
Employee
Development
Level
Marked By
Leader’s Role
Dire
ctin
g
-Managers make all decisions
-Managers carry all responsibility
-Managers hold the information
-Workers work by rote
-Work is primarily physical, not mental
Low
Enthusiasm
-Provide the training
-Develop team expectations
-Establish team rules
-Model expected behavior
-Team is dependent on the leader
Coaching
-Managers solicit suggestions
-Responsibility for making goals is shared
-Managers share information
-Workers provide ideas
Improving
Disillusion
-Facilitate team meetings
-Coach individuals
-Resolve conflicts
-Reinforce positive behaviors
-Build trust
Supporting
-Managers collaborate on decisions
-Workers make decisions
-Workers responsible for results
-Workers generate needed information
-Workers brief management on progress
Moderate
Reluctance
-Increase challenge
-Release some authority
-Demonstrate trust
-Provide information
-Coach the team
De
leg
atin
g
-Workers are chartered with results
-Workers define methods
-Workers define work rules
-Workers determine roles
High
Competence
-Develop individuals and teams
-Publicize successes
-Transfer authority to team
-Assist with change
-Provide recognition
Figure 11-1. Leadership change model.
9872 Demystifying Six Sigma 2/22/03 8:52 PM Page 173

Phase
Behaviors
Team
Performance
Leader’s
Role
F
o
rmin
g
Testing and
Dependen
ce
-Orientation to the task
-Decide on required
information
-Establishing ground rules
-Limits are tested
-Hesitant participation
-Learning how to learn
-Average Performance
-Everyone on Their Best
Behavior
-Confusion
-Wary Acceptance
-Rapid Increase in
Personal Skills
-Provide the training
-Develop team
expectations
-Establish team rules
-Model the behavior
-Team is dependent on
leader
Storming
Intragroup Conflict
-Hostility
-Expression of individuality
-Infighting
-React emotionally to the task
-Discussion of peripheral
issues
-Defensiveness
-Arguments
-Resistance to technique
-Polarization
-Group unrest
-Declining Performance
-Infighting
-Interpersonal Conflicts
-What’s In It For Me?
-Resistance to Change
-Facilitate meetings
-Coach individuals
-Resolve conflicts
-Reinforce behaviors
-Build trust
-Position may be
threatened
Norming
Developm
ent
of Group Cohesion
-Accept the group
-Accept member
idiosyncrasies
-The group becomes an entity
-Strive for harmony
-Information is acted on
-Common goal identified
-Group spirit
-Cooperation and mutual
support
-"We" consciousness
-Performance Hits Bottom
& Then Improves
-Group Develops Rules of
Conduct
-Roles are Understood
-Conflicts Resolved
Quickly
-Consensus Building
-Increase challenge
-Release some authority
-Demonstrate trust
-Provide information
-Coach the team
P
erformin
g
Functional Role-Relatedness
-Becomes a problem-solving
unit
-Solutions emerge
-The group supports the
process
-Group freedom
-Friendliness
-Attainment of the desired
goal
-Emergence of insight
-Collaborative process
-Structure is institutionalized
-Learn to apply to other
situations
-High Levels of
Performance
-Achievement of Goals
-High Morale
-Risk Taking
-Mutual Trust
-Develop individuals &
team
-Publicize their
successes
-Team has authority
-Manage change
-Reward and recognize
Figure 11-2. Four stages of team development and performance.
9872 Demystifying Six Sigma 2/22/03 8:52 PM Page 174

Training
People will be expected to think differently, exhibit dif-
ferent behaviors, and apply new skills. To make this tran-
sition, they will need training. Kirkpatrick has defined the
levels of evaluating the effectiveness of a training program
from the training delivery to skills mastery to skills utiliza-
tion to results from the new skills.
3
These four stages,
which are illustrated in Figure 11-3, constitute an evolu-
tionary process that must be incorporated into the design
of an effective training program.
A Six Sigma Change Management Model
As we review the phases of the three key components for
change—leadership, participation, and training—com-
mon themes emerge. From this we can create a compre-
hensive model for Six Sigma change control management
that encompasses all three of these components.
The four phases of the evolution from the initiation of
Six Sigma to the successful establishment of Six Sigma as
the new culture are:
❑ Phase 1: Definition
❑ Phase 2: Deployment
❑ Phase 3: Growth
❑ Phase 4: Permanence
The required actions and typical behaviors of each phase
are listed below:
M
A N A G I N G
C
H A N G E
175
9872 Demystifying Six Sigma 2/22/03 8:52 PM Page 175

New Skills Stages
Participant’s Need
Activities
Leader’s Role
Training in
new skills
Must recognize the need to
change
- Needs identified
- Gap analyses completed
- Training program developed
- Class curricula created
- Training classes held
- Establish method to measure
training effectiveness
- Publicize training
- Communicate expectations
- Provide funding
Mastery of
new skills
Must know what is expected
- Practice new skills
- Deploy skills awareness
- Read subject matter books
- Encourage skills usage
- Create opportunities for
application of skills
Application of
new skills
Must be held accountable for
application of skills
- Join a team
- Seek opportunities
- Establish a formal review
system to track usage
- Reinforce application of skills
Results from
new skills
Must be held accountable for
results
- Show positive results
- Tie results to business
objectives
- Establish a formal system to
track results
- Provide recognition for
effective usage of skills
Figure 11-3. Four stages of effective training program.
9872 Demystifying Six Sigma 2/22/03 8:52 PM Page 176

Phase 1: Definition
❑ Business objectives for the enterprise have been
defined.
❑ Complete the required organizational development
work such that future actions can tie to the
business objectives.
❑ Define expectations of Six Sigma.
❑ Identify the required knowledge and skills.
❑ Complete gap analysis between present knowledge
and skills and desired knowledge and skills.
❑ Determine the required training and initiate the
training program.
❑ Create the required curricula and begin training.
❑ Establish metrics that will measure success of the
Six Sigma program.
❑ Employees are aware that management is planning
a new initiative.
❑ At this stage, employee involvement is minimal.
❑ Start the training of team leader and facilitator
candidates.
❑ Employees are both eager and wary of what will be
expected of them.
❑ Funding is provided for the Six Sigma program.
Phase 2: Deployment
❑ The design and expectations of Six Sigma are com-
municated to all employees.
❑ Initial teams are formed and chartered with contin-
uous improvement projects.
M
A N A G I N G
C
H A N G E
177
9872 Demystifying Six Sigma 2/22/03 8:52 PM Page 177

❑ Training in teaming skills and improvement tools is
provided to all employees.
❑ Leaders begin organizational changes to enable
cross-functional and work-unit teams.
❑ Leaders coach individual employees.
❑ Employees are learning new skills and seeking
opportunities to apply them.
❑ Facilitators are required for team meetings.
❑ Individual employees realize that it is going to
require a lot of personal changes.
Phase 3: Growth
❑ Teams gel as effective continuous improvement
units.
❑ Results become rapidly evident as quality improve-
ment tools are applied effectively.
❑ Leaders make more information available to teams.
❑ Leaders are able to transfer responsibility and
accountability to the teams.
❑ Formal review processes are in place to monitor
the effectiveness of Six Sigma.
❑ As employees not already on teams are making
proposals for continuous improvement projects,
the number of teams grows.
❑ Facilitators are seldom required at team meetings.
❑ Reflecting a change in the way people view their
working relationships and how the work gets
done, the everyday language of employees at all
levels begins to change.
❑ Morale is improving rapidly.
178
G
E T T I N G
S
TA RT E D
9872 Demystifying Six Sigma 2/22/03 8:52 PM Page 178

Phase 4: Permanence
❑ Six Sigma is now the cultural base for the
enterprise.
❑ Employees think in terms of customer satisfaction.
❑ A mind-set of continuous improvement is
established at all levels.
❑ Employees at all levels think in terms of collabora-
tive efforts.
❑ New behaviors and skills have been mastered.
❑ Results continue to soar.
❑ Employees require minimal input from leaders.
❑ Reward and recognition systems are in place to
reinforce positive results.
❑ Morale is outstanding.
❑ Costs are decreasing and profits are improving.
❑ The enterprise has a positive reputation with
customers, suppliers, the community, and
investors.
As a company, division, or work unit transitions along
the journey from the definition phase to the permanence
phase, performance varies (see Figure 11-4). During the
definition phase, before the new skills and behaviors begin
to be rolled out to all employees, the old methods of do-
ing work are still in effect. During this phase, performance
is flat. As the new skills and behaviors are being deployed,
old methods are phased out as employees are struggling
with the application of the new skills. Typically, this can
result in a decrease in performance. Then as everyone
masters the new skills and behaviors, results will soar.
M
A N A G I N G
C
H A N G E
179
9872 Demystifying Six Sigma 2/22/03 8:52 PM Page 179

Definition
Deployment
Growth
Permanence
P
E
R
F
O
R
M
A
N
C
E
Figure 11-4. Performance levels of Six Sigma transition.
9872 Demystifying Six Sigma 2/22/03 8:52 PM Page 180

Your Six Sigma Journey
Six Sigma is not a destination; it is a continuous journey.
It is a journey that is available to everyone. Whatever your
position within the hierarchy of your company, you can
participate in the journey. Each journey is unique. I can-
not tell you exactly where your journey will take you, but
I can tell you that it will be a better place than where you
are today.
This book provides the guidelines for how to create a
culture where Six Sigma can thrive, how ever-improving
results can be achieved by teams that utilize simple tools,
and how to work through the changes that will occur along
your journey.
Your Six Sigma journey will take you to places where
inefficiencies are removed from all operations. Your jour-
ney will take you to places where employees of high morale
are constantly striving to make things better and are achiev-
ing results that were previously unheard of.
Now, please, start your journey.
Notes
1. Kenneth Blanchard, Patricia Zigarmi, and Drea Zi-
garmi, Leadership and the One Minute Manager (New York:
William Morrow, 1985).
2. Bruce W. Tuckman, “Developmental Sequence in
Small Groups,” Psychological Bulletin 63, 6 (1965): 384–399.
3. Donald L. Kirkpatrick, Evaluating Training Programs
(San Francisco: Berrett-Koehler, 1994).
M
A N A G I N G
C
H A N G E
181
9872 Demystifying Six Sigma 2/22/03 8:52 PM Page 181

9872 Demystifying Six Sigma 2/22/03 8:52 PM Page 182
This page intentionally left blank

183
accounting, Continuous
Improvement programs
for, 55
achievement metrics, 150
action, importance of,
159–160
action plans
as components of change
management, 31
as living documents, 111
for root cause identifica-
tion, 108–111
administrative metrics, 55–57
Alice’s Adventures in
Wonderland, 22–23
“As Is” interdepartmental
flowchart, 94, 96–97
“As Is” linear flowchart, 90,
91
“ask why” techniques, 51,
73
attribute data, 60–65
definition of, 60
requirements of, 60
units for measurement of,
61–63
baseline, definition of, 58
baseline performance
as defect rate, 64
metric example of, 65
benchmarking, as quality
tool, 22
black belts, 14–15
need for, 33–34
Blanchard Situational
Leadership Model, 81
Boyd, L.M., 54
brainstorming
prioritizing of ideas,
105–107
rules of, 99
steps of, 100
Brennan, Walter, 144
business objectives, see
objectives
champion, role of, 80
change management
components of, 28–31
definition phase, 177
deployment phase,
177–178
I N D E X
9872 Demystifying Six Sigma 2/22/03 8:52 PM Page 183

change management
(continued)
growth phase, 178
permanence phase, 179
Six Sigma model, 175
charting, see also flowcharting
definition of, 46
as tool of Continuous
Improvement, 46
check sheet
as data collection tool, 112
definition of, 46
sample for measurement
defect, 119–122
sample for product defect,
113–116
sample for product delay,
116–119
steps for utilizing, 112–113
closed-ended questions, 35
coaches, see also facilitators
roles of, 168
communication, as Six Sigma
component, 17, 18
consensus, definition of, 83
continuous data, 58–59
Continuous Improvement
cycle, 44, 45
need for, 54–55
objective of, 50
teams, see teams
tools
charting, 88–98
check sheet, 112–120
fishbone diagram,
103–105
histogram, 126–130
Pareto diagram, 69–73
scatter diagram, 130–136
stratification, 122–126
Continuous Improvement
programs
examples of, 55–57
initiation of, 68
institutionalization of,
138–142
and physical change,
142–145
and procedural change, 145
and training, 145–147
and work method change,
142
Cotter, John, 77
cross-functional mapping, 33
customer data
collection of, 37
evaluation of, 34–35
customer nonconformance,
sample Pareto diagram
of, 72
customer satisfaction
as key to Six Sigma pro-
gram, 141, 165
survey, 35
total (TCS), 13, 20
customer service, Continuous
Improvement programs
for, 55
184
I
N D E X
9872 Demystifying Six Sigma 2/22/03 8:52 PM Page 184

data
analysis tools, see his-
tograms; scatter dia-
grams; stratification
attribute, 60–65
collection, 112–113
tools, see check sheet
continuous, 58–59
historical, metric example
of, 65
variable, 59
defect rate
baseline performance as,
64
calculation of, 61, 62
metric for, 63
and Six Sigma calcula-
tions, 12
defects, definition of, 57–58
definition, as phase in transi-
tion to Six Sigma, 177
Deming, W. Edwards, 19, 23
deployment, as phase in tran-
sition to Six Sigma,
177–178
development engineering,
Continuous
Improvement programs
for, 55
DMAIC model, 44
employees
empowerment of, 22
pride of ownership of,
15–16
empowerment
as part of Six Sigma cul-
ture, 33
as quality tool, 22
experimental designs, 59
facilitators
attributes of, 82
identification of, 168
role of, 80–81
in brainstorming, 99
as Six Sigma component,
17, 18
Feigenbaum, Armand, 13
financial performance, assess-
ment of, 36
fishbone diagram,
103–105
and brainstorming, 104
definition of, 46
prioritizing of ideas,
105–107
rules for constructing,
103
sample, 104
Fisher, Kimball, 139
flowcharting
interdepartmental,
93–98
linear, 89–93
symbols used in, 89
forming/storming/norming/
performing model, 172,
174
I
N D E X
185
9872 Demystifying Six Sigma 2/22/03 8:52 PM Page 185

Galvin, Robert, 7, 9–10
General Electric
Six Sigma utilization at,
140
goal, establishment of, 58
green belts, 14–15
need for, 33–34
growth, as phase in transition
to Six Sigma, 178
histogram
creation of, 127–128,
129–130
as data analysis tool, 112
samples, 127–128, 131
uses for, 126
idea generation, methods of,
see brainstorming; fish-
bone diagram
improvement goal
metric example of, 64, 66
Six Sigma, 64, 66
improvement metric
definition of, 57
elements of, 58
incentive, as component of
change management,
29–30
interdepartmental flowchart-
ing, 88, 93–98
“As Is,” 94, 96–97
example, 93–98
purpose of, 93
“Should Be,” 98, 100–101
inventory control,
Continuous
Improvement programs
for, 56
Ishikawa diagram, see fish-
bone diagram
Ishikawa, Kauro, 40
Juran, Joseph M., 19
key initiatives, prioritization
of, 167
Kirkpatrick, Donald L., 175
leadership
change model, 173
and Six Sigma transition,
172
styles, 172
linear flowcharting
“As Is,” 90, 91
example, 89–93
purpose of, 88, 89
“Should Be,” 93, 94
local statistical resources
(LSRs), 13
macro metrics, 167–168
Malcolm Baldrige National
Quality Award, com-
monalities of recipients,
21
186
I
N D E X
9872 Demystifying Six Sigma 2/22/03 8:52 PM Page 186

managers
emergence of new breed
of, 140
transition from command-
and-control orientation,
139
marketing, Continuous
Improvement programs
for, 56
metrics
administrative, 55–57
creation of, 63
definition of, 57
to illustrate achievement,
150
macro, 167–168
support, 55–57
MIS, Continuous
Improvement programs
for, 56
mission statement, definition
of, 24
Motorola
benchmarking of Japanese
operating methods, 8–9
lessons learned from
Japanese, 9
local statistical resources at,
13
1980s performance prob-
lems of, 7–8
opportunity-for-error
concept at, 11
Six Sigma launch (1987),
9
Six Sigma vision statement,
9, 10
total customer satisfaction
teams at, 14
negative correlation, as out-
come of scatter diagram,
135
Null, Jack, 83
objectives
definition of, 25
documentation of, 166
examples of, 25, 151–152
open-ended questions, 36
operational statement
criteria for, 50
definition of, 49
metric example of, 65
opportunity-for-error
definition of, 11
development of concept,
11
organizational development
framework for, 24–27
as key to success of Six
Sigma, 23–24
Pande, Peter, 12
Pareto diagram
I
N D E X
187
9872 Demystifying Six Sigma 2/22/03 8:52 PM Page 187

Pareto diagram (continued)
collecting data for, 70–71
creation of, 71
definition of, 46, 69
sub-Paretos, 73
Pareto principle, 69
participation, and transition
to Six Sigma, 172,
174
performance
baseline, see baseline per-
formance
improving individual,
162
measurement of, 58
performance review process,
establishment of, 168
permanence, as phase in
transition to Six Sigma,
179
personnel, Continuous
Improvement programs
for, 56
positive correlation, as out-
come of scatter diagram,
135
post-Six Sigma culture, 169
pre-Six Sigma culture, 169
prioritizing
example, 106–107
techniques for, 105
problem solving, tools of, 45
problem statements, clarity
of, 50
procedures, Six Sigma effect
on, 145
process characterization, 59
products, conforming vs.
nonconforming, 60
purchasing, Continuous
Improvement programs
for, 56–57
QC Circles, 40
quality assurance,
Continuous
Improvement programs
for, 57
quality control, Continuous
improvement programs
for, 57
quality culture
middle management role
and, 21
senior management role
and, 21
quality programs, evolution
of, 19, 23
resources, as component of
change management,
30–31
reward and recognition
as quality tool, 22
as Six Sigma component,
17, 18
root causes
definition of, 99
188
I
N D E X
9872 Demystifying Six Sigma 2/22/03 8:52 PM Page 188

generating lists of, see
brainstorming; fishbone
diagram
identification of, 108–111
action plans for, 109,
110
prioritizing of, 105–107
scatter diagrams
creation of, 131
as data analysis tool, 112
definition of, 46, 131
outcomes of, 135
samples, 134, 136
scientific approach, used by
teams, 85
senior executive behavior, as
Six Sigma component,
17, 18
service, conforming vs. non-
conforming, 60
“Should Be” interdepart-
mental flowchart, 98,
100–101
“Should Be” linear flow-
chart, 93, 94
Sigma-scale measures, 12
Six Sigma, see also Six Sigma
culture; Six Sigma tran-
sitioning
calculations of, 11
components of, 17, 28
Continuous Improvement
program, see Con-
tinuous Improvement
programs
foundation stones of, 165
key to success of, 23
launch of at Motorola, 9
and organizational devel-
opment, 23–27
rate of improvement goal,
64
as total quality manage-
ment system, 20
Six Sigma culture, see also Six
Sigma; Six Sigma transi-
tioning
articulating a vision of,
166–167
contents of, 5
creation of, 16–17, 32–34,
165–169
critical components of, 165
decision to create, 166–167
elements of, 31
evolutionary phases of,
175, 177–179
ingredients for transforma-
tion to, 17
success of, 162
Six Sigma program
customer focus of, 141
DMAIC model, 44, 45
increasing participation in,
43
preliminary steps, 38,
42–43
I
N D E X
189
9872 Demystifying Six Sigma 2/22/03 8:52 PM Page 189

Six Sigma transitioning,
28–31
definition phase, 177
deployment phase,
177–178
first steps in, 163–169
growth phase, 178
performance levels of,
180
permanence phase, 179
pre- vs. post-, 169
training and, 145–147,
167, 175
skills, as component of
change management,
28–29
Smith, Bill
definition of TQM, 13
as developer of Six Sigma
arithmetic, 11, 12
strategies
definition of, 25–26
examples of, 26
stratification
as data analysis tool, 112
definition of, 46, 122
examples of, 123–126
sub-Paretos, 73
support metrics, 55–57
tactics, definition of, 26–27,
152
teaming, see also team mem-
bers; teams
effect of on performance,
138
as part of Six Sigma cul-
ture, 33
as quality tool, 22
successful practices of,
84–85
team leader, role of, 76,
78–79
team meetings
reaching consensus in,
83
resolving conflicts in,
83
rules of conduct for,
82–84
team members
defined roles of, 79, 84
required training for, 146,
147
selection of, 73–75
team performance, stages of,
174
team recognition, 153–155
importance of, 154
programs for, 154
team recorder, role of, 79
teams
balanced participation on,
85
Continuous Improvement
programs for, 55
creation of, 168
cross-functional, 37
190
I
N D E X
9872 Demystifying Six Sigma 2/22/03 8:52 PM Page 190

defined roles on, 79, 84
ground rules for, 85
identification of, 68–73,
78
improved performance
due to, 77
membership of, 75–76
resistance to, 77
motivation of, 74
publicizing accomplish-
ments of, 169
recognizing knowledge of,
75
staffing of, 73–77
time commitment of, 76
tooling, Continuous
Improvement programs
for, 56–57
total customer satisfaction
(TCS), 21
teams, 14
total quality management
(TQM)
definitions of, 13
Six Sigma–based, 20
training
Continuous Improvement
programs for, 56–57
as quality tool, 22
as Six Sigma component,
17, 18
and Six Sigma transition,
145–147, 167, 175
training programs
design of, 171
stages of, 176
transitioning, see Six Sigma
transitioning
Tycoon, The, 144
uniform measurement, as Six
Sigma component, 17,
18
USS Sam Houston, 160
USS Thresher, 160
variable data, measurement
of, 59
vision, as component of
change management, 28
vision statement, definition
of, 24
Welch, Jack, 140
work flow, Six Sigma effect
on, 142–145
work methods, Six Sigma
effect on, 142
Wycoff, Joyce, 16
zero defects, fallacy of,
161–162
I
N D E X
191
9872 Demystifying Six Sigma 2/22/03 8:52 PM Page 191
Document Outline
- Demystifying Six Sigma A Company-Wide Approach to Continuous Improvement
- Demystifying Six Sigma A Company-Wide Approach to Continuous Improvement
- SECTION ONE: THE BASICS OF SIX SIGMA
- SECTION TWO: A SIX SIGMA CONTINUOUS IMPROVEMENT TEAMING MODEL
- Chapter 4 Step 1: Create the Operational Statement and Metric
- Chapter 5 Step 2: Define the Improvement Teams
- Chapter 6 Step 3: Identify Potential Causes
- Chapter 7 Step 4: Investigation and Root Cause Identification
- Chapter 8 Step 5: Make Improvement Permanent
- Chapter 9 Step 6: Demonstrate Improvement and Celebrate
- SECTION THREE: GETTING STARTED
- Index
Wyszukiwarka
Podobne podstrony:
AMACOM Demystifying Six Sigma 2003
Demystifying Six Sigma A CompanyWide Approach to Continuous Improvement
Quality Beyond Six Sigma Butter Worth Heinemann 2003 4AH
Project Management Six Sigma (Summary)
SIX SIGMA raport
Ref six sigma
Tabela przeliczeniowa Six Sigma, WZR UG, III semestr, Zarządzanie jakością - prof. UG, dr hab. Małgo
Lean Six Sigma
Sześć sigma six sigma metoda 6 sigm
Nowa Six Sigma nowasi
Lean Six Sigma, Lean
Six Sigma
Implementing Six Sigma Quality at Better Body Manufacturing
Cz Mesjasz SIX SIGMA 25 01 2012
pytania wszystkie six sigma, jakość pytania
Zarządzanie przez jakość Six Sigma
Zarządzanie przez jakość Six Sigma tekst do mówienia
SIX SIGMA koncepcja doskonalenia jakości (8 stron)
Six Sigma
więcej podobnych podstron