
Andrzej Ozadowicz, MSc., Eng.
Institute
of Electrical Drives Automation and Industrial Equipments, AGH - UST
Comparative Analysis of KNX and LonWorks
The Intelligent Building Systems in Energy Consumption
and Power Quality Monitoring
1. Introduction
This text is a effect and a summary of author’s research works, connected with his PhD
dissertation and focused on comparison of two the most popular intelligent building systems –
KNX and LonWorks. The comparison take into consideration openness, reliability (especially
– reliability of communication) and interoperability of these systems. This paper is
particularly devoted to possibilities of intelligent building systems using in electrical energy
consumption and basic supply parameters measurements, taking into consideration power
quality factors and quantities. It is the completion of issues were presenting on the two last
KNX Scientific Conferences. The problems connected with electrical power quality was
broadly presented in 2004 (MSc. Andrzej Ozadowicz: „Energy Saving and Electrical Power
Quality Control in Intelligent Building Systems”, Deggendorf 2004) and in 2005 author
discussed communication reliability questions in KNX and LonWorks buses (MSc. Andrzej
Ozadowicz: „Communication Reliability in the Intelligent Building Systems”, Pisa 2005).
All tests and measurements have been realized at special laboratory places, equipped with
freely available system devices with basic functions for one room in intelligent building.
Additionally there were electrical energy and basic supply parameters meters with KNX and
LonWorks interfaces (ABB’s meter – DZ 4000 KE and Goosen-Metrawatt’s A2000
Multifunctional Power Meter) at the laboratory places.
2. The telegrams in buses - communication reliability
During the research works a lot of real transmission signals in systems’ buses have been
captured, both for KNX and LonWorks standards. They were talked over and analysed on
previous Conference, but some of them have direct influence on further tests and analyses
presented in present study, therefore below only short basic conclusions are mentioned.
On the basis of those research works it was stated, that in some cases disturbances in systems’
communication buses leads to transmission distortions and even interruptions. It was
especially connected with LonWorks standard. These conclusions have been confirmed in the
next measurements and tests of data transmission signals form energy meters, with
information about consumed energy. When all electrical devices at the laboratory places had
been switched on and data signals form energy meters had been generated, there were right
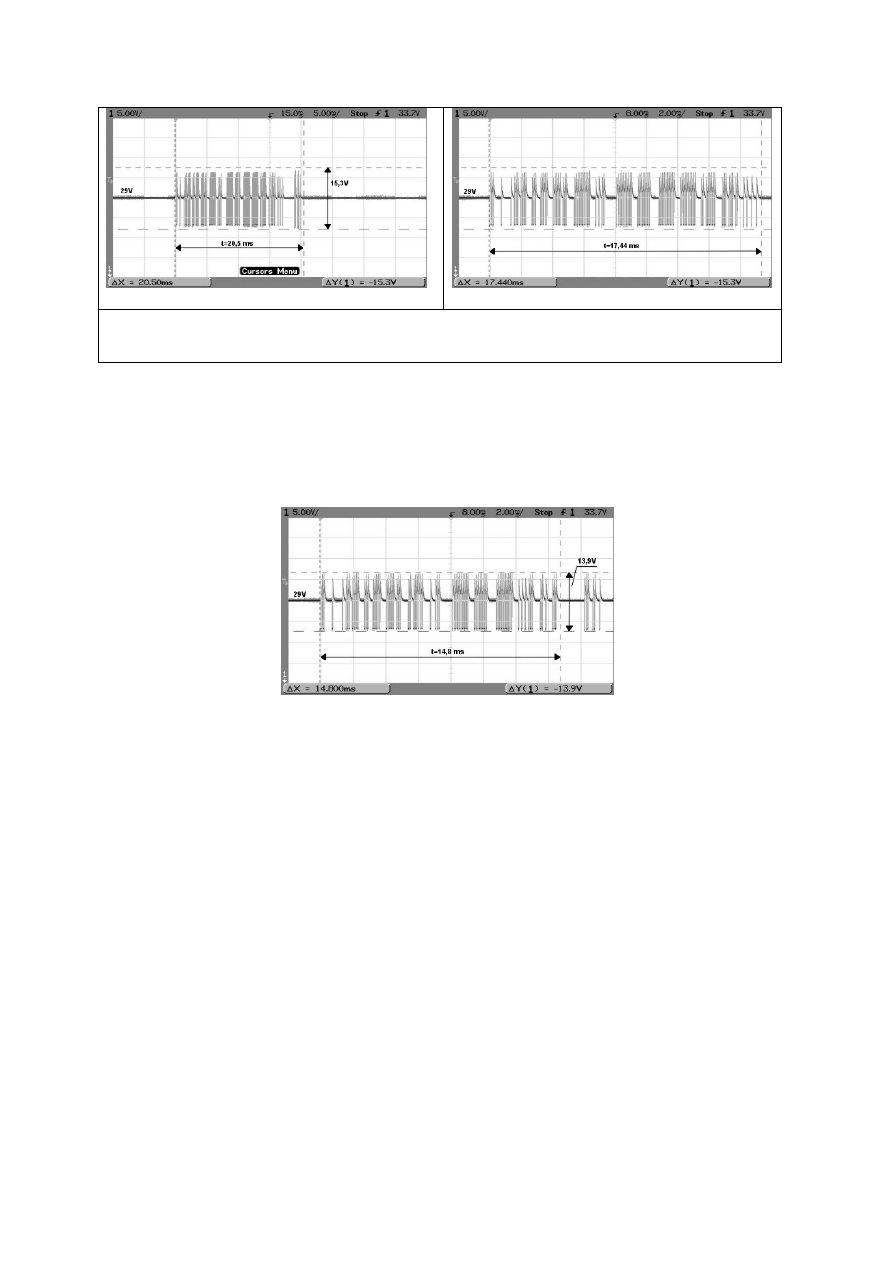
transmission and signals only in KNX standard’s bus. On the Figure 1 the captured telegram
with basic information about actual value of consumed active energy form DZ 4000 KE meter
is presented.
a)
b)
Figure 1 –KNX telegram: consumed active energy - value; a) telegram with confirmation signal, b)
telegram – only useful information (other duration)
This kind of telegram takes 17,5 ms and with confirmation about 20,5 ms. It is about 40%
longer than basic telegrams (like switch on/off). DZ 4000 KE meter has ability to send
telegrams with information about change s of instantaneous (current) active and reactive
power every 8 seconds or after achieving appropriate level of power change (established
earlier during device adjusting). This kind of telegram is presented on Figure 2.
Figure 2 – KNX telegram: instantaneous active power value – DZ 4000 KE meter
This telegram’s duration is similar to basic KNX telegrams, because it basis on short bit word
(EIS object).
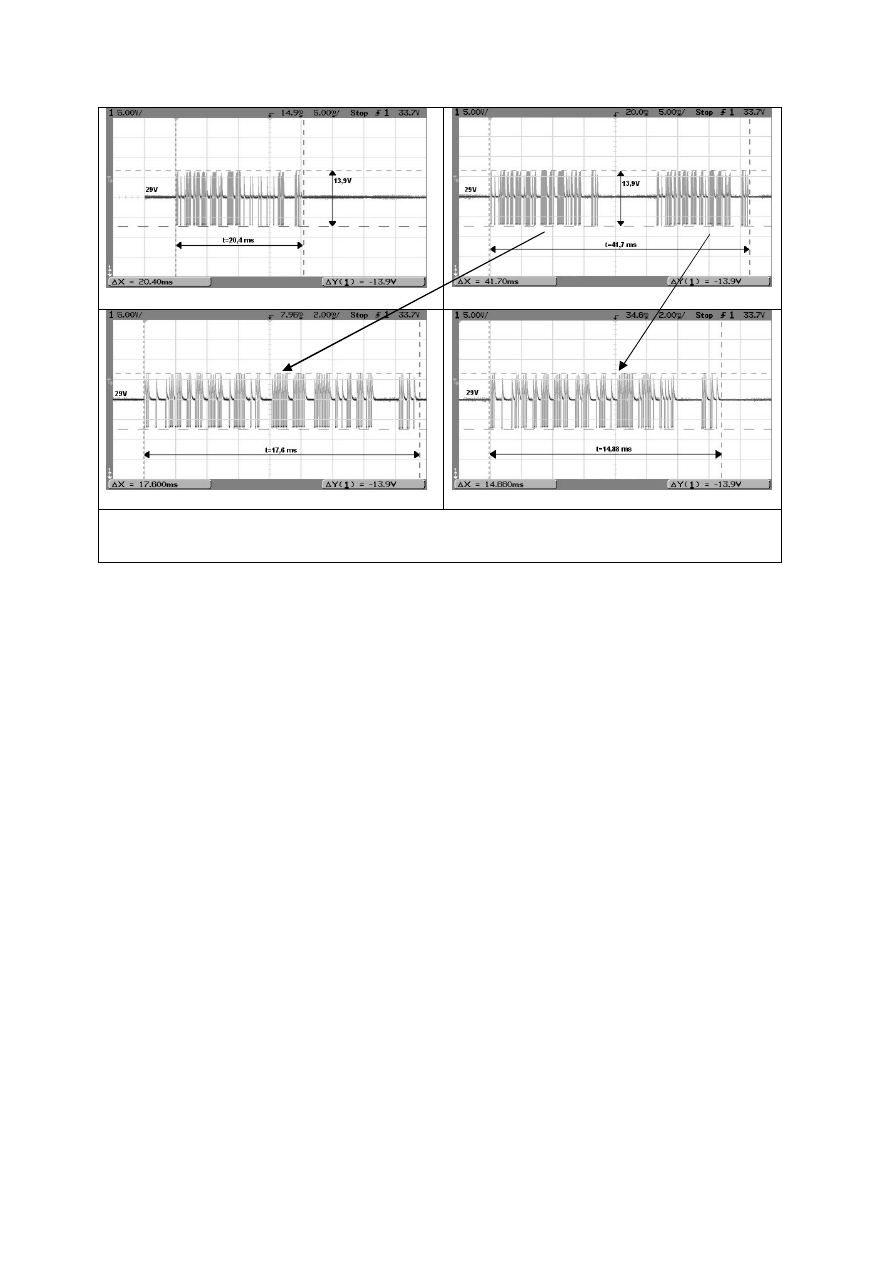
To transmit information about instantaneous reactive power level this meter has two types of
telegrams presented on Figure 3. First of them is single telegram with long duration, basis on
EIS 11 object (32 bit counter; ranges: 0 to 4294967295 or from –2147483648 to
+21467483647). To send full information about the reactive power, information about sign is
needed (inductive or capacitive power). Therefore the range with signs is used in this
situation. Second type of telegram it is actually two individual telegrams : the first with
information about instantaneous power value (EIS 10 object – 16 bit counter, range: 0 to
65535 or –32768 to +32767) and the second with sign (EIS 1 object – switching <on/off>,
1 bit). The sign information separation could be used in practise for example to identify alarm
situation, when one kind of reactive power is not allowed or desired in supply network.
Second of mentioned telegrams could be used also if there are small levels of instantaneous
reactive power in the system and particularly if information about sign is not desired.
a)
b)
c)
d)
Figure 3 – KNX telegrams: instantaneous reactive power level; a) single telegram (EIS 11), b) two
individual telegrams level - sign, c) level telegram (EIS 10), d) sign telegram (EIS 1)
Single telegram (Figure 3 a) duration is similar to telegram with the active energy
consumption information about. The second type of telegram with reactive power is
connected obviously with longer duration – about 42 ms, both power level and sign
information are desired. Note that for both individual telegrams from second type, the
confirmation signal is needed. It is proof that they are actually two independent information.
Unfortunately, as it was mentioned earlier, it was not possible to capture similar telegrams for
LonWorks standard. Disturbances in the LonWorks bus were significant (they have had high
amplitude) and caused transmission interruptions. Sources of these disturbances were: the PC
and the servomotor with digital controller, load for meters – they were detailed described on
last year Conference. It is important to note that measurements and tests have been realized in
specific laboratory circumstances and with the help of concrete instruments. The main reason
of problems it was oscilloscope (AGILENT 54624A -100 MHz, 200 MSa/sec, input
resistance 1MO) connected to the bus to observe and capture signals. If the oscilloscope had
been disconnected, transmission was correct.
3. The intelligent building systems and consumption energy and power
quality measurements issue
The electrical energy in power supplies networks in buildings yield to deterioration during
transmission and distribution in building. It is effect of the common electromagnetic
disturbances. These phenomena bring changes of supply parameters, power quality indicators
and features. As the result they are differ form nominal values, in steady states at sinusoidal
waves in symmetric poly-phase systems. Low power quality could lead to a lot of negative
states in electrical loads (receivers) or sometimes make the work of these devices impossible.
These issues were topic of discussion at Conference in 2004. On the Figure 4 there are
presented examples of common phenomena in supply networks, connected with power
quality.
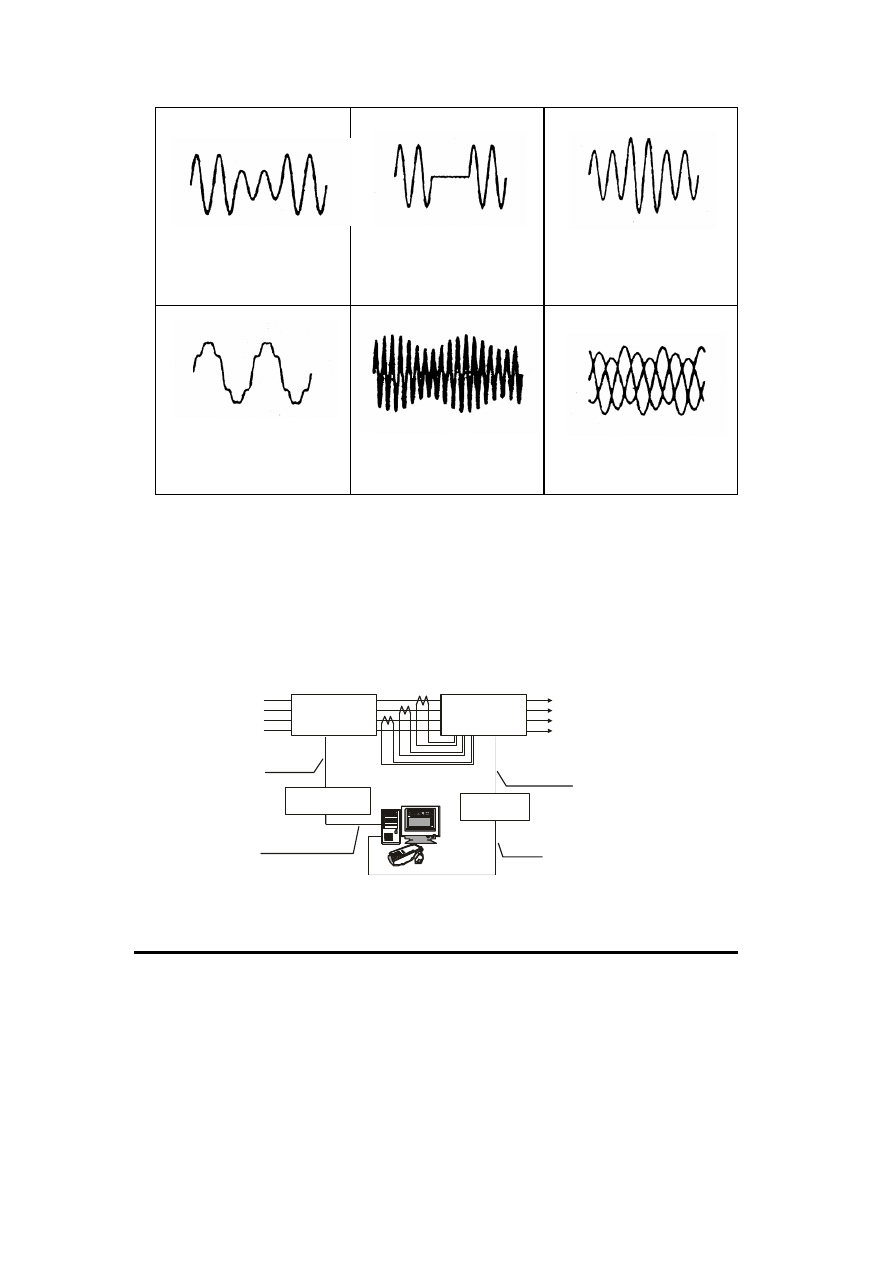
Voltage dip
Short supply
interruption
Voltage changes –
increase of RMS
Voltage or current
distortion - harmonics
Voltage fluctuations
asymmetry
Figure 4 – The examples of common electromagnetic disturbances in power supply networks
Bringing into the market new energy meters and multifunctional power meters with intelligent
building systems’ interfaces, allow to use them in electrical energy and power quality
parameters monitoring and measurements. To make appropriate tests, both mentioned earlier
meters, they have been installed in supply line transmitted energy to rooms and lecture halls
in building B-1 AGH-UST in Krakow (Electrical Faculty). Chart with connections of the
system is presented on Figure 5.
DZ 4000 KE - KNX
meter
iLON 10
LON/TCP-IP
Interface
KNX - RS 232
L1
L2
L3
N
LonWorks bus
KNX bus
A2000 - LON
meter
Power supply line
in the B-1 building
AGH-UST Krakow
L1
L2
L3
N
Current transformer
50/5A
Serial
communication
TCP/IP
protocol
Figure 5 – Supply line in B-1 building – connections chart
•
Multifunctional power meter A2000 – measurements with LonWorks standard
Multifunctional power meter A2000 has ability to energy consumption and power levels
measurements and additionally observation a lot of power supply network parameters, that are
crucial from the preservation of good power quality point of view. These data are transmitted
by LonWorks bus as adequately define network variables (components of LonWorks device’s
interface). For tests and measurements some of them have been selected:
Ø energy (Wh, VArh)
(network variable: SNVT_elec_whr_f)
Ø power (all types)
(network variable: SNVT_power_f)
Ø voltage
(network variable: SNVT_volt_f)
Ø current
(network variable: SNVT_amp_f)
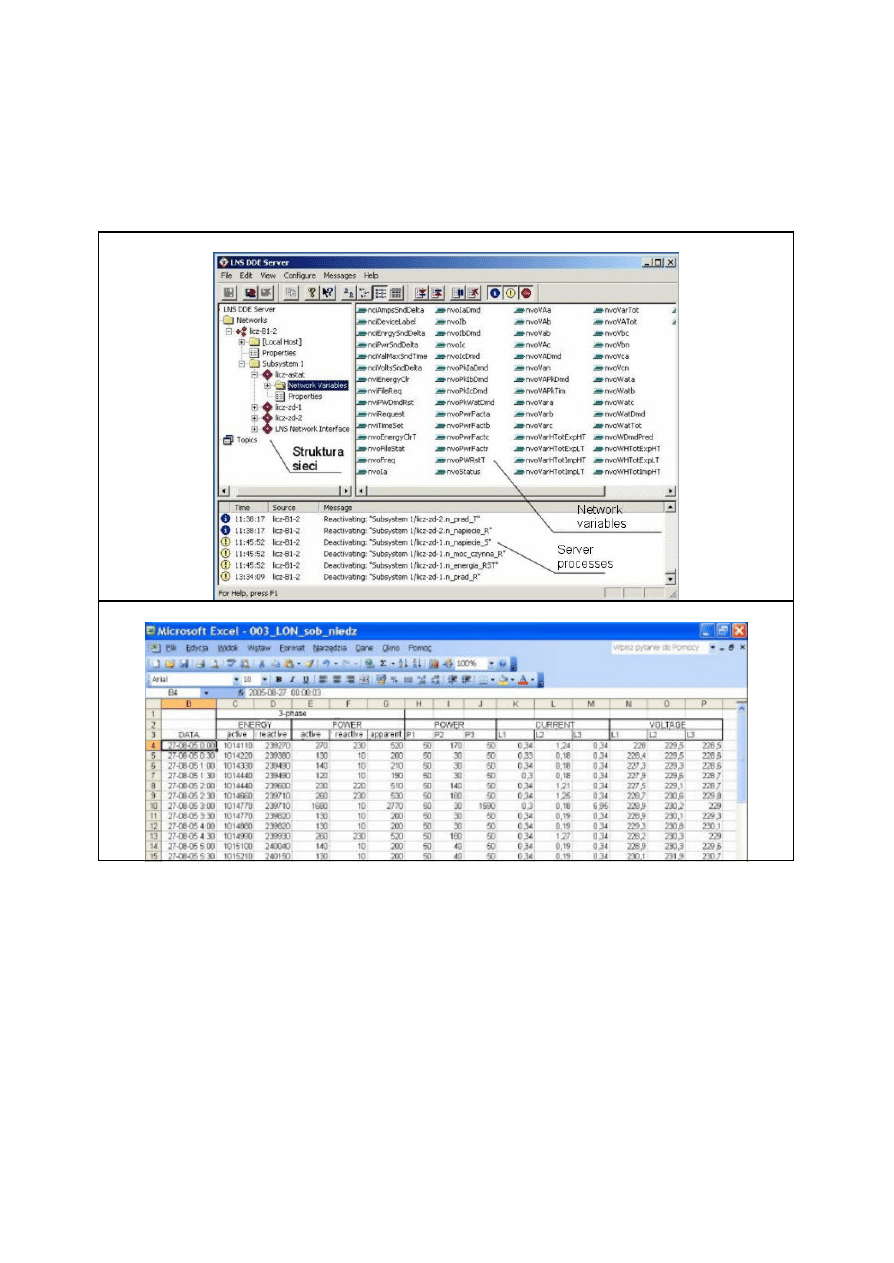
To record and storage data transmitted by LonWorks network, LNS DDE Server package has
been used. This package allow to present those data in sheets of common PC application –
Microsoft Office Excel. Data are transmitted directly to Excel’s sheet, where they are
recorded and stored as a file (appropriate macro is needed). The window of LNS DDE Server
and fragment of the Excel’s sheet with data are presented on Figure 6 a) and b).
a)
b)
Figure 6 – Data acquisition in LonWorks system: a) LNS DDE Server, b) Excel package
Data collected during measurements allow to assess how much electrical energy is used in
different time durations, what are demands for power at selected moments and what are levels
and values of basic supply network parameters, if some of loads are connected or
disconnected to it. For the sake of easy interpretation huge data collections, graphical
presentation – graphs have been chosen. Those graphs are presented at the next part of text,
where they are compared with similar graphs drawn for KNX standard (on the basis of data
from DZ 4000 KE meter).
Unfortunately due to all network variables for single node in LonWorks network have been
used by meter’s manufacturer (max number of variables is 64) to transmit data and parameters
directly connected with currents, voltages, energy and power, there are not enough network
variables to transmit data with current THD factor value and amplitudes of selected current or
voltage harmonics, although they are measured by meter A2000. This kind of information is
only available to observe and record by serial port RS 232 and could be graphically presented
as varied graphs (line, bar) with proprietary software for this meter - METRAwin 10/A2000
package.
•
DZ 4000 KE meter – measurements with KNX standard
DZ 4000 KE meter has similar as A2000 abilities to energy consumption measure in power
supply line, current voltages and currents in individual phases, power factor, frequency and
current instantaneous power levels (active and reactive power). Some of these values could
be transmitted as KNX’s telegrams by system’s bus and then used by other nodes or data
acquisition systems (for example: visualisation, HMI etc.). Used EIS objects are as follow:
Ø Active and reactive energy – EIS 11 – 32 bit counter
Ø Instantaneous active and reactive power – EIS 10 – 16 bit counter
Ø Instantaneous active and reactive power with sign – EIS 11 – 32 bit counter
Ø Request meter reading – EIS 1 – 1 bit
Ø Type (sign) of instantaneous power – EIS 1 – 1 bit. It is used with EIS 10 together
(instantaneous power absolute value)
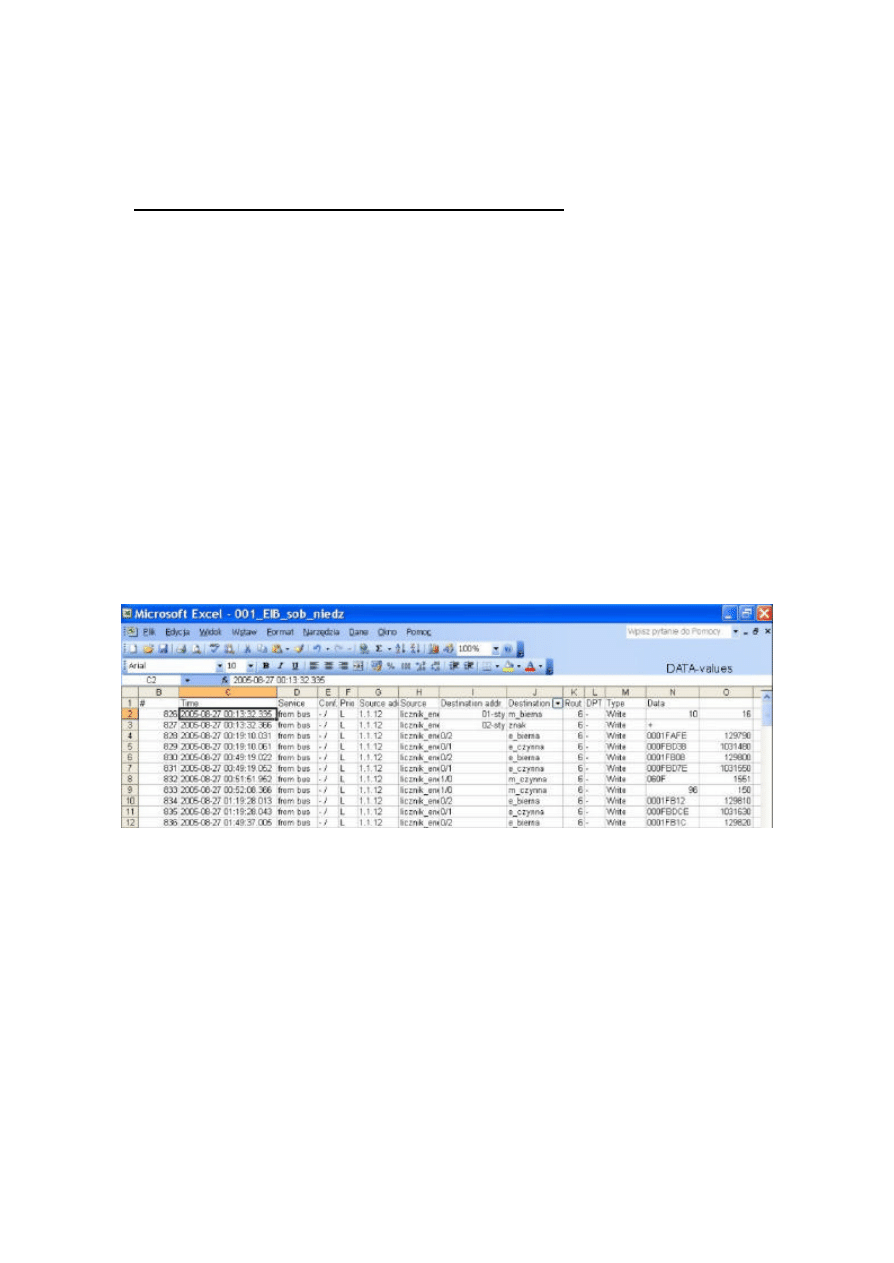
To record and storage KNX data, the tool Group Monitor form ETS3 package cooperated
with Microsoft Excel have been used. The telegrams recorded in Group Monitor had been
saved as data (text) files and then they have been processed in Excel package. It is worth to
note that values (for example energy consumption data) are recorded as hexadecimal,
therefore the first and basic operation in Excel is conversion of them to decimal form. The
fragment of the window with Excel’s data sheet is presented on Figure 7.
Figure 7 – The Excel package window with KNX standard data
The collected data, after adequately process, have been used to create graphs to fast and
simple interpretation. These graphs are presented at the next part of the paper.
Unfortunately, although DZ 4000 KE meter has ability to measure basic parameters of power
quality (phase voltages, phase currents, frequency, power factors etc.), no one of them is
available as communication object, telegram fo r system’s bus. They are only available for
user directly on LCD display on meter’s casing. They are not available by any other popular
communication standard (RS 232, RS 485, USB).
From the author’s point of view to enhance meter’s functionality and its better adaptation to
current market demands (power quality is more and more popular among engineers and
individual consumers), it is very important to equip it with for example USB connection port
and make available additional data (for example: voltage and current harmonics, voltage and
current RMSs, frequency etc.) by this serial port and system bus (EIS objects).
4. The analysis of selected data from energy meters
As it was mentioned above the data colleted during measurements for both standards have
been used to create some graphs. The data had been collected during 3 months period in 2005
– August, September and October. Four days have been selected for each month – Tuesday,
Wednesday and Saturday, Sunday. It is worth to note, that each of the months is specific from
energetic point of view. August is holiday period for the universities, so low energy
consumption is characteristic for it. October however is the first month of academic year and
this is connected with radical growth in energy consumption (more loads are connected to the
supply network). September is transitory period between those two months.
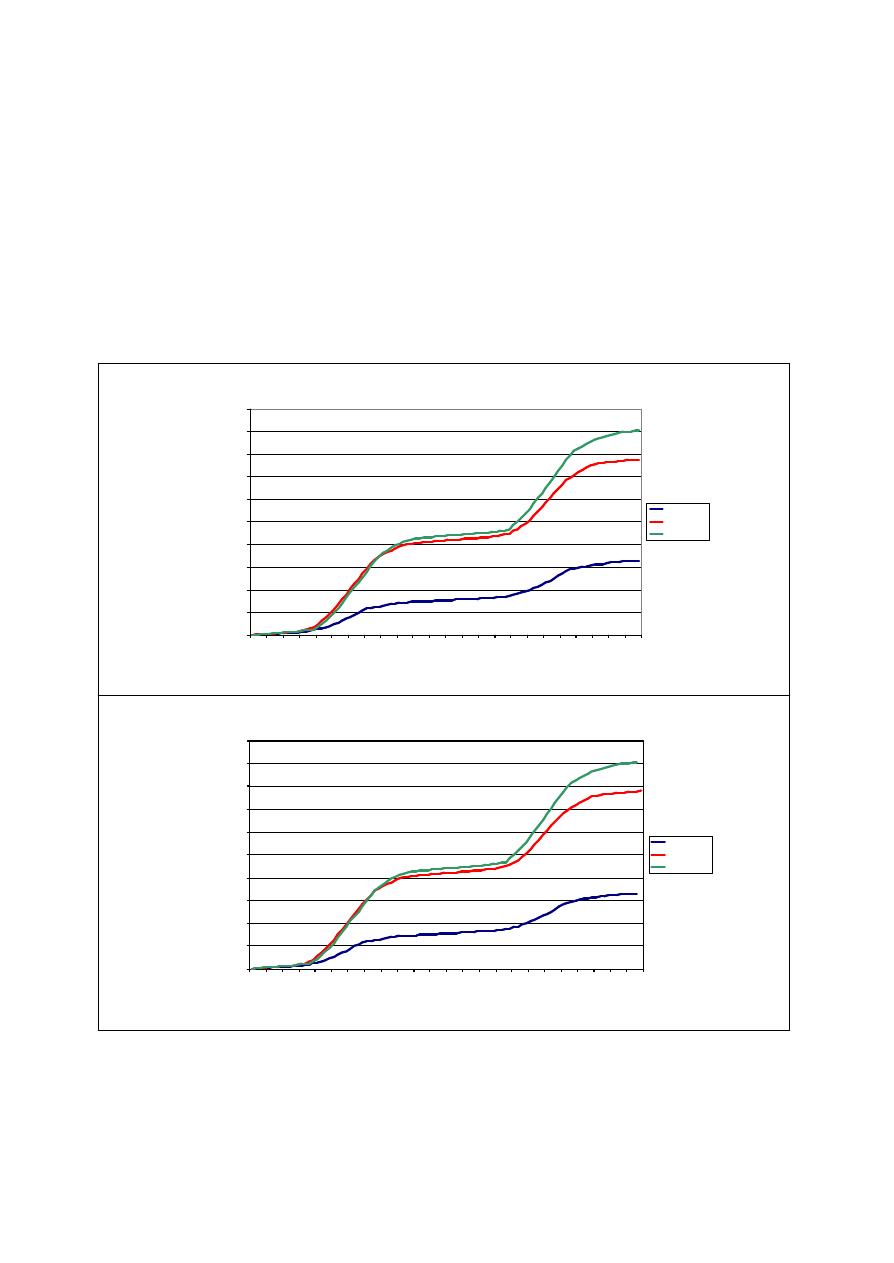
On the Figure 8 there are basic, energy consumption graphs, adequately for A2000 and DZ
4000 KE meters.
a)
A2000 (LON) - active_energy - Tuesday, Wednesday
0
10000
20000
30000
40000
50000
60000
70000
80000
90000
100000
CZAS
1:30
3:30
5:30
7:30
9:30
11:30
13:30
15:30
17:30
19:30
21:30
23:30
1:30
3:30
5:30
7:30
9:30
11:30
13:30
15:30
17:30
19:30
21:30
HOURS
ACTIVE ENERGY [Wh]
August
September
October
b)
Licznik ABB (KNX) - active_energy - Tuesday, Wednesday
0
10000
20000
30000
40000
50000
60000
70000
80000
90000
100000
CZAS
1:30
3:30
5:30
7:30
9:30
11:30
13:30
15:30
17:30
19:30
21:30
23:30
1:30
3:30
5:30
7:30
9:30
11:30
13:30
15:30
17:30
19:30
21:30
HOURS
ACTIVE ENERGY [Wh]
August
September
October
Figure 8 – The energy consumption graphs
More usable to asses power quality in supply network are graphs created basis of data from
multifunctional power meter A2000 (LonWorks standard). For example there are current level
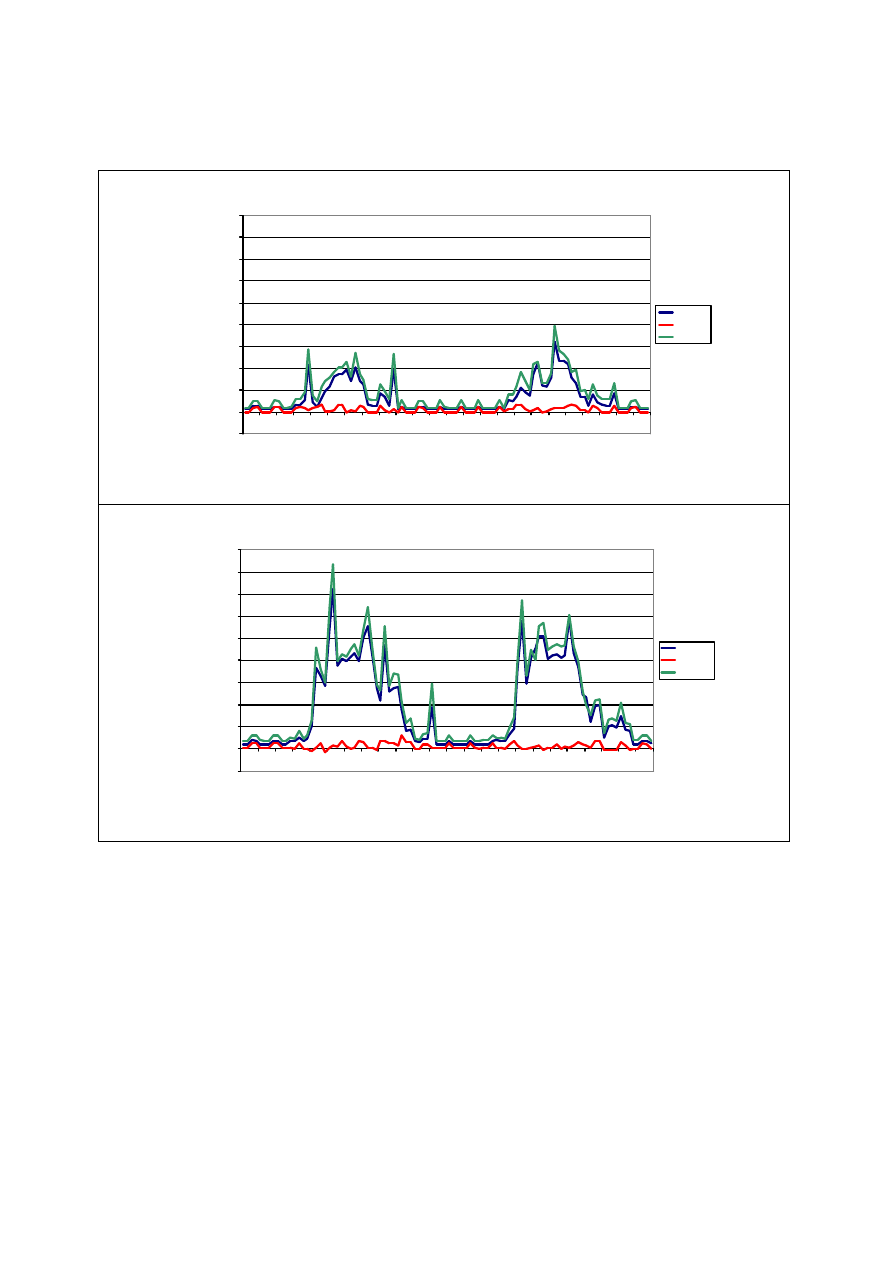
of instantaneous power (active, reactive and apparent) graphs on the Figure 9 and voltage
RMS changes for individual phases graphs on the Figure 10.
a)
A2000 (LON) - instataneous powers - Tuesday, Wednesday - August
-1000
0
1000
2000
3000
4000
5000
6000
7000
8000
9000
DATA
23-08-05 1:30
23-08-05 3:30
23-08-05 5:30
23-08-05 7:30
23-08-05 9:30
23-08-05 11:30
23-08-05 13:30
23-08-05 15:30
23-08-05 17:30
23-08-05 19:30
23-08-05 21:30
23-08-05 23:30
24-08-05 1:30
24-08-05 3:30
24-08-05 5:30
24-08-05 7:30
24-08-05 9:30
24-08-05 11:30
24-08-05 13:30
24-08-05 15:30
24-08-05 17:30
24-08-05 19:30
24-08-05 21:30
DATA/TIME
POWER [W,Var,VA]
active
reactive
apparent
b)
A2000 (LON) - instataneous powers - Tuesday, Wednesday - October
-1000
0
1000
2000
3000
4000
5000
6000
7000
8000
9000
DATA
06-10-05 1:30
06-10-05 3:30
06-10-05 5:30
06-10-05 7:30
06-10-05 9:30
06-10-05 11:30
06-10-05 13:30
06-10-05 15:30
06-10-05 17:30
06-10-05 19:30
06-10-05 21:30
06-10-05 23:30
07-10-05 1:30
07-10-05 3:30
07-10-05 5:30
07-10-05 7:30
07-10-05 9:30
07-10-05 11:30
07-10-05 13:30
07-10-05 15:30
07-10-05 17:30
07-10-05 19:30
07-10-05 21:30
DATA/TIME
POWER [W,Var,VA]
active
reactive
apparent
Figure 9 – The current level of instantaneous power (active, reactive, apparent) graphs
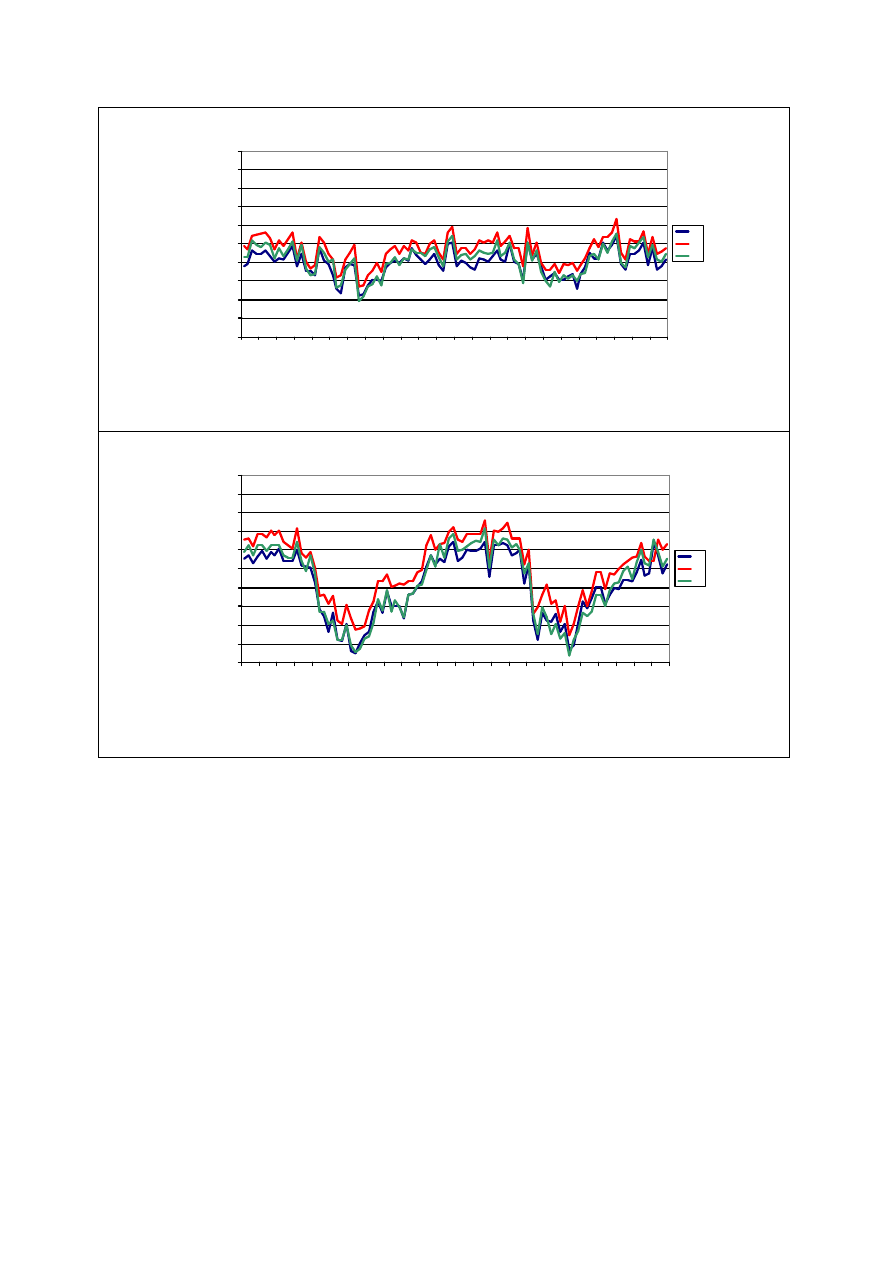
a)
A2000 (LON) - PHASE VOLTAGE (RMS) - Tuesday, Wednesday - August
220
222
224
226
228
230
232
234
236
238
240
DATA
23-08-05 1:30
23-08-05 3:30
23-08-05 5:30
23-08-05 7:30
23-08-05 9:30
23-08-05 11:30
23-08-05 13:30
23-08-05 15:30
23-08-05 17:30
23-08-05 19:30
23-08-05 21:30
23-08-05 23:30
24-08-05 1:30
24-08-05 3:30
24-08-05 5:30
24-08-05 7:30
24-08-05 9:30
24-08-05 11:30
24-08-05 13:30
24-08-05 15:30
24-08-05 17:30
24-08-05 19:30
24-08-05 21:30
DATA/TIME
VOLTAGE [V]
L1
L2
L3
b)
A2000 (LON) - PHASE VOLTAGE (RMS) - Tuesday, Wednesday - October
220
222
224
226
228
230
232
234
236
238
240
DATA
06-10-05 1:30
06-10-05 3:30
06-10-05 5:30
06-10-05 7:30
06-10-05 9:30
06-10-05 11:30
06-10-05 13:30
06-10-05 15:30
06-10-05 17:30
06-10-05 19:30
06-10-05 21:30
06-10-05 23:30
07-10-05 1:30
07-10-05 3:30
07-10-05 5:30
07-10-05 7:30
07-10-05 9:30
07-10-05 11:30
07-10-05 13:30
07-10-05 15:30
07-10-05 17:30
07-10-05 19:30
07-10-05 21:30
DATA/TIME
VOLTAGE [V]
L1
L2
L3
Figure 10 – The voltage RMS changes for individual phases graphs
After analysis of these graphs it is possible to say that intelligent building systems can be used
for monitoring and asses of basic power supply network parameters and power quality (in the
limited range of course). From graphs on Figure 10 it could be read what is the range of
voltage RMS value changes, how it depends on selected period and number of connected to
the supply network loads. This information in some justified cases could be base for claims
with energy provider, concerned preservation proper power quality in supply network. Thanks
to that monitoring it is possible to actually asses current supply line loading by information
about instantaneous power and energy consumption (even for individual phases). The
telegrams with energy consumption information can be used in accounting with energy
provider, as well. Since data are available in digital form, it is also possible to record and
storage them and then it could be used to prepare specialist analysis, reports or to determine
trends in parameters and factors behaviour.
5. Summary
The power industry is one of essential, if not the most essential trade of the national and world
economy. Particular issue is ensuring of continuous providing of energy for all consumers,

especially from industry and public sectors. Therefore more and more significant is possibility
to realize monitoring and measurements energy consumption, power and selected power
quality factors in real time. Information and graphs collected in this paper show current
capabilities of the intelligent building systems’ devices in this field. Both compared standards
have large potential but basis on tests, research works and current market offers analysis, not
only in Poland, it is possible to say that at the moment the victory’s palm is held by
LonWorks standard (though it is not satisfactory state yet). Manufacturers and vendors of
devices equipped with LonWorks interface offer larger number of available parameters (as
network variables SNVT), features and functions. It is important and needed to make an
appeal to other manufacturers and research and development centres, particularly used KNX
standard: please, respond to current market demands and design new devices, maters with
abilities to measure broader range of power supply networks’ parameters and to make them
available as KNX telegrams.
This kind of intelligent building systems applications have chance to significant development
in the future, particularly in prospect of more often connections with local networks in
buildings, with Ethernet networks in plants and with the global network Internet. Thanks to
these connections measured energy consumption, power quality factors and parameters could
be analysed in remote places, located practically all over the world.
Bibliography:
1. Echelon Corporation: Introduction to the LonWorks System. Information materials –
support & documentation, September 2003. WWW: www.echelon.com
2. EIBA/Konnex Association: Tutor Seminar. EIB system – technical information, April
2004. CD-ROM Konnex Association Scientific Partnership Forum 2004 Edition
3. Ozadowicz A.: Communication Reliability in the Intelligent Building Systems, KNX
Scientific Conference 2005, Pisa, Italy, 2005.
4. Ozadowicz A.: Energy Saving and Electrical Power Quality Control in Intelligent
Building Systems, KNX Scientific Conference 2004, Deggendorf, Germany, 2004.
5. Ozadowicz A.: The Comparison Analysis of Two Intelligent Building Systems – European
EIB/KNX and American Standard Based on LonWorks Technology, doctoral dissertation
at AGH-UST in Krakow 2006 (Available only in Polish)
Wyszukiwarka
Podobne podstrony:
Comparativa LonWorks vs KNX (inglés)
comparative superlative
W15 i 16A projektowanie deskowań 24042007
W15 i 16A projektowanie deskowań
KNX IPRS lowres
God and Mankind Comparative Religions
12 Werntges controling KNX from Linux and USB
Engine Compartment 4 7
ComparisonofVBandC#
Cw7 LonWorks Motor
Comparaisons
Comparatives and Superlatives LESSON
gram comparison
comparison of PRINCE2 against PMBOK
Comparative Study of Blood Lead Levels in Uruguayan
09 COMPARE GROUPS answers
Foliogram nr 16a
więcej podobnych podstron