
This ENERGIE publication is one of a series highlighting the potential for innovative non-nuclear energy
technologies to become widely applied and contribute superior services to the citizen. European Commissi-
on strategies aim at influencing the scientific and engineering communities, policy makers and key market
actors to create, encourage, acquire and apply cleaner, more efficient and more sustainable energy solutions
for their own benefit and that of our wider society.
Funded under the European Union’s Fifth Framework Programme for Research, technological Development
and Demonstration (RTD), ENERGIE’s range of supports cover research, development, demonstration,
dissemination, replication and market uptake - the full process of converting new ideas into practical solutions
to real needs. Its publications, in print and electronic form, disseminate the results of actions carried out under
this and previous Framework Programmes, including former JOULE-THERMIE actions. Jointly managed by
Directorate-General Energy and Transport & Directorate-General Research, ENERGIE has a total budget of
1042 million
W
over the period 1999 to 2002.
Delivery is organised principally around two Key Actions, Cleaner Energy Systems, including Renewable
Energies, and Economic and Efficient Energy for a Competitive Europe, within the theme ”Energy, Environ-
ment and Sustainable Development”, supplemented by coordination and cooperative activities of a sectoral
and cross-sectoral nature. With targets guided by the Kyoto Protocol and associated policies, ENERGIE’s
integrated activities are focussed on new solutions which yield direct economic and environmental benefits to
the energy user, and strengthen European competitive advantage by helping to achieve a position of leaders-
hip in the energy technologies of tomorrow. The resulting balanced improvements in energy, environmental
and economic performance will help to ensure a sustainable future for Europe’s citizens.
ENERGIE
with the support of the EUROPEAN COMMISSION
Directorate-General for Energy and Transport
LEGAL NOTICE
Neither the European Commission, nor any person acting on behalf of the Commission,
is responsible for the use which might be made of the information contained in this publication.
© European Communities, 2001
Reproduction is authorised provided the source is acknowledged.
Printed in Germany
Produced by
Deutsches Windenergie-Institut GmbH
Fritz Santjer, Gerhard J. Gerdes · Ebertstraße 96 · D-26382 Wilhelmshaven
Tel.: +49 4421 48080 · Fax: +49 4421 480843
Tech-wise A/S
Peter Christiansen · Kraftværksvej 53 · DK 7000 Fredericia · Denmark
DM Energy
David Milborrow · 23 The Gallops · UK BN7 1LR Lewes · East Sussex · United Kingdom

Wind Turbine Grid Connection
and Interaction
Deutsches Windenergie-Institut GmbH Germany · Tech-wise A/S Denmark · DM Energy United Kingdom

1
Introduction ......................................
5
2
Overview of Wind Power
Generation and Transmission ........
5
2.1
Components of the System .....................
5
2.2
Supply Network ....................................
6
2.3
Offshore grid connection .......................
6
2.4
Losses ..................................................
9
3
Generator Systems for
Wind Turbines ..................................
9
3.1
Fixed Speed wind turbines .....................
10
3.2
Variable Speed Wind Turbines ...............
10
3.3
Inverter systems .....................................
10
4
Interaction with the Local
Electricity Network ..........................
11
4.1
Short circuit power level ........................
12
4.2
Voltage variations and flicker .................
12
4.3
Harmonics ...........................................
13
4.4
Frequency ............................................
14
4.5
Reactive power .....................................
14
4.6
Protection ...........................................
15
4.7
Network stability .................................
16
4.8
Switching operations and
soft starting .........................................
16
4.9
Costs of Grid Connection ......................
17
4.10 Safety, Standards and Regulations .........
18
4.11 Calculation methods .............................
19
5
Integration into the
National Grid ..................................
22
5.1
Emission Savings ..................................
22
5.2
Energy Credit ......................................
22
5.3
Capacity Credit ...................................
23
6
Case Studies ...................................
24
6.1
Tunø Knob Wind farm, DK ....................
24
6.2
Rejsby Hede Wind Farm, DK ................
24
6.3
Delabole wind farm, UK .......................
26
6.4
Cold Northcott Wind Farm, UK .............
27
6.5
Wybelsumer Polder, D ..........................
27
6.6
Belvedere, D ........................................
28
7
Glossary ..........................................
29
8
References ......................................
29
Contents
W
ind
Tu
rbine
Grid
Connection
&
Interaction
5
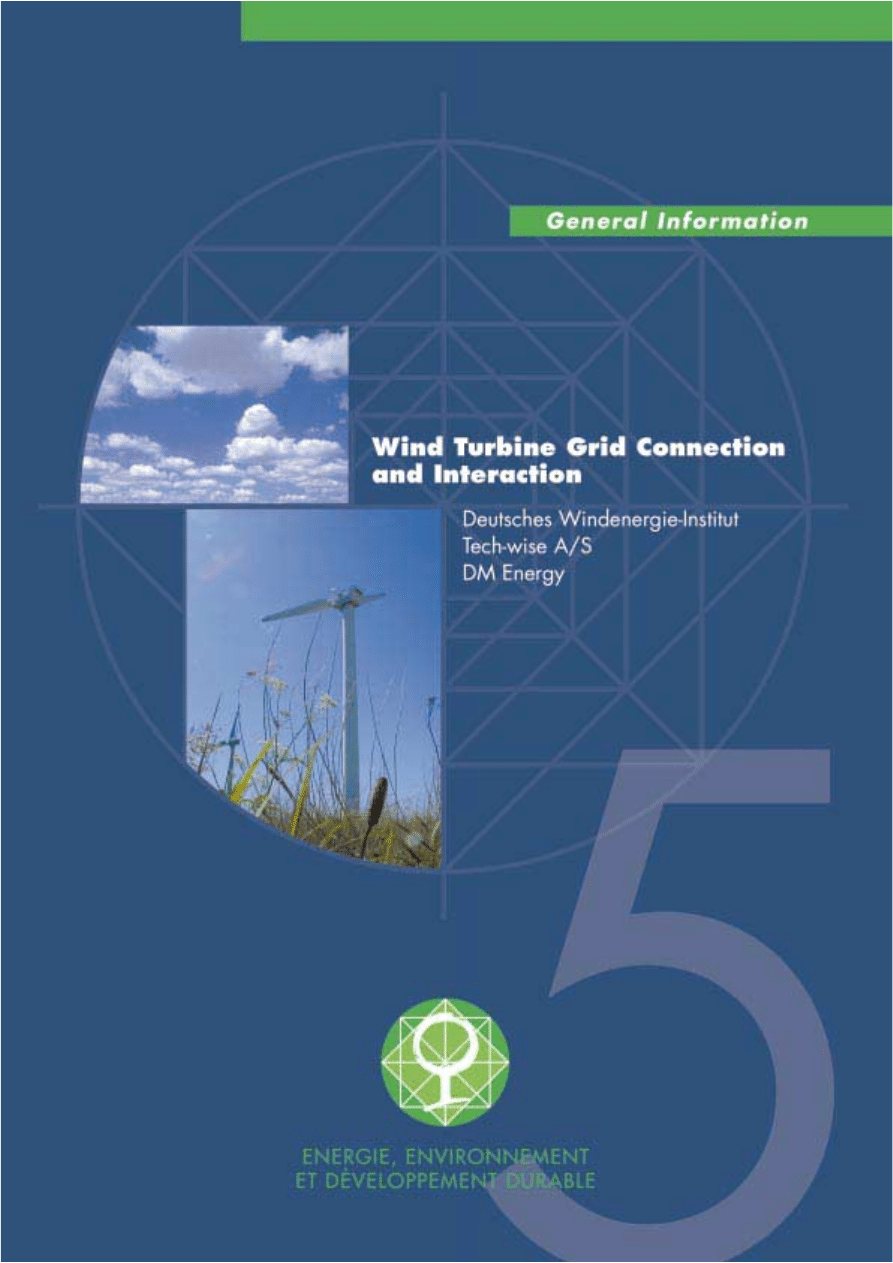
1 Introduction
Wind energy is now firmly established as a mature
technology for electricity generation and over
13,900 MW of capacity is now installed, world-
wide. It is one of the fastest growing electricity-
generating technologies and features in energy
plans across all five continents, both in the
industrialised and the developing world.
It differs, however, in several respects from the
„conventional“ thermal sources of electricity
generation. Key differences are the small sizes of
individual units, the variable nature of the wind and
the type of electrical generator. Each is considered
in this brochure.
Small unit sizes: The small unit sizes mean that both
wind farms and individual wind turbines (WT) are
usually connected into low voltage distribution
networks rather than the high voltage transmission
systems and this means that a number of issues
related to power flows and protection systems need
to be addressed. Electrical safety is an important
issue under this heading.
Variability: The variable nature of wind is often
perceived as a difficulty, but in fact poses few
problems. The variations in output do not cause any
difficulty in operating electricity systems, as they
are not usually detectable above the normal variati-
ons in supply and demand. With significant amounts
of wind power – roughly 30 % or more of demand -
low cost solutions can be found and some island sys-
tems operate with high proportions of wind energy.
Variability also needs to be taken into account at the
local level, to ensure consumers are not affected by
„flicker“. Appropriate care in electrical design,
however, can eliminate this problem.
Electrical properties: Early WT followed steam
turbine practice with synchronous generators, but
many modern WT have induction generators. These
draw reactive power from the electricity network,
necessitating careful thought to electrical power
flows. Other machines, however, are capable of
conditioning the electrical output and providing a
controllable power factor. This is an asset, especi-
ally in rural areas, where it may be undesirable to
draw reactive power from the network.
Advances in wind-turbine technology and the
results of nearly two decades of research mean that
the integration of WT and wind farms into elec-
tricity networks generally poses few problems. The
characteristics of the network and of the turbines do
nevertheless need to be evaluated but there is now a
wealth of experience upon which to draw. The fact
that Denmark is planning to supply 30 percent of its
electricity needs from wind energy is testimony to
the fact that its potential is considerable.
2 Overview of Wind
Power Generation and
Transmission
WT convert wind energy into electrical energy,
which is fed into electricity supply systems. The
connection of WT to the supply systems is possible
to the low voltage, medium voltage, high voltage as
well as to the extra high voltage system. While most
of the turbines are nowadays connected to the
medium voltage system of the grid future large
offshore wind farms will be connected to the high
and extra high voltage level.
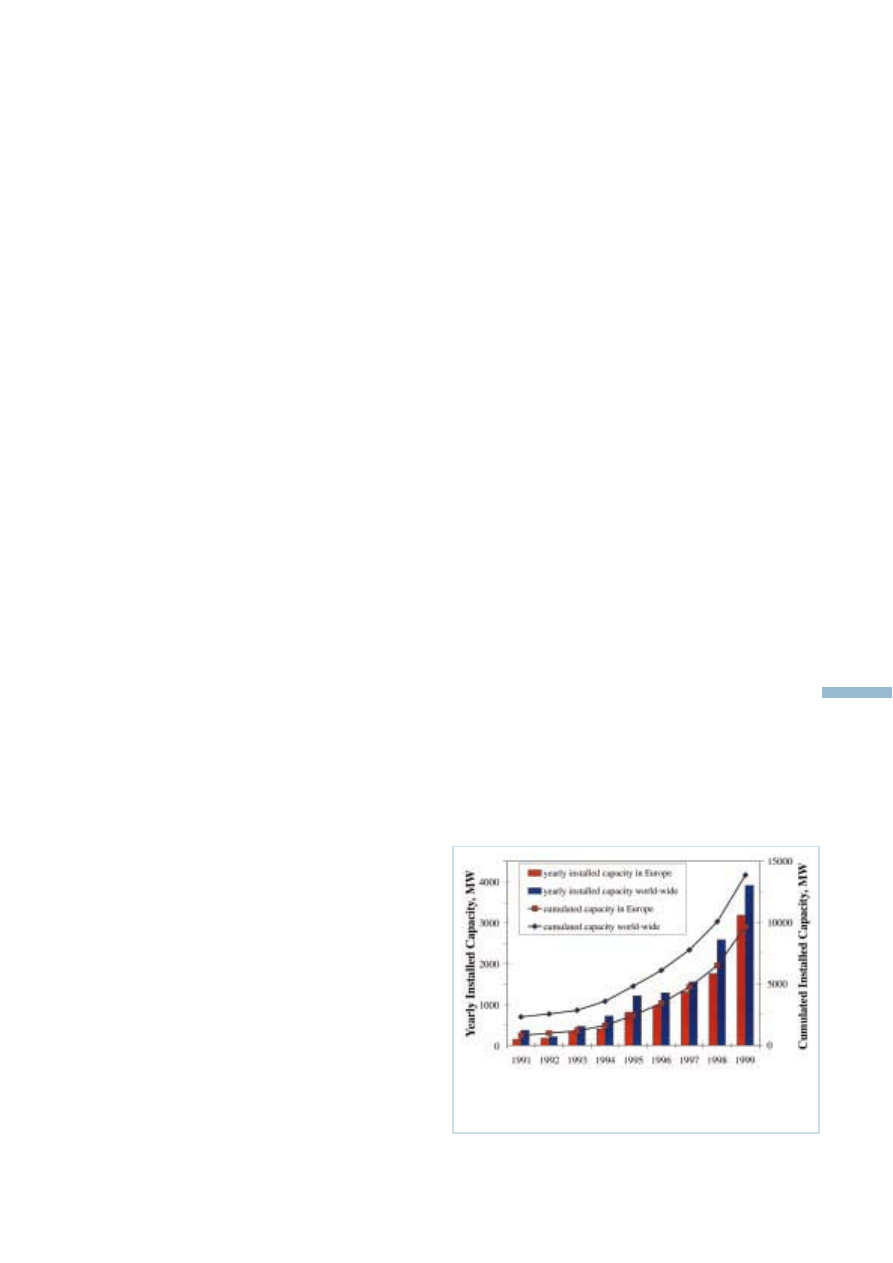
2.1 Components of the System
The three main components for energy conversion in
WT are rotor, gear box and generator. The rotor
converts the fluctuating wind energy into mechani-
cal energy and is thus the driving component in the
conversion system.
The generator and possibly an electronic inverter
absorb the mechanical power while converting it
into electrical energy, fed into a supply grid. The
gear box adapts rotor to generator speed. The gear
box is not necessary for multipole, slow running
generators.
The main components for the grid connection of the
WT are the transformer and the substation with the
circuit breaker and the electricity meter inside it.
Because of the high losses in low voltage lines, each
Figure 1.1: Yearly installed capacity of wind energy in
Europe and wold-wide
of the turbines has its own transformer from the
voltage level of the WT (400 or 690 V) to the
medium voltage line. The transformer are located
directly beside the WT to avoid long low-voltage
cables. Only for small WTGS it is possible to
connect them directly to the low voltage line of the
grid without a transformer or, in a wind farm of
small WT, to connect some of the small WT to one
transformer. For large wind farms a separate sub-
station for transformation from the medium voltage
system to the high voltage system is necessary.
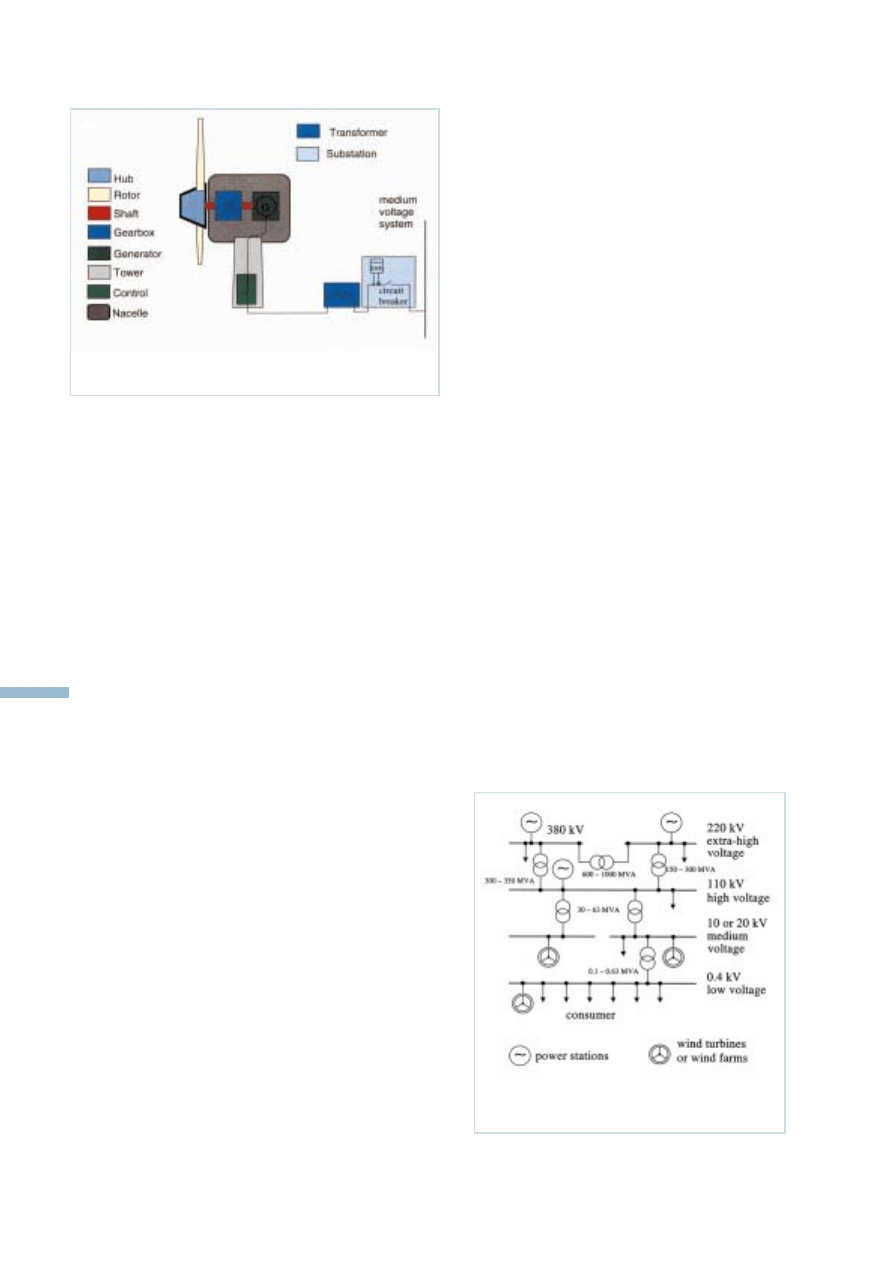
At the point of common coupling (PCC) between
the single WT or the wind farm and the grid a circuit
breaker for the disconnection of the whole wind
farm or of the WT must exist. In general this circuit
breaker is located at the medium voltage system
inside a substation, where also the electricity meter
for the settlement purposes is installed. This usually
has its own voltage and current transformers.
The medium voltage connection to the grid can be
performed as a radial feeder or as a ring feeder,
depending on the individual conditions of the
existing supply system. Fig. 2.1 gives an overview
of the necessary components in case of connection
of the WTGS to the medium voltage system.
2.2 Supply Network
The power supply system is divided into:
• LV: low voltage system
(nominal voltage up to 1kV)
• MV: medium voltage system
(nominal voltage above 1kV up to 35kV)
• HV: high voltage system
(nominal voltage above 35kV)
Small consumers like households are connected to
the low voltage system. Larger consumers like
workshops and medium size industries are connec-
ted to the medium voltage system, while larger or
heavy industries may be connected to the high
voltage system. Conventional power stations are
connected to the high voltage or extra-high voltage
system.
The power transmission capacity of the electricity
supply system usually decreases with falling
population density. Areas for WT are generally
located in regions with low population density and
with low power transmission capacity.
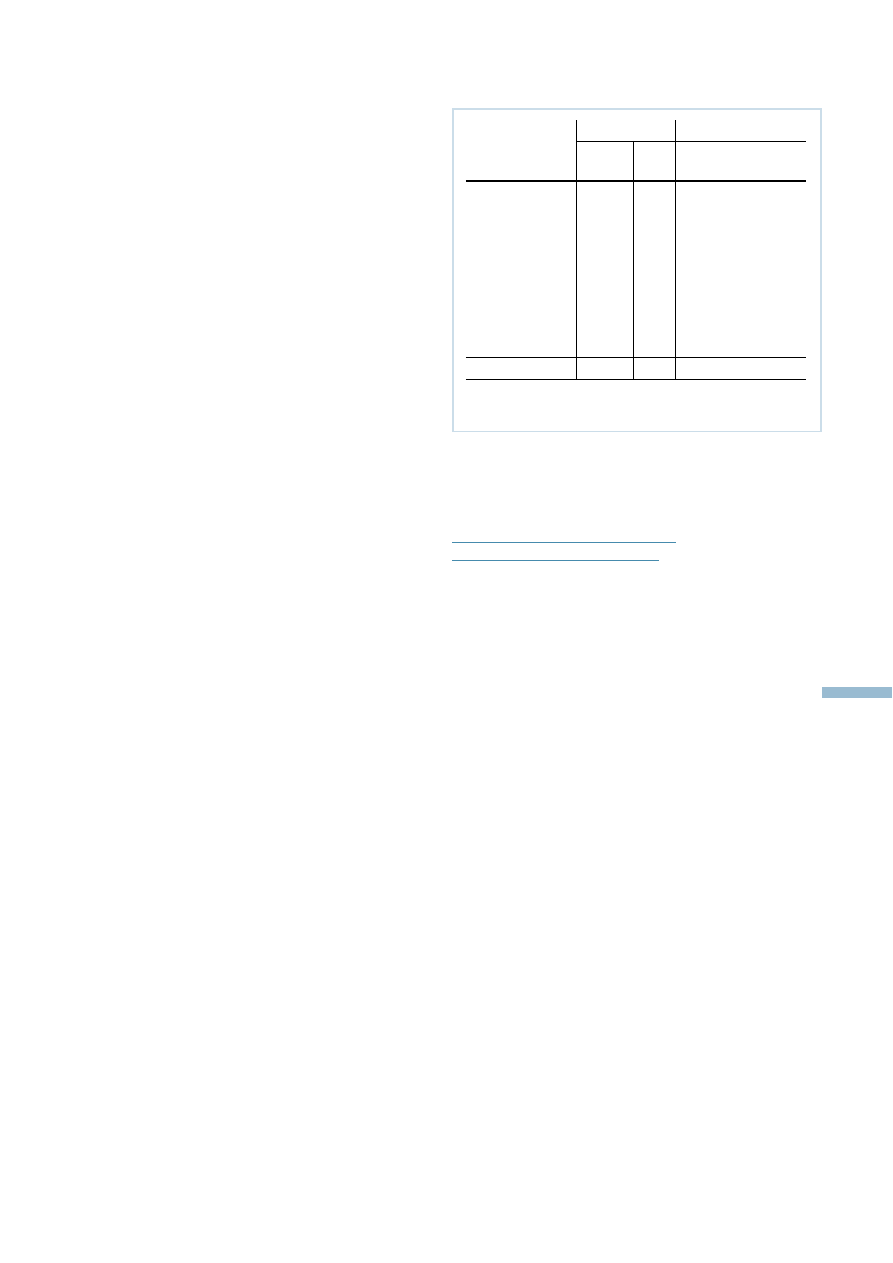
The transmittable power for connection to different
levels of the electrical network are listed in table 2.1.
2.3 Offshore grid connection
Offshore wind power holds the promise of very
large - in Denmark figures of up to 1800 MW are
mentioned - geographically concentrated wind
power installations placed at great distances from
the nearest point where it can be connected to the
electric transmission system. For large onshore
wind farms, i.e. 100-200 MW, high voltage
overhead lines above 100kV are normally used in
this situation. For offshore wind farms however this
option is not available as a large part of the distance
to the connection point necessarily must be covered
by a submarine cable. The distances can be
considerable, depending on local conditions, water
depth and bottom conditions in particular. Too deep
water increases the cost for foundations and too
shallow water makes construction difficult due to
limited access for barges, floating cranes and jack-
W
ind
Turbine
Grid
Connection
&
Interaction
6
Figure 2.1: Components of the WT and for the grid
connection of a WT
Figure 2.2: Power supply system in Germany

up platforms for ramming or drilling foundation
poles. In Danish coastal waters, where shallow
areas are abundant, the wind farms will be placed
far from the shore in order to minimise visual
impact. Probable distances from the shore ranges
from 5 -10 km to 50 km or more.
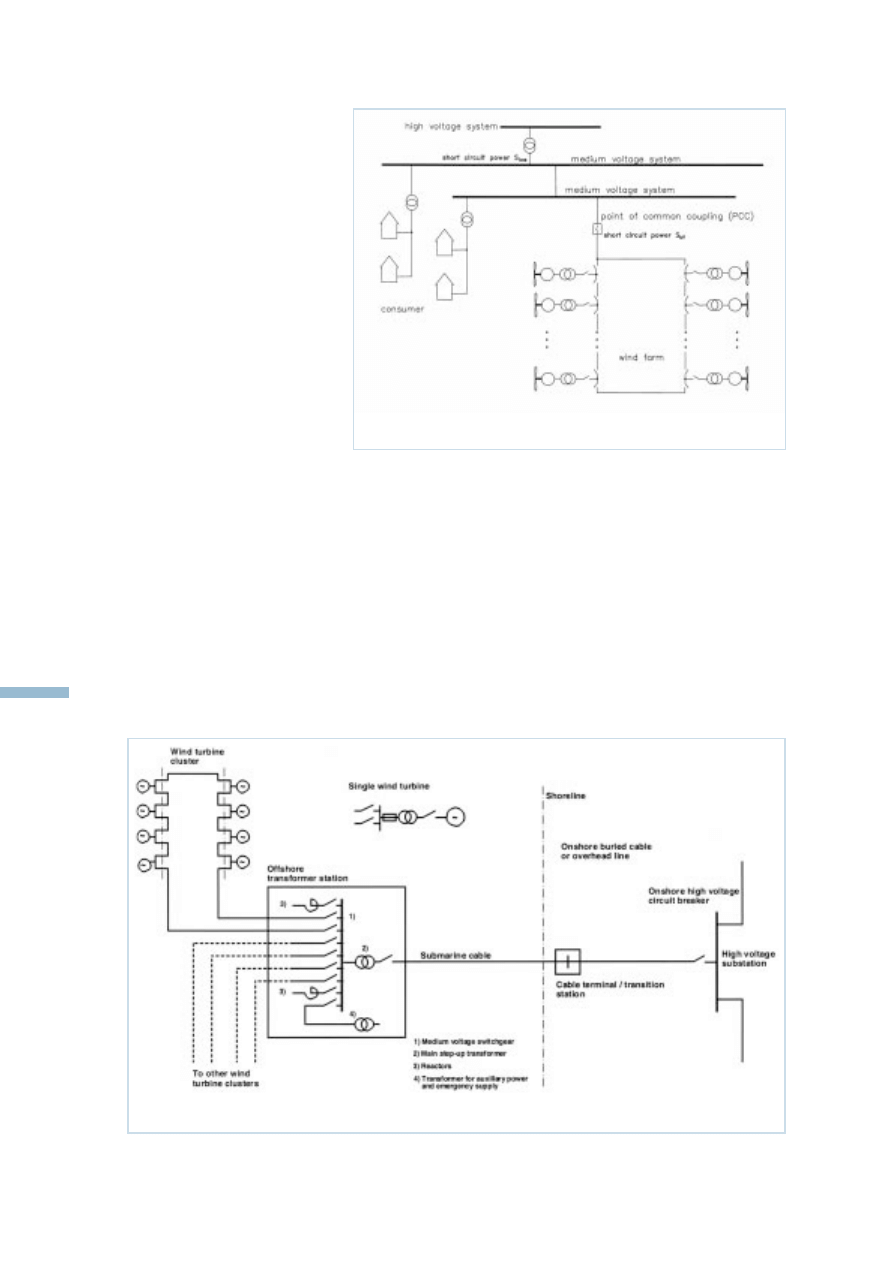
The principal lay-out of a grid connection scheme
for an offshore wind farm follows very much the
same lines as for a large onshore installation as the
basic functional requirements are the same - to
transmit the energy produced to a point where the
electric transmission grid is strong enough to absorb
it. A typical layout for such a scheme is shown in
Figure 2.4. As shown, clusters of WT are each
connected to a medium voltage ring. This principle
deviates from normal onshore practice where the
WT are connected to a number of radial cables from
the medium voltage switch gear in the transformer
station. The reason for this is the vulnerability of the
submarine cables to anchors and fishing activities. It
must be anticipated that sections of the ring may be
out of service for repair or exchange for long
periods if weather conditions makes repair work
impossible. With a ring connection, production can
continue upheld in the repair periods thus - at a
small extra cost - reducing the economic
consequences of a cable fault. The choice of voltage
level within the wind farm is purely a matter of
economy. Each WT is equipped with a transformer
stepping up from the generator voltage - typically
low voltage, i.e. below 1 kV - to a medium voltage
below 36 kV. Transformers going directly from low
voltage to voltages higher than 36 kV are not
standard products and hence far more expensive, if
technically feasible at all. The choice between 20-
24 and 30-34 kV is determined by an evaluation
minimum lifetime cost; that is the net present value
of losses in the two alternatives is weighed against
equipment cost.
The transformer station is an offshore structure,
from a civil engineering viewpoint much like other
structures used in the oil and gas industry, although
at lower water depths. A design found feasible is a
one pole foundation with a top section containing
the equipment. The construction procedure envisa-
ges the foundation being established first on the site,
while the top-section is finished onshore. This is
completely equipped and tested and then is
transported to the site and placed by a floating crane
on the foundation, and the external cables connec-
ted. The main function of the transformer station is
to increase the voltage to a level suitable for
transmitting the energy produced to the connection
point. Depending on the size of the installation this
could be anything from the medium voltage level in
the farm - in this case the transformer is not needed
- to the highest transmission voltages used in the
connecting transmission grid, i.e. up to 400 kV. A
transformer of this size will be oil-cooled/insulated,
possibly with two secondary windings, each with
half the nominal rating of the transformer, in order
to keep the short circuit power level at medium
voltage down to a manageable level, seen from
the side of selection of medium voltage equipment.
The medium voltage switch gear could be air or gas
insulated but reliability and size considerations will
probably favour the gas insulated alternative. The
high voltage breaker shown in the transformer
station could under certain conditions be omitted.
Certain types of faults, such as over voltages due to
excessive reactive power production, are difficult to
detect onshore. If fast redundant channels permitting
opening of the on-shore circuit breaker on a signal
from the platform are available the offshore circuit
breaker is superfluous and can be replaced by a
isolator. Equipment not normally associated with
transformer stations is necessary - in particular an
emergency supply.
W
ind
Tu
rbine
Grid
Connection
&
Interaction
7
Table 2.1: Transmittable power and connection of wind turbines to different levels of the electrical network
Voltage system
Size of wind turbine or wind farm
Transmittable power
Low voltage system
For small to medium wind turbines
up to
≈ 300 kW
Feeder of the medium
For medium to large wind turbines
up to
≈ 2–5 MW
voltage system
and small wind farms
Medium voltage system, at trans-
For medium to large onshore
up to
≈ 10–40 MW
former substation to high voltage
windfarms
High voltage system
Clusters of large onshore windfarms
up to
≈ 100 MW
Extra high voltage system
Large offshore wind farms
> 0.5 GW
The submarine cable to the shore
is subject to a number of threats
from anchoring and fishing as
already mentioned. Depending on
weather, which can be severe for
long periods during the winter
season, repair can be difficult if
not impossible until weather con-
ditions improve. In such periods
the voltage to the WT and the
transformer station itself must be
upheld for service, maintenance
and possibly operation of internal
climate conditioning equipment.
An emergency diesel generator is
needed for this purpose with
necessary fuel supply to operate
for an extended period. The size in
kW of the generator is probably
fairly small but as the reactive
power production in the cables in the wind farm is
considerable (compared to the active emergency
power needed) measures such as the installation of
reactors and possibly an oversize generator on the
diesel set are necessary to be able to control the
voltage in the wind farm in this situation. As will be
discussed later the amount of reactive power the
submarine cable to the shore produces is very high
- and depending on the voltage squared - reactors
will be needed to compensate this as well.
The transmission line from the transformer station
to the grid connection point is a project in itself. It
can be split up in two parts, a submarine cable and
a section onshore which can be a cable buried in the
ground or an overhead line.
Submarine cables are in principle ordinary under-
ground cables but equipped with a lead sheath and
steel amour to make it watertight and to protect it
from mechanical damage. The extra weight also
helps to keep it in place in water where there are
strong currents. If possible at all, burial by washing
down or digging is recommended to protect the cable.
For the submarine section four different types of
cables are available and for an AC transmission
three parallel conductors are needed. The types are single
or three conductor oil-insulated cables and single or
W
ind
Turbine
Grid
Connection
&
Interaction
8
Figure 2.3: Internal and external grid connection of a wind farm
Figure 2.4: AC offshore grid connection
W
ind
Tu
rbine
Grid
Connection
&
Interaction
9
three conductor PEX-insulated cable. If cables with
a single conductor are used the transmission system
will comprise three parallel cables. In this case the
distance between the individual cables must be
great enough to allow for a repair loop as the cables
must not cross. They cannot be laid down in one
operation and as laying out and subsequent burial of
the cables are major cost items, single conductor
cables are only used where transmission capacity
requirements dictate the use of very large conductor
cross sections or high voltages. In general transmis-
sion capacities of up to around 200 MVA are
possible with three conductor oil-insulated cables at
150kV and a cable with this capacity would have
cross section of 800 mm
2
. Three conductor sub-
marine PEX-insulated cables are available for up
to 170 kV and with corresponding transmission
capacities.
A cable is a capacitor with a much higher capacity
than an overhead line. The reactive power produc-
tion in a cable is considerable and a 40 km long
cable at 150 kV would produce around 100 Mvar,
that is more or less the reactive power used by a
150 MW wind farm with induction generators, -
depending on the type of cable. The high voltage
grid will probably not be able to absorb this amount
in all operating conditions and since the demand of
the WT is zero when they are disconnected from the
grid in periods with low wind speeds reactors will
have to be installed to compensate for this reactive
power production.
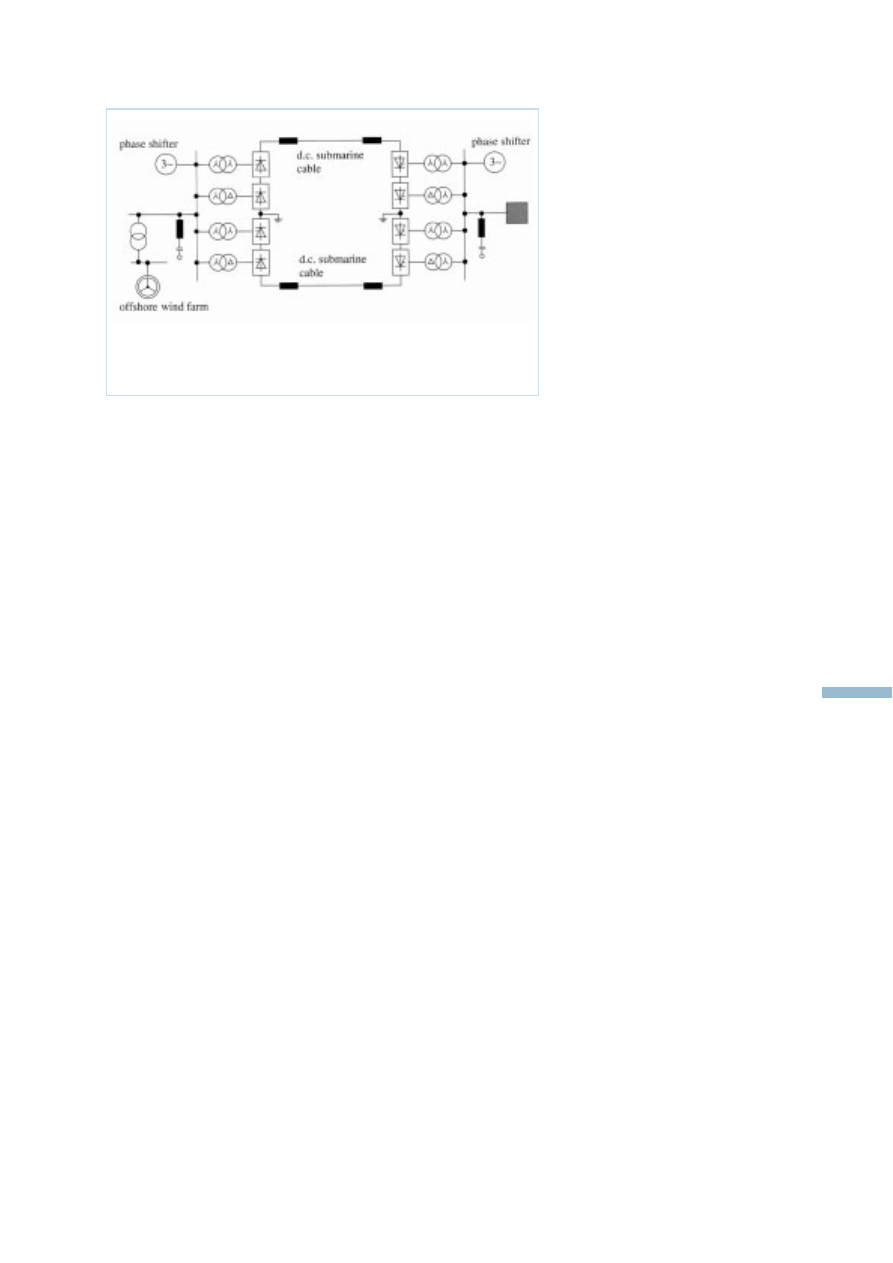
For very long cables, the loading current from the
reactive power production may take a considerable
part of its transmission capacity and in this situation
high voltage direct current (HVDC) transmission
techniques may be economically feasible. Two
different converter technologies are used. The
traditional thyristor based technology used for some
decades, and a new transistor
based one. The traditional techno-
logy requires an AC voltage at
both ends of the DC line and
would thus - for an offshore wind
farm application - require an extra
AC cable parallel to the DC line.
It furthermore produces large
amounts of harmonics and needs
large filters to remove the har-
monics. The new technology -
which is on the brink of commer-
cial breakthrough - overcomes
these two difficulties and will
furthermore open new possibili-
ties for obtaining dynamic stability
for the wind farm as it will be
possible to uphold voltage in the wind farm during
the time needed to clear faults and fast reclosures in
the onshore transmission system.
2.4 Losses
The electrical losses can be divided into losses due
to the generation of power and into losses, which
occur independently of the power production of
WT. These are losses like the no-load losses of the
transformer, but also losses for lights and for
heating (needed for protection against frost
damages at the substation). The losses due to the
generation of power of the WT are mainly losses in
the cables and copper losses of the transformer.
In general one of the main losses is the no-load loss
of the transformer. Thus it is important, that the no-
load loss of the installed transformer is low.
Additionally the low-voltage cable between the WT
and the transformer should be short to avoid high
losses. In general, at the medium voltage lines the
losses are low due to the low currents. Only for
large wind farms or for long distances are the losses
of the medium voltage lines important. In general
the electrical losses are in the range 1%–2%of the
energy yield of the WT or of the wind farm.
3 Generator systems for
Wind Turbines
The energy conversion of most modern WT can be
divided into two main concepts, fixed speed
machines with one or two speeds and variable speed
machines. If the number of machines designs in a
given category can be taken as a guide, the prefer-
red concepts are the variable speed and the two
speed machines, see figure 3.1.
Figure 2.5: Principle sheme of the high-voltage D.C. transmission
(HVDCT) with thyristor technique
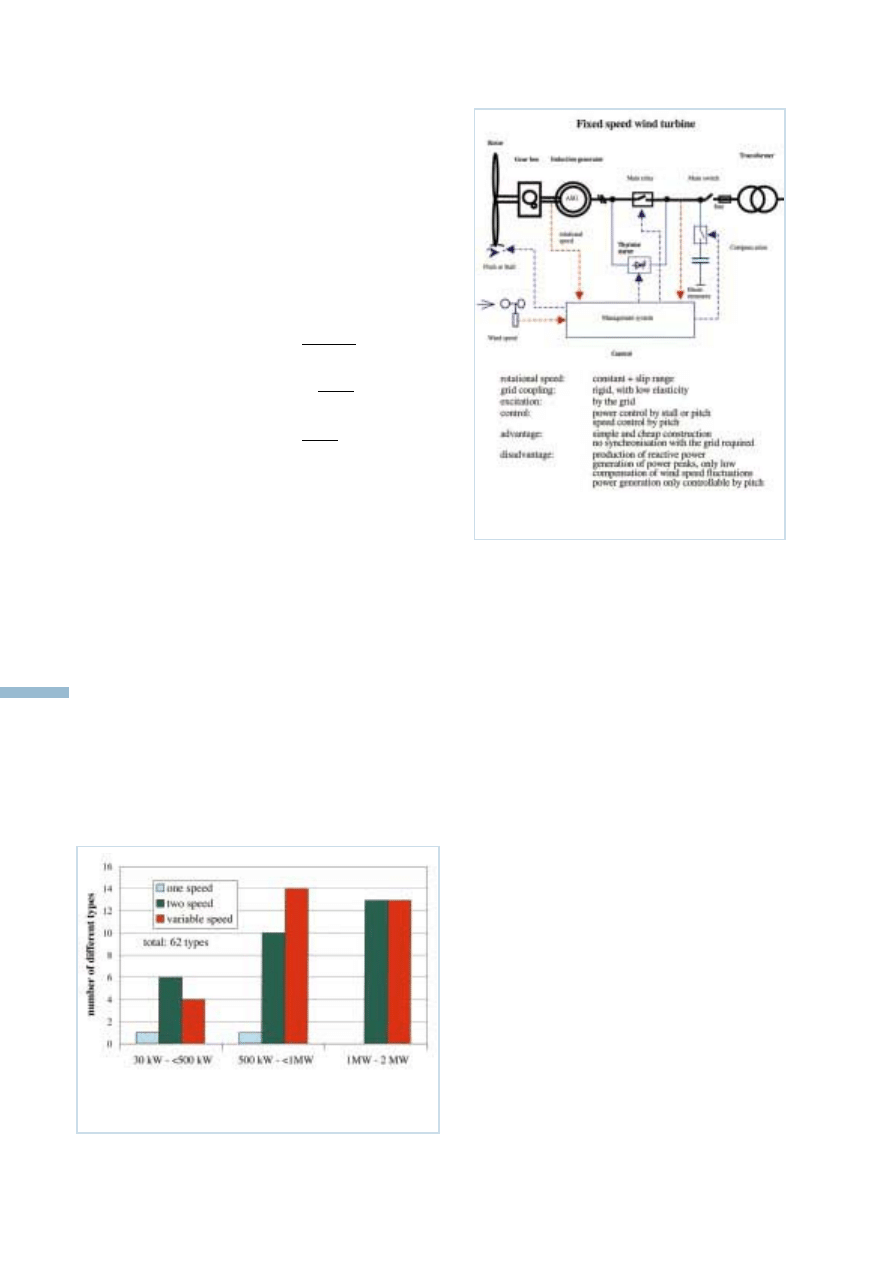
3.1 Fixed Speed wind turbines
In fixed speed machines the generator is directly
connected to the mains supply grid. The frequency
of the grid determines the rotational speed of the
generator and thus of the rotor. The low rotational
speed of the turbine rotor n
rotor
is translated into the
generator rotational speed n
generator
by a gear box
with the transmission ratio r. The generator speed
depends on the number of pole pairs p and the
frequency of the grid ƒ
grid
.
=
n
generator
r
=
ƒ
grid
p
=
ƒ
grid
r · p
The details on fixed speed machines are depicted in
the figure 3.2. The greatest advantages of WT with
induction generators is the simple and cheap
construction. In addition no synchronisation device
is required. With the exception of bearings there are
no wearing parts.
The disadvantages of induction generators are high
starting currents, which usually are smoothed by a
thyristor controller, and their demand for reactive
power.
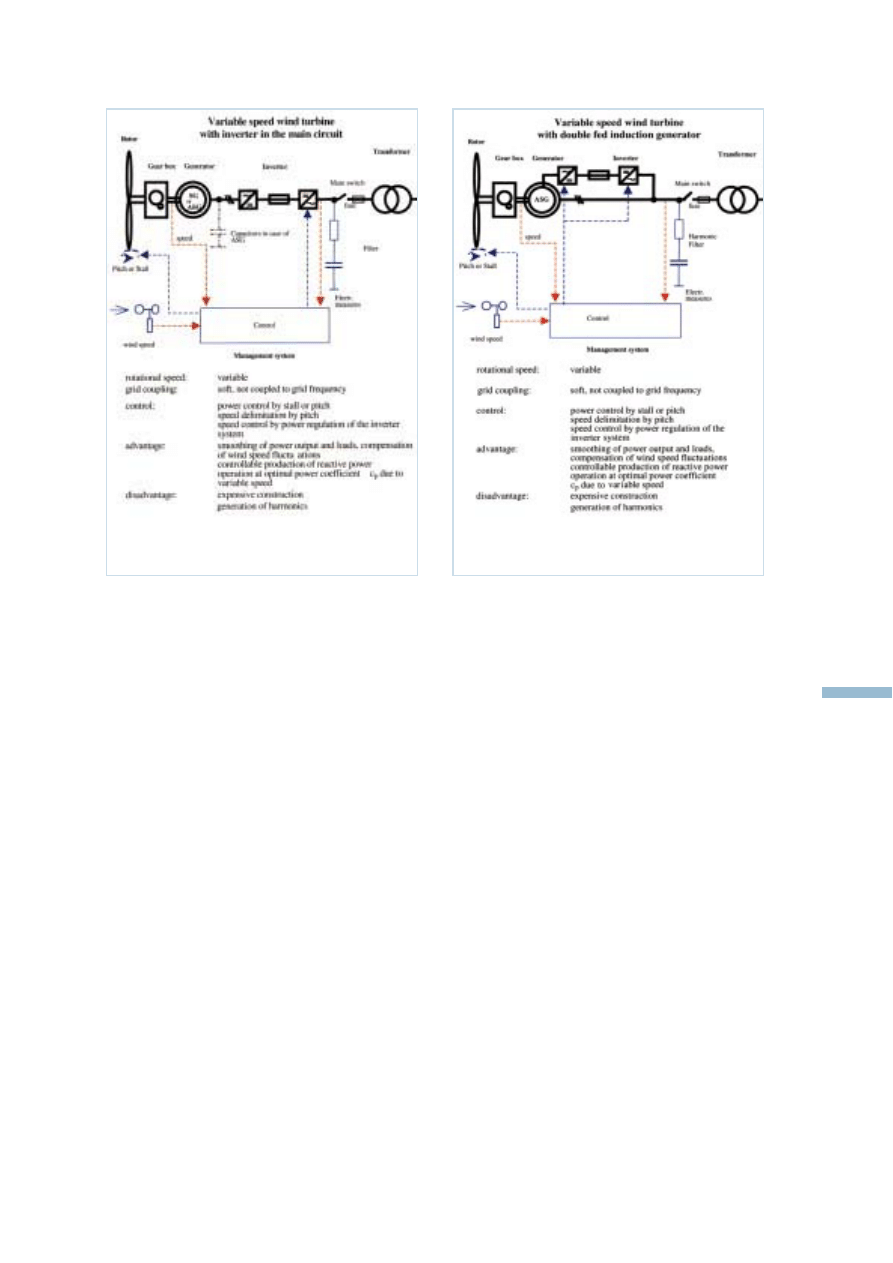
3.2 Variable Speed Wind Turbines
In variable speed machines the generator is connec-
ted to the grid by an electronic inverter system. For
synchronous generators and for induction genera-
tors without slip rings this inverter system is
connected between the stator of the generator and
the grid like fig. 3.3, where the total power produc-
tion must be fed through the inverter. For induction
generators with slip rings the stator of the generator
is connected to the grid directly. Only the rotor of
the generator is connected to the grid by an electro-
nic inverter, see fig. 3.4. This gives the advantage,
that only a part of the power production is fed
through the inverter. That means the nominal power
of the inverter system can be less than the nominal
power of the WT. In general the nominal power of
the inverter is the half of the power of the WT,
enabling a rotor speed variation in the range of half
the nominal speed.
By the control of active power of the inverter, it is
possible to vary the rotational speed of the genera-
tor and thus of the rotor of the WT.
3.3 Inverter systems
If the WT operates at variable rotational speed, the
electric frequency of the generator varies and must
therefore be decoupled from the frequency of the
grid. This can be achieved by an inverter system.
There are two different types of inverter systems:
grid commutated and self commutated inverter
systems. The grid commutated inverters are mainly
thyristor inverters, e. g. 6 or 12 pulse. This type of
inverter produces integer harmonics like the 5th,
7th, 11th, 13th order etc (frequencies of 250, 350,
550, 650 Hz,...), which in general must be reduced
by harmonic filters. On the other hand thyristor
inverter are not able to control the reactive power.
W
ind
Turbine
Grid
Connection
&
Interaction
10
Figure 3.1: Number of different types of WT in the
German market in the year 2000
Figure 3.2: Details of the fixed WT
n
rotor
n
generator
n
rotor
Their behaviour concerning reactive power is
similar to the behaviour of an induction generator
they consume inductive reactive power.
Self commutated inverter systems are mainly pulse
width modulated (PWM) inverter, where IGBTs
(Insulated Gate Bipolar Transistor) are used. This
type of inverter gives the advantage, that in addition
to the control of the active power the reactive power
is also controllable. That means the reactive power
demand of the generator can be delivered by the
PWM-inverter. One disadvantage is the production
of interharmonics. In general these interharmonics
are generated by the inverter in the range of some
kHz. Thus filters are necessary to reduce the
interharmonics. But due to the high frequencies, in
general the construction of the filters is easier.
In modern WT generally use is made of transistor
based inverter systems only.
4 Interaction with the
Local Electricity Network
The modern electricity supply network is a complex
system. The somewhat vague term “power quality”
is used to describe the interaction between traditio-
nal producers operating fossil fired, nuclear, or
hydro power plants and consumers. The latter may
be large (heavy industry - metal melting) or small
(private homes) consumers. In the last 10 years, a
steadily increasing number of renewable energy
sources such as wind or solar (photovoltaic)
powered generating systems have been added to the
systems. A distinctive feature of electricity is that it
cannot be stored as such - there must at any instant
be balance between production and demand.
“Storage” technologies such as batteries, pump
storage and fuel cells all have one common charac-
teristic i.e. the electric energy to be stored is conver-
ted to other forms, such as chemical (batteries),
potential energy in form of water in high storage
(pump storage) and hydrogen (fuel cells). All
renewable resources produce when the source is
available - for wind power, as the wind blows. This
characteristic is of little if any importance when the
amount of wind power is modest compared to the
total installed (and spinning) capacity of controlla-
ble power plants, but it changes into a major techni-
cal obstacle as the renewable part (termed penetra-
tion) grows to cover a large fraction of the total
demand for electric energy in the system.
On the local level, voltage variations are the main
problem associated with wind power. Normal static
tolerances on voltage levels are ±10%. However,
fast small variations become a nuisance at levels as
low as 0.3% and in weak grids - as is often found
W
ind
Tu
rbine
Grid
Connection
&
Interaction
11
Figure 3.3: Details of the variable speed
WT with inverter in the main circuit
Figure 3.4: Details of the variable speed
WT with double fed induction generator
in remote areas where the wind conditions are best.
This can be the limiting factor on the amount of
wind power which can be installed. In the
following, a short introduction is given to each of
the electrical parameters which taken together are
used to characterise power quality - or more correct,
voltage quality - in a given point in the electricity
supply system.
4.1 Short circuit power level
The short circuit power level in a given point in the
electrical network is a measure of its strength and,
while not directly a parameter in the voltage quality,
has a heavy influence. The ability of the grid to
absorb disturbances is directly related to the short
circuit power level of the point in question. Any
point (p) in the network can be modelled as an
equivalent circuit as shown in Figure 4.1. Far away
from the point the voltage can be taken as constant
i.e. not influenced by the conditions in p. The
voltage in this remote point is designated U
SC
and
the short circuit power level S
SC
in MVA can be
found as U
SC
2
/ Z
SC
where Z
SC
is the line impedan-
ce. Variations in the load (or production) in p causes
current variations in the line and these in turn a
varying voltage drop (
∆U) over the line impedance
Z
SC
. The voltage in p (U
L
) is the difference between
U
SC
and
∆U and this resulting voltage is seen by -
and possibly disturbing - other consumers connected
to p. Strong and/or weak grids are terms often used
in connection with wind power installations. It is
obvious from figure 4.1, that if the impedance Z
SC
is
small then the voltage variations in p will be small
(the grid is strong) and consequently, if Z
SC
is large,
then the voltage variations will be large. Strong or
weak are relative terms. For any given wind power
installation of installed capacity P(MW) the ratio
R
SC
= S
SC
/ P is a measure of the strength. The grid
is strong with respect to the installation if R
SC
is
above 20 to 25 times and weak for R
SC
below 8 to
10 times. Depending on the type of electrical equip-
ment in the WT they can sometimes be operated
successfully under weak conditions. Care should
always be taken, for single or few WT in particular,
as they tend to be relatively more disturbing than
installations with many units.
4.2 Voltage variations and flicker
Voltage variations caused by fluctuating loads
and/or production is the most common cause of
complaints over the voltage quality. Very large
disturbances may be caused by melters, arc-welding
machines and frequent starting of (large) motors.
Slow voltage variations within the normal -10+6%
tolerance band are not disturbing and neither are
infrequent (a few times per day) step changes of up
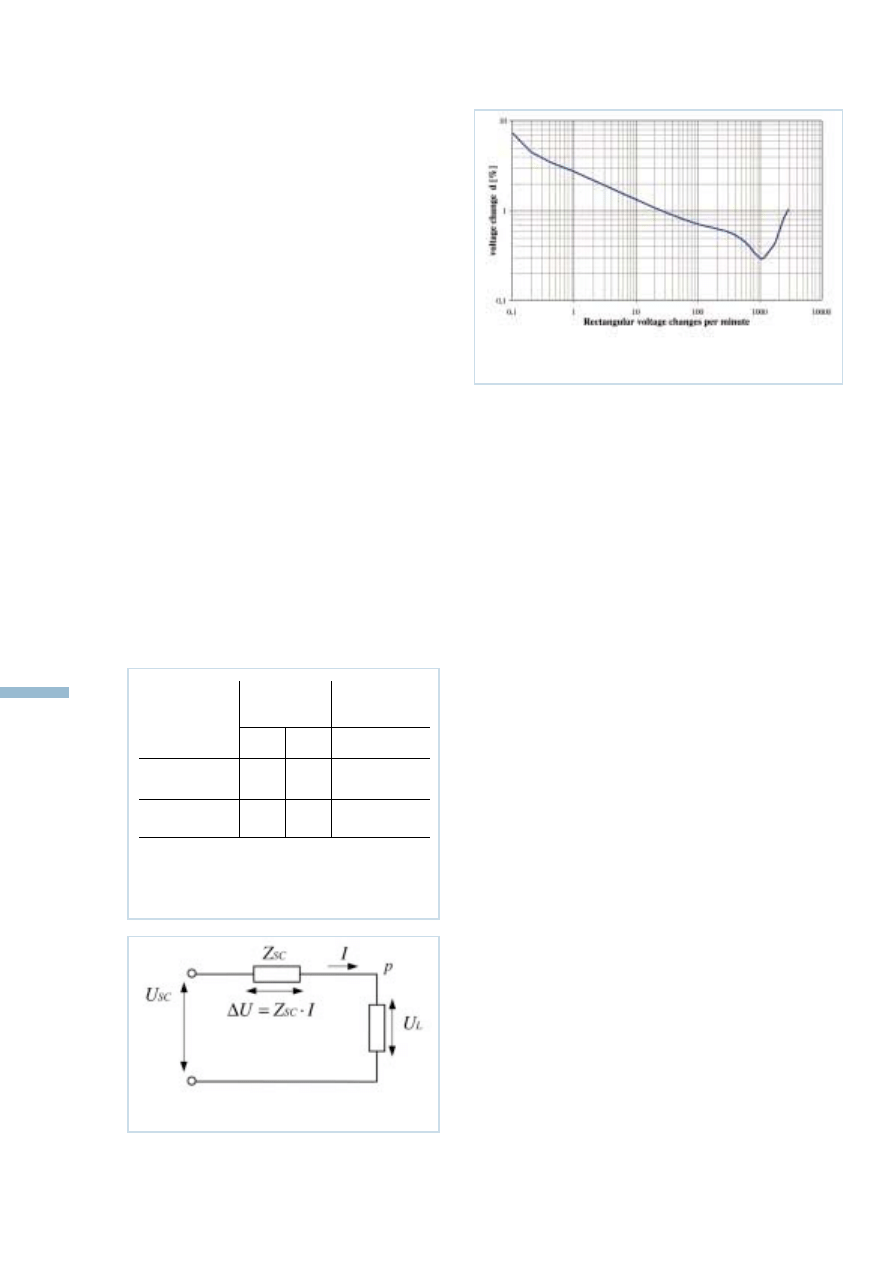
to 3%, though visible to the naked eye. Fast and
small variations are called flicker. Flicker evaluati-
on is based on IEC 1000-3-7 which gives guidelines
for emission limits for fluctuating loads in medium
voltage (MV, i.e. voltages between 1 and 36 kV)
and high voltage (HV, i.e. voltages between 36 and
230 kV) networks. The basis for the evaluation is a
measured curve (figure 4.2) giving the threshold of
visibility for rectangular voltage changes applied to
an incandescent lamp. Disturbances just visible are
said to have a flicker severity factor of P
st
= 1 (P
st
for
P short term). Furthermore, a long term flicker
severity factor P
lt
is defined as:
W
ind
Turbine
Grid
Connection
&
Interaction
12
Figure 4.1: equivalent circuit
Figure 4.2: P
st
= 1 curve for regular rectangular voltage
changes
Table 4.1: Flicker planning and emission
levels for medium voltage (MV) and high
voltage (HV)
Flicker Planning
Emmission
severity factor
levels
levels
MV
HV
MV and HV
P
st
0.9 0.8
0.35
P
lt
0.7 0.6
0.25
Where P
st
is measured over 10 minutes and P
lt
is
valid for two hour periods. IEC 1000-3-7 gives both
planning levels, that is total flicker levels which are
not supposed to be exceeded and emission levels,
that is the contributions from an individual installa-
tion which must not be exceeded. The recommen-
ded values are given in table 4.1
Determination of flicker emission is always based
on measurement. IEC 61000-4-15 specifies a
flickermeter which can be used to measure flicker
directly. As flicker in the general situation is the
result of flicker already present on the grid and the
emissions to be measured, a direct measurement
requires a undisturbed constant impedance power
supply and this is not feasible for WTGS due to
their size. Instead the flicker measurement is based
on measurements of three instantaneous phase
voltages and currents followed by an analytical
determination of P
st
for different grid impedance
angles by means of a “flicker algorithm” - a
programme simulating the IEC flickermeter.
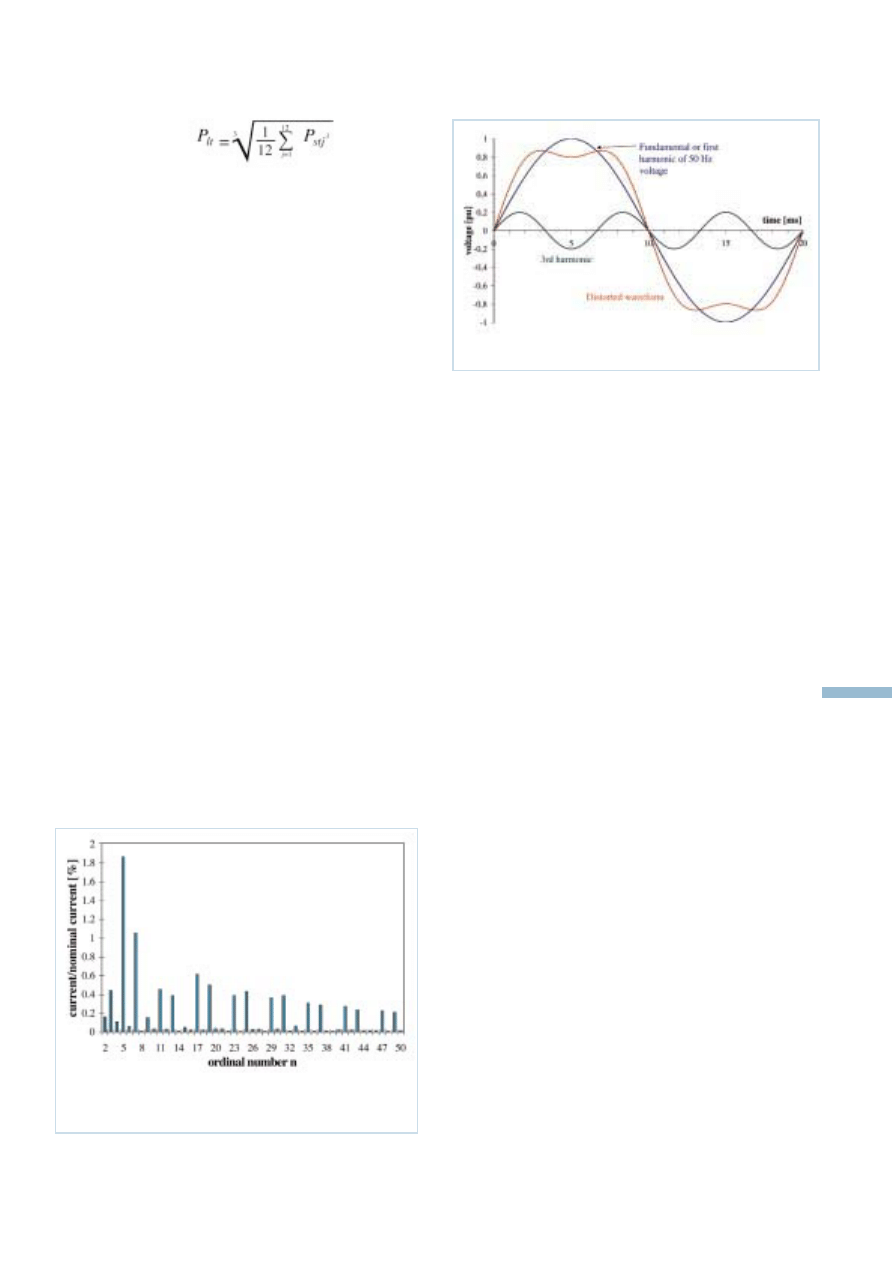
4.3 Harmonics
Harmonics are a phenomenon associated with the
distortion of the fundamental sinewave of the grid
voltages, which is purely sinusoidal in the ideal
situation.
The concept stems back to the French mathematici-
an Josef Fourier who in the early 1800 found that
any periodical function can be expressed as a sum
of sinusoidal curves with different frequencies
ranging from the fundamental frequency - the first
harmonic - and integer multiples thereof where the
integer designates the harmonic number. Figure 4.3
shows the distortion to the fundamental 50 Hz
voltage by adding 20% third harmonic (150 Hz) to
the wave form.
Harmonic disturbances are produced by many types
of electrical equipment. Depending on their
harmonic order they may cause different types of
damage to different types of electrical equipment.
All harmonics causes increased currents and
possible destructive overheating in capacitors as the
impedance of a capacitor goes down in proportion
to the increase in frequency. As harmonics with
order 3 and odd higher multiples of 3 are in phase in
a three phase balanced network, they cannot cancel
out between the phases and cause circulating
currents in the delta windings of transformers, again
with possible overheating as the result. The higher
harmonics may further give rise to increased noise
in analogue telephone circuits.
Highly distorting loads are older unfiltered
frequency converters based on thyristor technology
and similar types of equipment. It is characteristic
for this type that it switches one time in each half
period and it may generate large amounts of the
lower harmonic orders, i.e. up to N=40, see figure
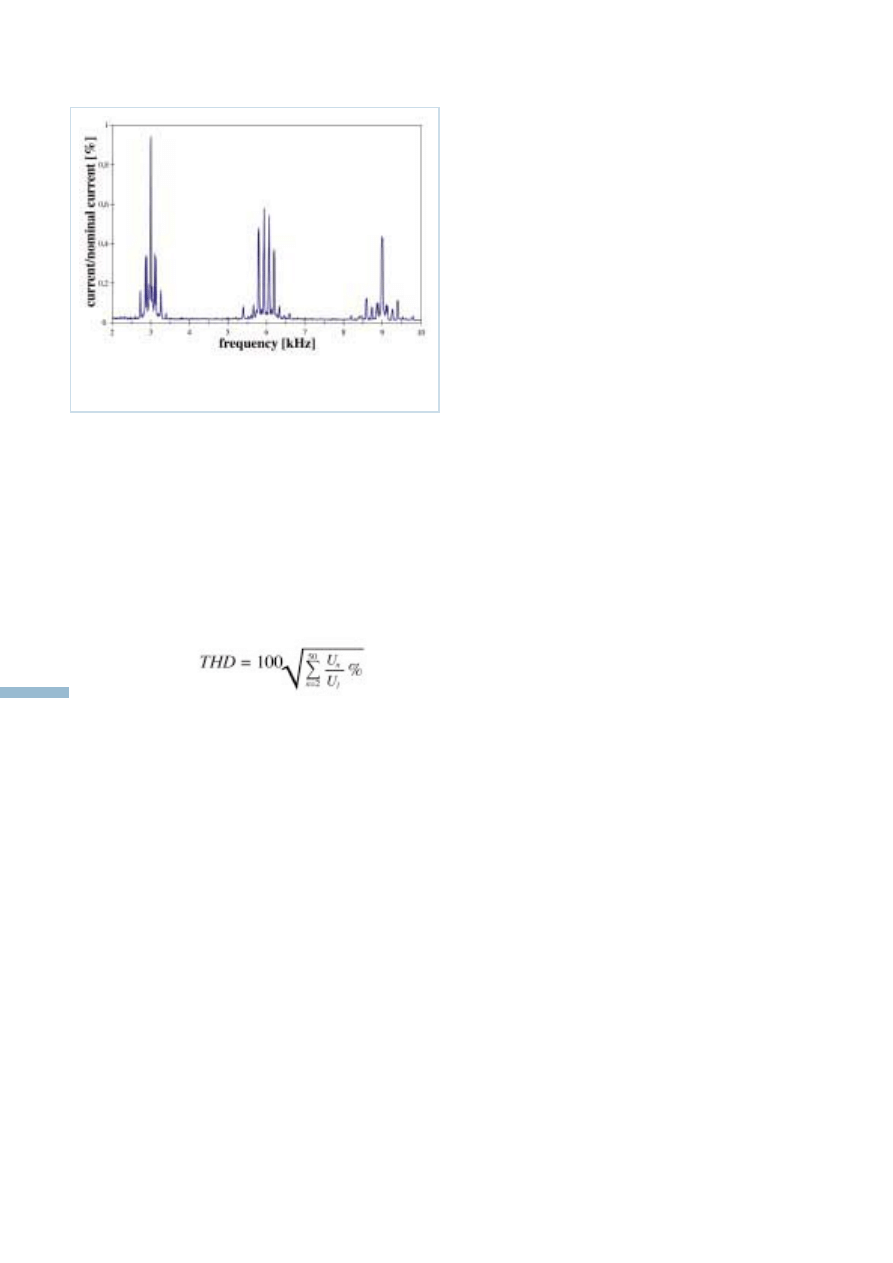
4.4.Newer transistor based designs are used in most
variable speed WT today. The method is referred to
as Pulse Width Modulation (PWM). It switches
many times in each period and typically starts
producing harmonics where the older types stop,
that is around 2 kHz. Their magnitude is smaller and
they are easier to remove by filtering than the
harmonics of lower order. Figure 4.5 gives an
example of the harmonics of a WT with PWM
inverter system.
IEC 1000-3-6 put forward guidelines on compatibi-
lity and planning levels for MV and HV networks
W
ind
Tu
rbine
Grid
Connection
&
Interaction
13
Figure 4.3: Distortion by 3
rd
harmonic
Figure 4.4: Harmonic currents of a 6pulse thyristor
inverter with filter
and presents methods for assessing the contribution
from individual installations to the overall distur-
bance level.
The distortion is expressed as Total Harmonic
Distortion ( THD ) and the recommended compati-
bility level in a MV system is 8 % whereas the
indicative Planning levels for a MV system is 6.5 %
and 3 % in a HV system. Based on the amplitudes
(or RMS values) of the harmonics present in the
voltage, THD can be found as:
where U
n
are the individual harmonics and U
1
the
fundamental amplitude (or RMS value).
4.4 Frequency
The electrical supply and distribution systems used
world-wide today are based on alternating voltages
and currents (AC systems). That is, the voltage
constantly changes between positive and negative
polarity and the current its direction. The number of
changes per second is designated the frequency of
the system with the unit Hz. In Europe the frequen-
cy is 50 Hz whereas it is 60 Hz in many other places
in the world. The frequency of the system is propor-
tional to the rotating speed of the synchronous
generators operating in the system and they are -
apart from an integer even factor depending on
machine design - essentially running at the same
speed: They are synchronised. Increasing the
electrical load in the system tends to brake the
generators and the frequency falls. The frequency
control of the system then increases the torque on
some of the generators until equilibrium is restored
and the frequency is 50 Hz again.
The requirements to frequency control in the West
European grid are laid down in the UCPTE (Union
for the Co-ordination of Production and Transmissi-
on of Electricity) rules.
The area is divided in a number of control zones
each with its own primary and secondary control.
The primary control acts on fast frequency deviati-
ons, with the purpose of keeping equilibrium
between instantaneous power consumption and
production for the whole area. The secondary
control aims at keeping the balance between
production and demand within the individual zones
and keeping up the agreed exchange of power with
other zones.
The power required for primary control is 3000 MW
distributed throughout the control zones whereas
the frequency control related to keeping the time for
electric grid controlled watches is accomplished by
operating the system at slightly deviating frequen-
cies in a diurnal pattern so that the frequency on an
average is 50 Hz.
In the Scandinavian grid a similar scheme is
operated in the NORDEL system.
4.5 Reactive Power
Reactive power is a concept associated with oscilla-
ting exchange of energy stored in capacitive and
inductive components in a power system. Reactive
power is produced in capacitive components (e.g.
capacitors, cables) and consumed in inductive
components (e.g. transformers, motors, fluorescent
tubes). The synchronous generator is special in this
context as it can either produce reactive power (the
normal situation) when overmagnetised or consume
reactive power when undermagnetised. Voltage
control is effected by controlling the magnetising level
of the generator i.e. a high magnetising level results
in high voltage and production of reactive power.
As the current associated with the flow of reactive
power is perpendicular (or 90 deg. out of phase) to
the current associated with active power and to the
voltage on the terminals of the equipment the only
energy lost in the process is the resistive losses in
lines and components. The losses are proportional
to the total current squared. Since the active and
reactive currents are perpendicular to each other, the
total resulting current is the root of the squared sum
of the two currents and the reactive currents hence
contribute as much to the system losses as do the
active currents. To minimise the losses it is
necessary to keep the reactive currents as low as
possible and this is accomplished by compensating
W
ind
Turbine
Grid
Connection
&
Interaction
Figure 4.5: Frequency Analysis of current of a WT
with PWM inverter system without filter
14
reactive consumption by installing capacitors at or
close to the consuming inductive loads. Furthermo-
re, large reactive currents flowing to inductive loads
is one of the major causes of voltage instability in
the network due to the associated voltage drops in
the transmission lines. Locally installed capacitor
banks mitigates this tendency and increases the
voltage stability in area.
Many WT are equipped with induction generators.
The induction generator is basically an induction
motor, and as such a consumer of reactive power, in
contrast to the synchronous generator which can
produce reactive power. At no load (idling), the
consumption of reactive power is in the order of
35-40% of the rated active power increasing to
around 60% at rated power. In any given local area
with WT, the total reactive power demand will be
the sum of the demand of the loads and the demand
of WT. To minimise losses and to increase voltage
stability, the WT are compensated to a level
between their idling reactive demand and their full
load demand, depending on the requirements of the
local utility or distribution company. Thus the
power factor of WT, which is the ratio between
active power and apparent power, is in general in
the range above 0.96.
For WT with pulse width modulated inverter
systems the reactive power can be controlled by the
inverter. Thus these WT can have a power factor of
1.00. But these inverter systems also give the possi-
bility to control voltage by controlling the reactive
power (generation or consumption of reactive
power).
4.6 Protection
The extent and type of electrical protective functi-
ons in a WT is governed by two lines of conside-
ration. One is the need to protect the WT, the other
to secure safe operation of the network under all
circumstances.
The faults associated with first line are short circuits
in the WT, overproduction causing thermal overlo-
ad and faults resulting in high, possibly dangerous,
overvoltages, that is earthfaults and neutral voltage
displacement.
The second line can be described as the utility view,
that is the objective is to disconnect the WT when
there is a risk to other consumers or to operating
personnel. The faults associated with this line are
situations with unacceptable deviations in voltage
and/or frequency and loss of one or more phases in
the utility supply network. The required functions
are given in table 4.2
Depending on the WT design, that is if it can
operate as an autonomous unit, a Rate Of Change
Of Frequency (ROCOF) relay may be needed to
detect a step change in frequency indicating that the
WT is operating in an isolated part of the network
due for example to tripping of a remote line supply-
ing the area.
In Germany the grid protection device of WT will
be tested according [1]. The test shows the capabili-
ty of the WT, to meet grid protection limiting values
set by utilities. During this test the reaction of the
WT is checked and recorded for voltage and
frequency exceeding upper and lower limits.
Responding levels and response times are recorded
and depicted in the final data sheet. The functiona-
lity of the complete protection system is also
verified and certificated.
The present development, where large - hundreds of
MW - off shore wind farm will be built and operated
in concentrated areas, and the subsequent require-
W
ind
Tu
rbine
Grid
Connection
&
Interaction
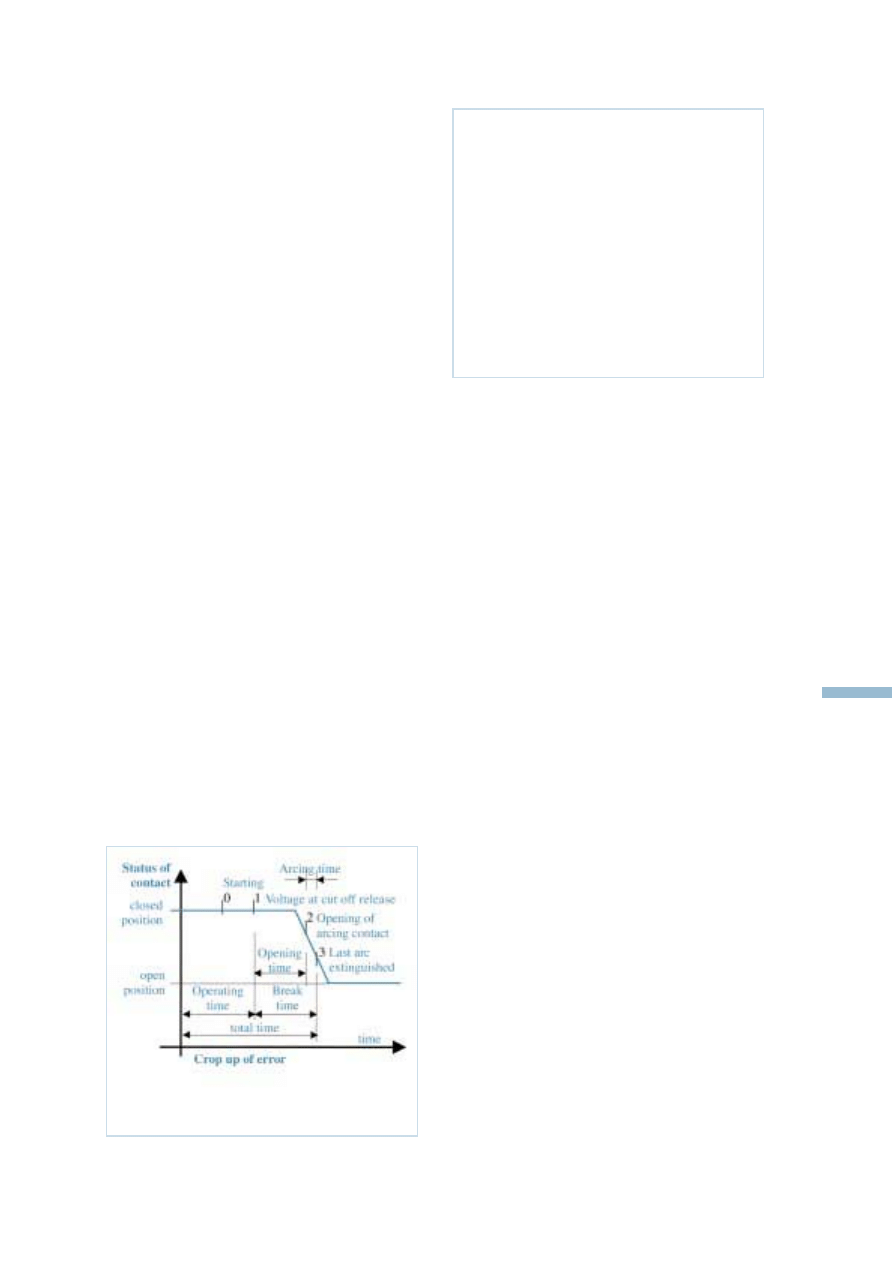
15
Figure 4.6: Definitions for the cut-off of circuit
breakers
Table 4.2: Required functions
• Over fequency (one level delayed,
capacitors instantaneously)
• Under frequency (one level delayed)
• Over voltage (one level delayed,
one level instantaneously
• Under voltage (one level delayed)
• Loss of mains (instantaneously)
• High overcurrents (short circuit)
• Thermal overload
• Earth fault
• Neutral voltage displacement
ment for stability during grid faults, will put
forward new requirements to the protection of WT
(see below).
4.7 Network stability
The problem of network stability has been touched
upon briefly above. Three issues are central in the
discussion and all are largely associated with
different types of faults in the network such as
tripping of transmission lines (e.g. overload), loss of
production capacity (e.g. any fault in boiler or
turbine in a power plant) and short circuits.
Permanent tripping of transmissions lines due to
overload or component failure disrupts the balance
of power (active and reactive) flow to the adjacent
areas. Though the capacity of the operating genera-
tors is adequate large voltage drops may occur
suddenly. The reactive power following new paths
in a highly loaded transmission grid may force the
voltage operating point of the network in the area
beyond the border of stability. A period of low
voltage (brownout) possibly followed by complete
loss of power is often the result.
Loss of production capacity obviously results in a
large power unbalance momentarily and unless the
remaining operating power plants have enough so
called “spinning reserve”, that is generators not
loaded to their maximum capacity, to replace the
loss within very short time a large frequency and
voltage drop will occur followed by complete loss
of power. A way of remedy in this situation is to
disconnect the supply to an entire area or some large
consumers with the purpose of restoring the power
balance and limit the number of consumers affected
by the fault.
Short circuits take on a variety of forms in a
network and are by far the most common. In severi-
ty they range from the one phase earth fault caused
by trees growing up into an overhead transmission
line, over a two phase fault to the three phase short
circuit with low impedance in the short circuit itself.
Many of these faults are cleared by the relay protec-
tion of the transmission system either by disconnec-
tion and fast reclosure, or by disconnection of the
equipment in question after a few hundred millise-
conds. In all the situations the result is a short period
with low or no voltage followed by a period where
the voltage returns. A large - off shore - wind farm
in the vicinity will see this event and disconnect
from the grid immediately if only equipped with the
protection described above. This is equivalent to the
situation “loss of production capacity” and dis-
connection of the wind farm will further aggravate
the situation. Up to now, no utility has put forward
requirement to dynamic stability of WT during grid
faults. The situation in Denmark today, and the
visions for the future, have changed the situation
and for wind farms connected to the transmission
grid, that is at voltages above 100 kV, this will be
required.
4.8 Switching operations and
soft starting
Connection and - to a smaller degree - disconnec-
tion of electrical equipment in general and induction
generators/motors especially, gives rise to so called
transients, that is short duration very high inrush
currents causing both disturbances to the grid and
high torque spikes in the drive train of a WT with a
directly connected induction generator.
W
ind
Turbine
Grid
Connection
&
Interaction
16
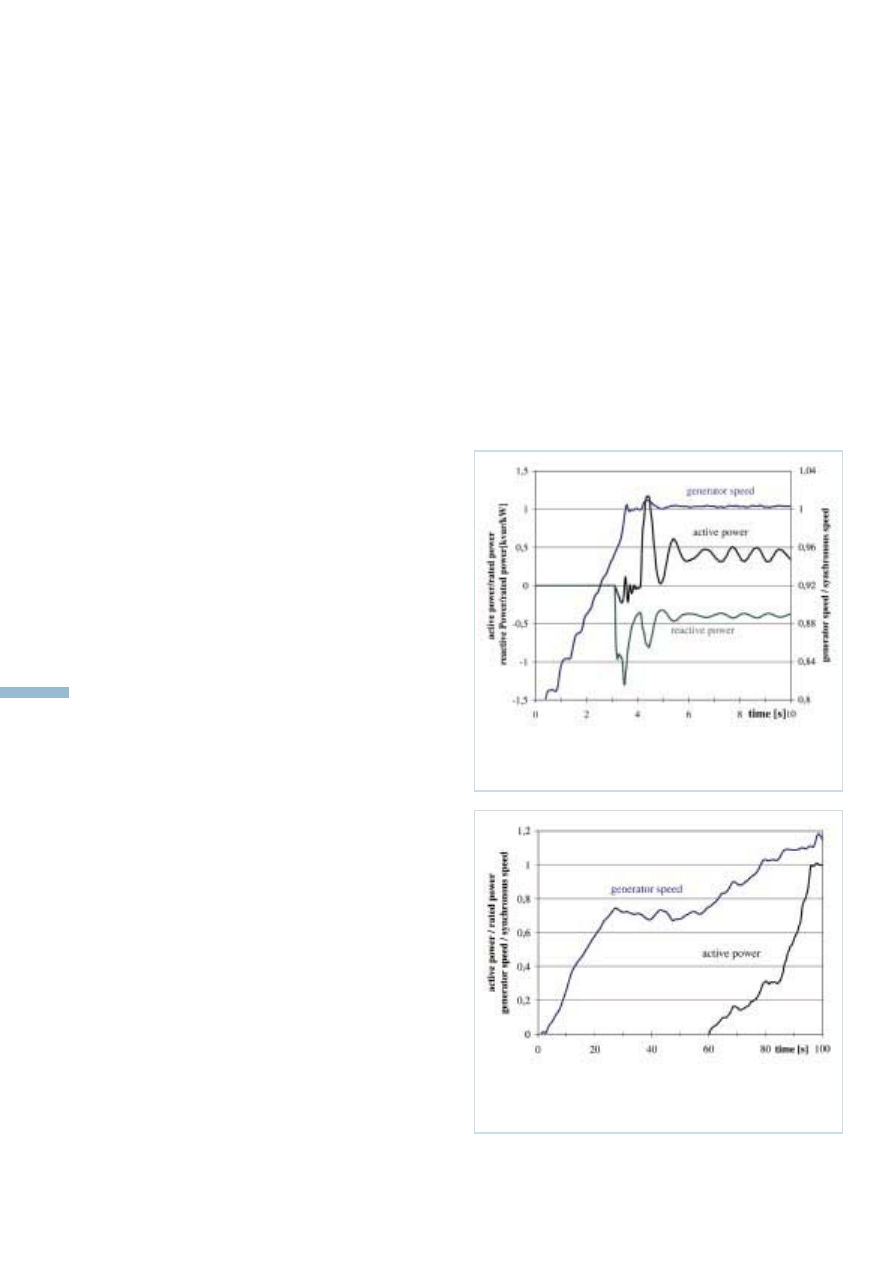
Figure 4.7: Cut-in of a stall regulated WT with
direct coupled induction generator
Figure 4.8: Cut-in at rated wind speed of a variable
speed WT with power electronics
In this context WT fall into two classes. One
featuring power electronics with a rated capacity
corresponding to the generator size in the main
circuit and one with zero or low rating power
electronics in a secondary circuit - typically the
rotor circuit of an induction generator.
The power electronics in the first class can control
the inrush current continuously from zero to rated
current. Its disturbances to the grid during switching
operations are minimal and it will not be discussed
further here.
Unless special precautions are taken, the other class
will allow inrush currents up to 5-7 times the rated
current of the generator after the first very short
period (below 100ms) where the peak are consider-
ably higher, up to 18 times the normal rated current.
A transient like this disturbs the grid and to limit it
to an acceptable value all WT of this class are
equipped with a current limiter or soft starter based
on thyristor technology which typically limits the
highest RMS value of the inrush current to a level
below two times the rated current of the generator.
The soft starter has a limited thermal capacity and is
short circuited by a contactor able to carry the full
load current when connection to the grid has been
completed. In addition to reducing the impact on the
grid, the soft starter also effectively dampens the
torque peaks in the air gap of the generator associa-
ted with the peak currents and hence reduces the
loads on the gearbox.
4.9 Costs of Grid Connection
The costs for grid connection can be split up in two.
The costs for the local electrical installation and the
costs for connecting the wind farm to the electrical
grid.
The local electrical installation comprises the
medium voltage grid in the wind farm up to a
common point and the necessary medium voltage
switch gear at that point. Cited total costs for this
item ranges from 3 to 10 % of the total costs of the
complete wind farm. It depends on local equipment
prices, technical requirements, soil conditions, the
distance between the turbines, the size of the wind
farm and hence the voltage level for the line to the
connecting point the existing grid. If the wind farm
is large and the distance to the grid long there may
be a need for a common transformer stepping up the
medium voltage in the wind farm to the local high
voltage transmission level.
The costs for connection to the electrical grid ranges
from almost 0% for a small farm connected to an
adjacent medium voltage line and upwards. For a
150 MW off-shore wind farm a figure of 25% has
been given for this item.
Cost of electricity delivered to the
grid from offshore wind energy.
Compared to onshore wind farms there is a number
of additional costs and uncertainties to take into
account when assessing the production costs from
large offshore wind farms. The relationship between
the different cost items usually specified is quite
different from the relationship found for onshore
wind farms.
The following Table 4.3 indicates a probable distri-
bution between the different items for a 150 MW
offshore wind farm situated approximately 20 km
from the shore and with a further 30 km to the
nearest high voltage substation where it can be
connected to the existing grid. The table further
gives the absolute costs in Mill. e (Euro) and - for
comparison - shows the distribution between
comparable items for a typical onshore wind farm.
The cost of electricity consists of capital costs
(interest and repayment) for the investment and
costs of operation and maintenance. It is usually
expressed as an amount per kWh produced. For
typical Danish onshore wind farms situated in
places with average wind conditions the equivalent
number of full load hours will be in the range 2000
- 2200 hours stretching up to 2500 hours for the best
sites. For offshore wind farms in Danish coastal
waters, i.e. with wind conditions determined by the
same wind climate in the upper atmosphere, figures
in the range 3200 - 3500 equivalent full load hours
are predicted.
W
ind
Tu
rbine
Grid
Connection
&
Interaction
17
Table 4.3: Costs of a 150 MW wind farm
Item
Offshore
Onshore
Costs in
%
%
Mill. g
Foundations
36
16
5.5
Wind turbines
113
51
71.0
Internal electric grid
11
5
6.5
Offshore transformer
station
4.5
2
-
Grid connection
40
18
7.5
O&M facilities
4.5
2
-
Engineering and
project administration
8.9
4
2.5
Miscellaneous
4.5
2
7
Total:
222
100
100

An assessment of costs for operation and mainten-
ance (O&M) for offshore wind farms can be based
on known figures for onshore installations. For the
500 - 600 kW generation of WT - where no long
term figures are known - recent statistic indicate
costs of 0.005 - 0.007 d/kWh for privately owned
wind farms and a somewhat lower values for utility
owned. In the Danish feasibility studies for off-
shore wind farms a figure of 0.01 d/kWh has been
used. This figure will be used here as well.
The cost of electricity will further depend heavily
on the rate of interest for the investment and the
depreciation time for the loans.
When the project is built, the cost and financial
conditions are known and the uncertainty associated
with depreciation time and interest disappears
leaving production and O&M costs as the main
uncertainties. The wind conditions and prediction
techniques over open water are less known than for
onshore sites and - though costly - wind speed
measurements on site must be strongly recommen-
ded. The difference between the above cited figures
for equivalent full load hours for on- and offshore
installations underscores this need.
O&M cost is a different matter. Experience so far
allows no long term precise prediction for offshore
wind farms and it is not likely that the costs will
remain constant throughout the lifetime (20 years or
more) of the installation. If the depreciation time is
long - as for some utility owned wind farms - it is
likely that a refurbishment will be needed. To take
this into account, two approaches are often used:
A fixed amount per kWh produced plus a lump sum
for major repair work at a certain point in time. For
an onshore wind farm, indicative figures for this
approach are 0.007 d/kWh plus 20 % of the initial
investment in the WT for major refurbishment
during the 11th year of operation. Possible figures
for Offshore installations could be 0.01 d/kWh plus
30% of the initial investment.
The second approach is to use a gradual - and linear
- increase of the costs throughout the depreciation
period. Again, for an onshore wind farm, indica-
tive figures for this approach is 0.007 d/kWh
immediately after commissioning increasing to
0.01 d/kWh at the end of the period. Possible
figures for an offshore wind farm using this
approach could be a start value of 0.01 d/kWh
increasing to 0.016 d/kWh.
The future development of production costs from
offshore wind farms is closely connected to the
technological development of WT and electrical
transmission systems (grid connection) as these two
items account for a very high proportion of the total
cost of offshore installations (70% in the example in
table 4.3.).
The tremendous drop in onshore wind energy
production prices since the early eighties seem to
have levelled off and future price decreases will
take place at a slower pace. The main reason for this
could be explained by the fact, that the WT have
grown into mature technical products with corres-
pondingly smaller marginals for cost decreases.
New technologies for transmission of electrical
energy are being developed, in particular the transi-
stor (IGBT - Isolated Gate Bipolar transistor)
technology for high voltage direct current (HVDC)
transmission. The technology is on the brink of
commercial break through and while a potential for
price reductions is obviously there, the potential is
still unknown - not at least due to lack of competiti-
on as there is as yet only few manufacturers of this
type of systems. The technology however holds
promises as it opens for a number of new design
options (see the section on connection to the electri-
city supply system) that will ease the integration of
large amounts of wind energy into the electrical
supply system.
All in all: there is a potential for future reductions in
production prices from offshore wind farms but
they will come slowly and a dramatic change as the
one seen for onshore wind power since the early
eighties is not likely.
4.10 Safety, Standards and
Regulations
Measurement guidelines
The following guidelines give rules and require-
ments for the measurement of power quality of WT:
- IEC 61400-21-CDV:
Wind Turbines –
Part 21: Measurement
and assessment of power quality
characteristics of grid connected
wind turbines.
- MEASNET ”Power quality measurement
procedure”, November 2000.
- German guideline: Technische
Richtlinien für Windenergieanlagen,
Teil 3: Bestimmung
der Elektrischen Eigenschaften,
Rev. 13. 01.01.2000. Fördergesellschaft
Windenergie e.V. FGW, Hamburg.
W
ind
Turbine
Grid
Connection
&
Interaction
18
In addition to the measurement requirements the
IEC guideline gives methods for estimating the
power quality expected from WT or wind farms
when deployed at a specific site.
MEASNET is a network of European measuring
institutes with the aim of harmonising measuring
procedures and recommendations in order to
achieve comparability and mutual recognition of the
measurement results of the member institutes.
The German guideline is a national guideline, but is
also accepted in other countries. The guideline is
different from the IEC-guideline. Thus results from
the German guideline and from the IEC guideline
are not completely comparable.
Guidelines for grid connection
The following guidelines give requirements and
limited values for the grid connection of WT:
- Eigenerzeugungsanlagen am Mittelspan-
nungsnetz. Richtlinie für Anschluß und
Parallelbetrieb von Eigenerzeugungsanlagen
am Mittelspannungsnetz.
2. Ausgabe 1998. Vereinigung Deutscher
Elektrizitätswerke VDEW e.V. (Frankfurt
am Main). Frankfurt am Main: Verlags-
und Wirtschaftsgesellschaft der Elektrizitäts-
werke m.b.H. VWEW.
- Connection of wind turbines to low
and medium voltage networks.
October 1998, Komité rapport
111-E. DEFU, DK-2800 Lyngby.
- Anslutning av mindre produktionsanläggningar
till elnätet. Sveriges Elleverantörer,
Stockholm 1999.
- Specifications for connecting Wind Farms
to the transmission grid.
Second Edition 2000. Eltra amba, DK.
These three guidelines are national guidelines:
• The German VDEW guideline is based on the
results on the German measurement guideline. The
Danish and the Swedish guidelines are based on
results of the IEC 61400-21 measurement guideline.
• There is no specific international standard, giving
limits and recommendations for grid connection of
WTGS. However there are IEC guidelines for
special items of power quality, but not especially for
WTS. The IEC 61000-3-6 gives requirements
concerning harmonics and the IEC 61000-3-7 gives
requirements concerning flicker:
• IEC 61000-3-6: 1996, EMC. Part 3: Limits -
Section 6: Assessment of emission limits for distor-
ting loads in MV and HV power systems - Basic
EMC publication. (Technical report)
IEC 61000-3-7: 1996, EMC. Part 3: Limits –
Section 7: Assessment of emission limits for
fluctuating loads in MV and HV power systems -
Basic EMC publication. (Technical report)
4.11 Calculation methods
In the following an example is given for the calcula-
tion of the perturbation of the grid by WT. The
assessment is performed according to the methods
given in the IEC 61400-21 /2/. WT influences the
power quality concerning:
• steady-state voltage
• switchings
• flicker
(voltage change and
• harmonics
flicker)
For each item the emission of the WTGS has to be
checked.
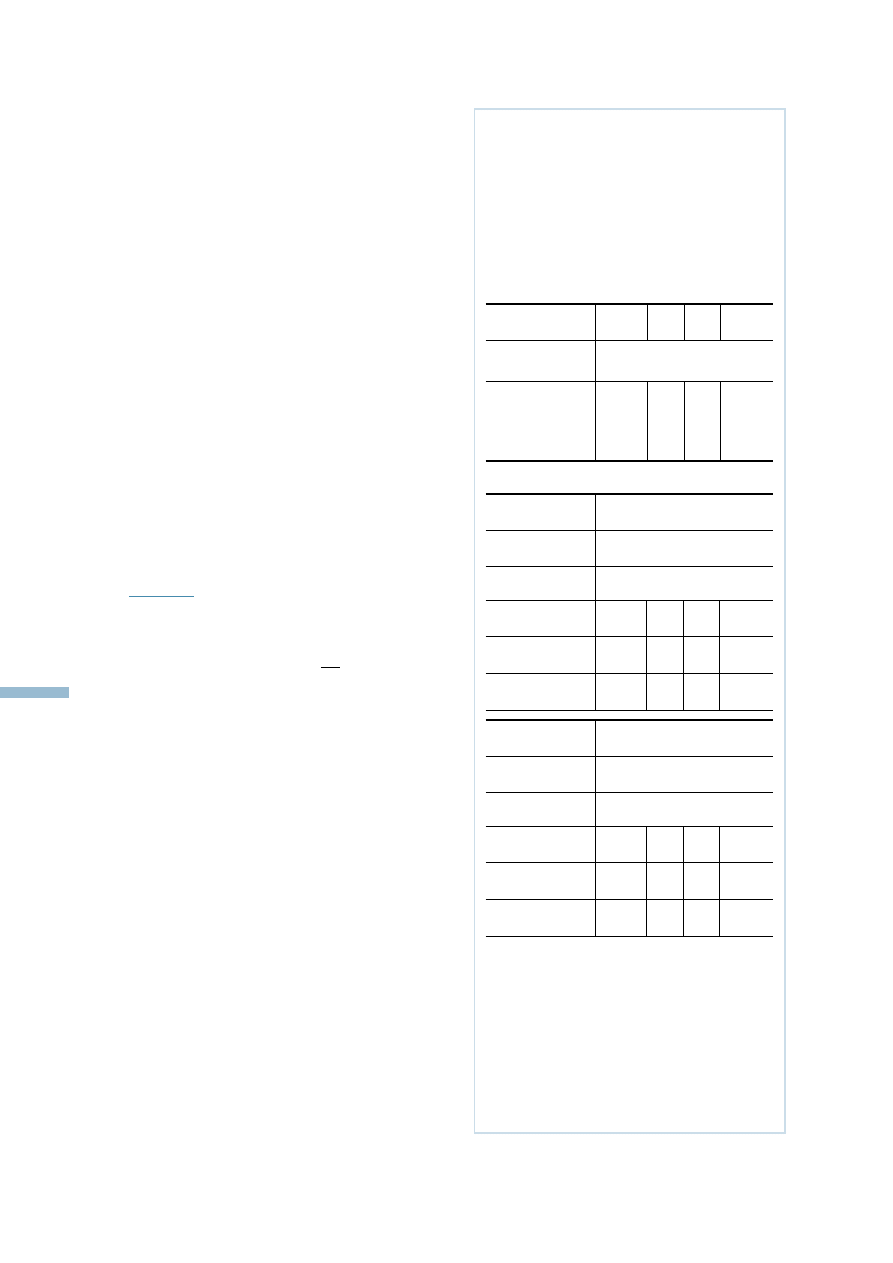
Example:
A wind farm, consisting of 3 WT, each of 600kW
rated power, shall be connected to a 10kV medium
voltage network. From the power quality measure-
ment of the WT, which was performed according to
IEC 61400-21, the data, given in table 4.4 are
available. The data of the network, which are given
by the utility, are also listed in table 4.4. The WT
are stall regulated and have fixed speed.
a. Steady-State voltage
The best solution for the determination of the
steady-state voltage change by the WT would be a
load flow calculation, where all the situations of the
network, the loads and the WT could be proved. But
in general only extreme values are checked.
4 extreme cases should be the minimum for load
flow calculations:
• low loads and low wind power
• low loads and high wind power
• high loads and low wind power
• high loads and high wind power
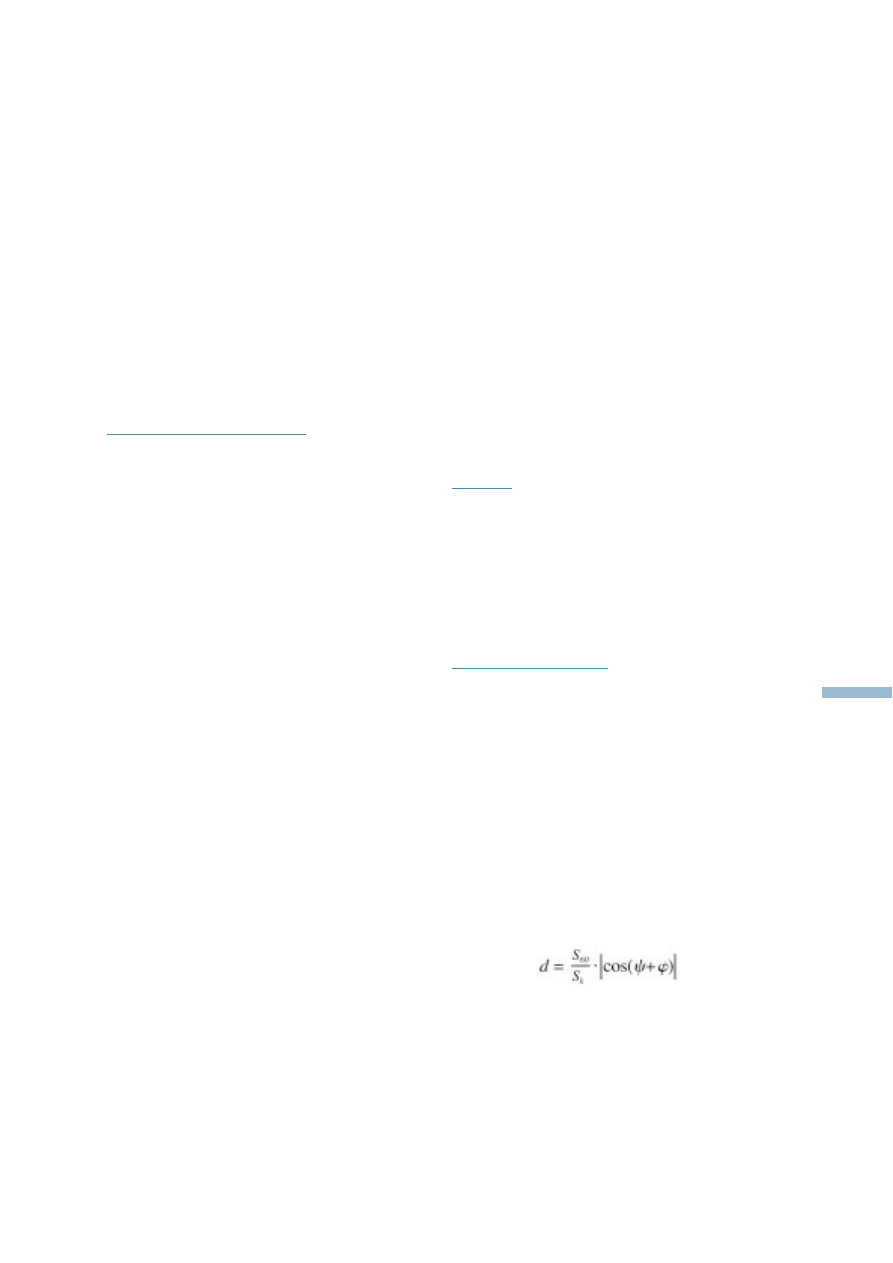
A more simple method for the calculation of the
steady-state voltage change is given by:
only valid for
cos(
+
)
> 0.1
S
k
: short circuit power of the grid at the point
of common coupling (PCC)
S
60
: apparent power at the 1-min. active power peak
d:
steady state voltage change of the grid at
PCC (normalised to nominal voltage)
:
phase angle between voltage and current
:
grid impedance phase angle
W
ind
Tu
rbine
Grid
Connection
&
Interaction
19
The apparent power S
60
and the phase angle
can
be calculated from the active 1-minute power peak
P
60
and from the belonging reactive power Q
60
,
which are given in the power quality data sheet of
the WT. In this case the calculation of S
60
and of the
phase angle
gives:
S
60
= 655 kVA,
= 10 ° (inductive)
With this information the voltage change due to a
single WT can be calculated as:
d = 1.11 %
For the whole wind farm (3 WT) the voltage change
is as follows:
d
wind farm
= 3.32 %
In Germany the maximum permitted steady state
voltage change by WT is 2 % of nominal voltage,
which is exceeded by the wind farm for the given
example. But the more exact load flow calculation
could give lower values. In other countries the
limited values can be different.
b. Flicker
The flicker distortion for continuous operation of
the WT can be calculated by:
S
k
:
short circuit power of the grid at the
point of common coupling (PCC)
k
:
grid impedance angle at PCC
v
a
:
annual average wind speed
S
n
:
apparent power of the WT
at rated power
c (
k
, v
a
): flicker coefficient
P
lt
:
flicker distortion
For the given example the annual average wind
speed of the site of the wind farm at hub height of
the turbines is 7.2 m/s. Thus the wind speed class of
7.5 m/s is used. The power quality data sheet only
gives the flicker coefficients at the grid impedance
angles 50° and 70°. But the grid impedance angle of
the site is 55°. Thus the flicker coefficient at 55° is
interpolated from the values at 50° and 70°. This
interpolation gives a flicker coefficient of
c(55°,7.5m/s)=5.8.
From this flicker coefficient and the above equation
the flicker distortion P
lt
of a single WT is calculated
as P
lt
= 0.141. Due to smoothing effects the flicker
distortion of the whole wind farm is not n-times
W
ind
Turbine
Grid
Connection
&
Interaction
20
Table 4.4: Data of the WT and of the site
Data of the power quality measurement of the WT
according to IEC61400/21/2/:
rated power p
n
=600 kW
rated apparent power: S
n
=607 kVA
rated voltage: U
n
=690 V
rated current In=508 A
max. power P
60
=645 kW
max. Reactive power Q
60
=114 kvar
Flicker:
Grid impendance
30°
50°
70°
85°
angle
k
:
Annual av. wind Flicker coefficient, c(
k,
v
a
):
speed v
a
(m/s):
6.0 m/s
7.1
5.9
5.1
6.4
7.5 m/s
7.4
6.0
5.2
6.6
8.5 m/s
7.8
6.5
5.6
7.2
10.0 m/s
7.9
6.6
5.7
7.3
Switching operations:
Case of switching cut-in at cut in wind speed
operation:
Max. number of
3
switchings N
10
:
Max. number of
30
switchings N
120
:
Grid impendance
30°
50°
70°
85°
angle,
k
:
Flicker step
0.35
0.34
0.38
0.43
factor k
f
(
k
):
Voltage change
0.7
0.7
0.8
0.9
factor k
u
(
k
):
Case of switching cut-in at rated wind speed
operation:
Max. number of
1
switchings N
10
:
Max. number of
8
switchings N
120
:
Grid impendance
30°
50°
70°
85°
angle,
k
:
Flicker step
0.35
0.34
0.38
0.43
factor k
f
(
k
):
Voltage change
1.30
0.85
1.05
1.60
factor k
u
(
k
):
Data of the site:
annual average wind speed: v
a
=7.2 m/s
nominal voltage of the grid: 10 kV
Short circuit power of the grid: S
k
=25 MVA
grid impendance angle:
k
=55°
Number of wind turbines: N=3
Type of wind turbine: stall, direct
grid coupled induction generator
P
lt
= c(
k
, v
a
) ·
S
n
S
k

higher (n: number of turbines of the wind farm) than
the flicker distortion of a single WT. Instead it is the
square root of the number of turbines. In this
example it is:
IEC61000-3-7 gives a maximum permitted flicker
level for medium voltage grids of P
lt
=0.25. Thus the
flicker during continuous operation is within the
limits.
c. Harmonics
A WT with an induction generator directly connec-
ted to the electrical system is not expected to cause
any significant harmonic distortions during normal
operation. Only WT with power electronics have to
be checked concerning harmonics.
The harmonic current emission of such WT with
power electronics are given in the power quality
data sheet. Limits for harmonic emissions are often
given only for harmonic voltages, not for harmonic
currents. Thus harmonic voltages must be calculated
from the harmonic current emission of the WT. But
the grid impedances vary with frequency, where the
utilities often can not give the frequency dependen-
cy of the grid impedances, which makes calculati-
ons difficult. In Germany also limits for harmonic
currents are given. Thus it has only to be checked, if
the harmonic current emission is within the limits.
For the given example harmonics have not be
checked, because the WT have directly grid
connected induction generators without power
electronics.
d. Switching operations
For switching operations two criterions must be
checked: the voltage change due to the inrush
current of a switching and the flicker effect of the
switching.
On the assumption that a control of a wind farm
ensures, that two or more WT of a wind farm are not
switched on simultaneously, only one WT has to be
taken into account for the calculation of the voltage
change:
S
n
:
apparent power of the WT at rated power
S
k
:
short circuit power of the grid at the
point of common coupling (PCC).
k
u
(
k
): voltage change factor
d:
relative voltage change
For the example the worth case of switchings
concerning the voltage change is the cut-in of the
WT at rated wind speed. For this switching the
voltage change factor is k
u
(55°) = 0.9 (interpolati-
on of the voltage change factors at 50 ° and at 70 °.
From this the voltage change due to the switching of
a single WT is d = 2,19%.
The flicker emission due to switching operations of
a single WT can be estimated by:
S
n
:
apparent power of the WT
at rated power
S
k
:
short circuit power of the grid at the
point of common coupling (PCC).
k
f
(
k
): flicker step factor
N
120
:
Number of switchings within
a 2 hours period.
P
lt
:
flicker distortion
The flicker effect has to be calculated for both types
of switching: for the cut-in at cut-in wind speed and
for the cut-in at rated wind speed. For both types of
switchings the power quality data sheet gives the
essential data: The flicker step factor at 55° must be
interpolated from the values at 50° and 70°, the
number of switchings within a 2-hours period are
given. But for the wind farm these numbers must be
multiplied by the number of WT. Thus it can be
calculated:
cut-in at cut-in wind speed:
number of switchings: N*N
120
=3*30
flicker step factor: k
f
(55°)=0,35
thus the flicker distortion by cut-in switchings
at cut-in wind speed is calculated as: P
lt
=0.27.
cut-in at rated wind speed:
number of switchings: N*N
120
=3*8
flicker step factor: k
f
(55°)=0,62
thus the flicker distortion by cut-in switchings
at rated wind speed is calculated as: P
lt
=0.32.
The flicker distortions of both types of switchings
exceeds the flicker level of 0.25. Thus improve-
ments should be made. The improvement could be
made by strengthen the grid or by improve the
power quality behaviour of the WT, may be by
limiting the number of switchings within a 2-hours
period or by decreasing the flicker emission during
switchings.
W
ind
Tu
rbine
Grid
Connection
&
Interaction
21
d = k
u
(
k
) ·
S
n
S
k
P
lt
= 8 · N
· k
f
(
k
) ·
S
n
S
k
0.31
120
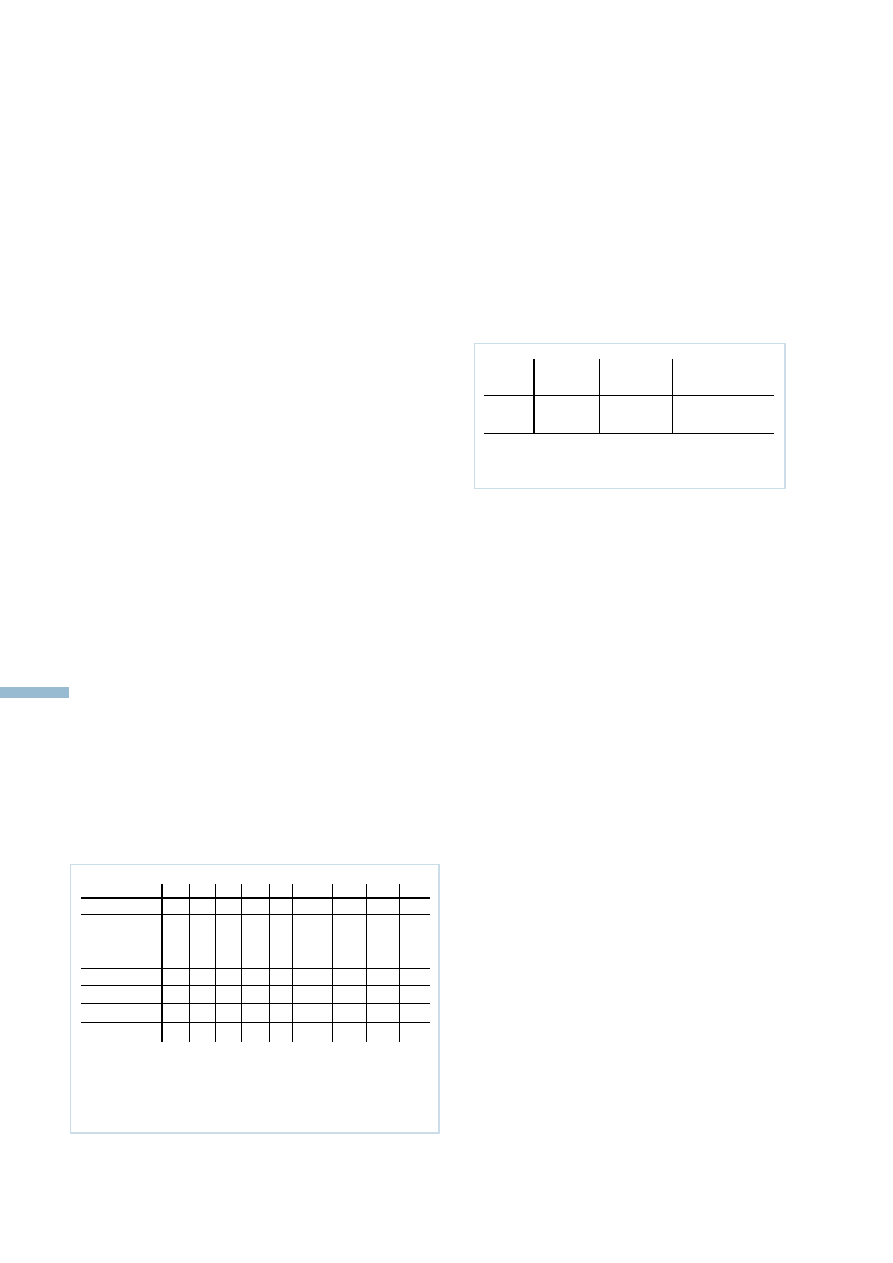
5 Integration into the
National Grid
5.1 Emission Savings
Numerous utility studies have shown that a unit of
wind energy saves a unit of energy generated from
coal, gas or oil - depending on the utility’s plant [3].
Each unit of electricity generated by wind energy
saves emissions of greenhouse gases, pollutants and
waste products.
Emission savings depend on the mix of plant
operated by the utility. WT and wind farms usually
run whenever they can do so and when they come
on-line they displace the so-called ”load following”
plant. These are the generating sets, which are
loaded and unloaded to follow fluctuations in
demand. In many parts of Europe (with the excepti-
on of Sweden and Finland, which have a high
proportion of hydro plant) they are coal-fired, a
situation likely to continue for some years. In island
systems, however, wind may displace oil-fired
generation and in the future wind may displace gas-
fired generation.
The emissions saved by displacing coal plant are in
the range 850-1450g/kWh of carbon dioxide, plus
oxides of sulphur and nitrogen. The exact savings in
a particular system depend on the efficiency of the
generating plant and the type of fuel displaced.
Table 5.1 shows data for five EU states, drawn from
the studies cited in reference [3]. The reports quoted
emission savings for a 5% (energy) penetration
level. The displaced fuel was generally coal,
although in Ireland and Germany a mixture of fuels
was saved. Levels of sulphur dioxide savings, also
shown, depend on whether or not flue gas desulphu-
risation equipment is fitted. Columns 6-9 are
specific estimates for several fuels [4]; although the
study was carried out in the UK, levels elsewhere
are very similar. Using wind energy also saves
waste ash, typically around 34g/kWh of electricity
generated[5].
5.2 Energy Credit
Fuel savings are the major economic benefit from
wind energy plant. The savings result from the
reduced need to run other generating plant. This, in
turn, results in lower fuel and related variable costs,
including maintenance and staff costs. In the
European Union, wind energy will usually replace
coal plant, (except in Sweden and Finland - where
hydro may be displaced and France - where nuclear
may be displaced) as this is the plant which is used
for load following.
Calculation methods for the energy cost savings
arising from the introduction of wind energy on a
network vary. There are three factors to be taken
into account:
• Fuel savings
• Operation and maintenance cost savings
• Penalties arising from the enforced
operation of additional thermal
plant at part load
As coal and gas prices are now reasonably uniform
across the European Union, it is possible to estima-
te reference prices for these fuels. These are
summarised in the table 5.2. These values do not, of
course, apply when the Hydro or nuclear plant are
replaced by wind energy. Values in these cases tend
to be specific to the particular location.
The variable component of operation and mainten-
ance costs for coal plant is around m 0.003/kW.
Additional savings from the installation of wind
energy plant may accrue due to reductions in the
energy losses in transmission and distribution
systems. As these losses may account for around
10% of the overall energy in an electricity network,
their value may be significant. Levels are site-
specific and in some instances, when the addition of
the wind plant adds to system losses, the value will
be negative.
W
ind
Turbine
Grid
Connection
&
Interaction
22
Table 5.1: Emissions saved by wind energy, in g/k Wh
of electricity generated
Column
1
2
3
4
5
6
7
8
9
States
DE
GB
IR
NL
P
Fuels
Coal
Coal
Oil
CCGT
+
FGD
Carbon dioxide
642
870
690 1,440 983
935
973
741
421
Nitrogen oxides
0.5
2.4
2.1
1.22
3
4.5
2.8
1.9
0.007
Sulphur dioxide
0.5
1.2
4.5
0.5
0.2
nq
nq
nq
nq
Carbon monoxide
nq
nq
nq
nq
nq
0.13
0.13
0.14
0.41
nq= not quoted
Table 5.2: Reference values of energy credits
Fuel
Price,
Thermal
Energy credit,
s/GJ
efficiency
s/kWh
Coal
2
35 %
0.0205
Gas
3.3
55 %
0.0215
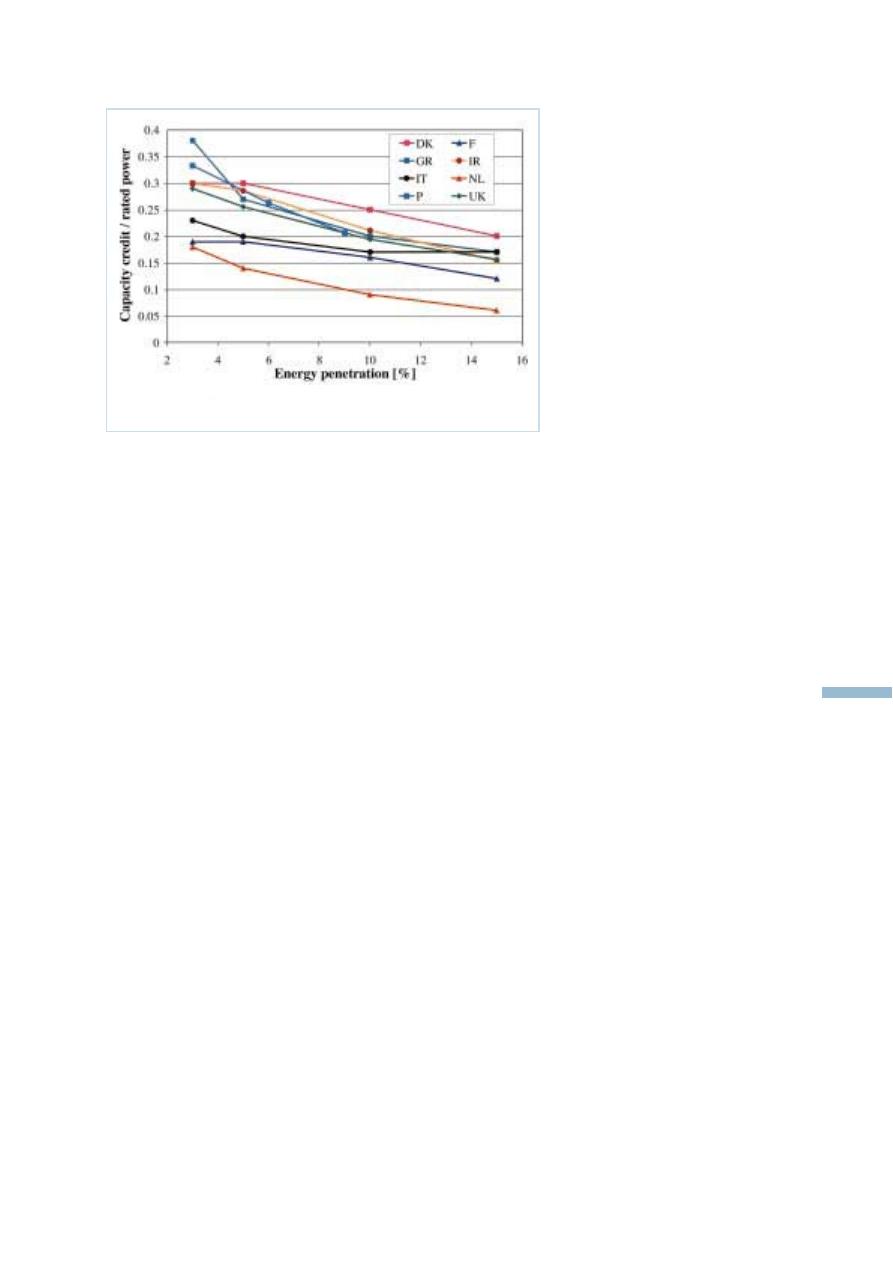
The operational penalties arising from the installati-
on of wind energy on an electricity network are
extremely small until the amount of wind energy
rises to around 10% of the total. One study [6]
suggested that this level of penetration would incur
a penalty around n 0.0016/kWh, but recent data
suggests that the variations in wind output may be
less than expected and so this estimate may be
pessimistic.
5.3 Capacity Credit
There is no universally-agreed definition of capaci-
ty credit but the following would be generally
acceptable [7]: „The amount of conventional
generating capacity which can be omitted from a
utility’s planned requirements if a wind power plant
is planned“.
A utility’s need for capacity is dictated by the
magnitude of the peak demands on its system. A key
issue, therefore, is the ability of wind plant to
contribute to this demand. As wind power is
intermittent, it is sometimes argued that it has no
capacity credit. However, conventional thermal
plant is not 100% reliable and power system
operations depend on assessments of risk. No
system is risk-free, and plant needs are framed to
keep the risks within defined limits. Risk is a
statistical concept, which relies on time-averaged
estimates of plant output, so the average expectation
of a 1000 MW nuclear plant being ready to provide
full output at peak times is, say, 90%. Similarly the
average expectation of wind plant being able to
provide full output is, say, 30%, to first order.
A simple mathematical analysis can be used to
prove this point and show that the contribution of
any item of power plant to firm
capacity is equal to the average
power it can generate [8].
Several studies have addressed the
issue in more detail and their
conclusions are succinctly sum-
marised in one of the utility
studies [9]: „At low (energy)
penetration the firm power that
can be assigned to wind energy
will vary in direct proportion with
the expected output at time of
system risk“. In practice, this
statement is true for any energy
source whether it is renewable or
not. It may be noted at this point
that „firm power“ is not the same
as „capacity credit“; capacity
credits are usually related to the conventional plant
that is displaced by wind. 100 MW of wind might
have a ”firm power” equivalent of 30 MW, say (its
load factor), but the capacity credit would be 33.3
MW, assuming the winter peak availability of
thermal plant was 90%.
In northern Europe, where peak demands on most
electricity systems occur around 1800 hours during
the winter months[10], the output, and hence the
capacity credit, of wind plant in Europe is generally
around 10-25 % higher than the average power, as
wind strengths are higher in winter [11].
As the amount of wind in a system rises, its
intermittent nature does mean that the capacity
credit declines. Figure 5.1 shows data from 9
studies carried out by EU states, showing how the
credit changes up to energy penetrations of around
15%. The exact levels differ, as they depend on
wind speeds and the characteristics of the utility
systems.
W
ind
Tu
rbine
Grid
Connection
&
Interaction
23
Figure 5.1: Capacity Credits–EU
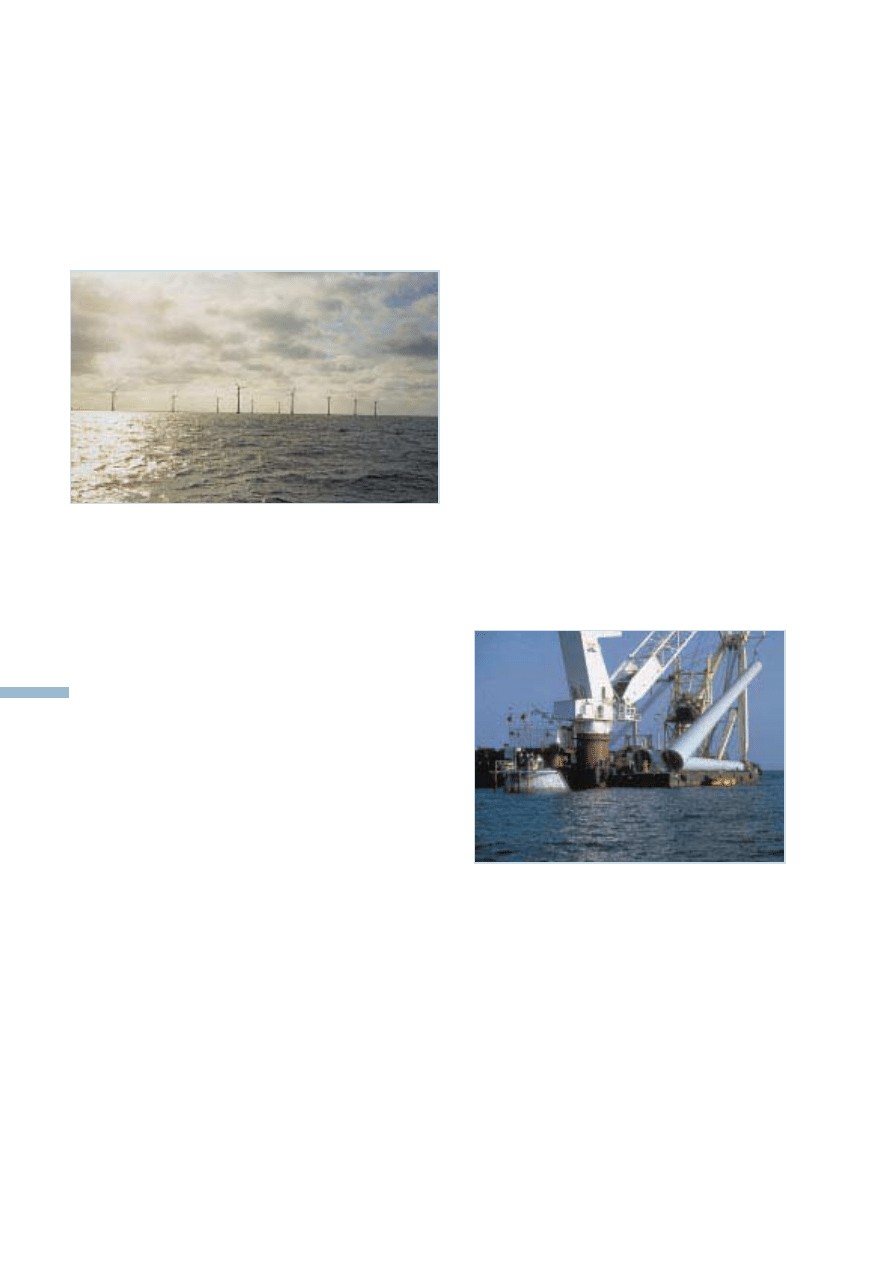
6 Case Studies
6.1 Tunø Knob Wind farm, DK
Tunø Knob is the second of two off-shore wind
farms built by the Danish utilities as part of the
agreement between the Danish Government and the
utilities to build and operate wind farms as part of
the country’s electricity supply system. The farm
consists of 10 pitch controlled 500 kW WT of type
V39 made by Vestas Wind Systems A/S. The
turbines have induction generators with a slip of
1.8 %. Builder and owner of the wind farm is I/S
Midtkraft – one of the 6 local production companies
making up the utility group ELSAM. The wind farm
was put into operation in early October 1995. The
operating experience up to now has been good
showing monthly availabilities of above 95%
except for short periods where the turbines have
been stopped in connection with birdlife studies on
the site and exchange of one of the transformers (see
below). The production in each of the three full
years (1996- 1998) of operation until now has been
12.623, 13.021 and 15.126GWh respectively. The
original estimated average wind speed was 7.5 m/s
at hub height (43 m above average water level
including foundation) but the achieved production
figures (corrected for the missing production during
stops as outlined above) indicate a wind energy
resource about 20 % above the original estimate.
Tunø Knob wind farm is situated in the shallow
water between the east coast of Jutland and the
small island of Tunø and just north of the reef Tunø
Knob. The water depth varies between 3.1 and 4.7
m. The distance to Jutland is about 6 km and there
are 3 km to the island Tunø. The roughness class is
consequently very close to 0.
The ten turbines are placed in two rows facing
north-south and with 400 m between the rows and
200 m between the turbines. Each WTGS is
equipped with a dry-type cast resin insulated
transformer stepping the voltage up from 0.7 kV
(the generator voltage) to 10 kV. The transformers
have a rated power of 510 kVA, no-load losses of
1.445 kW, total load losses of 5.6 kW and are placed
in the bottoms of the towers. The turbines are
connected in a ring by a 3 x 150 mm
2
Cu-PEX
submarine cable with sea armour. The wind farm is
connected to the nearest 60/10 kV transformer
station by a combined sea and landcable. The
landcable is a 3 x 240 mm
2
Al-PEX with an approxi-
mate length of 2.5 km. The cable is, together with
radials to other consumers, connected to the 10 kV
bus of the station through a circuit breaker. The
short circuit power level of the 10 kV busbar is 55
MVA corresponding to a short circuit ratio of
approximately 11. All submarine cables are washed
1 m down into the bottom to prevent damage from
anchoring ships.
The total cost of the project was 10.4 Mf, about
11 % below the budget. The total cost of electrical
works were 2.6 Mf excluding transformers and
ring main units which were supplied together with
the WT. The costs of grid connection, i.e. the cable
connecting the wind farm to the on-shore station and
circuit breaker, was approximately 1.8 Mf.
There have not been reported any problems with the
power quality in the point of common coupling to
other consumers (the 10 kV busbar in the 60/10 kV
transformer station). In September 1998 one of the
transformers in the WTGS developed a fault and
had to be replaced. The lead time for the delivery of
the replacement was 2.5 month and the turbine was
back in operation in December the same year.
6.2 Rejsby Hede Wind Farm, DK
Rejsby Hede wind farm in the extreme south-
western corner of Denmark is the largest wind farm
W
ind
Turbine
Grid
Connection
&
Interaction
24
Figure 6.1: Tunø Knob offshore wind farm
Figure 6.2: Tunø Knob offshore wind farm
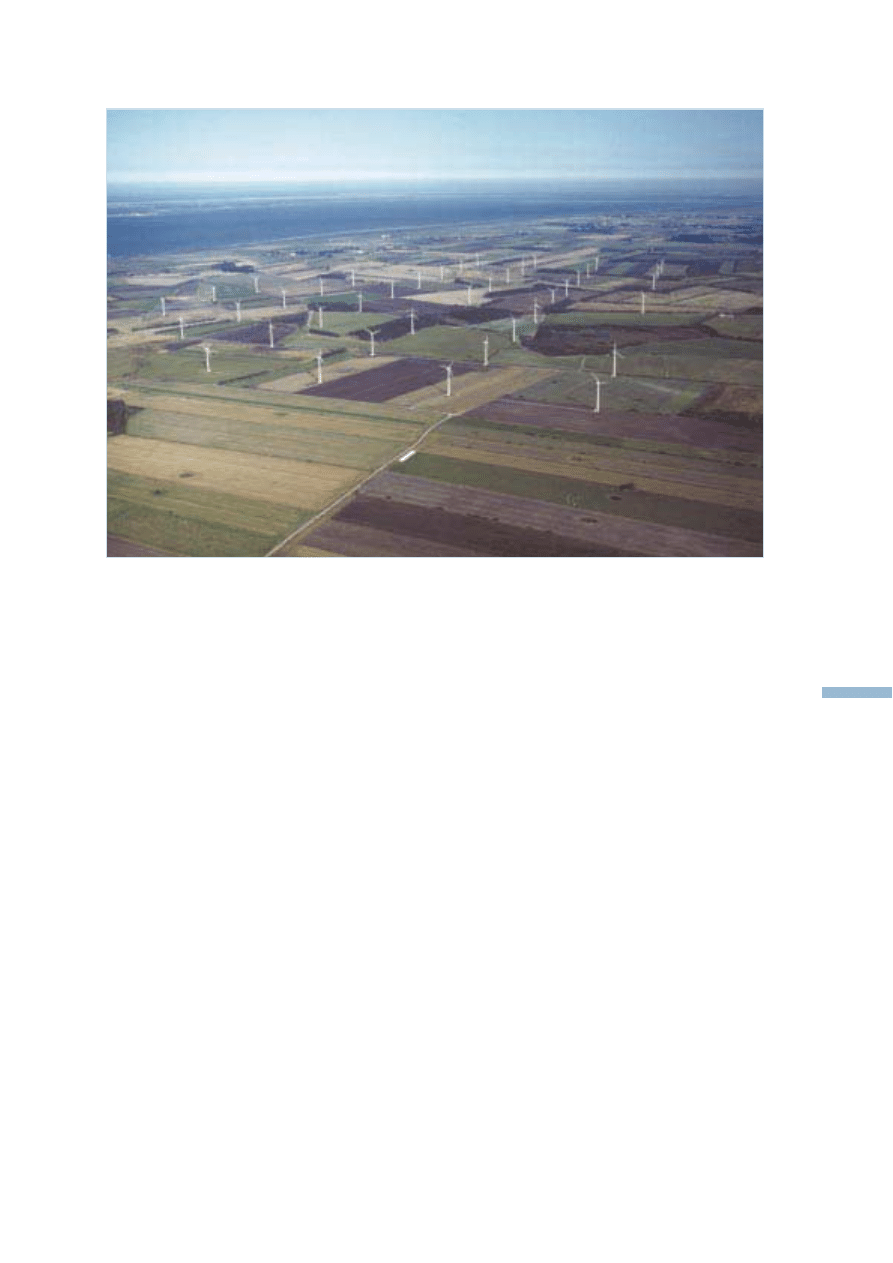
built in Denmark as one project. The wind farm
consists of forty Micon M1500 - 600/150 kW
turbines with a total installed capacity of 24 MW.
The turbines have induction generators with a
nominal speed of 1500 RPM and 0.4 % slip. The
wind farm is build as part of the agreement between
the Danish Government and the utilities to build and
operate wind farms as part of the country’s electri-
city supply system. Builder and owner of the wind
farm is Sønderjyllands Højspændingsværk An/S –
one of the 6 local production companies making up
the utility group ELSAM. The wind farm was put
into operation on August 1, 1995 and operating
experience has been good showing annual availabi-
lities in the above 97% range. The production in
each of the three full years (1996-1998) of operati-
on until now has been 48.7, 52.3 and 61.7GWh
respectively.
Rejsby Hede wind farm is, as already mentioned,
situated in Jutland, in the most south-westerly
corner of Denmark 1.5 to 3 km from the coastline
behind the dike facing the wadden-sea just south-
east of the village Rejsby. The surrounding terrain is
flat pastoral with hedges and fields. The average
wind speed is calculated to 6.1 m/s. The turbines are
placed in 9 rows facing east-west with from 4 to 6
turbines in each row and with 260 m between WT
and rows. In the north-south direction there is a
small shift between the WT.
The wind farm is connected to a 60 kV overhead
line passing immediately beside the site through a
3-winding 60/15 kV transformer in order to keep the
short circuit power level down on each of the 15 kV
busses. The transformer has a rating of 31.5 MVA
(2 x 15.75 MVA) and a nominal e
sc
of 10 %. The
load losses are 73 kW per winding and the no load
losses are 16.5 kW. The short circuit power level on
each of the 15 kV busses are 120 MVA. There are 2
respectively 3 outgoing radials from the two 15kV
busbars with a total of 18 and 22 WT respectively.
The cables are connected through circuit breakers to
the busses. From the station each of the 5 radials
expands into a tree structure in order to reduce the
number of ring main units and thus reduce the costs.
Cabling between the turbines and between the
turbines and the station is done with different cross-
section underground Al-PEX cables. Four different
types with cross-sections from 25 to 150 mm
2
are
used depending on the loading. The lengths of the
cables vary from 273 to 924 m and the total amount
of cables used is:
150 mm
2
Al-PEX.
5126 m
95 mm
2
Al-PEX.
4252 m
50 mm
2
Al-PEX.
6478 m
25 mm
2
Al-PEX.
2939 m
The generator voltage of the WT are 0.7 kV and
there is a step-up transformer to 15 kV placed
W
ind
Tu
rbine
Grid
Connection
&
Interaction
25
Figure 6.3: Wind farm Rejsby Hede

immediately beside each turbine. The transformers
are oil-filled distribution transformers with a rated
power of 800 kVA, nominal e
sc
= 6 %, no-load losses
1.09 kW and total load losses of 8.19 kW.
The total cost of electrical works in the wind farm
and the transformer station amounts to 2.2 Mj. The
cost of grid connection was and reinforcement were
zero as the 60 kV line passes directly by. The cost of
the 60/15 kV station was 0.88 Mj and the
remaining electrical works in the wind farm i.e. 15
kV cables, transformers and 0.7 kV cables 1.3 Mj.
There have not been reported any problems with the
power quality in the point of common coupling with
other consumers, i.e. the 60 kV terminals of the
60/165 kV substation, and there have not been any
problems associated with electrical components or
issues.
The needs and ways of compensating the reactive
power demand of induction generators and the
reactive loads they supply with active power have
been discussed at length during the last 20 years.
Modern power electronics provides the means for
continuous and fast adjustment of the reactive
compensation level and at the same time contribute
to improve the power quality of the wind farm.
Although no problems were reported or expected,
Rejsby Hede Wind farm was found to be a suitable
place to test this new technology and a 2 x 4 Mvar
Static Var Compensator (SVC) was installed as part
of the R&D efforts directed towards developing this
new technology for practical use in power systems.
The project was supported by the European Commis-
sion within the ”Joule-Thermie” Programme.
6.3 Delabole wind farm, UK
The first wind farm built in the UK was completed
in December 1991 and comprises 10 400 kW WT.
The turbines are of the constant speed type with
induction generators. As the wind farm was the first
in the UK it has been extensively monitored and
detailed insights into the wind characteristics,
machine performance and electrical aspects have
been obtained.
The machines generate at 690 volts and step-up
transformers are positioned at the base of each WT
to raise the voltage to 11 kV, which is used for inter-
connections within the farm.
The wind farm output is brought together at a
central sub station, where an 11/33 kV transformer
raises the voltage for connection into the local
distribution network.
Shortly after the wind farm was commissioned
measurements were carried out to establish the
effect of the wind farm on the local distribution
network. In addition it was necessary to determine
whether faults on the local distribution network
would affect the wind farm. It was not certain, for
example, whether or not switching operations and
trips would cause the WT generators to trip.
Current surges when the WT are first connected are
limited by „soft-start“ thyristor equipment. This is
common practice and limits the current at starting to
the level corresponding to maximum output. During
the test programme the voltage dip on the network
was measured at start-up and it was found that the
most severe dip occurred when the first turbine was
started. The voltage dip increased as the fault level
was reduced. The recommended limit of a 1% dip
was exceeded when the fault level fell below
40 MVA, 100 times the power rating of an indivi-
dual WT.
Measurements of current fluctuations during erratic
wind conditions to showed that large step changes
in output did not occur and even under severe
gusting conditions the wind farm took two to three
minutes to reach maximum output. Conversely,
when the local circuit breaker was tripped and
produced an 8 % voltage dip, the wind farm
continued to operate.
As the wind farm is situated in a lightly populated
rural area, there were times when it’s output
provided the entire local load supplied by an 11 kV
sub station. Surplus power flowed „backwards“ into
the 33 kV system and no voltage problems were
experienced.
Minor problems encountered included measurable
voltage fluctuations at blade passing frequency and
some generation of harmonics but neither was
detectable by consumers in the area.
W
ind
Turbine
Grid
Connection
&
Interaction
26
Figure 6.4: Delabole wind farm, UK
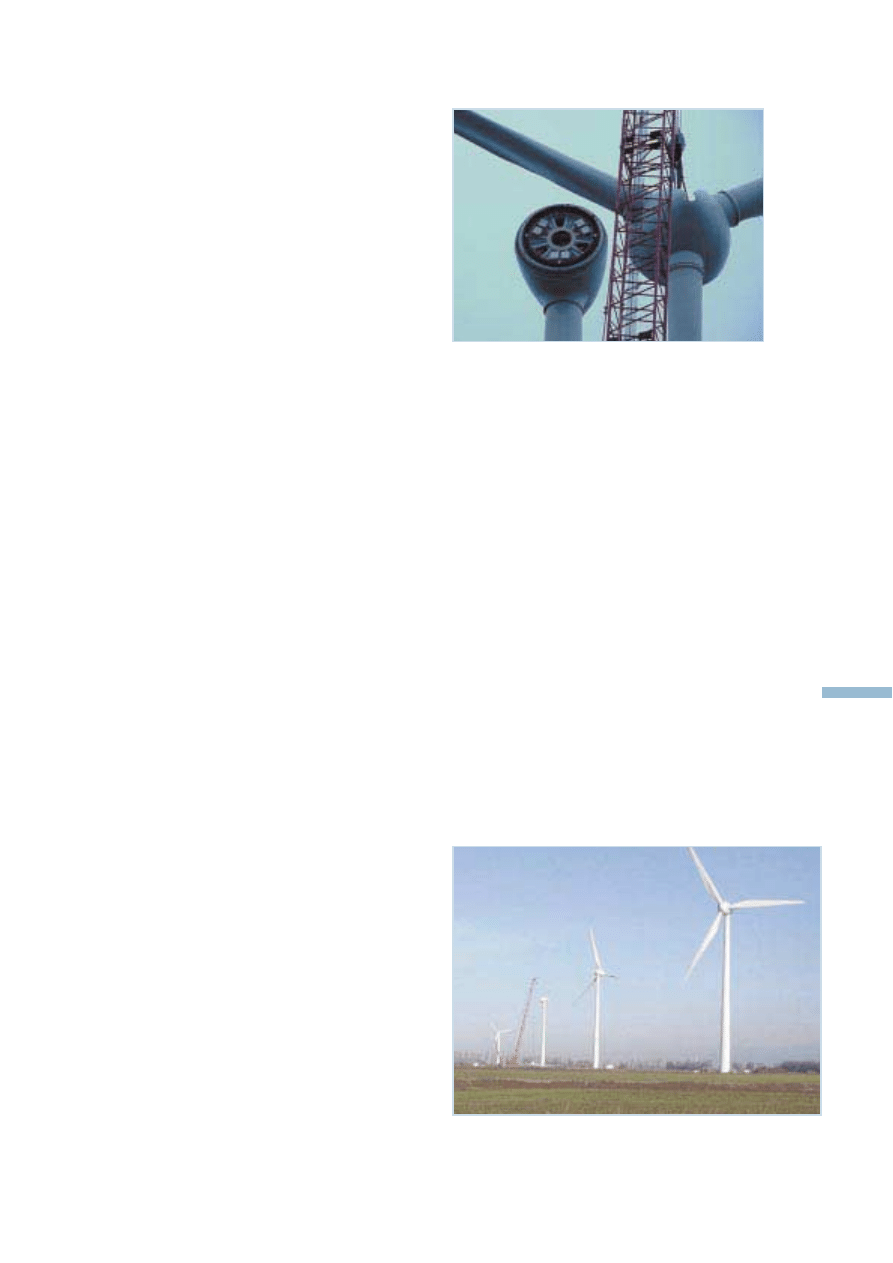
6.4 Cold Northcott Wind Farm, UK
The Cold Northcott Wind farm in Cornwall, UK,
originally comprised 21 300 kW WT, generating at
415 volts and connected to individual generation
step-up transformers.
The possibility of employing either underground
interconnections or pole mounted overhead lines
was examined. Important factors which influenced
the choice were environmental factors and cost.
The site was expected to offer a harsh environment
to overhead lines in terms of wind loading, ice
loading and lightning. These do not pose problems
in the case of underground cables. In any case, it
would be necessary to use short runs of cable close
to the turbines to clear the turbine blades. On the
other hand, cable trenching for about 18 inches in
depth was not be seen as a problem with an automa-
tic trench cutter. Cabling was seen as providing an
aesthetic arrangement, with more appeal to the
public.
Rough estimates showed that the underground
cables would cost some 7 ECU (1988 levels) per
metre extra compared with overhead line costs.
With an estimated route length of 10km, the additio-
nal cost of cabling would therefore be in the order
of 70,000 ECU, small compared with the overall
cost. Furthermore this would be offset by the
possible difference in line repair costs over a 30-
year period.
Two alternative transformer configurations were
assessed:
• 500 kVA, the nominal reactance
between windings was 4.75 percent,
which results in a relatively
low voltage drop for 326kVA
loading of about 3.0 percent.
• 315 kVA rating, with an
interwinding voltage drop
of 4.9 percent.
The price difference per transformer was in the
order of 1400 ECU per transformer or 30,800 ECU
for the 22 machines.
An assessment was made of the energy losses
associated with the annual operating characteristics
expected for the Cold Northcott site. The results
were:
- 6,297 kWh for the 500kVA transformer
- 12,72 kWh for the 315kVA transformer
This gave a difference of 6423kWh, which is
additional energy lost by the small transformer each
year. Based on the energy revenue of 11pence per
kWh, the loss amounts to 9600 ECU over a 10-year
period. The wind farm would contain 22 transfor-
mers and hence would lose 240,000 ECU per
annum over a 10-year period. Based on a net return
of 8 percent per annum, this would capitalise to a
value of 520,000 ECU over the period. Based on the
assumed operating conditions, the 500kVA unit was
judged to be the best choice technically and
economically. Although wind energy prices have
fallen substantially since the time the appraisal was
made, the use of the larger transformer would still
be the most economic option
6.5 Wybelsumer Polder, D
The wind farm Wybelsumer Polder is located in the
north-west part of Germany near to the shore, where
the region is very flat. The wind farm consists of 41
WT of E66 manufactured by Enercon, Germany.
The rated power of each turbine is 1.5 MW, that
means an installed power of the wind farm of 61.5
W
ind
Tu
rbine
Grid
Connection
&
Interaction
27
Figure 6.6: Installation of a wind turbine at
Wybelsumer Polder
Figure 6.5: Part of the wind farm Wybelsumer Polder
(Photo
by
Helge
Pommer,
IfE
Ingenieurges.
für
Energieprojekte
mbH
&
Co.
KG)
(Photo
by
Helge
Pommer,
IfE
Ingenieurges.
für
Energieprojekte
mbH
&
Co.
KG)
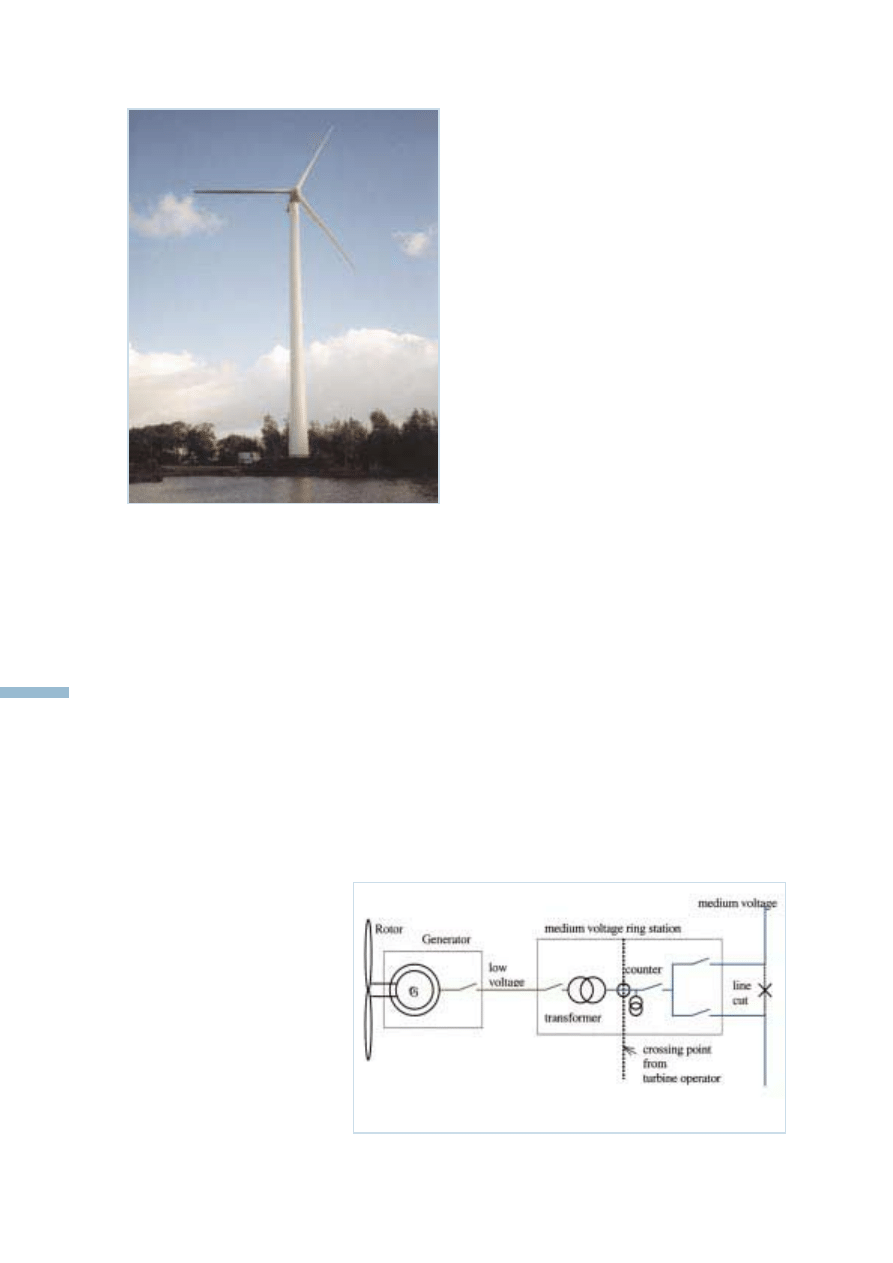
MW. The hub heights of the wind turbines are 68 m.
From June 1997 until end of 1999 7 WT were
erected. In 2000 27 WT will be installed. The rest,
7 WT, will be installed in 2001.
With the annual wind speed of 8.0 m/s at hub height
the energy production of the first WT, installed in
1997, was 4.500MWh per year and per WT.
The wind farm is split into two parts. One part,
consisting of 16 WT belongs to the local utility.
These WT are connected to an existing substation
from 20 kV to 110 kV. Within the wind farm the WT
are connected by a ringed network by cables of
Al 240 mm
2
.
The second part of the wind farm consists of 25
turbines. Owner is a consortium of private people.
For the grid connection of these WT a separate
substation (20 kV to 110 kV) was
installed. Within this part of the
wind farm the turbines are
connected by a radial network,
where cables of Al 150 mm
2
and
Al 240 mm
2
were used. The total
length of the cabling is 28 km. The
costs for the grid connection of
this second part of the wind farm
can be split into costs of the
substation (2.3 Mill.f), costs of
the cabling within the wind farm
(0.28 Mill.f) and costs for the rein-
forcement of the grid (4.6 Mill.f).
A separate 110 kV line of some km length will be
installed to connect the wind farm to the high
voltage system. This line will also take in the energy
production of additional smaller wind farms in the
region Krummhörn, a region with a higher than-
average penetration of wind power.
6.6 Belvedere, D
Belvedere is a single WT project located in the
north-west of Germany. It is a typical project for
wind energy utilisation in single units in Northern
Germany. The turbine is located directly at a
agricultural farm, the main cultivation is for dairy
farming and growing of cereals. In the beginning of
wind energy development in Germany this type of
utilisation was the most important one; mainly
farmers started to develop a new, additional
economic basis by operating a single WT on their
farm. Generally the additional income improved the
situation for the involved farmers reasonably. With
the growing wind energy development in Germany,
stimulated by a new building law, the single turbine
installation scheme was replaced by the develop-
ment of wind farms. Nowadays areas for wind
energy utilisation are legally established in many
German communities, so that today prevailingly
wind farms are installed instead of single units.
The WT at the Belvedere site is a Vestas V42 with
600kW rated power, 42m rotor diameter and a hub
height of 53m. The turbine was installed in October
1995 and is operating since with good technical
availability. The average annual energy production
amounts to 1.400MWh/a.
The turbine generates power at a voltage level of
690V, which is transformed to 20MV. The transfor-
mer is located in a separate building together with
the medium voltage switch gear and the utility
energy counters. The distance between transfor-
mer and turbine is about 30m. The transformer
W
ind
Turbine
Grid
Connection
&
Interaction
28
Figure 6.7: Grid connection sheme of the single wind turbine
Figure 6.8: Single WT at Belvedere, Germany

is connected to the medium voltage line by a cable
of approximately 10km length. All low and medium
voltage cables are laid underground according to the
standard of the local utility. The costs for grid
connection cost were extremely high; due to the
large number of installed WT the grid reinforced to
be paid to the utility amounted to approximately
150 h/kW. The total cost for grid reinforcement and
grid connection amounted to nearly 20 % of the
total investment costs, including transformer and
switch gear the amount was nearly 28 %.
7 Glossary
Distribution network, distribution grid:
used to connect consumers to the
transmission network.
Electrical network:
particular installations, lines and cables
for the transmission and distribution
of electricity.
Flicker:
voltage fluctuations cause changes of the
luminance of lamps which can create the
visual phenomenon called flicker.
Induction generator
(asynchronous generator):
used to convert mechanical power to
electric power.
Inverter system:
in this context the inverter system
converts alternating current into alternating
current, but at different frequency.
Point of common coupling (PPC):
the point on an electrical network,
electrically nearest to a particular
installation, and at which other installations
are, or may be, connected. An installation
may in this context supply or consume
electricity.
8 References
[1] German guideline: Technische Richtlinien
für Windenergieanlagen, Teil 3: Bestimmung
der Elektrischen Eigenschaften, Rev.13.
01.01.2000. Fördergesellschaft Windenergie
e.V. FGW, Hamburg.
[2] IEC 61400-21 CDV:
Wind Turbines
Part 21: Measurement and
assessment of power quality
characteristics of grid connected
wind turbines.
[3] Commission of the European
Communities, DG XII.
Wind Energy Penetration Studies.
National studies published 1988-90.
[4] Eyre, NJ and Michaelis, LA, 1991.
The impact of UK electricity gas and oil
use on global warming.
ETSU, Harwell, Oxfordshire
[5] Jhirad, D and Mintzer, I M,
1992 Electricity: Technological
Opportunities and Management
Challenges to Achieving a
Low-EmissionsFuture.
In: Confronting Climate Change.
Cambridge University Press.
[6] Milborrow, D J, 1994. Wind Energy
Economics. Proceedings of the
16
th
British Wind Energy
Association Conference,
Mechanical Engineering
Publications Ltd, London
[7] General Electric Company, 1979.
Requirements assessment of
wind power plants in electric utility
systems. EPRI report ER-978—SY
[8] Swift-Hook, DT, 1987 Firm power
from the wind. British Wind Energy
Association, 9
th
Conference, Edinburgh.
MEP Ltd, London
[9] Holt, JS, Milborrow, DJ and Thorpe,
A, 1990. Assessment of the
impact of wind energy on the
CEGB system.
Report for the European Commission.
[10] Union for the Co-ordination of
Production and Transmission of
Electricity (UCPTE),
1995. Annual report, Paris
[11] Milborrow, DJ, 1996. Capacity
credits - clarifying the issues.
Proc 1996 BWEA conference.
MEP Ltd, London
W
ind
Tu
rbine
Grid
Connection
&
Interaction
29

OPET NETWORK:
ORGANISATIONS FOR THE PROMOTION OF ENERGY TECHNOLOGIES
The network of Organisations for the Promotion of Energy Technologies (OPET), supported by the European Commission, helps to
disseminate new, clean and efficient energy technology solutions emerging from the research, development and demonstration activi-
ties of ENERGIE and its predecessor programmes. The activities of OPET Members across all member states, and of OPET Associa-
tes covering key world regions, include conferences, seminars, workshops, exhibitions, publications and other information and promotio-
nal actions aimed at stimulating the transfer and exploitation of improved energy technologies.
1 ARCTIC VENET
Umestan Företagspark, Hus 201
SW-903 47 Umeaa
Contact: Ms. France Goulet
Telephone: +46-90 718162 or 60
Facsimile: +46-90 718161
E-mail: france.goulet@venet. se
Merinova
Oy Merinova Ab Technology Center
Elbacken 4A, FIN-81065101,
Vaasa, Finland
Contact: Johan Wasberg
Telephone: +358-6 2828261
Facsimile: +358-6 2828299
E-mail:
Johan.wasberg@merinova.fi
Sintef
Sintef Energy Research
Sem Saelands vei 11
7034 Trondheim, Norway
Contact: Jens Hetland
Telephone: +47-73 597764
Facsimile: +47-73 592889
E-mail:
Jens.Hetland@Energy.Sintef.no
2 IRELAND
Irish Energy Centre
Glasnevin
Dublin 9, Ireland
Contact: Rita Ward
Telephone: +353-1 8369080
Facsimile: +353 1 8372848
E-mail: wardr@irish-energy.ie
3 PORTUGAL
CCE
Estrada de Alfragide, Praceta 1
PO-2720-537 Amadora
Contact: Luis Silva
Telephone: +351-21 4722818/00
Facsimile: +351-21 4722898
E-mail: lsilva@cce.pt
Instituto Superior Técnico
Av. Rovisco Pais
PO-1049-001 Lisboa
Contact: Maria da Graça Carvalho
Telephone: +351-21 8417372
Facsimile: +351-21 8475545
E-mail: maria@navier.ist.uti.pt
INESC-Porto
Largo Mompilher, 22
PO-4050-392 Porto
Contact: Vladimiro Miranda
Telephone: +351-22 2094234
Facsimile: +351-22 2084172
E-mail: vmiranda@inescn.pt
4 SCOTLAND
NIFES Ltd
8 Woodside Terrace
UK-G3 7UY Glasgow
Contact: Andrew Hannah
Telephone: +44 141 3322453
Facsimile: +44 141 3330402
E-mail: glasgow@nifes.co.uk
hannah@nifes.co.uk
Scottish Energy Efficiency Office
UK-G2 6AT Glasgow
Contact: Allan Mackie
Telephone: +44 141 2425842
Facsimile: +44 141 2425691
Email:Allan.Mackie@scotland.gov.uk
5 ENEA-ISNOVA
ISNOVA s.c.r.l.
Via Flaminia, 441 · IT-00196 Rome
Contact: Wen Guo
Telephone: +39-06 30484059
Facsimile: +39-06 30484447
E-mail: enea_opet@casaccia.enea.it
ENEA
Via Anguillarese 301
S. Maria di Galeria · IT-2400 Roma
Contact: Francesco Ciampa
Telephone: +39-06 30484118
Facsimile: +39-06 30484447
E-mail: enea_opet@casaccia.enea.it
6 ROMANIA
ENERO
Enegeticienilor 8
74568 Bucharest, Romania
Contact: Alexandru Florescu
Telephone: +40-1 322 0917
Facsimile: +40-1 322 27 90
E-mail: femopet@icemenerg.vsat.ro
7 CRONOS
FAST
Piazzale Rodolfo Morandi 2
IT-20121 Milano
Contact: Paola Gabaldi
Telephone: +39-02 76015672
Facsimile: +39-02 782485
E-mail: gabaldi@fast.mi.it
ICAEN
Av. Diagonal 453 bis, Atic
E-08036 Barcelona
Contact: Joan Josep Escobar
Telephone: +34 93 6220500
Facsimile: +34 93 6220501
E-mail: edificis@icaen.es
Multisassari
StradaProvinciale La Crucca 5
IT-7100 Sassari
Contact: Antonio Giovanni Rassu
Telephone: +39-079 3026031
Facsimile: +39-079 3026212
E-mail: energyss@tin.it
ADEME-Corse
Rue St. Claire 8
FR-20182 Ajaccio
Contact: Toussaint Folacci
Telephone: +33-49 5517700
Facsimile: +33-49 5512623
8 SLOVAKIA
Energy Centre Bratislava
Bajkalsk· 27 827 99 Bratislava 27 -Slovakia
Contact : Vladimir Hecl
Telephone: +421-7 58248472
Facsimile: +421-7 58248470
E-mail: ecbratislava@ibm.net
9 SEED
ASTER
Via Morgagni, 4 · IT-40122 Bologna
Contact: Elisabetta Toschi
Telephone: +39-05 1236242
Facsimile: +39-05 1227803
E-mail: opet@aster.it
CESEN Spa
Piazza della Vittoria 11A/8, IT-16121 Genova
Contact: Salvatore Campana
Telephone: +39-010 5769037
Facsimile: +39-010 541054
E-mail: cesen@cesen.it
CESVIT
Via G. del Pian dei Carpini, IT-50127 Firenze
Contact: Lorenzo Frattali
Telephone: +39-055 4294239
Facsimile: +39-055 4294220
E-mail: frattali@cesvit.it
10 NETHERLANDS
NOVEM
Swentiboldstraat 21, NL-6130 AA Sittard
Contact: Theo Haanen
Telephone: +31-46 4202304
Facsimile: +31-46 4528260
E-mail: t.haanen@novem.nl
11 EUZKADI-CYMRU
EVE
San Vicente, 8 Edificio Albia I-P 14,
E-48001 Bilbao
Contact: Juan Reig Giner
Telephone: +34-94 4355600
Facsimile: +34-94 4249733
E-mail: jreig@eve.es
DULAS
Unit1 Dyfi Eco Parc
UK-SY20 8AX Machynlleth
Contact: Janet Sanders
Telephone: +44-1654 795014
Facsimile: +44-1654 703000
E-mail: jsanders@gn.apc.org
12 DOPET
Danish Technological Institute
Gregersensvej, DK-2630 Taastrup
Contact: Nils Daugaard
Telephone: +45-43 504350
Facsimile: +45-43 507222
E-mail: nils.daugaard@teknologisk.dk
13 GERMANY
Forschungszentrum Jülich GmbH
DE-52425 Jülich
Contact: Gillian Glaze
Telephone: +49-2461 615928
Facsimile: +49-2461 612880
E-mail: g.glaze@fz-juelich.de
14 SPAIN
IDAE
Paseo de la Castellana 95
E-28046 Madrid
Contact: Virginia Vivanco Cohn
Telephone: +34-91 4565024
Facsimile: +34-91 5551389
E-mail: VVivanco@idae.es
15 BALKAN
Sofia Energy Centre
51, James Boucher Blvd.
1407 Sofia, Bulgaria
Contact: Violetta Groseva
Telephone: +359-2 683541 9625158
Facsimile: +359-2 681461
E-mail: vgroseva@enpro.bg
ISPE
P.O. 30-33
Lacul Tei Blvd. 1
72301 Bucharest, Romania
Contact: Anca Popescu
Telephone: +40-1 2103481
Facsimile: +40-1 2103481
E-mail: Dirsis@ispe.ro
EXERGIA
64, Louise Riencourt Str.
GR-11523 Athens
Contact: George Georgocostas
Telephone: +30-1 6996185
Facsimile: +30-1 6996186
E-mail: Office@exergia.gr
16 RES POLAND
EC BREC
Rakowiecka 32
02-532 Warsaw, Poland
Contact: Krzysztof Gierulski
Telephone: +48-58 3016636
Facsimile: +48-58 3015788
E-mail: ecbrec@me-tech.gda.pl
17 SWEDEN
STEM - Swedish National Energy
Administration
631 04 Eskilstuna, Sweden
Contact: Sonja Ewerstein
Telephone: +46-8 54520338
Facsimile: +46-16 5442270
E-mail: Sonja.ewerstein@stem.se
18 CZECH REPUBLIC
Technology Centre of the Academy of Sciences
Rozvojova 135
16502 Prague, Czech Republic
Contact: Karel Klusacek
Telephone : +420-2 20390213
Facsimile: +420-2 33321607
E-mail: klusacek@tc.cas.cz
EGU Praha Eng.Ltd
Podnikatelska, 1
19011 Prague, Czech Republic
Contact: Jaromir Beran
Telephone: +420-2 67193436
Facsimile: +420-2 6441268
E-mail: beran@egu-prg.cz
DEA
Benesova 425
66442 Prague, Czech Republic
Contact: Hana Kuklinkova
Telephone: +420-2452 22602
Facsimile: +420-2452 22684
E-mail: deabox a sky.cz
19 BLACK SEA
Black Sea Regional Energy Centre
Triaditza 8
1040 Sofia, Bulgaria
Contact : Ekateriana Kanatova
Telephone: +359-2 9806854
Facsimile: +359-2 9806854
E-mail: ecsynkk@bsrec.bg
20 CROSS-BORDER - BAVARIA AUSTRIA
ZREU
Wieshuberstrafle 3
DE-93059 Regensburg
Contact: Toni Lautenschläger
Telephone: +49-941 464190
Facsimile: +49-941 4641910
E-mail: lautenschlaeger@zreu.de
ESV - O.Ö. Energiesparverband
Landstrasse 45, AT-4020 Linz
Contact: Christiane Egger
Telephone: +43-732 65844380
Facsimile: +43-732 65844383
E-mail: office@esv.or.at
KK Österreichische Kommunalkredit AG
Türkenstrasse 9
AT-1092 Vienna
Contact: Kathrin Kienel-Mayer
Telephone: +43-1 31631440
Facsimile: +43-1 31631105
E-mail: k.mayer@kommunalkredit.at
LEV-Landesenergieverein Steiermark
Burggasse 9
AT-8010 Graz, Austria
Contact: Gerhard Ulz
Telephone: +43-316 8773389
Facsimile: +43-316 8773391
E-mail: office@lev.at
21 SOLID FUELS
CIEMAT
Avd. Complutense 22
E-28 040 Madrid
Contact: Fernando Alegria
Telephone: +34-91 3466343
Facsimile: +34-91 3466455
E-mail: f.alegria@ciemat.es
The Combustion Engineering
Association
1a Clarke Street
UK-CF5 5AL Cardiff
Contact: David Arnold
Telephone: +44-29 20400670
Facsimile: +44-29 20400672
E-mail:info@cea.org.uk
CSFTA
Greece
Contact: Emmanuel Kakaras
Telephone: +30-1 6546637
Facsimile: +30-1 6527539
E-mail: csfta@mail.demokritos.gr
ICPET Certcetare sa
VITAN, 236
74369 Bucharest, Romania
Contact: Catalin Flueraru
Telephone: +40-1 3229247
Facsimile: +40-1 3214170
E-mail: icpetc@icpetcercetare.pcnet.ro
mionita@icpetcercetare.pcnet.ro
World Coal Institute
Oxford House, 182 Upper Richmond Road,
Putney
UK-London SW15 2SH
Contact: Charlotte Griffiths
Telephone: +44-20 82466611
Facsimile: +44-20 82466622
E-mail: cgriffiths@wci-coal.com
22 FRANCE
ADEME
27, Rue Louis Vicat
FR-75015 Paris
Contact: Florence Clement
Telephone: +33-1 47652331
Facsimile: +33-1 46455236
E-mail: florence.clement@ademe.fr
23 UK
ETSU
AEA Technology plc
Harwell, Didcot,
UK-OX11 0RA Oxfordshire
Contact: Lorraine Watling
Telephone: +44 1235 432014
Facsimile: +44 1235 433434
E-mail: lorraine.watling@aeat.co.uk
WREAN
1 Newgents Entry
UK-BT74 7DF Enniskillen
Contact: Robert Gibson
Telephone: +44-1365 328269
Facsimile: +44-1365 329771
E-mail: robert@wrean.co.uk
24 GUANGZHOU
Guangzhou Institute of
Energy Conversion
The Chinese Academy of Sc.
81 Xianlie Central Road Guangzhou
510070 Guangzhou, P.R.China
Contact: Deng Yuanchang
Telephone: +86-20 87606993
Facsimile: +86-20 87302770
E-mail: dengyc@ms.giec.ac.cn
Acta Energiae Sinica
China Solar Energy Society
3 Hua Yuan Lu, Haidian District
100083 Beijing, China
Contact: Li Jintang
Telephone: +86-10 62001037
Facsimile: +86-10 62012880
E-mail: tynxbb@public.sti.ac.cn
OPET

Committee of Biomass Energy,
China Rural Energy Industrial
Association
16 Dong San Huan Bei Lu,
Chaoyang District
100026 Beijing, China
Contact: Wang Mengjie
Telephone: +86-10 65076385
Facsimile: +86-10 65076386
E-mail: zhightec@public3.bta.net.cn
25 CORA
Saarländische Energie-Agentur
Altenkesselerstrasse 17
DE-66115 Saarbrücken
Contact: Nicola Sacca
Telephone: +49-681 9762174
Facsimile: +49-681 9762175
E-mail: sacca@se.sb.uunet.de
Brandenburgische
Energiespar-Agentur
Feuerbachstrafle 24/25
DE-14471 Potsdam
Contact: Georg Wagener-Lohse
Telephone: +49-331 98251-0
Facsimile: +49-331 98251-40
E-mail:kwronek@bea-potsdam.de
Zentrum für Innovation
und Technik in
Nordrhein-Westfalen
Dohne 54
DE-45468 Muelheim an der Ruhr
Contact: Herbert Rath
Telephone: +49-208 30004-23
Facsimile: +49-208 30004-29
E-mail: hr@zenit.de
Energieagentur Sachsen-Anhalt
Universitaetsplatz 10
DE-39104 Magdeburg
Contact: Werner Zscherpe
Telephone: +49-391 73772-0
Facsimile: +49-391 73772-23
E-mail: ESA_zscherpe@md.regiocom.net
26 FINLAND
The National Technology Agency
Kyllikinportti 2
FI-00101 Helsinki
Contact: Marjatta Aarniala
Telephone: +358-10 5215736
Facsimile: +358-10 5215905
E-mail: Marjatta.Aarniala@tekes.fi
Finntech Finnish Technology
Teknikantie 12
FI-02151 Espoo
Contact: Leena Grandell
Telephone: +358-9 4566098
Facsimile: +358-9 4567008
E-mail: leena.grandell@motiva.fi
Technical Research Centre of Finland
Vuorimiehentie 5
PO Box 1000
FI-02044 Espoo
Contact: Eija Alakangas
Telephone: +358-14 672611
Facsimile: +358-14 672598
E-mail: Eija.Alakangas@vtt.fi
27 European ISLANDS
International Scientific Council
for Island Development
c/o UNESCO
1, rue Miollis
FR-75015 Paris
Contact: Pier Giovanni D’ayala
Telephone: +33-1 45684056
Facsimile: +33-1 45685804
E-mail: insula@insula.org
ITER
Poligono Industrial de Granadilla - Parque
Eolico
ES-38611 San Isidro - Tenerife
Contact: Manuel Cendagorta
Galarza Lopez
Telephone: +34-922 391000
Facsimile: +34-922 391001
E-mail: iter@iter.rcanaria.es
National Technical University of Athens
9, Heroon Polytechniou Str.
GR-15780 Zografu ñ Athens
Contact: Arthouros Zervos
Telephone: +30-1 7721030
Facsimile: +30-1 7721047
E-mail: Zervos@fluid.mech.ntua.gr
AREAM
Madeira Tecnopolo
PO-9000-390 Funchal
Contact: Jose Manuel Melim Mendes
Telephone: +351-91 723300
Facsimile: +351-91 720033
E-mail: aream@mail.telepac.pt
Assoc.Nat. Comuni
Isole Minori
Via dei Prefetti
IT-186 Roma
Contact: Franco Cavallaro
Telephone: +39-090 361967
Facsimile: +39-090 343828
E-mail: FRCAVALL@tin.it
SAARE MAAVALITSUS
Saaremaa County Government
1 Lossi Str.
EE 3300 Kuressaare Estonia
Contact: Tarmo Pikner
Telephone: +372-4 533499
Facsimile: +372-4 533448
E-mail: tarmo@saare.ee
28 GERMAN POLISH
Berliner Energieagentur
Rudolstr. 9
DE-10245 Berlin
Contact: Ralf Goldmann
Telephone: +49-30 29333031
Facsimile: +49-30 29333099
E-mail: goldmann@berliner-e-agentur.de
The Polish National Energy
Conservation Agency (KAPE)
Nowogrodzka 35/41
PL-00-691 Warsaw, Poland
Contact : Marina Coey
Telephone: +48-22 6224389
Facsimile: +48-22 6222796
E-mail: public.relations@kape.gov.pl
Baltycka Poszanowania Energii (BAPE)
Podwale Przedmiejskie 30
PL-80-824 Gdansk, Poland
Contact: Edmund Wach
Telephone: +48-58 3058436
Facsimile: +48-58 3058436
E-mail: bape@ima.pl
Niedersächsische Energieagentur
R¸hmkorffstrasse 1
DE-30163 Hannover
Contact: Annerose Hürter
Telephone: +49-511 9652917
Facsimile: +49-511 9652999
E-mail:
hoe@nds-energie-agentur.de
29 INDIA
Tata Energy Research
Institute
DARBARI SETH BLOCK
Habitat Place, Lodi Road
110 003 New Delhi, India
Contact: Amit Kumar
Telephone: +91-11 4622246
Facsimile: +91-11 4621770
E-mail: Akumar@teri.res.in
30 HUNGARY
National Technical
Information Centre and
Library (OMIKK)
Muzeum u 17
H-1088 Budapest, Hungary
Contact : Gyula Daniel Nyerges
Telephone: +36-1 2663123
Facsimile: +36-1 3382702
E-mail: nyerges@omk.omikk.hu
KTI
Institute for Transport Sciences
Than Karoyl u. 3-5 Pf 107
H-1518 1119 Budapest, Hungary
Contact: Imre Buki
Telephone: +36-1 2055904
Facsimile: +36-1 2055927
E-mail: buk11704@helka.iif.hu
Energy Centre Hungary
Könyves Kalman Körut 76
H-1087 Budapest, Hungary
Contact: Andreas Szaloki
Telephone: +36-1 3331304
Facsimile: +36-1 3039065
E-mail: office@energycentre.hu
31 PACTO ANDINO
Cenergia
Derain n° 198, Lima 41, Lima, Peru
Contact: Jorge Aguinaga Diaz
Telephone: +51-1 4759671
Facsimile: +51-1 2249847
E-mail: tecnica@cenergia.org.pe
Ministerio de Energia y Minas
Direccion de Energias Alternativas
Paez 884 y Mercadillo
Edf. Interandina, Quito, Ecuador
Contact: Balseca Granja
Telephone: +59-32 565474
Facsimile: +59-32 565474
E-mail: Memdea@waccom.net.ec
32 AUSTRIA
E.V.A.
Linke Wienzeile 18, AT-1060 Vienna
Contact: Günter Simader
Telephone: +43-1 5861524
Facsimile: +43-1 5869488
E-mail: simader@eva.wsr.at
Ö.E.K.V.
Museumstraße 5, AT-1070 Wien
Contact: Franz Urban
Telephone: +43-1 5237511
Facsimile: +43-1 5263609
E-mail: Oekv@netway.at
BIT
Wiedner Hauptstrafle 76, AT-1040 Wien
Contact: Manfred Horvat
Telephone: +43-1 5811616-114
Facsimile: +43-1 5811616-18
E-mail: Horvat@bit.ac.at
Energieinstitut Vorarlberg
Stadstrafle 33/CCD, AT-6850 Dornbim
Contact: Kurt Hämmerle
Telephone: +43-5572 31202-0
Facsimile: +43-512 589913-30
E-mail: haemmerle.energieinstitut@ccd. vol.at
Energie Tirol
Adamgasse 4/III, AT-6020 Innsbruck
Contact: Bruno Oberhuber
Telephone: +43-512 589913
Facsimile: +43-512 589913-30
E-mail: Bruno.oberhuber@energie-tirol.at
UBW - Salzburg
Julius-Raab-Platz 1
AT-5027 Salzburg
Contact: Wolfgang Schörghuber
Telephone: +43-662 8888-339
Facsimile: +43-512 589913-30
E-mail: Wschoerghuber@sbg.wk.or.at
AEE
Feldgasse 19
AT-8200 Gleisdorf
Contact: Werner Weiss
Telephone: +43-3112 588617
Facsimile: +43-3112 588618
E-mail: w.weiss@aee.at
33 ESTONIA
Estonian Energy Research Institute
1 Paldiski Road, 10137 Tallinn, Estonia
Contact: Inge Iroos
Telephone: +372-2 450303
Facsimile: +372-2 6311570
E-mail: iroos@online.ee
Archimede –
Estonian Foundation of EU
Education & Research Programmes
Kompanii 2, 51007 Tartu, Estonia
Contact: Rene Tönnisson
Telephone: +372-7 300328
Facsimile: +372-7 300336
34 SLOVENIA
Institute „Jozef Stefan“
Jamova 39, SI-1001 Ljubljana, Slovenia
Contact: Tomaz Fatur
Telephone: +386-61 1885210
Facsimile: +386-61 1612335
E-mail: tomaz.fatur@ijs.si
Civil Engineering Institute ZRMK
Dimiceva 12
SI-1000 Ljubljana, Slovenia
Contact: Marjana Sijanec Zavri
Telephone: +386-61 1888342
Facsimile: +386-61 1367451
E-mail: msijanec@gi-zrmk.si
University of Ljubljana,
Center for Energy and Environment
Technologies
Askerceva 6, SI-1000 Ljubljana, Slovenia
Contact: Vincenc Butala
Telephone: +386-61 1771421
Facsimile: +386-61 218567
E-mail: vinvenc.butala@fs.uni-lj.si
35 RUSSIA
Intersolarcenter
2, 1-st Veshyakovski Proezd
109456 Moscow, Russia
Contact: Akhsr Pinov
Telephone: +7-095 1719670
Facsimile: +7-095 17149670
E-mail: intersolar@glas.apc.org
St. Petersburg Energy Centre
Polyustrovsky Prospect 15 Block 2
Kalininskiy Rayon
195221 St. Pertersburg, Russia
Contact: Nikita Solovyov
Telephone: +7-812 3271517
Facsimile: +7-812 3271518
E-mail: encenter@online.ru
36 SOUTHERN AFRICA
Minerals and Energy Policy Centre
76, Juta Street, 2050 Braamfontein
Johannesburg, South Africa
Contact: Paul Mathaha
Telephone: +27-11 4038013
Facsimile: +27-11 4038023
E-mail: paul@mepc.org.za
Botswana Technology Centre
10062 Machel Drive
Gaborone, Botswana
Contact: Nick Ndaba Nikosanah
Telephone: +267 314161 or 584092
Facsimile: +267 374677
E-mail: nndaba@botec.bw
37 LATVIA
EKODOMA
Zentenes Street 12-49
1069 Riga, Latvia
Contact : Andra Blumberga
Telephone: +371 7210597
Facsimile: +371 7210597
E-mail: ekodoma@bkc.lv
RTU EED
Kronvalda boulv. 1,
LV-1010 Riga, Latvia
Contact : Dagnija Blumberga
Telephone: +371 9419783
Facsimile: +371 7089923
E-mail: dagnija@parks.lv
38 HECOPET
CRES
19th Km Marathonos Ave.
GR-190 09 Pikermi
Contact: Maria Kontoni
Telephone: +30-1 6039900
Facsimile: +30-1 6039911, 904
E-mail: mkontoni@cres.gr
LDK
Sp. Triantafyllou 7, GR-11361 Athens
Contact: Christos Zacharias
Telephone: +30-1 8629660
Facsimile: +30-1 8617681
E-mail: opet@ldk.gr
39 CAUCASUS
Energy Efficiency Centre Georgia
D. Agmegshenebeli Ave. 61
380002 Tbilisi, Georgia
Contact: George Abulashvili
Telephone: +995-32 943076
Facsimile: +995-32 921508
E-mail: eecgeo@caucaus.net
abulashvili@hotmail.com
Energy Strategy Centre
Amaranotsain str. 127
375047 Yerevan, Amenia
Contact: Surev Shatvorian
Telephone: +374-2 654052
Facsimile: +374-2 525783
E-mail: piuesc@arminco.com
Energy Center Azerbaijan Republic
Zardabi Avenue 94
370016 Baku, Azerbaijan
Contact: Marina Sosina
Telephone:+994-12 314208 or 931645
Facsimile: +994-12 312036
E-mail: Marina@azevt.com
40 BELGIUM
Vlaamse Thermie Coordinatie (VTC)
Boeretang 200
BE-2400 Mol
Contact: Greet Vanuytsel
Telephone: +32-14 335822
Facsimile: +32-14 321185
E-mail: opetvtc@vito.be
Institut Wallon ASBL
Boulevard Frere Orban 4
BE-5000 Namur
Contact: Xavier Dubuisson
Telephone: +32-81 250480
Facsimile: +32-81 250490
E-mail: xavier.dubuisson@iwallon.be
41 LITHUANIA
Lithuanian Energy Institute
Breslaujos 3, 3035 Kaunas, Lithuania
Contact: Vladislovas Katinas
Telephone: +370-7 454034
Facsimile: +370-7 351271
E-mail: dange@isag.lei.lt
42 CYPRUS
Applied Energy Centre of the Ministry of
Commerce, Industry and Tourism Republic
of Cyprus
Araouzos 6, CY-1421 Nicosia
Contact: Solon Kassinis
Telephone: +357-2 867140
Facsimile: +357-2 375120
E-mail: mcienerg@cytanet.com.cy
43 ZHEIJIANG
Zheijiang Provincial Energy Research Institute
218 Wener Road, 310012 Hangzhou, China
Contact: Ms Huang Dongfeng
Telephone: +86-571 8840792
Facsimile: +86-571 8823621
E-mail: huangdf@china-zeri.org
44 SOUTH SPAIN
SODEAN
Isaac Newton Isla de la Cartuja
E-41092 Sevilla
Contact: Maria Luisa Borra Marcos
Telephone: +34-95 4460966
Facsimile: +34-95 4460628
E-mail:Marisaborra@sodean.es
A.G.E.
Castilla la Mancha
Tesifonte Gallego 22, E-2002 Albacete
Contact: Agustin Aragon Mesa
Telephone: +34-925 269800
Facsimile: +34-925 267872
E-mail: Rnieto@jccm.es
SOFIEX
Moreno de Vargas N° 6, E-6800 Merida
Contact: Antonio Ruiz Romero
Telephone: +34-924 319159
Facsimile: +34-924 319212
E-mail: Aruiz@bme.es
IMPIVA
Plaza del Ayuntamiento, 6, E-48002 Valencia
Contact: Joaquin Ortola Pastor
Telephone: +34-96 3986336
Facsimile: +34-96 3986322
E-mail: Ximo.ortola@impiva.m400.gva.es
45 ISRAEL
Tel-Aviv University
69978 Tel Aviv, Israel
Contact: Yair Sharan
Telephone: +972-3 6407573
Facsimile: +972-3 6410193
E-mail: sharany@post.tau.ac.il
Samuel Neaman Institute
Technion City, 32000 Haifa, Israel
Contact: David Kohn
Telephone: +972-4 8292158
Facsimile: +972-4 8231889
E-mail: dkohn@tx.technion.ac.il
Manufacturers Association of Israel
Industry House
29 Hamered St.
500022 ñ 68125 Tel-Aviv, Israel
Contact: Yechiel Assia
Telephone: +972-3 5198830
Facsimile: +972-3 5103152
E-mail: Metal@industry.org.il

NOTICE TO THE READER
Extensive information on the European Union is available through the EUROPA service
at internet website address http://europa.eu.int
The overall objective of the European Union’s energy policy is to help ensure a sustainable
energy system for Europe’s citizens and businesses, by supporting and promoting secure
energy supplies of high service quality at competitive prices and in an environmentally
compatible way. European Commission DG for Energy and Transport initiates, coordinates and
manages energy policy actions at, transnational level in the fields of solid fuels, oil & gas, electri-
city, nuclear energy, renewable energy sources and the efficient use of energy. The most
important actions concern maintaining and enhancing security of energy supply and internatio-
nal cooperation, strengthening the integrity of energy markets and promoting sustainable
development in the energy field.
A central policy instrument is its support and promotion of energy research, technological
development and demonstration (RTD), principally through the ENERGIE sub-programme
(jointly managed with DG Research) within the theme ‘Energy, Environment & Sustainable
Development’ under the European Union’s Fifth Framework Programme for RTD. This contribu-
tes to sustainable development by focusing on key activities crucial for social well-being and
economic competitiveness in Europe.
Other programmes managed by DG Energy and Transport such as SAVE, ALTENER and
SYNERGY focus on accelerating the market uptake of cleaner and more efficient energy
systems through legal, administrative, promotional and structural change measures on a trans-
regional basis. As part of the wider Energy Framework Programme, they logically complement
and reinforce the impacts of ENERGIE.
The internet website address for the Fifth Framework Programme is
http://www.cordis.lu/fp5/home.html
Further information on DG for Energy and Transport activities is available
at the internet website address
http://europa.eu.int/comm/dgs/energy_transport/index_fr.html
The European Commission Directorate-General for Energy and Transport
200 Rue de la Loi
B-1049 Brussels
Belgium
Fax +32 2 2960416
E-mail: TREN-info@cec.eu.int
Wyszukiwarka
Podobne podstrony:
renewable energy
2001 08 28
bph pbk raport roczny 2001
2001 11 29
gp340 brochure
BrochureWeldability PL spawanie inox
arkusz fizyka poziom s rok 2001 535
2001 październik Cztery pory roku kryteria
Herbs for Sports Performance, Energy and Recovery Guide to Optimal Sports Nutrition
[ebook renewable energy] Home Power Magazine 'Correct Solar Panel Tilt Angle to Sun'
2001 06 30
Mantak Chia Taoist Secrets of Love Cultivating Male Sexual Energy (328 pages)
Porty morskie i żegluga morska w Polsce w latach 1999 2001
121 307 POL ED02 2001
2001 12 29
2001 10 26
80 307 POL ED02 2001
Free Energy Projects 2
A2 2001 petrol YES
więcej podobnych podstron