
Polish Journal of Environmental Studies Vol. 13, No. 4 (2004), 389-396
Removal of Organics and Nitrogen from Municipal
Landfill Leachate in Two-
T
T
Stage SBR Reactors
D. Kulikowska*, E. Klimiuk
Faculty of Environmental Sciences and Fisheries, University of Warmia and Mazury in Olsztyn,
Oczapowskiego St. 5, 10-957 Olsztyn Poland
Received: 5 May 2003
Accepted: 14 November 2003
Abstract
The aim of this study was to investigate efficiency of ammonium nitrogen removal from municipal
landfill leachate in activated sludge in two-stage SBR reactors. Treated leachate contains low concentra-
tions of organic substances measured as chemical oxygen demand (COD) − 757 mg O
2
/dm
3
and high
concentrations of ammonium − 362 mgN
NH4
/dm
3
.
Nitrification was studied in two parallel, aerated SBR reactors with two different hydraulic retention times
(HRT), 3 and 2 days, respectively. We have found that 2 days HRT was sufficient to achieve complete nitrification.
In the effluent ammonium, nitrite and nitrate nitrogen concentrations were 0.08 mgN
NH4
In the effluent ammonium, nitrite and nitrate nitrogen concentrations were 0.08 mgN
In the effluent ammonium, nitrite and nitrate nitrogen concentrations were 0.08 mgN /dm
3
, 0.04 mgN
NO2
, 0.04 mgN
, 0.04 mgN /dm
3
/dm
/dm and
320 mgN
NO3
320 mgN
320 mgN /dm
3
, respectively. The ammonium nitrogen removal rate was 20.2 mgN
NH4
, respectively. The ammonium nitrogen removal rate was 20.2 mgN
, respectively. The ammonium nitrogen removal rate was 20.2 mgN /dm
3.
h.
The effluent from aerobic reactors (HRT 2 days) was fed to the anoxic SBR reactors. An external car-
bon source (methanol) was added to promote denitrification. In the anoxic reactor, at a methanol dosage
3.6 mg COD/mg N
NO3
and HRT of 1 day complete denitrification was achieve with nitrate nitrogen residual
concentrations of 0.9 mgN
NO3
/dm
3
. The maximum denitrification rate was 48.4 mgN
NOx
/dm
3.
h.
The highest values of the yield methanol coefficient Y
m/N-NOx
YY
were determined for dosages
3.6 mg COD/mg N
NO3
and 5.4 mg COD/mg N
NO3,
, the lowest for 1.8 mg COD/mg N
NO3
.
Keywords:
landfill leachate, activated sludge, sequencing batch reactor (SBR), nitrification, denitri-
fication, methanol.
*Corresponding author; e-mail: dorotak@uwm.edu.pl
Introduction
Leachate from landfills is a potential environmental
hazard as surface and groundwater contamination. In
order to minimize the negative influence on the environ-
ment, leachate must be treated to remove organic com-
pounds and nitrogen before being discharged.
The leachate chemical composition may differ mar-
kedly depending on age and maturity of the landfill site. In
leachate from the acid-phase landfill, more than 95% of the
dissolved organic carbon content of 20,000 mg DOC/dm
3
consisted of volatile fatty acids and only 1.3% of high mo-
lecular weigh compounds. In methanogenic-phase landfill
in leachate, however, there are no volatile acids, and 32%
of the DOC content of 2,100 mg/dm
3
consisted of high
molecular weight compounds [1]. According to Artiola-
Fortuny and Fuller [2]
Fortuny and Fuller
Fortuny and Fuller
in methanogenic-phase leachate
more than 60% of the DOC is humic-like material.
Biological methods are highly effective in treating
leachate from the young landfills containing a large
amount of readily biodegradable organic acids [3]. How-
ever, their contents decrease rapidly in the following 2-3
years exploitation of landfill. For this reason for leachate
treatments are recommended to be multistage systems
that include biological and physicochemical processes
[4, 5].
The main source of nitrogen in leachate are proteins.
According to Jokela et al., [6] percentage of proteins in
municipal solid waste is 0.5% of dry weight. The hy-
drolysis of the polypeptyde chain is disadvantageous in
Kulikowska D., Klimiuk E.
390
energetic terms and this is apparently the reason for the
slow kinetics of protein hydrolysis that in turn causes
slow ammonium releasing. Therefore the mature leach-
ate contains relatively high concentration of ammonium
[7]. In activated sludge, nitrogen removal from leachate
can be achieved by biosynthesis, ammonia stripping and
denitrification [8, 9, 10].
In the activated sludge, however, the nitrification
process is slow and may be inhibited by metals and
hazardous materials [11, 12], high concentrations of
ammonium nitrogen [13] and high concentrations of
organic substances, especially volatile fatty acids
[14]. When treating leachate characterized by low
levels of biodegradable organics, a supplementary
source of organic carbon is required to ensure ad-
equate denitrification.
In the presented experiment SBR reactors were used.
It is stated that high and low floc loading conditions are
continuously repeated in the SBR operating cycle. The
existence of substrate concentrations gradient in initial
and end of aeration phases results in stratification of
activated sludge flocs and promotes the nitrification and
denitrification rates [15]. An additional advantage is the
possibility for technological modifications during the
process since very significant changes in the chemical
composition of leachate can occur during the time of the
landfill operation [16]. This research seeks to determine
organic removal efficiency, rates of nitrification and
denitrification and yield methanol coefficient in the de-
nitrification process. The highest nitrogen removal rates
are expected for design parameters that are similar to the
landfill site where this work was studied.
Materials and Methods
Leachate Feed
The leachate used in this study was collected from
a municipal landfill located in Wysieka (near Barto-
szyce), which has been in operation since 1996. The
leachate had the typical characteristics of a mature
landfill. The biochemical oxygen demand (BOD
5
) and
chemical oxygen demand (COD) were 105 mgO
2
/dm
3
and 757 mgO
2
/dm
3
, respectively. The ammonium nitro-
gen concentration of the leachate was 362 mgN
NH4
/dm
3
(Tab. 1). This low (0.14) BOD
5
/COD clearly indicated
that the leachate was low in biodegradability. For that
reason methanol was added to the anoxic reactor as a
carbon source for denitrification.
The leachate was delivered 1-2 times per month to the
laboratory and stored at 4
o
C.
Process Configuration and System Design
A post denitrification process was carried out in this
study. The laboratory treatment two-stage system consis-
ted of an aerobic SBR-N (nitrification) and anoxic SBR-
D (denitrification) sequencing batch reactors. The system
was operated at room temperature.
Nitrification
Two identical SBR reactors worked at 3 days HRT
(SBR 1-N) and 2 days HRT (SBR 2-N) in parallel to treat
the mature leachate from sanitary landfill. The total volume
of each reactor was 6 dm
3
. Both reactors were operated in
a 24-h cycle mode, at 0.25, 20.5, 3 and 0.25 hours for the
feed, aeration, settle and decant, respectively. Dissolved
oxygen was supplied using porous diffusers, placed at the
bottom of aerobic reactors. The operation conditions for the
aerated SBR reactors were listed in Table 2.
Denitrification
Leachate from SBR 2-N was subsequently fed into
four SBR reactors (SBR 1-D − SBR 4-D) that were
operated in parallel in a 12-h cycle mode and differed in
methanol dosage (Tab. 3). Duration phases time was 0.25;
10; 1.5 and 0.25 hours for the feed, mixing, settle and de-
cant, respectively. The operation conditions in denitrified
reactors were listed in Table 3.
Analytical Method
The daily measured parameters were chemical oxygen
demand (COD), ammonium nitrogen, nitrite nitrogen,
nitrate nitrogen, volatile suspended solids (VSS) and total
suspended solids (TSS) in the mixed reactor content and
settled effluent. The analyses were carried out according to
the methodology described by Hermanowicz et al., [17].
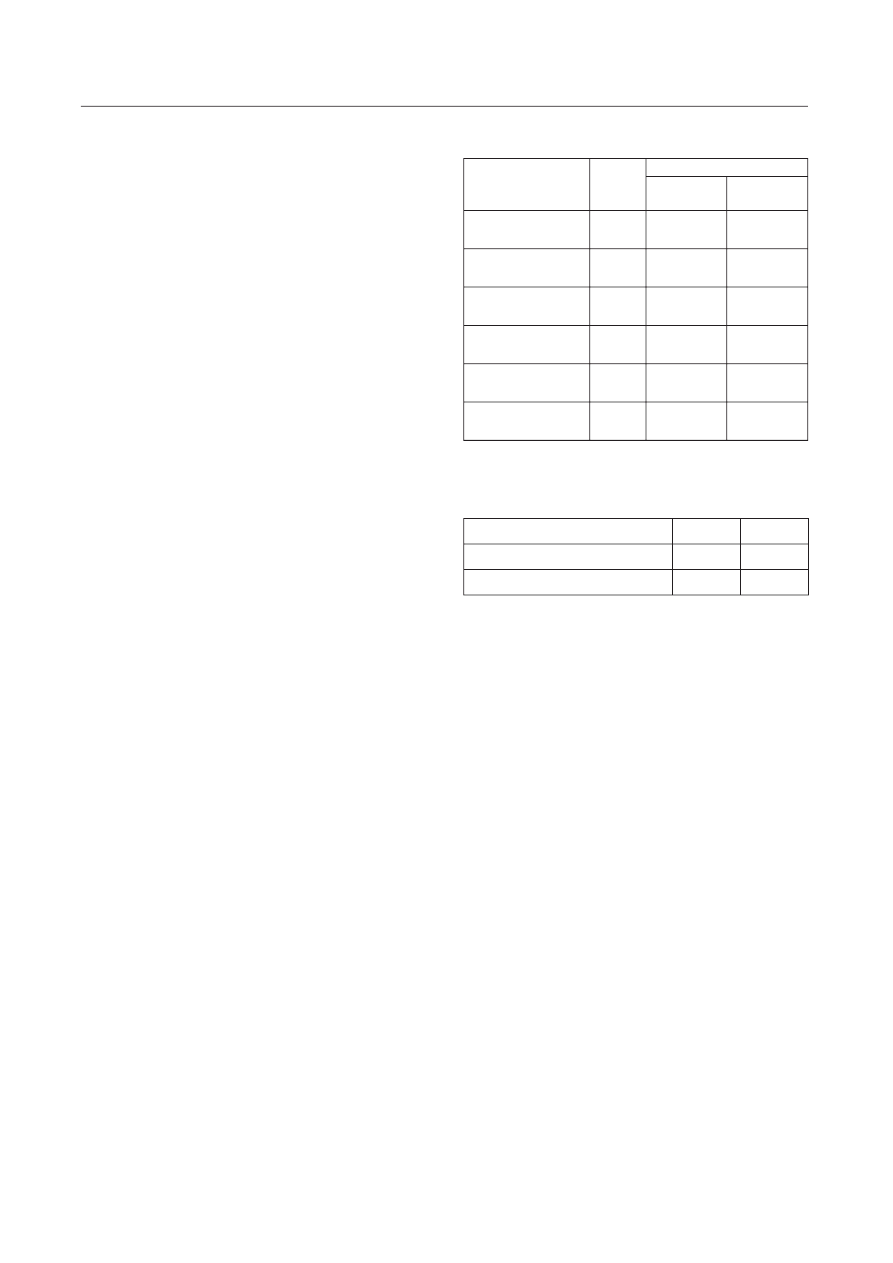
Table 1. Landfill leachate characterization.
Parameter
Raw
leachate
Aerobically treated leachate
SBR 1-N
(HRT 3d)
SBR 2-N
(HRT 2d)
COD
(mg O
2
/dm
3
)
757
386
394
BOD
5
(mg O
2
/dm
3
)
105
5.6
8.4
Organic nitrogen
(mgN
org
/dm
3
)
35
32
33.2
Ammonium nitrogen
(mg N
NH4
/dm
3
)
362
0.07
0.08
Nitrate nitrogen
(mg N
NO3
/dm
3
)
n.d.
323
320
Nitrite nitrogen
(mg N
NO2
/dm
3
)
n.d.
0.02
0.04
n.d. ─ not detected
Table 2. The operation conditions in nitrified reactors.
Operation conditions
SBR 1-N
SBR 2-N
Hydraulic retention time (HRT) (d)
3
2
Volumetric exchange rate (%)
33
50
Removal of Organics and Nitrogen from Municipal...
391
Results
Organics Removal and Nitrification
Organic compounds removal and nitrification were
tested at HRT 3d and at HRT 2d. It was shown that
organics elimination efficiency (expressed as COD)
was adequately 51% and 49%. Their average con-
centrations in the effluent were 386 mgO
2
/dm
3
and
394 mgO
2
/dm
3
, respectively (Tab. 1). Relatively low ef-
fectiveness, although long leachate retention time, could
be the result of high concentration of slowly or non-bio-
degradable organics in the leachate. This is confirmed by
low BOD
5
/COD (0.14) in raw leachate.
Ammonium nitrogen removal rate and nitrification
rate were described by zero-order kinetics and defined by
the following differential equation:
(1)
The solution for this could be fitted to the experimen-
tal data according to (2):
(2)
sign (−) means ammonium concentration decrease and
sign (+) means nitrate concentration increase.
where:
r
N
rr - ammonium removal rate or nitrifi cation rate
(mg N
NH4
/dm
3.
h or mg N
NO3
/dm
3.
h),
k
N
kk - constant of ammonium removal rate or nitrifi cation
rate (mg N
NH4
/dm
3.
h or mg N
NO3
/dm
3.
h),
C
N
C
C - ammonium nitrogen or nitrate nitrogen
concentration after time t (mg N
tt
NH4
/dm
3
or
mg N
NO3
/dm
3
),
t -
time (h),
C
0,N
C
C - ammonium nitrogen or nitrate nitrogen
concentration at the beginning of the aeration
phase (mg N
NH4
/dm
3
or mg N
NO3
/dm
3
).
The values of ammonium removal rate estimated
from equation (2) in both reactors were comparable
20.1 mg N
NH4
/dm
3.
h (HRT 3d) and 20.2 mg N
NH4
/dm
3.
h
(HRT 2d). This means that the rate of ammonium removal
was independent of HRT (Figs.1a, 2a). However, in
SBR 1 (HRT 3d) nitrite was not detected (Fig. 1b), where-
r
N
rr = ±
dC
N
C
C
dt
= ± k
N
kk
C
N
C
C = C
0,N
C
C ± k
N
kk · t
Table 3. The operation conditions in denitrified reactors.
Operation conditions
SBR
1-D
SBR
2-D
SBR
3-D
SBR
4-D
Hydraulic retention
time (HRT) (d)
1
1
1
1
Volumetric exchange
rate (%)
50
50
50
50
Methanol dosage
(mg COD/mg N
NO3
)*
1.8
3.6
5.4
7.3
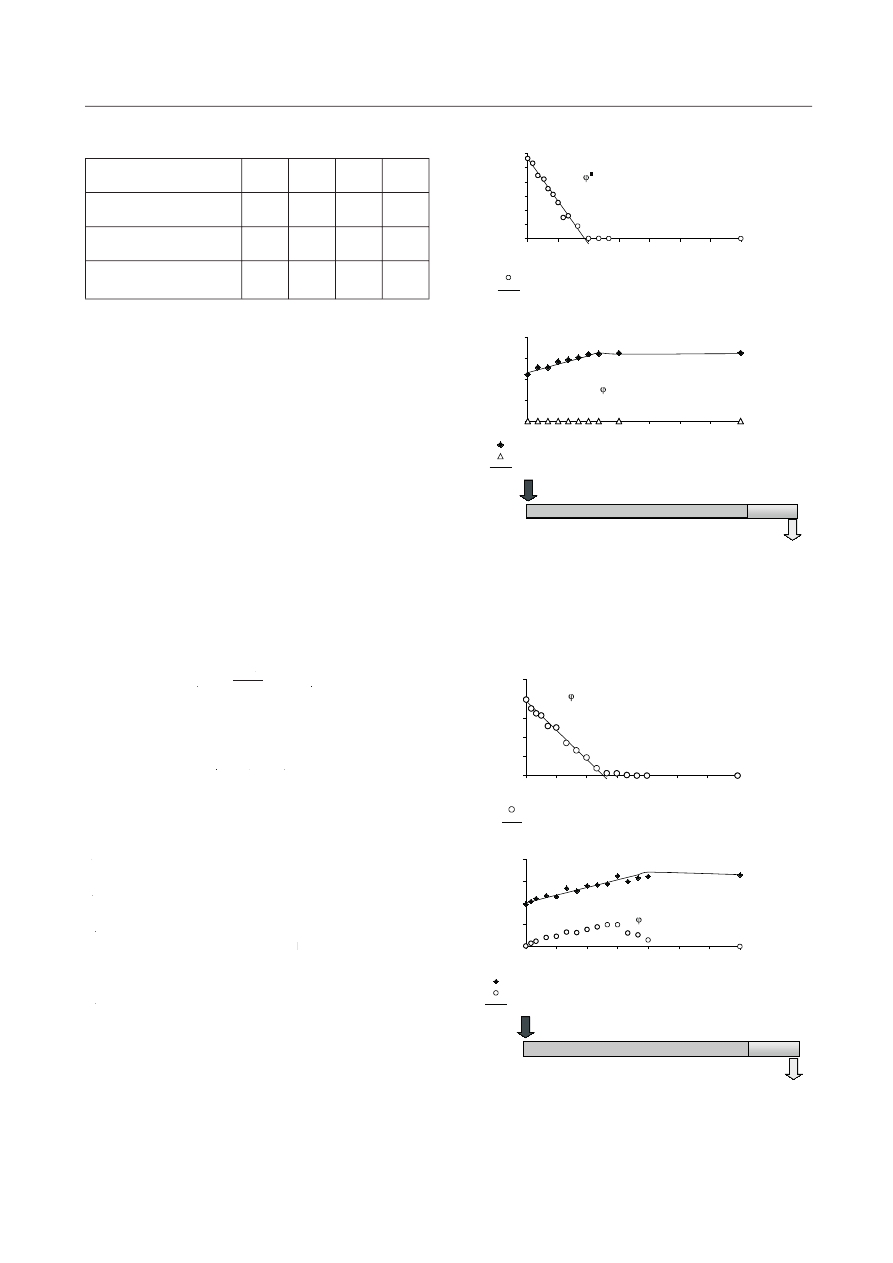
Fig. 1. Concentrations profiles in leachate of ammonium nitro-
gen (a), nitrate nitrogen and nitrite nitrogen (b) during aerobic
conditions and reaction rates described by zero-order kinetics at
HRT 3d (SBR 1-N).
��
��
�
���
���
���
���
�
�
�
�
��
��
��
��
���� ���
��
��
��
��
��
��
�
��
��
��
�
�
������� �������� ������������� �����
������� �������� ������������� �����
���������� �������
�
�
� ���� ���
���
���
��
�
�
������
�
��
��
��
��
���
���
�
�
�
�
��
��
��
��
���� ���
��
��
��
��
��
��
�
��
��
��
�
�
�������� �������� ������������� �����
���������� �������
�
�
� ���� ���
���
���
��
�
������
�������� �� �
������ � �
����
������
��
��
�
��
��
���
���
���
�
�
�
�
��
��
��
��
�������
��
��
��
��
��
��
�
��
��
��
�
�
�������� �������� ������������� �����
���������� �������
�
�
� ���� ���
���
���
��
�
�
������
�
���
���
���
���
�
�
�
�
��
��
��
��
���� ���
��
��
��
��
��
��
�
��
��
��
3
�
������� �������� �������� �������� ������������� �����
������� �������� ������������� �����
���������� �������
�
�
� ���� ���
���
�
��
�
�
�
�
������
�������� �� �
������ � �
����
������
Fig. 2. Concentrations profiles in leachate of ammonium nitro-
gen (a), nitrate nitrogen and nitrite nitrogen (b) during aerobic
conditions and reaction rates described by zero-order kinetics at
HRT 2d (SBR 2-N).
*methanol dosage per nitrate concentration at the beginning of
the SBR reactor operating cycle
Kulikowska D., Klimiuk E.
392
��
��
����
����
����
�����
����
����
����
�����
�������������
������������
���������
����
��
��
�
���
���
���
�
�
��
��
��
��
��
��
��
��
��
��
��
���� ���
��
�
��
��
�
��
��
��
��
��
��
�
�
�
��
�
�
��� ��
��� ��
���
���
���
���
���
���
�
�
��
��
��
��
��
��
��
��
��
��
��
���� ���
��
��
��
�
��
��
�
�
�
��
�
�
�
��� ��
��� ��
�
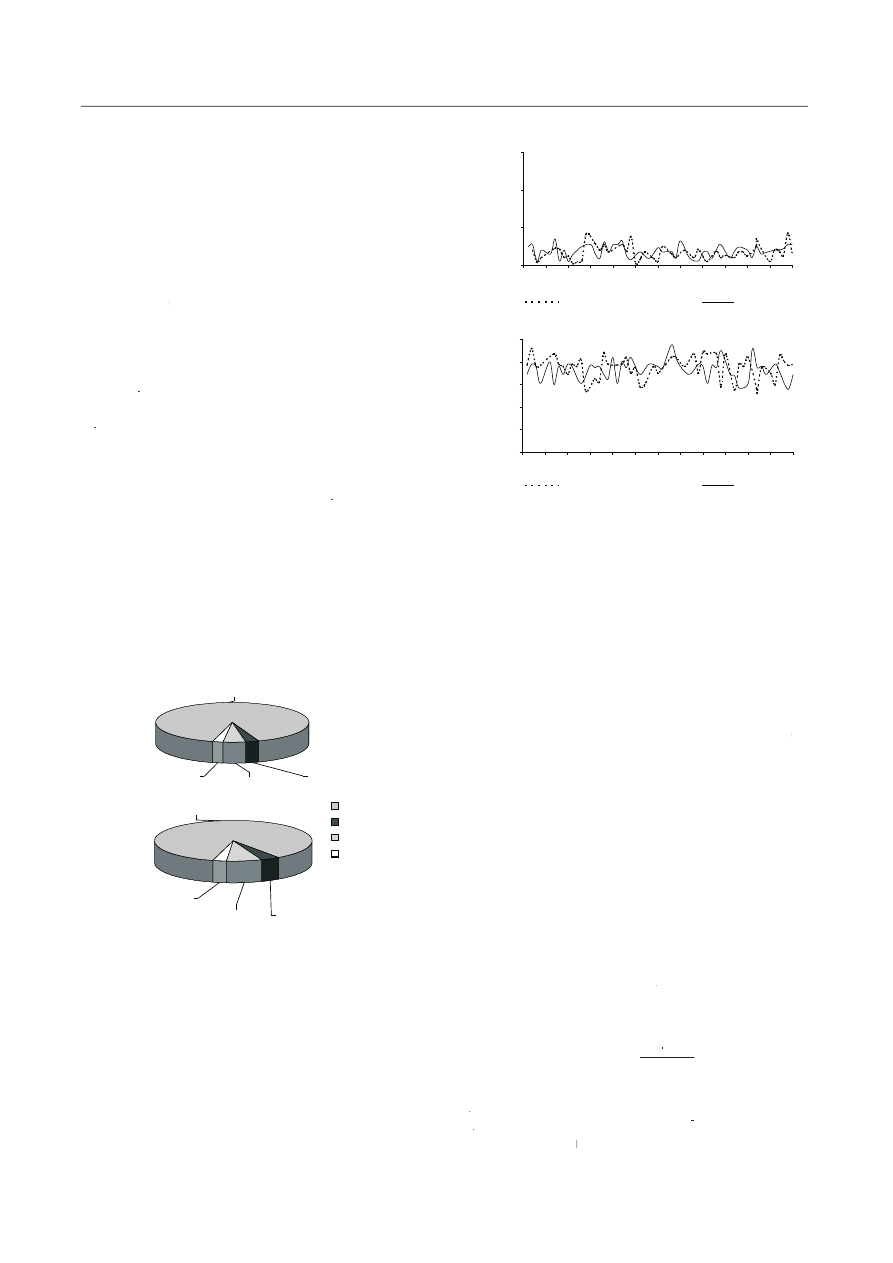
Fig. 3. Ammonium nitrogen balance during SBR reactor opera-
ting cycle; a. SBR 1-N (HRT 3d) b. SBR 2-N (HRT 2d).
as in SBR 2-N (HRT 2d) ammonium oxidation to nitrate
was due to nitrite accumulation (Fig. 2b). The highest
nitrite nitrogen concentration (99.7 mg N
NO2
/dm
3
) was
observed after 7 h of the experimental cycle.
Nitrification rate in SBR 1-N was 13.4 mgN
NO3
Nitrification rate in SBR 1-N was 13.4 mgN
Nitrification rate in SBR 1-N was 13.4 mgN /dm
3.
h
(Fig. 1b) and was 1.5-times lower than the rate of ammo-
nium removal. The rate of I and II phases nitrification in
SBR 2-N (estimated from the dependence of sum of nitrite
nitrogen and nitrate nitrogen concentrations versus time)
was 11.7 mg N
NOx
was 11.7 mg N
was 11.7 mg N /dm
3.
h
(Fig. 2b).
The ammonium consumed for biomass assimilation,
ammonia stripping and nitrification were calculated in
the cycle. Figure 3 show the data worked out on the basis
of nitrogen balance. The yield coefficient of activated
sludge (Y
obs
YY ) was apparently low, due to low readily bio-
degradable organics concentration and long sludge age
(Y
obs
YY = 0.28 mg VSS/mg COD in SBR 1-N and 0.36 mg
VSS/mg COD in SBR 2-N). It was estimated that nitrogen
used for the biomass growth was 3.3 mg N/dm
3
(SBR 1-N)
and 6.2 mg N/dm
3
(SBR 2-N) (on the basis determined by
Kulikowska [18] the yield coefficients Y
obs
YY and nitrogen
content in activated sludge − 9.5 mgN/100 mg VSS). It
was adequately 2.9% and 3.9% of nitrogen removed from
leachate. Nitrogen loss as the result of stripping calculated
according to Balmelle et al., [19] was 4.6% (SBR 1-N)
and 7.2% (SBR 2-N). Non-balanced nitrogen loss did not
exceed 3% in both reactors (Figs. 3a, b).
Fig. 4. Concentration of ammonium nitrogen (a) and nitrate nitro-
gen (b) in the effluent from SBR reactors (steady conditions).
fold longer in SBR 2-N. It should be emphasized that the
nitrification rate − 20mg N
NH4
/dm
3.
h and HRT 2d can be
the basis for a safe SBR design in leachate treatment.
Denitrification
Effluent from SBR 2-N was fed to four anoxic reac-
tors operated in parallel, differed in methanol dosage. In
the SBR reactors methanol dosage values ranged from
1.8 mg COD/mg N
NO3
1.8 mg COD/mg N
1.8 mg COD/mg N (SBR 1-D) to 7.3 mg COD/mg N
NO3
(SBR 1-D) to 7.3 mg COD/mg N
(SBR 1-D) to 7.3 mg COD/mg N
(SBR 4-D) (Tab. 3).
The methanol consumption and nitrate reduction rate
in the SBR cycle were described by zero-order kinetics.
Methanol removal rate (r
m
) values are presented in Figure 5.
From the obtained results it follows that the highest COD
elimination rate − 182.1 mgCOD/dm
3.
h was achieved
in SBR 3-D, the lowest one − 115 mg COD/dm
3.
h in
SBR 1-D. It should be noticed that the value of methanol
dosage 1.8 mg COD/mg N
NO3
was insufficient to com-
pletely nitrate reduction (denitrification efficiency was
67.2%). In SBR 3-D and SBR 4-D the increase in organics
concentration in the effluent was observed, which indicates
the incomplete use of methanol for nitrate reduction.
The nitrate reduction rate (r
N-NO3
rr
) was calculated di-
rectly from the dependence nitrate nitrogen concentration
versus time (3).
(3)
where:
r
N-NO
rr
3
- nitrate reduction rate (mg N
NO3
/dm
3.
h),
C
N-NO
C
C
3
-nitrate nitrogen concentration in the anoxic phase
33
after time t (mg N
tt
NO3
/dm
3
),
t -
tt
time (h).
r
N-NO
rr
3
= –
dC
N-NO
C
C
3
dt
It was observed that nitrification was highly stable, the
average concentrations of ammonium nitrogen and nitrate
nitrogen were 0.07 mgN
NH4
/dm
3
and 323 mgN
NO3
/dm
3
in
SBR 1-N and 0.08 mgN
NH4
/dm
3
and 320 mgN
NO3
/dm
3
in
SBR 2-N (Figs. 4 a, b). In SBR 1-N, where nitrite accu-
mulation was not observed, the time after that there was
ammonium oxidation to nitrate made up approximately
30% of the aeration phase. The time necessary for am-
monium oxidation through nitrite and nitrate was two-
Removal of Organics and Nitrogen from Municipal...
393
The data obtained are presented in Figure 5. From the
results it can be concluded that nitrite was the intermedi-
ate of nitrate reduction to molecular nitrogen detected to
accumulate significantly. The maximum nitrite accumula-
tion is visible lower than the initial nitrate concentration,
which indicates that they were simultaneously reduced.
The nitrate reduction rate was higher than nitrite one, es-
pecially when methanol concentration increased.
Denitrification rate (r
N-NOx
rr
) was expressed as depen-
dence sum of the nitrite nitrogen and nitrate nitrogen
concentrations versus time
(4):
(4)
where:
r
N-NO
rr
x
- nitrate reduction rate (mg N
NOx
/dm
3.
h),
C
N-NO
C
C
x
-sum of the nitrite nitrogen and nitrate nitrogen
xx
concentrations in the anoxic phase after time t
(mg N
NOx
/dm
3
),
t -
tt
time (h).
The highest denitrification rate r
N-NOx
rr
- 48.4 mg
N
N-NOx
/dm
3.
h was observed for methanol dosage 5.4 mg
COD/mg N
NO3
.
In other series the values of r
N-NOx
rr
were about
1.2-fold lower (Figs. 5a, b, c, d).
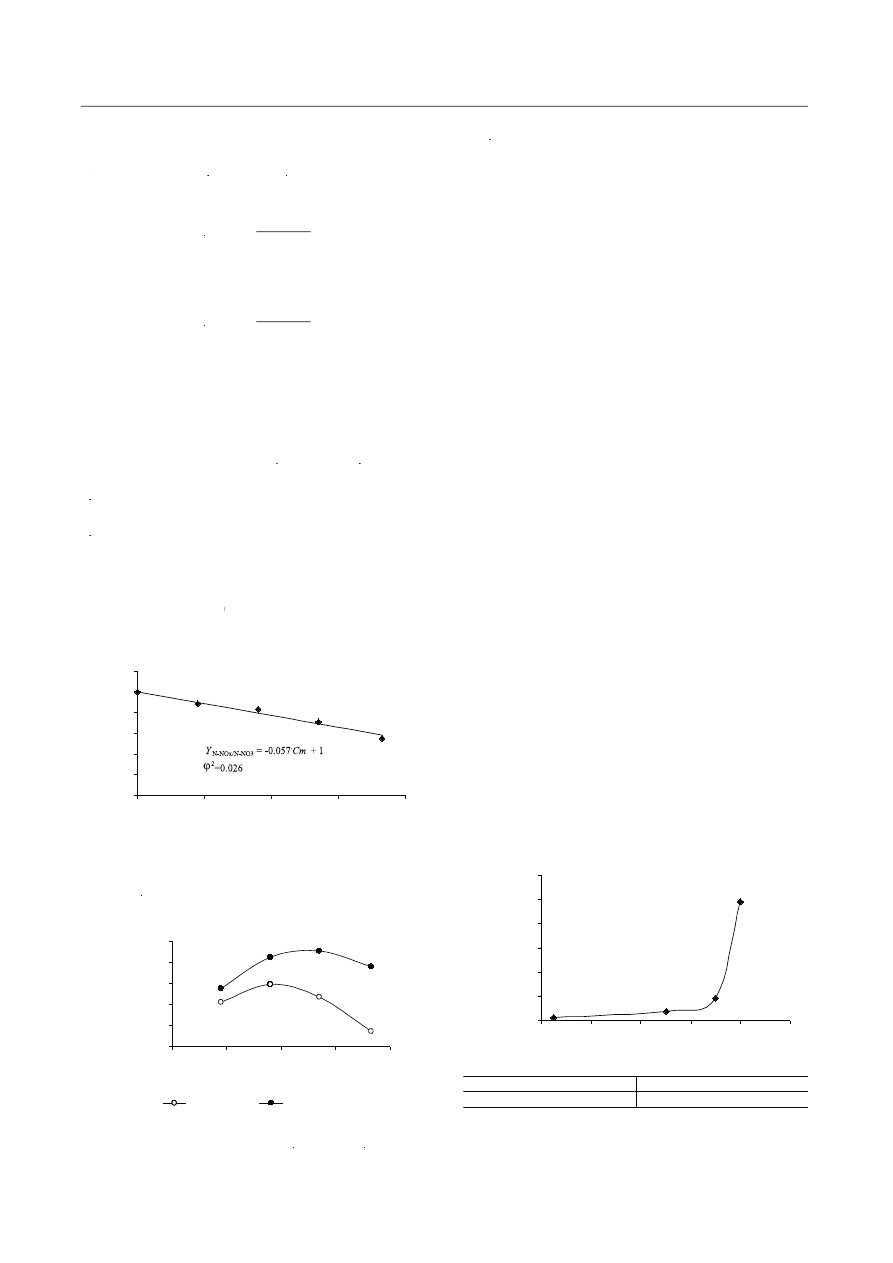
Then, yield coefficient nitrogen removal from leachate
Y
N-NOx/N-NO3
YY
was calculated as the ratio of denitrification rate
r
N-NOx
rr
and nitrate reduction rate r
N-NO3
rr
(after Almeida et al.,
[20]). The value Y
N-NOx/N-NO3
YY
ranged from 0 to 1 depending
on the relative rate of sum nitrite and nitrate reduction at
nonlimiting concentration of nitrite and nitrate. The plot of
Y
N-NOx/N-NO3
YY
versus the concentration of methanol was
linear (Fig. 6) and can be described by the following
equation:
(5)
where:
C
m
-
methanol dosage per nitrate concentration at the
beginning of the SBR reactor operating cycle
(mg COD/mg N
NO3
).
Y
N-NOx/N-NO3
= – 0.057 · C
m
+ 1
r
N-NO
rr
x
= –
dC
(N-NO
C
C
x)
dt
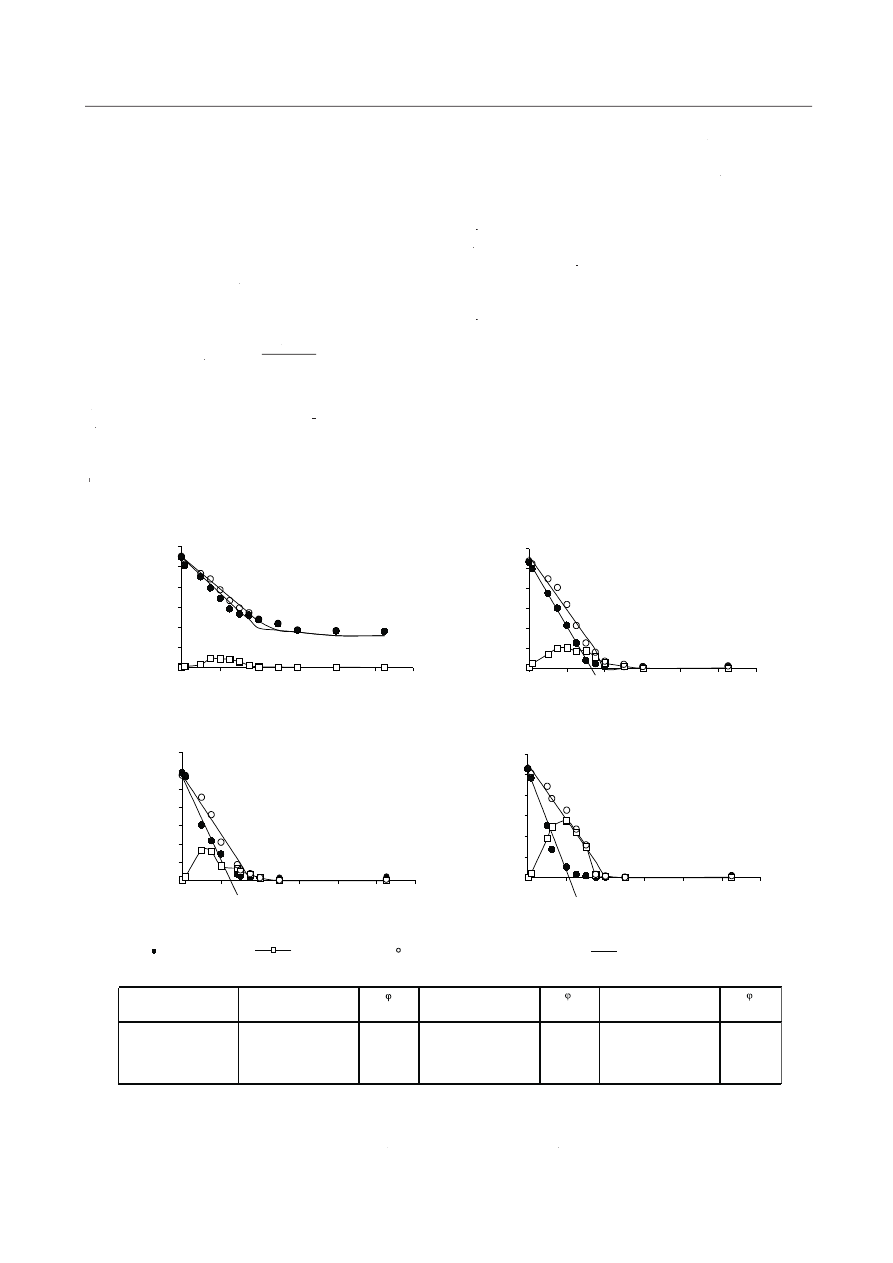
Fig. 5. Concentration of nitrite nitrogen, nitrate nitrogen and sum of nitrite nitrogen and nitrate nitrogen versus time and straight line
described by zero-order kinetics (a. SBR 1-D; b. SBR 2-D; c. SBR 3-D; d. SBR 4-D). The table includes the methanol dosage (C
m
),
methanol removal rate (r
m
), nitrate reduction rate (r
N-NO
rr
3
) and denitrification rate (r
N-NO
rr
x
) described by zero-order kinetics and the
goodness coefficient φ
2
.
��
��
��
��
�������� ������ ��� �
�
�
�
�
�����
�
�
��� ������ �
���
�
��� ������
��
��
��� �
���
���
��
��
��� �
�����
���
��
��
�����
�����
�����
����
�����
�����
����
�����
�����
�����
�����
�����
����
���
���
�����
���
���
���
��
����
���
���
����
����
����
�
�����
����
����
�
��
���
���
���
���
���
�
�
�
�
�
��
��
���� ���
��
��
��
��
��
��
�
��
��
��
�
�
�
��
��
��
���
���
���
�
�
�
�
�
��
��
���� ���
��
��
��
��
��
��
�
��
��
��
�
�
�
��
��
��
���
���
���
���
�
�
�
�
�
��
��
���� ���
��
��
��
��
��
��
�
��
��
��
�
�
�
��
��
��
���
���
���
�
�
�
�
�
��
��
���� ���
��
��
��
��
��
��
�
��
��
��
�
�
������� ��������
���������� �������
������� ��������
������� �������� � ������� ��������
Kulikowska D., Klimiuk E.
394
The ratio of the methanol removal rate (r
m
) and
nitrate removal rate (r
N-NO3
rr
) or denitrification rate
(r
N-NOx
rr
) to express Y
m/N-NO3
YY
and Y
m/N-NOx
YY
(yield methanol
coefficient):
or
where:
r
m
-
methanol removal rate (mg COD/dm
3.
h),
r
N-NO3
rr
- nitrate removal rate (mg N
NO3
/dm
3.
h),
r
N-NOx
rr
- denitrifi cation rate (mg N
NOx
/dm
3.
h).
The correlation between Y
m/N-NO3
YY
and Y
m/N-NOx
YY
and
methanol dosage is shown in Figure 7. The values of
Y
m/N-NO3
YY
ranged from 1.87 mg COD/mg N
NO3
(SBR 4-D) to
2.98 mg COD/mg N
NO3
(SBR-2D). The values of
Y
m/N-NOx
YY
for the dosages 3.6 mg COD/mg N
NO3
(SBR
2-D) and 5.4 mg COD/mg N
NO3
(SBR 3-D), for al-
most all the time points were on the same level. It
corresponded with the stoichiometric methanol dosage
- 2.47 mgCH
3
OH/mg N
NO3
OH/mg N
OH/mg N (calculated by McCarty et al.,
[21]), which converted on COD was 3.6 mg COD/mg N
NO3
[21]), which converted on COD was 3.6 mg COD/mg N
[21]), which converted on COD was 3.6 mg COD/mg N .
One of the reasons why lower than stoichiometric values
Y
m,N-NO
YY
3
=
r
m
r
N-NO
rr
3
(6)
Y
m,N-NO
YY
x
=
r
m
r
N-NO
rr
x
(7)
of Y
m/N-NOx
YY
at the methanol dosage 1.8 mg COD/mg NO
3
(SBR 1-D) and 7.3 mg COD/mg N
NO3
(SBR 4-D) were
achieved might be due to the fact that not only molecular
nitrogen but also nitrogen oxides appeared after denitri-
fication.
Discussion
Leachate with low BOD
5
/COD, ratio used in this
study, was collected from landfill, which has been oper-
ated for 6 years. It is obvious that correspondingly with
the decrease in BOD
5
/COD ratio there is a decrease in
treatment effectiveness. In the presented experiment
effluent contained high organics concentration (about
390 mg O
2
/dm
3
). It was about 50% of their contents in the
influent. Barbusiński et al., [22] indicated that during the
treatment of leachate from completely stabilized, 50-year
old landfill of industrial wastes at BOD
5
/COD 0.05, the
value of COD removal efficiency was 7.5%.
In this research, ammonium concentration did not
exceed 0.08 N
NH4
/dm
3
in the effluent and stable nitri-
fication were obtained at the leachate hydraulic reten-
tion time (HRT) 2d. An effluent of similar quality with
0.1 mg N
NH4
0.1 mg N
0.1 mg N /dm
3
Zaloum and Abott [23] have been ob-
served at the retention time of 3.2 d but at four-fold lower
nitrogen concentration. For raw leachate containing high
concentration of organic substances (12 760 mgCOD/dm
3
)
and nitrogen (218 mgN/dm
3
) it is necessary to extend
HRT to 20 d. According to Robinson and Carville (after
Lo 1996) [24] in SBR reactors, although the favourable
N/COD ratio for the nitrification (1.08), in order to obtain
high effectiveness of the process (99.8 %), the hydraulic
retention time must not to be shorter than 20 d. Compar-
ing nitrification rate obtained in the presented experiment
with the results of the other authors (Fig. 8) it should be
noted that leachate composition, especially N/COD ratio
in the treated leachate determined the process.
The research reported that under aerobic conditions
over 90% (SBR 1-N) and 86% (SBR 2-N) of nitrogen was
nitrified. The nitrogen amount for biosynthesis, stripping
Fig. 6. The ratio between denitrification rate and nitrate reduc-
tion rate (Y
N-NO
YY
x/N-NO3
) versus methanol dosage (C
m
).
�
���
���
���
���
�
���
�
�
�
�
�
�� ��� ������ �
���
�
�
�
��
�
��
�
��
�
�
���
���
���
���
���
���
�
�
�
�
�
�� ��� �������
���
�
�
�
��
��
�
�
��
�
�
��
��
�
�
��
��
�
�
�
��������
��������
Fig. 7. Yield methanol coefficients (Y
m/N-NO
YY
3
and Y
m/N-NO
YY
x
) ver-
sus methanol dosage (C
m
).
� � ������� ������ ����
� � ������� ������ ����
� � ��� ����������
� � ����� �� ���� ����
�
��
���
���
���
���
���
�
���
���
���
���
�
����� �� ��������
��
�
��
��
�
��
�
��
��
��
��
��
�
�
�
�
�
��
�
��
��
�
�
�
�
Fig. 8. Ammonium removal rate versus N/COD in treated leachate
(according to some authors).

Removal of Organics and Nitrogen from Municipal...
395
and the nitrogen loss did not exceed 10% (SBR 1-N) and
14% (SBR 2-N). Results in the literature indicate that in
the leachate both the use of nitrogen for biosynthesis [8]
and the nitrogen loss caused by ammonia stripping [9] are
diversified and in extreme cases can achieve almost 100%.
In our experiments methanol and nitrate concen-
trations decreased near linearly with time. Similarly,
Timmermans and van Haute [26] indicated that in pure
culture of Hyphomicrobium sp. the denitrification rates
have been described with zero-order kinetics with respect
to the carbon source and nitrate. It was showed that nitrate
reduction rate (r
N-NO3
rr
) depended on methanol dosage and
it ranged from 45 to 73.4 mg N
NO3
/dm
3.
h, whereas the
denitrification rate (r
N-NOx
rr
) was almost on the same level
of approximately 42.2 mg N
NOx
/dm
3.
h.
Data in literature indicate that accumulation of ni-
trite is strongly affected by species composition culture,
oxygen and substrate concentrations. Loukidou and
Zouboulis [27] indicated that the rate of denitrification
depends on the supply of an adequate concentration of
carbon source for denitrifying microorganisms. Doyle et
al., [28] during the investigations in SBR reactors under
anoxic conditions proved that denitrification rate depends
on carbon source. In cases of acetate and methanol the
rates were adequately 1.5-times (16.25 mgN/dm
3.
h) and
1.7-times (14.58 mgN/dm
3.
h) lower in comparison to mal-
tose (25 mgN/dm
3.
h). In our experiment, at the optimal
methanol dosage (3.6 mgCOD/mgN
NO3
), denitrification rate
(r
N-NOx
rr
) was 40.2 mg N
NOx
/dm
3.
h.
In presented researches the highest yield methanol coef-
ficients Y
m/N-NOx
YY
were obtained for dosages 3.6 mg COD/mg
m/N-NOx
m/N-NOx
N
NO3
N
N and 5.4 mg COD/mg N
NO3
and 5.4 mg COD/mg N
and 5.4 mg COD/mg N . Lower values of the coeffi-
cient for dosages 1.8 mg COD/mg N
NO3
cient for dosages 1.8 mg COD/mg N
cient for dosages 1.8 mg COD/mg N and 7.3 mg COD/mg
N
NO3
N
N may indicate that nitrogen oxides were the products of
denitrification. Itokawa et al., [29] reported nitrous oxide
production in high-loading biological nitrogen removal
process under low COD/N ratio condition. In steady-state
operation, 20-30% of influent nitrogen was emitted as N
2
O
in the bioreactors with influent COD/N ratio less than 3.5.
In our experiment methanol demand was about 3.6 mg
COD/mg N
NO3
COD/mg N
COD/mg N . Literature data concerning external carbon
source demanding for denitrification are not unambigu-
ous. From the investigations carried out by Grabińska-
Łoniewska [30] in activated sludge it results that metha-
nol demanding for denitrification was 3.03 g CH
3
OH/g
N
NO3
(4.48 mg COD/mg N
NO3
). Christensson et al., [31]
compared methanol demanding of activated sludge and
pure denitrifying cultures isolated from activated sludge.
They indicated that methanol demand was on a similar
level (4.45 and 4.1 g COD/g N
NO3
). Doyle et al., [28],
studying leachate treatment in SBR reactors under anoxic
conditions, found that for complete nitrate reduction the
COD/N
NO3
ratio should be higher than 7.
Conclusions
The results of the study can be summarized as follows:
1. Complete nitrification in the SBR was possible at
leachate hydraulic retention time 2d, the average
ammonium concentration in the effluent 0.08 mg
N
NH4
/dm
3
. Determined ammonium removal rate was
on the level of 20 mg N
NH4
/dm
3.
h,
2. The yield coefficient nitrogen removal from leachate
(Y
N-NOx/N-NO3
YY
) depending on methanol dosage was lin-
ear with k coefficient - 0.057,
kk
3. Determined yields methanol coefficient Y
m/N-NOx
YY
was
3.6 mg COD/mg N
NOx
and was in accordance with
theoretical demand, which indicates that the final de-
nitrification product was molecular nitrogen. A lower
than theoretical yield coefficient for dosages 1.8 mg
COD/mg N
NO3
and 7.3 mg COD/mg N
NO3
indicates
that the products of denitrification may be nitrous
oxides.
References
1. HARMSEN J. Identification of organic compounds in
leachate from a waste tip. Wat. Res., 17 (6), 699, 1983.
2. ARTIOLA-FORTUNY J., FULLER W.
FULLER W
FULLER W H. Humic sub-
stances in landfill leachates: I. Humic acid extraction and
identification. J. Environ. Qual. 11, 663, 1982.
3. TIMUR H., ÖZTURK
Environ. Qual.
Environ. Qual.
I., ALTINBAS M., ARIKAN O.,
TUYLUOGLU B. S. Anaerobic treatability of leachate: a
comparative evaluation for three different reactor systems.
Wat. Sci. Technol., 1-2 (42), 287, 2000.
4. ALBERS H., KRÜCKEBERG G
(42), 287,
(42), 287,
. Combination of aerobic
pre-treatment, carbon adsorption and coagulation. Landfill-
ing of waste: leachate. Elsevier applied science. London
and New York, 305, 1992.
5. LEITZKE O. Landfill treatment by photochemical wet oxi-
dation. Roczn. PZH, 1 (47), 125, 1996 (in Polish).
6. JOKELA J. P.Y., KETTUNEN R. H., SORMUNEN K. M.,
RINTALA J. A. Biological nitrogen removal from munici-
pal landfill leachate: low-cost nitrification in biofilters and
laboratory scale in-situ denitrification. Wat. Res., 36, 4079,
2002.
7. KNOX K. Leachate treatment with nitrification of ammo-
nia. Wat. Res., 7 (19), 895, 1985.
8. ROBINSON H. D., MARIS P. J. The treatment of leachates
from domestic wastes in landfills I. Aerobic biological treat-
ment of a medium – strength leachate. Wat. Res., 11 (17),
1537, 1983.
9. MARTTINEN S. K., KETTUNEN R. H., SORMUNEN
K. M., SOIMASUO R. M., RINTALA J. A. Screening of
physical-chemical methods for removal of organic material,
nitrogen and toxicity from low strength landfill leachates.
Chemosphere, 46, 851, 2002.
10. ABUFAYED A. A., SCHROEDER E. D. Performance of
SBR/denitrification with a primary sludge carbon source.
Journal WPCF 5 (58), 387, 1986.
11. ANTONIOU P., HAMILTON J., KOOPMAN B., JAIN
R., HOLLOWAY B., LYBERATOS G., SVORONOS S. A.
Effect of temperature and pH on the effective maximum
specific growth rate of nitrifying bacteria. Wat. Res., 1 (24),
97, 1990.
12. FDZ − POLANCO F., VILLAVERDE S., GARCIA P. A.
Temperature effect on nitrifying bacteria activity in bio-
filters: activation and free ammonia inhibition. Wat. Sci.
Technol., 11 (30), 121, 1994.
13. LI X. Z., ZHAO Q. L. Inhibition of microbial activity of
activated sludge by ammonia in leachate. Environment In-
ternational, 8 (25), 961, 1999.

Kulikowska D., Klimiuk E.
396
14. TAKAI T., HIRATA K., YAMAUCHI K., INAMORI Y. Effects
of temperature and volatile fatty acids on nitrification-denitrifi-
cation activity in small-scale anaerobic-aerobic recirculation
biofilm process. Wat. Sci. Technol., 6 (35), 101, 1997.
15. WANNER J. Activated sludge bulking and foaming control.
A Technomic Publishing Company, Inc. Lancaster, Pensyl-
vania. 1994.
16. IRVINE R. L., WILDERER P. A., FLEMMING H-C.
Controlled unsteady state processes and technologies − an
overview. Wat. Sci. Technol., 1 (35), 1, 1997.
17. HERMANOWICZ W., DOŻAŃSKA W., DOJLIDO J.,
Wat. Sci. Technol.,
Wat. Sci. Technol., (35), 1,
(35), 1,
KOZIOROWSKI B. Physicochemical research of water and
wastewater. Arkady. Warszawa. 1999 (in Polish).
18. KULIKOWSKA D. Efficiency of municipal landfill leach-
ate treatment in SBR reactors. Doctor’s thesis. Wydział
Inżynierii Środowiska, Politechnika Warszawska. 2002
(in Polish).
19. BALMELLE B., NGUYEN K. M., CAPDEVILLE B.,
CORNIER J. C., DEGUIN A. Study of factors controlling
nitrite build-up in biological processes for water nitrifica-
tion. Wat. Sci. Technol., 5-6 (26), 1017, 1992.
20. ALMEIDA J. S., REIS M. A., CARRONDO M. J. Competi-
tion between nitrate and nitrite reduction in denitrification
by Pseudomonas fluorescens. Biotechnology and Bioengi-
neering, 46, 476, 1995.
21. MCCARTY P. L., BECK L., AMANT P. S. Biological deni-
trification of wastewater by addition of organic materials.
Proceedings of the 24
th
Industrial Waste Conferene, Purdue
University. 1969.
22. BARBUSIŃSKI K., KOŚCIELNIAK H., MAJER M.
University.
University.
Treat-
ment of underground water from industrial landfill. V Ogól-
nopolskie Sympozjum Naukowo-Techniczne “Biotechnologia
Środowiskowa”. 1997 (in Polish).
23. ZALOUM R., ABBOTT M. Anaerobic pretreatment im-
proves single sequencing batch reactor treatment of landfill
leachates. Wat. Sci. Technol., 1 (35), 207, 1997.
24. LO I. Characteristics and treatment of leachates from do-
mestic landfills. Environment International, 4 (22), 433,
1996.
25. YALMAZ G., ÖZTÜRK I. Biological ammonia removal
from anaerobically pre-treated landfill leachate in sequenc-
ing batch reactors (SBR). Wat. Sci. Technol., 3 (43), 307,
2001.
26. TIMMERMANS P., VAN HAUTE A. Denitrification with
methanol. Fundamental study of the growth and denitrifica-
tion capacity of Hyphomicrobium sp. Wat. Res., 17, 1249,
1983.
27. LOUKIDOU M. X., ZOUBOULIS A. I. Comparison of two
biological treatment processes using attached-growth bio-
mass for sanitary landfill leachate treatment. Environmental
Pollution, 111, 273, 2001.
28. DOYLE J., WATTS S., SOLLEY D., KELLER J. Excep-
tionally high-rate nitrification in sequencing batch reactors
treating high ammonia landfill leachate. Wat. Sci. Technol.,
3 (43), 315, 2001.
29. ITOKAWA H., HANAKI K., MATSUO T. Nitrous oxide
production in high-loading biological nitrogen removal
process under low COD/N ratio condition. Wat. Res.,
3 (35),
657, 2001.
30. GRABIŃSKA-ŁONIEWSKA A.
657,
657,
Effect of some carbon
sources on biocenosis during nitroden removal in denitri-
fication. Wydawnictwa Politechniki Warszawskiej, Warsza-
wa. 1990 (in Polish).
31. CHRISTENSSON M., LIE E., WELANDER T. A com-
parison between ethanol and methanol as carbon sources for
denitrification. Wat. Sci. Technol., 30, 83, 1994.
Wyszukiwarka
Podobne podstrony:
389
396 PE~2
389%20mensile
389 , Rola rekreacji ruchowej w procesie resocjalizacji młodzieży trudnej
389 - Kod ramki - szablon, GOTOWE POZDROWIENIA 1, GOTOWE POZDROWIENIA 2
396 Homemade batteries
kpk, ART 396 KPK, 1987
D 389 5
388 389
BY Hulecki D , Falszawannie maniet Reczy Paspalitaj (cz 2), Bankauski wiesnik, nr 31 [396] 2007
389
396
Kroeber-Istota-kultury-362-396
C 389 4
396
396 397
396
więcej podobnych podstron