
MS—RAND—CPP2004/5—Product
Revised optimally averaged global and hemispheric land and ocean surface temperature series
including HadCRUT3 data set
Philip Brohan, John Kennedy, Simon Tett, Ian Harris and Phil Jones
Contract deliverable reference number: III.B.6
Revision history by author(s)
Author
Revision date
Summary of changes
Philip Brohan
2005/03/29
Version 2
Approvals
This document requires the following approvals from the relevant activity manager and contract manager
Name
Title
Date of Issue
Version
Simon Tett
Team leader in Climate Vari-
ability Group
2005/03/16
Chris Folland
Hd (Climate Variability Group)
2005/03/29
Derrick Ryall
Hd (GMR)
Distribution
This document has been distributed to:
Name
Title
Date of Issue
Version

This page intentionally left blank

MS—RAND—CPP—PROG0407
Report on HadCRUT3 including error estimates.
Philip Brohan, John Kennedy, Simon Tett, Ian Harris and Phil Jones
Contract deliverable reference number: 03.08.04
File: M/DoE/2/9
Delivered from authors:
Signature: Philip Brohan
Date: 2005/03/29
Scientific content approved by
Activity Manager:
Signature
Date
Approved by HdCPP against
customer requirements
Signature
Date
Sent to Defra:
Signature
Date
Version number
2.0
Number of pages
8
Security Classification:
Unclassified

This page intentionally left blank

Development of the global surface temperature
dataset HadCRUT3
Philip Brohan, John Kennedy, Simon Tett, Ian Harris and Phil Jones
March 2005
Executive Summary
We are producing an update to the historical surface temperature dataset HadCRUT, providing a com-
prehensive error model as well as a range of data and technical improvements.
We are using marine data and uncertainties from the new HadSST2 dataset. This provides better coverage,
and assessments of marine uncertainties and biases.
We have added some extra stations to our land observations data-base. We have further improved this
data-base by doing additional quality control.
We are producing comprehensive uncertainty estimates for the land data, including assessments of mea-
surement and sampling error, and the effects of various biases. Together with the HadSST2 data, this
gives us uncertainty estimates for the global data.
We have improved our methods for data blending and gridding, so we can make gridded datasets on any
spatial resolution.
We are refining the statistical methods used for homogenising and averaging the gridded data. Testing
these methods against pseudo-instrumental data derived from GCM results is allowing us to verify their
capabilities and limitations.
1
Introduction
The historical surface temperature dataset HadCRUT [1, 2] is extensively used as a source of information
on surface temperature trends and variability. One noteworthy use is the provision of time-series of global
and hemispheric annual average temperatures. This dataset is produced through collaboration between
the Hadley Centre, who provide the marine data expertise, and the Climatic Research Unit (CRU) at the
University of East Anglia, who provide the land data and expertise.
Since the last update, which produced HadCRUT2 [2], important improvements have been made in the
marine component of the dataset [3]. These include the use of additional observations, the development of
comprehensive uncertainty estimates, and technical improvements that enable, for instance, the production
of gridded fields at arbitrary resolution.
This document is a report on work to produce a new dataset version, HadCRUT3, which will extend
the advances made in the marine data to the global dataset. The work is being managed in the Hadley
Centre, but part of the work to be done needs expertise from CRU, so a contract has been placed with
CRU to fund them to work on the project in collaboration with Hadley Centre staff.
1

2
Aims of the work
The work being done falls in five main areas:
• Improved land data: additional data, extra quality control.
• Comprehensive land error model: Add estimates of observation errors, extend existing sampling and
bias uncertainty estimates to arbitrary grid resolutions.
• Flexible gridder: make gridded fields on any spatial resolution.
• Better land-sea blending: combine land and sea data in coastal grid-boxes in a way which uses our
knowledge of the uncertainties for each data source.
• Better statistical processing: the gridded fields are refined using two important statistical processes:
– Variance correction: removes the effect of the changing number of observing stations,
– Optimum averaging: make global and hemispheric time-series from the gridded fields.
These processes will be checked for correctness, and simplified and refined where necessary.
The resulting dataset will be made available on the web, and the work will be published in time for the
results to be available to the IPCC 4th assessment report.
3
Progress and plans
3.1
Improved land data
Some new station data has been added, mostly for stations in Mali and the Congo, Switzerland and
Antarctica. Also a lot of quality control has been done. A comparison [4] of the CRU temperature
data with the ERA-40 reanalysis found several areas where the station data was doubtful, and this was
augmented by visual examination of individual station records looking for outliers. Many bad values were
identified and either corrected or removed. A number of duplicate stations were found in the archive and
these were rationalised. Also the station normals and standard deviations were regenerated and checked.
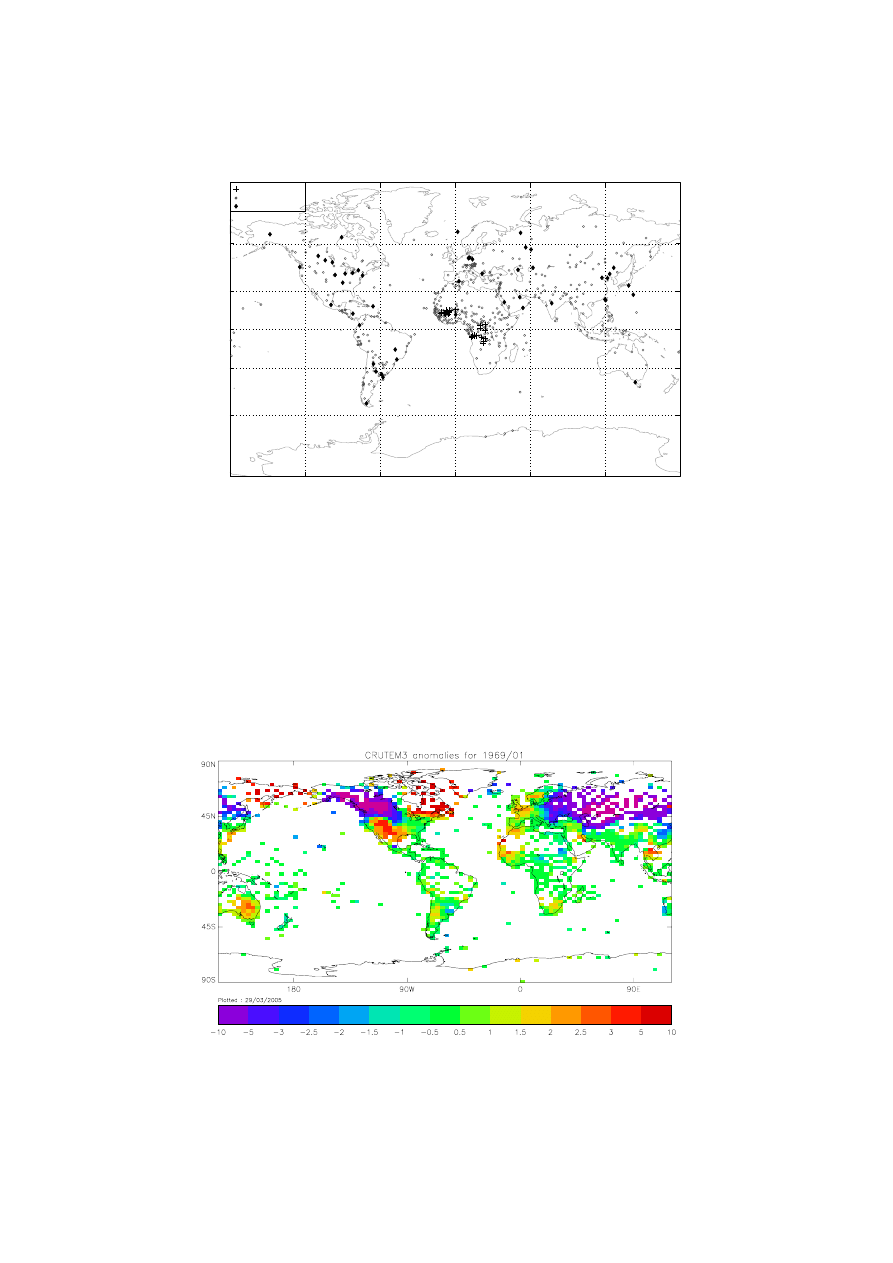
Figure 1 shows the locations of stations where changes have been made.
3.2
Flexible gridder
Earlier versions of HadCRUT [1, 2] were produced only on a 5x5 degree resolution. Recent work on
marine datasets [3] has enabled us to produce them on any resolution; this is valuable for regional studies
and for comparison with model results. We have developed the same functionality for gridding the land
temperature, and so we can make HadCRUT3 gridded fields at any spatial resolution.
Figure 2 shows the land temperature anomalies for a sample month on the HadCM3 model grid. Figure 3
shows North American land temperature anomalies for the same month at the higher HadGEM1 resolution.
2
Produced by showchangedstns.m on 24−Feb−2005 at 15:21:21
Data file: orig−vs−rev10.*
Notes: 3 stations had no location given
180
o
W
120
o
W
60
o
W
0
o
60
o
E
120
o
E
180
o
W
60
o
S
30
o
S
0
o
30
o
N
60
o
N
New Stations
Changed Stations
Deleted Stations
Figure 1: Improvements to the station data. (Plus signs are stations added, filled symbols stations
deleted and hollow symbols stations edited).
Figure 2: Land temperature anomalies (C) for January 1969 on the HadCM3 atmosphere grid
3
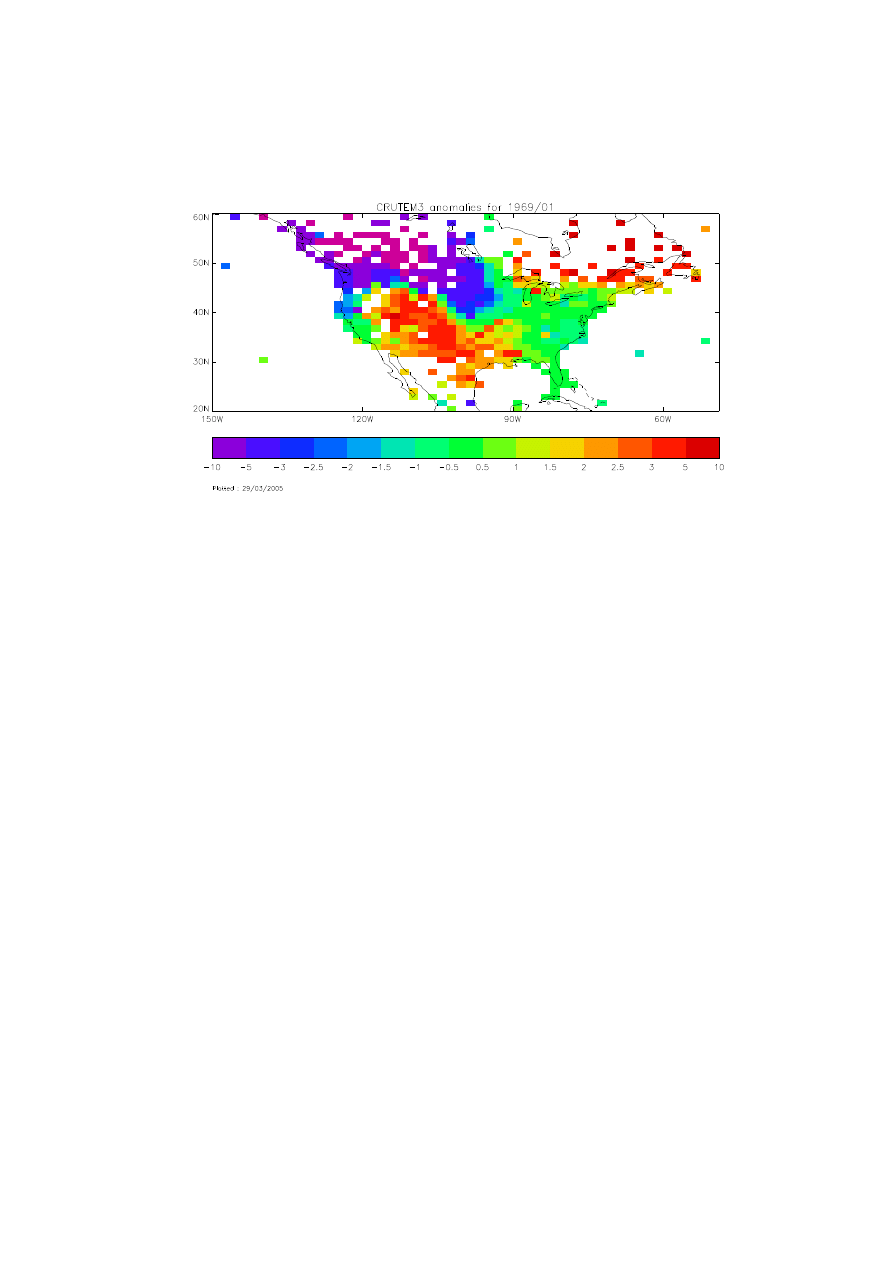
Figure 3: North American land temperature anomalies (C) for January 1969 on the HadGEM1
atmosphere grid
3.3
Comprehensive land error model
There are three different sorts of uncertainty to be considered:
• Uncertainties in the station data:
– Measurement error: following [5] we estimate this as 0.04C on monthly average temperatures.
– Uncertainty in homogenisation corrections: we are estimating this by examining records of
corrections performed at CRU, and by examining differences between corrected and uncorrected
data provided by the Austrian and Canadian national met. services.
– Uncertainty in the climatologies: this is only important where station data is incomplete over
the climatology period; we are estimating it by exploring the effect of removing data from
stations with complete coverage.
• Uncertainties in the gridded fields:
– Effects of the station uncertainties: the combined effect of the uncertainties described above.
– Sampling error: we are adapting the methods of [6] to work on a flexible grid.
• Uncertainties in the bias corrections. Following [5], we are considering two bias corrections: instru-
ment exposure changes and urbanisation. we are adapting the methods of [5] to work on a flexible
grid.
We have not yet made final estimates of all the uncertainty components, but we expect the sampling error
to dominate the uncertainties of monthly gridded fields. Figure 4 shows the estimated sampling errors for
the gridded fields of figure 3
4
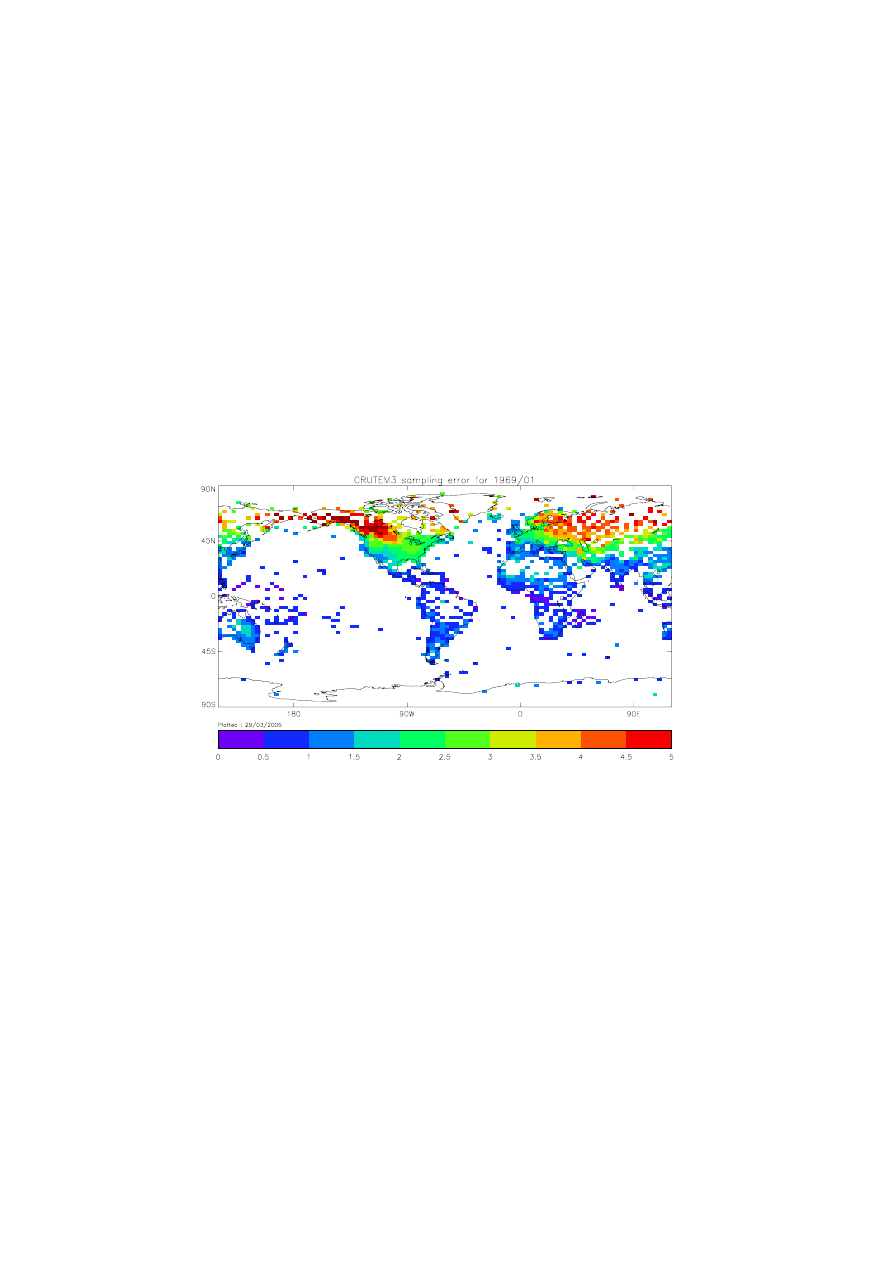
Figure 4: Temperature anomaly sampling errors (C) for January 1969 on the HadCM3 atmosphere
grid
5
Avg Coastal land temp minus co−located ICOADS 3B temp
1890 1900 1910 1920 1930 1940 1950 1960 1970 1980 1990 2000 2010
Year
−0.2
−0.0
0.2
0.4
0.6
0.8
Temp Difference (K)
Annual
Apr−Sept
Oct−Mar
Figure 5: Global mean land-sea temperature difference in coastal and island grid boxes
3.4
Better land-sea blending
Previous versions of HadCRUT blend land and sea data in coastal and island grid-boxes by weighting
the land and sea values by the area fraction of land and sea respectively, with a constraint that the land
fraction cannot be greater than 75% or less than 25%, to prevent either data-source being swamped by
the other.
The optimum way to average two values is to scale them according to their uncertainties, so that the
more reliable value has a higher weighting than the less reliable. As we have full uncertainty estimates for
both the land and sea gridded data we will make HadCRUT3 by blending the components like this.
To get further insight into the uncertainties in the blended dataset it is useful to look at the differences
between land and sea data in coastal and island grid-boxes. Figure 5 gives time-series of global average
land-sea differences, which show interesting structure. The land-sea differences are larger than the uncer-
tainties would suggest, and have trends. We believe that these trends are caused by uncorrected biases
in the land and sea data sets. We don’t propose to pursue this further as part of the HadCRUT3 work,
but such comparisons may be useful in future work on land and marine temperature bias estimation.
3.5
Better statistical processing
3.5.1
Variance correction
Because the number of observations on which they are based varies, grid-box and larger scale temperatures
based on observational data have a standard deviation that varies through time. Most analyses of the data
do not allow for this effect, so we need to correct the data to behave as if the number of observations were
6
15
o
E,−40
o
N
1860 1880 1900 1920 1940 1960 1980 2000
Year
0.0
0.5
1.0
1.5
S.D. (
o
C)
0
100
200
300
400
Number of Observations
−180
o
E,−45
o
N
1860 1880 1900 1920 1940 1960 1980 2000
Year
0.0
0.5
1.0
1.5
2.0
S.D. (
o
C)
0
100
200
300
400
500
Number of Observations
−105
o
E,40
o
N
1860 1880 1900 1920 1940 1960 1980 2000
Year
0
2
4
S.D. (
o
C)
0
5
10
15
20
Number of Observations
15
o
E,−25
o
N
1860 1880 1900 1920 1940 1960 1980 2000
Year
0.0
0.5
1.0
1.5
2.0
S.D. (
o
C)
0.0
0.5
1.0
1.5
2.0
Number of Observations
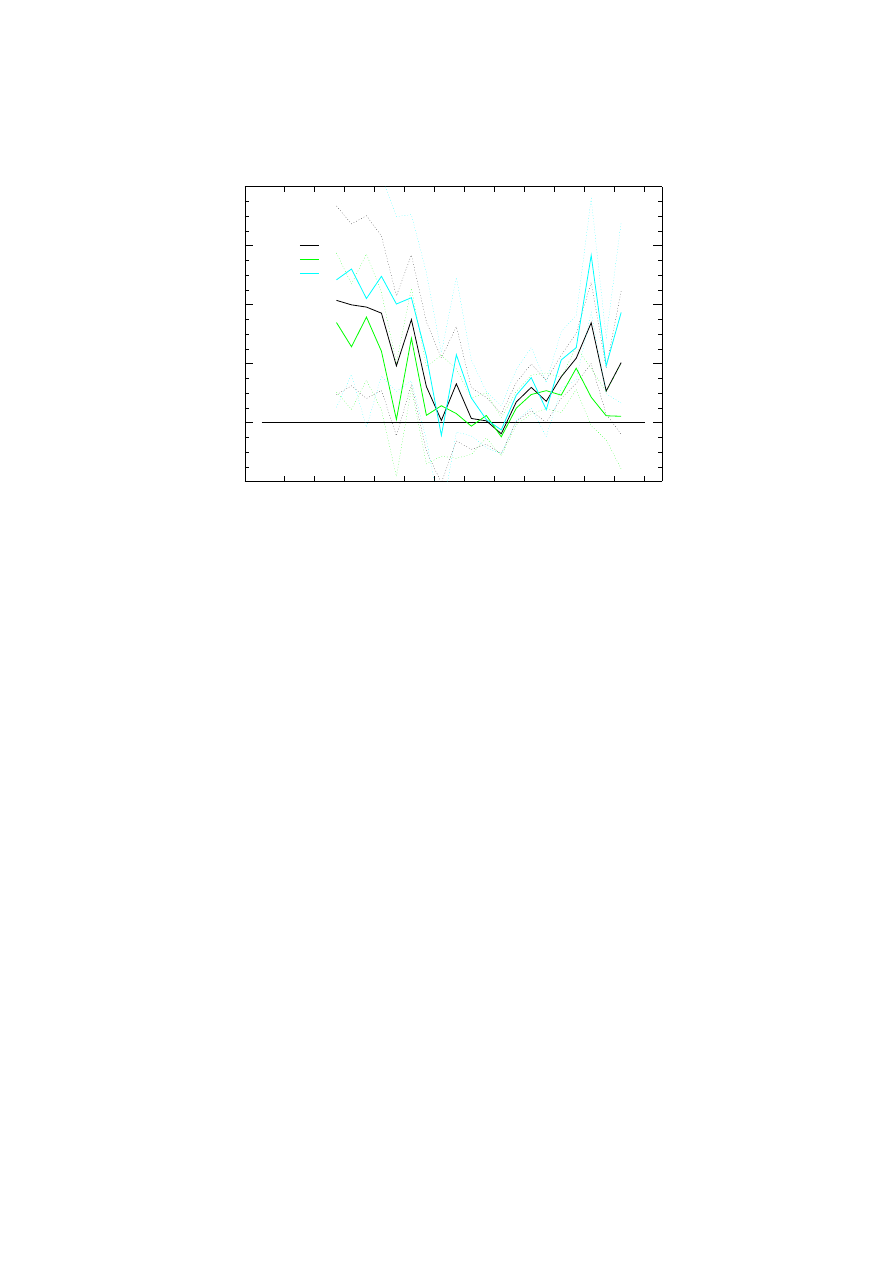
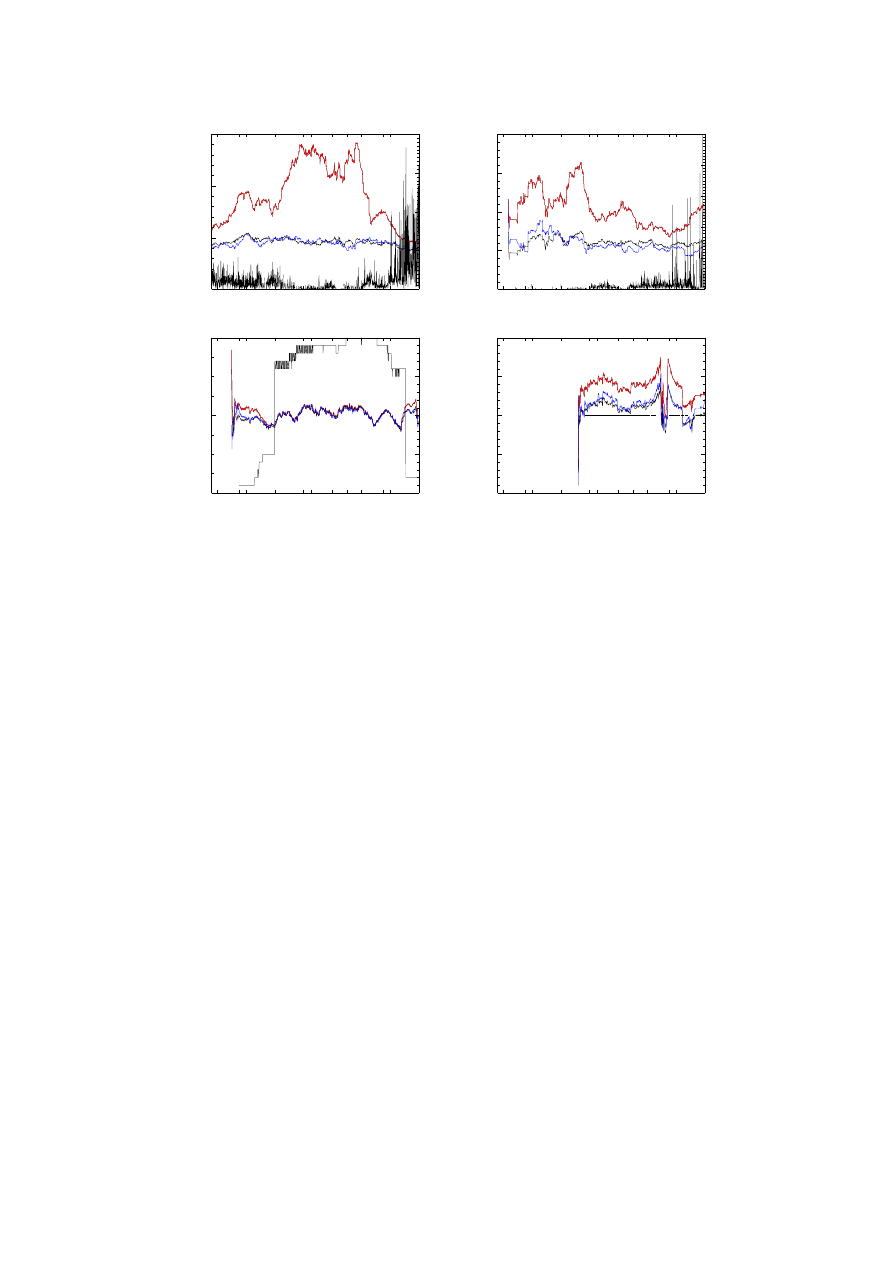
Figure 6: Effects of variance correction on grid-box standard deviation series for 4 sample locations.
Shown are uncorrected SD (red), corrected SD (blue), actual SD (black); also shown is the number
of obeservations
constant. Methods for this ‘variance correction’ have been developed for previous versions of HadCRUT
[7] but doubts have been expressed over their suitability, so we want to test and perhaps simplify them.
We are testing this statistical method using a similar technique to the ‘pseudo-proxy’ method recently used
to investigate statistical problems in paleo-climate reconstruction [8]. We have taken surface temperature
data from an All-Forcings HadCM3 run, degraded it by removing data where we have no observations,
and added noise to mimic the noise expected in HadCRUT. This gives us a ‘pseudo-instrumental’ dataset,
where each grid-box shows variance fluctuations of the kind seen in the instrumental data. If we apply
our variance correction methods to this dataset, and they work correctly, we should recover the original
model data. So by comparing the corrected pseudo-instrument data with the model data we can test the
effectiveness of our statistical processing.
The results of this test are encouraging, the correction process introduces no biases into the temperature
trends, and makes a good job of removing the artificial variance fluctuations. Reconstructed variances
are very close to the original variances, the change in variance is typically a reduction of up to 50%, to
within a few % of the correct value.
Figure 6 shows the results of this test in four sample grid-boxes (2 sea and 2 land). The time-series of
standard deviation from the original model data is the black curve, the uncorrected pseudo-instrumental
data gives the red curve, and the variance corrected pseudo-instrumental data the blue curve.
3.5.2
Optimum averaging
Instrumental datasets have incomplete global coverage, especially in the 19
th
and early 20
th
centuries. In
spite of this, we want to make estimates of global and regional temperature anomalies. We do this by
optimum averaging (OA) [5], a process which first estimates the local covariability of the data, and then
7

uses this covariance information to estimate values for regions with missing data, and so their contribution
to the global average. We intend to test this process also on the pseudo-instrumental data: if the OA
method is working, the OA of the pseudo-instrumental data will be the close to the simple average of the
(spatially complete) model data. So we will be able to check that the OA technique is not introducing
biases.
4
Summary
We are making good progress towards the production of an updated version of the global historical surface
temperature dataset HadCRUT. This new version will be based on improved observational data, will have
comprehensive error estimates, and will have associated local and global average time-series that are
produced using fully tested methods.
References
[1] Jones, P. D., (1994), Hemispheric surface air temperature variations: A re-analysis and an update
to 1993, J. Clim., 7, 1794–802.
[2] Jones, P. D., and A. Moberg (2003), Hemispheric and Large-Scale Surface Air Temperature Varia-
tions: An Extensive Revision and an Update to 2001, J. Clim., 16, 206–23.
[3] Rayner, N. A., P. Brohan, D. E. Parker, C. K. Folland, J. Hardwick, J. Kennedy, M. Vanicek, T.
Ansell, S. F. B. Tett and E. C. Kent (2005), Improved analyses of changes and uncertainties in
marine temperature measured in situ since the mid-nineteenth century, To be submitted to J. Clim..
[4] Simmons, A. J., P. D. Jones, V. da Costa Bechtold, A. C. M. Beljaars, P. W. K˚
allberg, S. Saarinen,
S. M. Uppala, P. Viterbo and N. Wedi (2004), Comparison of trends and low-frequency variability in
CRU, ERA-40 and NCEP/NCAR analyses of surface air temperature, J. G. R., 109, D24115.
[5] Folland, C. K., N. A. Rayner, S. J. Brown, T. M. Smith, S. S. P. shen, D. E. Parker, I. Macadam,
P. d. Jones, R. N. Jones, N. Nichols and D. M. H. Sexton (2001), Global temperature change and
its uncertainties since 1861, G.R.L, 28, 13, 2621–24.
[6] Jones, P. D., T. J. Osborn, and K. R. Briffa (1997), Estimating Sampling Errors in Large-Scale
Temperature Averages, J. Clim., 10, 2548–68.
[7] Jones, P. D., T. J. Osborn, K. R. Briffa, C. K. Folland, E. B. Horton, L. V. Alexander, D. E.
Parker and N. A. Rayner (2001), Adjusting for sampling density in grid box land and ocean surface
temperature time series, J. G. R., 016, D4, 3371–80.
[8] von Storch, H. E. Zorita, J. Jones, Y. Dimitriev, F. Gonzlez-Rouco and S. F. B. Tett (2004),
Reconstructing Past Climate from Noisy Data, Science, 306, 5696, 679–82.
8
Wyszukiwarka
Podobne podstrony:
PNADD523 USAID SARi Report id 3 Nieznany
Ludzie najsłabsi i najbardziej potrzebujący w życiu społeczeństwa, Konferencje, audycje, reportaże,
REPORTAŻ (1), anestezjologia i intensywna terapia
Reportaż
Raport FOCP Fractions Report Fractions Final
reported speech
Reportaże telewizyjne
daily technical report 2012 10 03
Hydrostatics reportzaj
Reportaż- Gatunki dziennikarskie, magisterka, magisterka
EC08 Daily Report 18 July (Revision 1)
peace education report
CRU COF Report
Instr obslugi CipherLab CPT720 v02 20050308 INWENTARYZATOR 1 30
happy planet index report
Assessment report
EC08 Daily Report 28 July (Revision 1)
więcej podobnych podstron