
Bundesamt für Energie BFE
Bundesamt für Umwelt BAFU
Bundesamt für Landwirtschaft BLW
LIFE CYCLE ASSESSMENT OF ENERGY
PRODUCTS:
ENVIRONMENTAL ASSESSMENT OF BIOFUELS
- Executive Summary -
Rainer Zah
Heinz Böni
Marcel Gauch
Roland Hischier
Martin Lehmann
Patrick Wäger
Empa
Technology and Society Lab
Lerchenfeldstrasse 5
CH-9014 St. Gallen, Switzerland
www.empa.ch/tsl
rainer.zah@empa.ch

Publication data
Rainer Zah, Heinz Böni, Marcel Gauch, Roland Hischier, Martin Lehmann & Patrick Wäger (Empa):
Life Cycle Assessment of Energy Products: Environmental Assessment of Biofuels
Bern, 22nd May 2007
Produced under a contract from the Federal Office for Energy (BFE), the Federal Office for the
Environment (BFE) and the Federal Office for Agriculture (BLW):
Bruno Guggisberg (BFE)
Daniel Binggeli (BFE)
Lukas Gutzwiler (BFE)
Norbert Egli (BAFU)
Daniel Zürcher (BAFU)
Amira Ellenberger (BAFU)
Anton Candinas (BLW)
Reto Burkard (BLW)
Project Management:
Niels Jungbluth, ESU-services Ltd., Uster
Critical Reviewer:
Fredy Dinkel, Carbotech, Basel
English translation:
Thomas Ruddy
Full report (in german) available at:
The authors are exclusively responsible for the conclusions of this report.

Abstract
The objective of this study is to evaluate the environmental impact of the entire production chain of
fuels made from biomass used in Switzerland. Firstly the study supplies an analysis of the possible
environmental impacts of biofuels suitable as a basis for political decisions. Secondly an “environ-
mental life-cycle analysis“ (LCA) of the various biofuels is done, which can be used as a basis for
granting an exemption from the excise duty on hydrocarbon oil. In addition, the impacts of fuel use are
compared with other uses for bioenergy such as the generation of electricity and heat. The study
based on the Swiss database of environmental inventories ecoinvent gives a holistic comparison of
the environmental impacts of biofuels; however neither the costs of biofuels nor the social conse-
quences of their production are evaluated. The results refer to average values from the year 2004 in
the respective production countries and are to be taken as a snapshot of factors relevant to the fuels’
use in Switzerland. Thus the study cannot provide any answers to questions concerning future impacts
– for instance, on food prices.
In principle, each of the fuels examined (bioethanol, biomethanol, biodiesel and biogas) can be pro-
duced in an environmentally friendly way – it depends on what raw materials and production technolo-
gies are used. Most of the environmental impacts can be attributed to the agricultural cultivation of the
respective raw materials (feedstocks). The environmental impact from fuel processing is usually much
lower. The environmental impact from the transport from the production site to Swiss filling stations is
even less, even when the biofuels are produced overseas. The present study shows that with most
biofuels there is a trade-off between minimizing greenhouse gases (GHG emissions) and a positive
environmental LCA. It is true that GHG emissions can be reduced by more than 30% with a number of
biofuels. However most of these supply paths show greater impacts than petrol for various other envi-
ronmental indicators.
The environmental LCA was done using two different methods: one was the Swiss method of ecologi-
cal scarcity (Environmental Impact Points, UBP 06), which evaluates the difference between environ-
mental impacts and legal limits. The other one is the European Eco-indicator 99 method, which quanti-
fies the damage done to human health and ecosystems. Both methods show the same results: in the
case of tropical agriculture it is primarily the slashing and burning of rainforests that releases the larg-
est quantities of CO2, causes an in-crease in air pollution and has massive impacts on biodiversity. In
the moderate latitudes it is partly the lower crop yields, partly the intensive fertilizer use and mechani-
cal tilling of the soil that are the causes of a bad environmental evaluation. However unlike the case of
fossil fuels, the environmental impacts of biofuels can be greatly reduced by specific measures. The
study shows in sensitivity analysis how, for instance, a reduction in methane leakage can improve the
LCA of biogas production or what effect a prohibition of slash and burn would have on the LCA of bio-
diesel made from palm oil.
Overall, the results of the study show that any promoting of biofuels by a tax break, for instance, must
be done so as to target the best production paths. Not all biofuels per se can reduce environmental
impacts as compared to fossil fuels. Currently, of all the production paths investigated, it is especially
the use of biogenic wastes ranging from grass to wood that brings a reduction in environmental impact
as compared with petrol. Since the potential of domestic bioenergy today is limited – and will be so in
future – bioenergy will not solve our energy problems. However it if the available biomass is trans-
formed into energy in an efficient and environmentally friendly manner, while at the same time con-
sumption is reduced and energy efficiency in-creased, these alternative energy carriers can together
with other forms of renewable energy play a role in our future energy supply that should not be ne-
glected.
Environmental assessment of biofuels, R. Zah et al., Empa


Executive Summary
In connection with the worsening scarcity of fossil fuels and climate change the idea of using renew-
able energy is attracting interest both in the Swiss public eye and in industry. Fuels made from bio-
mass – so-called biofuels – are currently the most important form of renewable energy in road trans-
portation and could at least over the short to medium term take on a role in reducing greenhouse
gases and our dependency on fossil fuels.
In Switzerland therefore important political decisions have to be made against a background of giving
a tax break for renewable fuels as opposed to diesel and petrol.
Although biofuels from renewable resources exist, a wider range of environmental impacts may result
from their cultivation and processing than those from fossil fuels. These range from excessive fertilizer
use and acidification of soil to a loss of biodiversity caused by slash and burning rainforest. Besides
that, one should not forget that expanding agricultural energy production may lead to land use conflicts
with other land uses such as food production or the conservation of natural areas. Therefore energetic
efficiency and the attainable reduction in greenhouse gases should not be taken as the sole criteria for
a holistic environmental evaluation of these alternative fuels.
The objective of this study is to evaluate the environmental impacts in the whole process chain of bio-
fuels used in Switzerland. Firstly an action-oriented analysis of the environmental impacts of renew-
able energy carriers was to be developed. Secondly the objective was to draw up a “comprehensive
environmental analysis” of the various biofuels, which could serve as a basis for enforcing the exemp-
tion of renewable fuels from the excise duty on hydrocarbon oil. In addition, the effects of using the
fuel were to be compared with other ways to use bioenergy, such as heat and power generation.
Methodology
In order to determine the effects of biofuels on the environment as exactly as possible, the methodol-
ogy of life cycle assessment (LCA) was chosen. That entails evaluating the energy and resource con-
sumption and all pollutant emissions over the entire life cycle needed to satisfy a defined function (e.g.
filling up a car tank with 1 MJ of energy at a Swiss filling station). The necessary inventory data for
biofuels were collected in an initial subproject and complemented by additional data from the Swiss
environmental inventory database (ecoinvent 1.3). The impacts on the environment were then first
determined with the aid of action-oriented indicators, which described the direct environmental im-
pacts and suggested to us ways to deal with them. Secondly an environmental overall assessment
was done, during which the individual damaging effects were weighted and aggregated, so that all
environmental impacts could be assessed (see Figure 1). It was important to remember that the ag-
gregated evaluation methods (in this study Environmental Impact Points
, UBP 06, and eco-indicator
99
) included their own relative weighting factors for the various environmental impacts (e.g. the
greenhouse effect versus excessive fertilizer use). For political discussion it is therefore important not
to rely solely on the overall evaluation, but rather on a case-by-case basis to include the individual
action-oriented indicators it is based on.
The study covered renewable energy forms both from Switzerland and foreign production; however
Switzerland was always taken the place of utilization. The assessment was done on a cradle-to-grave
basis; i.e. all relevant environmental impacts from biomass cultivation, from the occurrence of a bio-
genic waste substance to its energetic utilization. The year 2004 was chosen as the main observation
period, although in some cases we had to rely on older or newer data.
I
1
The method of ecological scarcity (UBP 06). The mass unit consists of environmental impact points. This Swiss method
estimates the total environmental impact from the difference between emission values and the legal limits.
2
A fully aggregated environmental evaluation method based on the proliferation and damaging effects of emissions.
Environmental assessment of biofuels, R. Zah et al., Empa
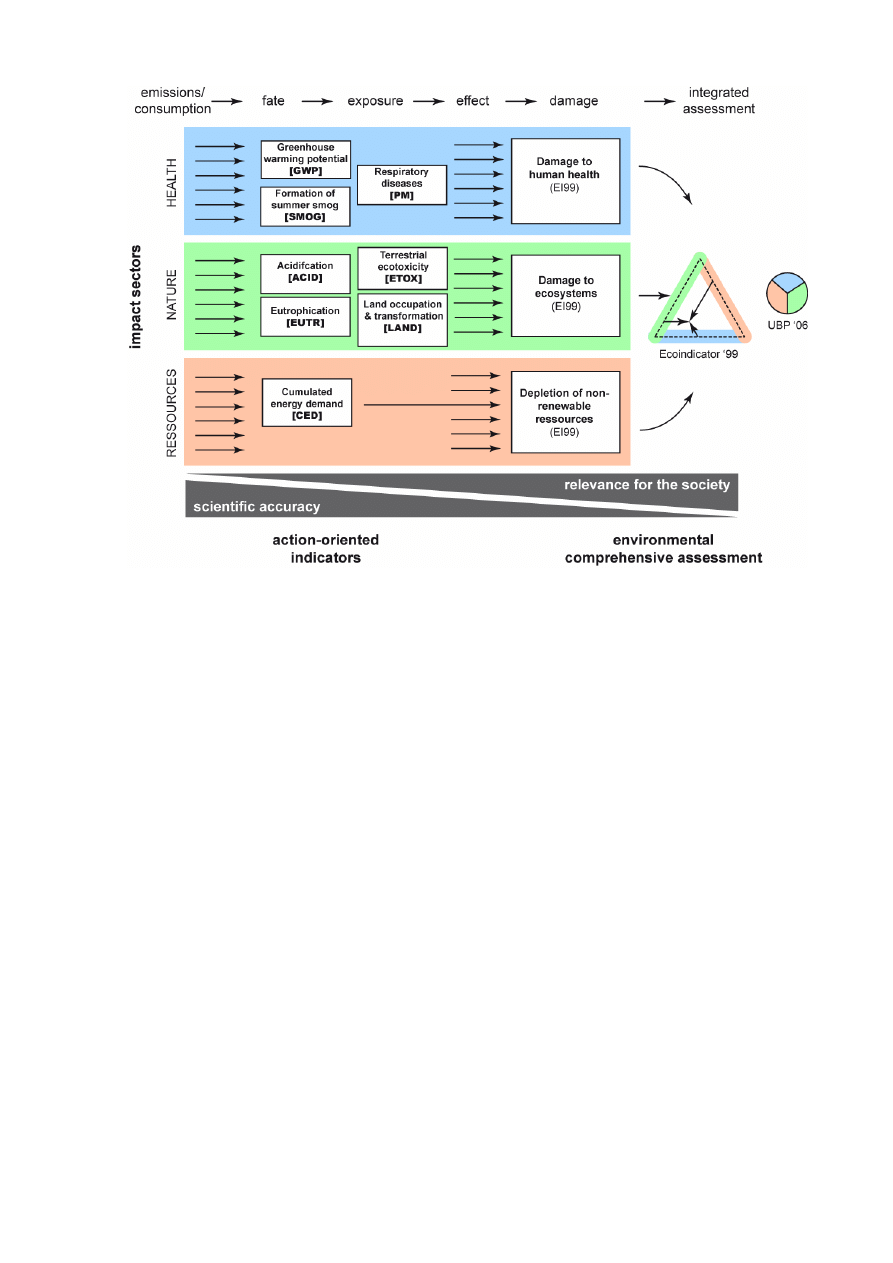
Figure 1
Schematic diagram of the environmental indicators used in the study along the path of proliferation
and causation
One important aspect in analysing renewable resources is the inclusion of co-products. During the
production of the products examined in this study there are co-products on various production stages
which required us to allocate the environmental impacts onto multiple products. Thus it was necessary
e.g. to distribute the raw material inputs and environmental impacts from the pressing of rapeseed
grains over the two resulting products rapeseed oil and rapeseed cake. This allocation was done dur-
ing the preceding data collection according to economic criteria in most cases, i.e. environmental
emissions were distributed in the same proportion as the revenue obtained from each of the products.
Limitations of the study
The methodology does provide a holistic comparison of bioenergy forms considering the whole pro-
duction chain. However the approach suffers from the following limitations as regards the interpreta-
tion of results:
-
The methodology of life cycle assessment (LCA) analyses the environmental impacts of material
and energy flows. That does not include any results pertaining to economic factors such as e.g.
costs or social factors such as e.g. child labour.
-
Although the LCA approach used here is very comprehensive, certain environmental impacts are
covered only incompletely or not at all. For example, the effects of water utilization are not cov-
ered because they differ a lot depending on local conditions (the quantity of precipitation, ground-
water level, etc.). Biodiversity losses are also incomplete because the data basis is lacking on
tropical ecosystems.
-
The assessment approach calculated only the primary environmental impacts of the process
chain, e.g. energy consumption and pollutant emission during the cultivation of energy rapeseed.
Secondary effects, though, were not covered. (For instance, food was grown beforehand on the
energy rapeseed field. Afterwards food had to be imported causing additional transports, and thus
additional environmental impacts.)
-
No distinction is made with cultivation biomass (e.g. grain or potatoes) between harvest wastes
and biomass produced specifically for fuel production. Nor does the method differentiate between
the use of already cultivated fields and newly cultivated fallow fields, and thus neglects the envi-
II
Environmental assessment of biofuels, R. Zah et al., Empa

ronmental impacts associated with them as well, such as a reduction in biodiversity in the latter
case.
-
On the basis of the data from existing Life Cycle Inventory Analysis (LCIA) most of the results
refer to existing process chains, and thus cover Reference Year 2004; future developments are
not judged. However a glimpse of future developments is provided by the sensitivity analyses and
possible optimization potentials.
-
Since many allocations have been calculated from sales revenue, and revenue depends on mar-
ket dynamics, the results of this study are not “chiseled in stone” and may have to be verified at
some later point in time.
-
The process chains investigated represent only a subset of all production processes; many more
production paths are conceivable. The paths chosen, however, are considered especially relevant
for the current situation in Switzerland.
-
The data from existing LCIA represent average condition in the respective production countries
(Switzerland, Europe, Brazil, USA, etc.) and apply as an integral whole as regards use in Switzer-
land. Therefore the results may not be applied without qualification to decision situations in partial
regions or individual plants, because the environmental impacts in individual cases may differ
radically from the average situation.
-
The study gives no answers the question as to the future consequences of a shift to renewable
fuels, e.g. the consequences for the environment if agricultural products were to be grown on
such a large scale for energetic utilization that agricultural production as a whole had to be inten-
sified, or as to any possible rebound effects
in case an increase in fuel consumption should re-
sult from the introduction of biofuels because biofuels were regarded in the eyes of consumers as
“environmentally friendly”, and thus as unproblematic.
How are environmental impacts distributed along the value chain?
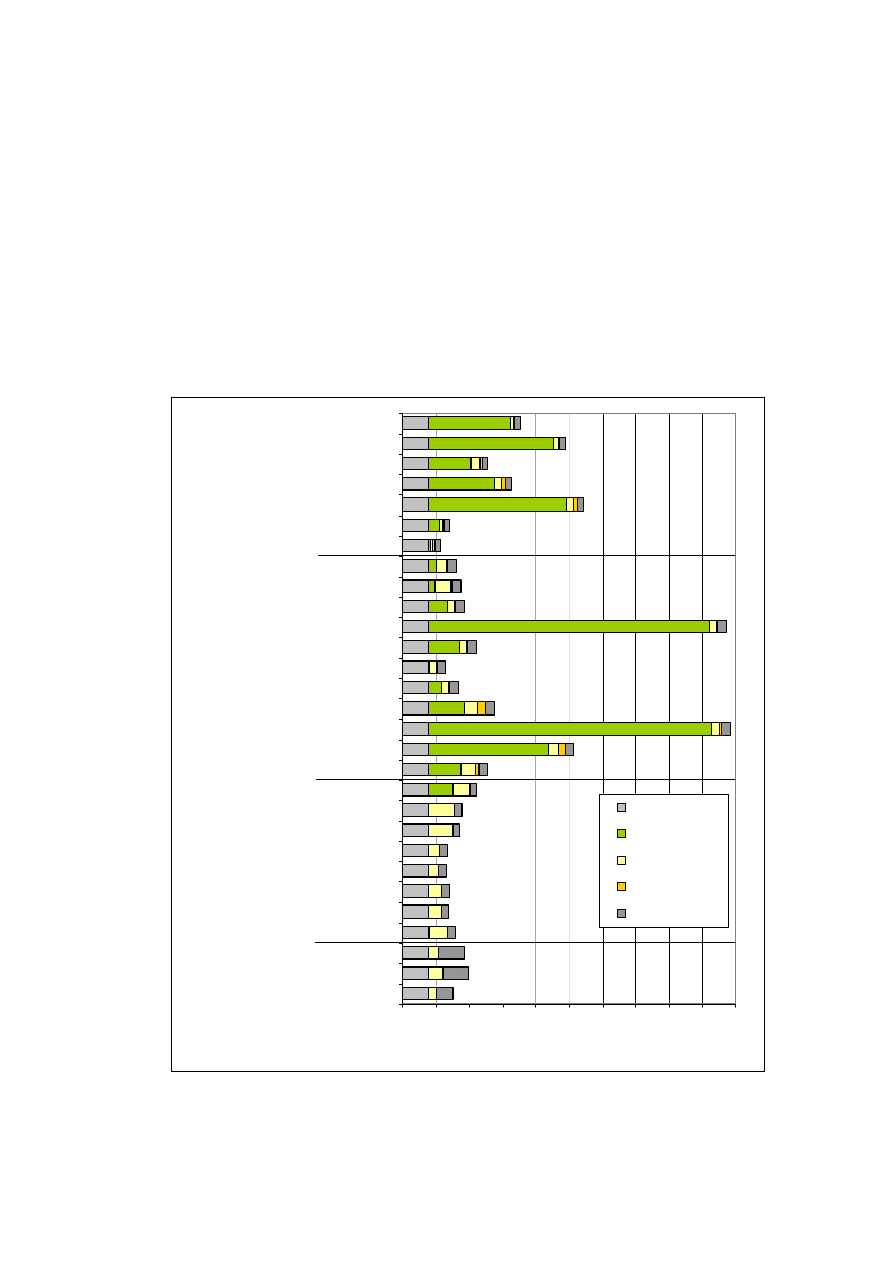
Figure 2 provides a chart of how greenhouse gas emissions (GHG emissions) are distributed along
various production chains for bioethanol, biodiesel, methanol and methane.
The figure shows that
savings of up to 80% are possible as compared with fossil fuels depending on the biofuel and produc-
tion path. However large differences arise along the production chain:
-
The largest percentage of GHG emissions comes from agricultural cultivation (Figure 2, green)
through the use of machines, fertilizer and or pesticides, and also in the form of direct emissions
(such as nitrous oxide). By the same token however, this percentage can be varied a lot. The most
important factors for agricultural GHG emissions are yield per area (high in the cases of Swiss
sugar beets or Brazilian sugar cane, but low in the case of Swiss potatoes or rye RER), emission of
nitrous oxide (comprising 30% in the case of US maize) and the slash-burning of rainforest (rele-
vant with Malaysian palm oil and Brazilian soy oil). The regional differences in the intensity of de-
forestation can have a relevant effect on the overall result. The main factor is the way in which en-
ergy plants are cultivated. This applies not only to GHG emissions but also to the most of the other
environmental impacts of biofuels as well. Unlike agricultural products, waste and leftover materials
require no energy to be reused; this has a very positive effect on their overall balance. Thus the
lowest overall GHG emissions are attainable when using biodiesel made from waste cooking oil or
methane from liquid manure.
-
The fuel production itself (Figure 2, yellow) causes on average much lower GHG emissions than
agricultural cultivation. Biodiesel requires only low emissions during extraction and esterification.
During the fermentation of bioethanol the emissions can be varied a lot because either fossil en-
ergy carriers have been used (bioethanol from American maize) or waste from agricultural produc-
tion is used as process energy (bagasse in the case of Brazilian sugar cane). The highest GHG
emissions in the production process are set fee during the production of biogenic methane. The
causes for this are the methane and nitrous oxide emissions during the secondary fermentation of
the residue and the methane leakage during the processing step from biogas to methane 96% by
III
3
A rebound effect occurs whenever an efficiency gain causes an increase in consumption, and the latter destroys the advan-
tages of the efficiency gain.
4
Biogenic ETBE was also looked at in this study. However because it is similar to ethanol as regards its environmental im-
pacts, the main difference being that it has a lower CO2 reduction effect because only about half of ETBE is based on bio-
mass, it has not been represented separately in this Executive Summary.
Environmental assessment of biofuels, R. Zah et al., Empa
volume. Figure 2 shows, though, that for instance in the case of liquid manure much of these
emissions can be reduced by taking care to cover the secondary fermentation container.
This
covering up has already become state-of-the-art as of 2007.
-
Fuel transport per se (Figure 2, orange) from the production regions to the Swiss filling station
usually comprises much less than 10 % of overall emissions and plays only a secondary role from
an environmental standpoint – as long as the intercontinental transport is done with tank ships or in
pipelines.
- The
actual
vehicle operation (Figure 2, dark grey) is CO
2
-neutral in the case of the pure biofuels
compared here because all the CO
2
set free then was shortly before absorbed during plant growth.
-0.05
0
0.05
0.1
0.15
0.2
0.25
100% Rape M E CH
100% Rape M E RER
100% P almo il M E M Y
100% So y M E US
100% So y M E B R
100% Recycled plant o il M E CH
100% Recycled plant o il M E FR
M ethano l fixed bed CH
M ethano l fluidized bed CH
Ethano l grass CH
Ethano l po tato es CH
Ethano l sugar beets CH
Ethano l whey CH
Ethano l wo o d CH
Ethano l sweet so rghum CN
Ethano l rye RER
Ethano l co rn US
Ethano l sugar cane B R
M ethane grass bio refinery
M ethane manure
M ethane manure+co substrate
M ethane manure, o ptimized
M ethane manure+co substrate, o ptimized
M ethane bio waste
M ethane sewage sludge
M ethane wo o d
Diesel, lo w sulphur EURO3
P etro l, lo w sulphur EURO3
Natural gas, EURO3
CO2-eq. [kg/pkm ]
Infrastructure
Cultivation
Production
Transport
Operation
F
o
s
s
il
Bio
d
ie
s
e
l
A
lco
ho
l
Me
th
a
n
e
Figure 2
Comparison of the greenhouse gases emitted by biofuels in comparison to those emitted by fossil
fuels (petrol and diesel, EURO3). The emissions are broken down into the individual process of the
value chain.
- The
production and maintenance of vehicles and construction and maintenance of roads
(Figure 2, light grey) has also been dealt with in this study. However an identical vehicle and the
same annual mileage were assumed for all cases considered, yielding the same increment for all
5
The GHG emissions in the case of methane from liquid manure, optimized are negative because this case is based on the
difference between them and the emissions during agricultural output of the unfermented liquid manure.
IV
Environmental assessment of biofuels, R. Zah et al., Empa
variations. In the case of very efficient alternative fuels such as bioethanol from sugar cane or
methane from liquid manure this increment may comprise much more than half of all GGH emis-
sions.
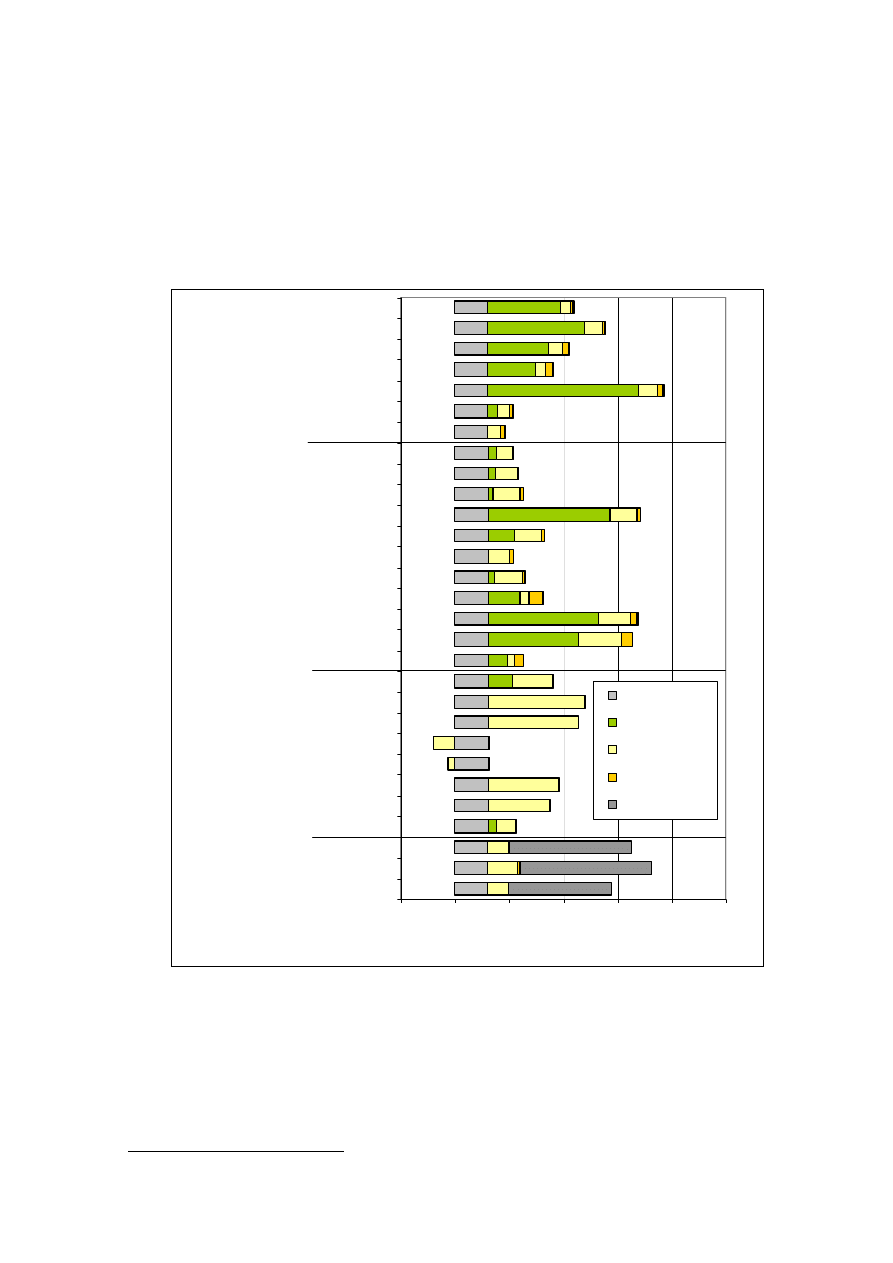
Figure 3 shows a different picture in which the whole environmental impact has been calculated using
the method of ecological scarcity (UBP 06). It is true that the environmental impacts of vehicle opera-
tion (dark grey) are much higher when fossil fuel is used in comparison to biofuels; however this is
overcompensated by the many very high environmental impacts in agricultural production. The causes
of this are soil acidification and excessive fertilizer use in European and Swiss agriculture. In the case
of tropical agriculture it is biodiversity loss, air pollution caused by slash-and-burn and the toxicity of
pesticides some of which are forbidden in Switzerland that comprise the essential causes of the se-
vere environmental impacts. The very high impact in the utilization of Swiss potatoes can be explained
by the great importance placed on nutrient leaching. The very high values for rye taken from European
production, on the other hand, can be explained by the low harvest yield of rye on an overall European
average.
0
100
200
300
400
500
600
700
800
900 1000
100% Rape M E CH
100% Rape M E RER
100% P almo il M E M Y
100% So y M E US
100% So y M E B R
100% Recycled plant o il M E CH
100% Recycled plant o il M E FR
M ethano l fixed bed CH
M ethano l fluidized bed CH
Ethano l grass CH
Ethano l po tato es CH
Ethano l sugar beets CH
Ethano l whey CH
Ethano l wo o d CH
Ethano l sweet so rghum CN
Ethano l rye RER
Ethano l co rn US
Ethano l sugar cane B R
M ethane grass bio refinery
M ethane manure
M ethane manure+co substrate
M ethane manure, o ptimized
M ethane manure+co substrate, o ptimized
M ethane bio waste
M ethane sewage sludge
M ethane wo o d
Diesel, lo w sulphur EURO3
P etro l, lo w sulphur EURO3
Natural gas, EURO3
UBP [Pt/pkm ]
Infrastructure
Cultivation
Production
Transport
Operation
F
o
s
s
il
Bio
d
ie
s
e
l
Al
c
o
h
o
l
Me
th
a
n
e
Figure 3
Comparison of aggregated environmental impact (method of ecological scarcity, UBP 06) of bio fuels in
comparison with fossil fuels (petrol, diesel and natural gas). The environmental impact is broken down
by individual processes of value chain.
V
Environmental assessment of biofuels, R. Zah et al., Empa

Should biofuels be imported from abroad?
Transporting biofuels from abroad to a Swiss filling station causes only a low percentage of the GHG
emissions (Figure 2), and individual imported biofuels such as bioethanol from Brazilian sugar cane
get a good environmental evaluation similar to that for the best domestic biofuels. The reason for this
is that transportation modes such as oceangoing tankers or pipelines are used that require relatively
small amounts of energy and cause only low pollutant emissions.
It is still questionable whether the import of biofuels on a large scale makes sense in the long run.
Firstly, the biofuels could be used in the countries of production, in order to lessen the dependence on
oil imports there; secondly, the great demand for biofuels has caused a rapid expansion of production
areas and thus also rising food prices and increased pressure on rainforest areas. As soon as the
slash-and-burn technique is used, the GHG balance and the whole LCA get much worse, thus making
importation questionable.
Which biofuels are the most environmentally friendly?
An integrated environmental assessment begins with summarizing many environmental indicators in
an appropriate way. That requires value judgments. The primary motivation for granting a tax exemp-
tion for biofuels comes from their potential to reduce GHG. Therefore the first environmental require-
ment for a fuel tax reduction is the quantity of GHG saved. This study has been based on the following
threshold values:
-
A GHG reduction of at least 30% as compared with the fossil reference (petrol,
EURO3
)
However these GHG reductions should not be had at the expense of some other form of environ-
mental impact, which may take various forms with biofuels. Therefore another important requirement
for an integrated environmental evaluation is the criterion:
-
No increasing impacts in other relevant environmental impacts as compared with
the fossil reference ( petrol, EURO3)
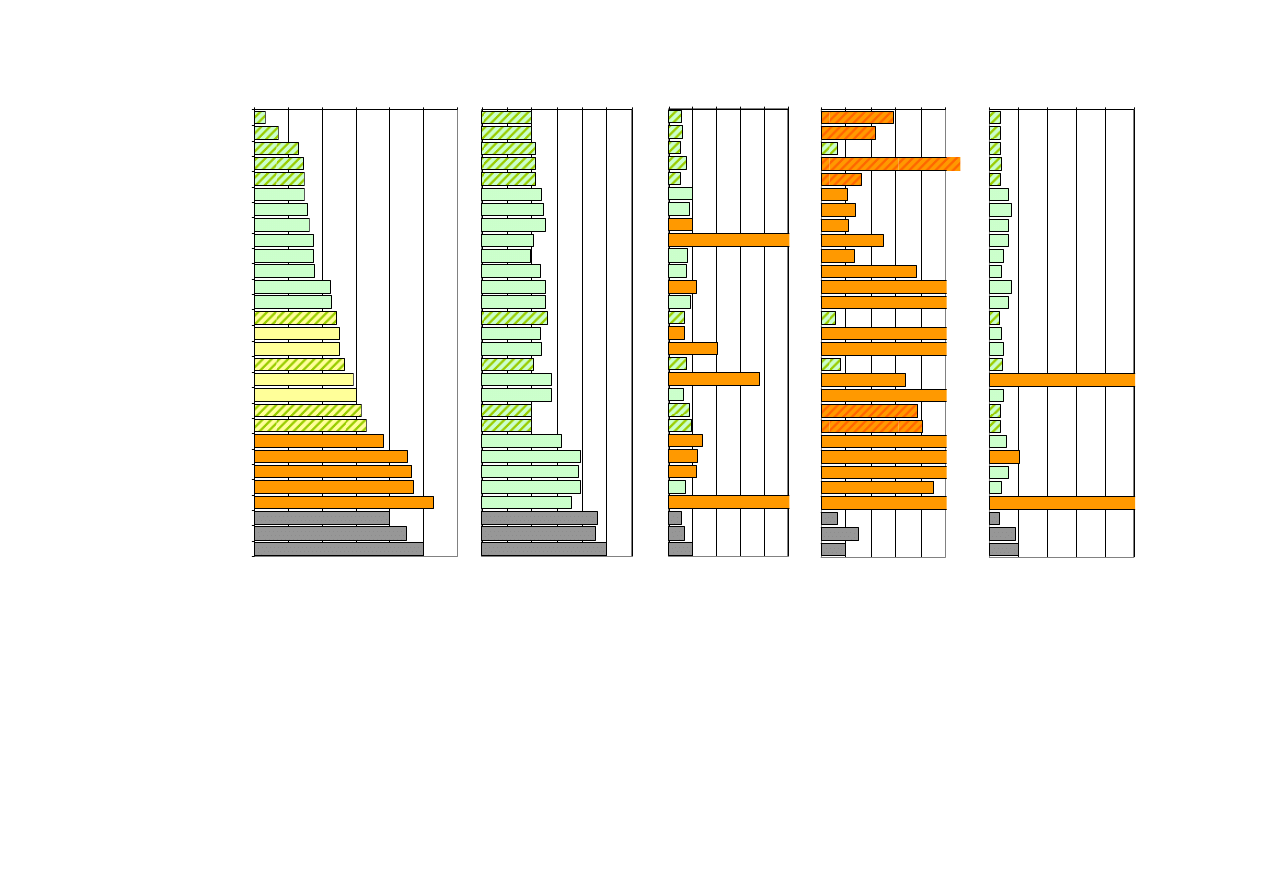
These two criteria were applied to the LCA of this study, as evident in Figure 4 (see the page after
next). It became apparent that 13 other various biofuels had GHG reductions of more than 50% and 5
of them were produced from waste materials. The largest reductions were attained with biofuels made
from liquid manure. The other fuels that had GHG reductions of more than 50% were: biodiesel made
from waste cooking oil, methanol and methane from wood and bioethanol from domestic biomass
(grass, wood, sugar beets or whey), Brazilian sugar cane and Chinese sorghum. 9 fuels (four of which
were from waste materials) still had a GHG reduction of more than 30%, one of them produced from
biodiesel made from various agricultural products (soy oil US, palm oil MY, rapeseed oil CH) and the
fermentation of various waste material to biogenic methane. The worst case was 5 alternative fuels
attaining less than 30% GHG reductions; an extreme one being Brazilian soy biodiesel, the emissions
of which turned out to even a little higher than those from petrol.
Whereas the Cumulated non-renewable Energy Demand (CED)
correlates with the GHG emissions,
the situation is different with the other environmental indicators. With the summer smog potential
(SMOG) it is especially the tropical alternatives that have high values because the cultivation areas
are often accessed by means of slash-and-burn or – in the case of bioethanol from sugar cane – the
dry leaves are burned off before the harvest. Excessive fertilizer use (EUTR) was higher, as had been
expected, by several factors in the cases of agricultural processes than in those of fossil fuels. In the
case of Brazilian sugar cane and with Malaysian palm oil it became apparent, however, that even
these factors can be kept low by using less fertilizer, and high crop yields can still be attained. Ecotox-
icity (ETOX) on the other hand shows peaks with cultures that are grown on slash-and-burn areas that
are due to the high toxicological evaluation of acetone emissions. The only biofuels investigated that
6
EURO 3 is the European pollutant standard for passenger cars that has been in force since Jan.2000. Since emissions are
compared with reference to mileage, it is necessary to define a pollutant standard.
7
Total quantity of non renewable energy needed for the production and supply of a product (in our case a biofuel).
VI
Environmental assessment of biofuels, R. Zah et al., Empa

VII
Environmental assessment of biofuels, R. Zah et al., Empa
stayed below the level of petrol in all environmental impacts tested here were methyl ester made from
waste cooking oil and methane from sewage and biowaste.
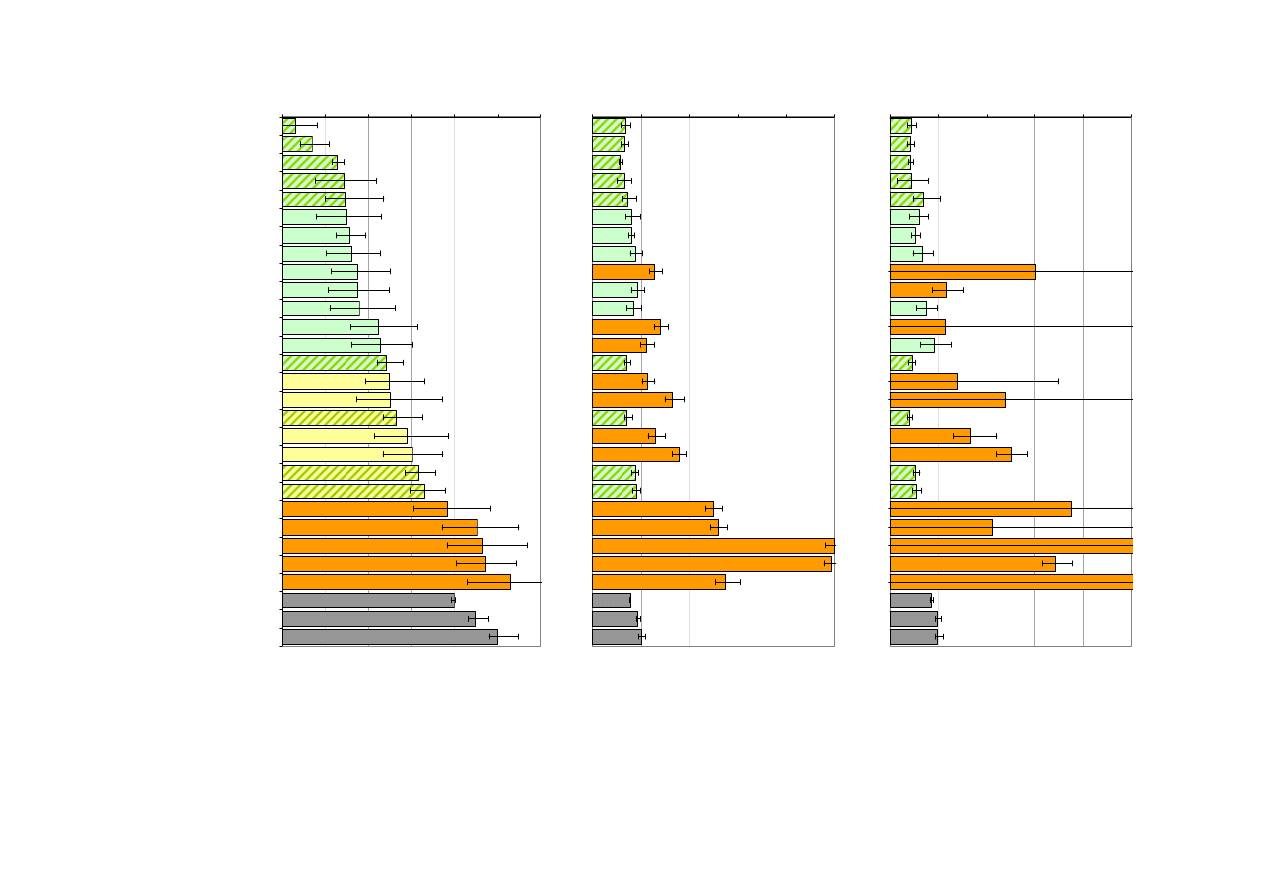
Because of the environmental impacts caused by agricultural cultivation the overall evaluation (Figure
5) of Swiss bioethanol production from whey shows an overall impact that is reduced by up to 30%
(UBP 06) or 50% (Eco-indicator 99) depending on the test method. The other domestic supply paths
for bioethanol show the same or even better values than petrol in the overall evaluation. An overall
evaluation reduced by up to 30% (UBP 06) or 50% (Eco-indicator 99) can also be obtained with the
production and use of biogenic methane, although in some cases the GHG emissions are increased
due to methane leakage. Figure 5 shows the confidence interval in which 95% of all values lie. This
confidence interval covers only the risks in the gathering of the inventory data (for instance, when es-
timating energy consumption) and the risks inherent in the evaluation methodology (e.g. the probability
that cancer would develop given the emission of a certain quantity of carcinogenic substances). The
risks are relative small, especially when using the UBP methodology, but also with the estimation of
GHG emissions, and cause a change in the evaluation (from green to red or vice versa) only in special
cases. On the other hand the risk is very high with all agricultural processes in the Eco-indicator 99-
evaluation. The cause of that is the evaluation of land use, which – primarily for methodological rea-
sons – bears a high risk.
Figure 6 and Figure 7 summarize the GHG emissions and overall environmental evaluation of all fuels
studied. The green area means a better evaluation than the fossil reference both as regards GHG
emissions and in the overall environmental evaluation. The figures show on the one hand that there
are production paths for all fuels in the green area; on the other hand, most of those “green” produc-
tion paths are based on waste materials and residue. Bioethanol from Brazilian sugar cane shows
very different evaluations depending on whether UBP 06 or Eco-indicator 99 was used. The cause of
this is the pesticide Daconate, which contains a lot of arsenic, a chemical in this study only to be found
in the inventory of sugar cane cultivation and that causes high ecotoxicology readings when evaluated
using Eco-indicator 99. The great differences in bioethanol from potatoes can be explained, on the
other hand, through the great importance attached to nutrient leaching in the UBP 06 method.
GWP
0%
20%
40%
60%
80%
100%
120%
Methane manure, optimized
Methane manure+cosubstrate, optimized
100% Recycled plant oil ME FR
Ethanol w hey CH
100% Recycled plant oil ME CH
Methanol f ixed bed CH
Methane w ood
Methanol fluidized bed CH
Ethanol sugar cane BR
Ethanol grass CH
Ethanol w ood CH
Ethanol sw eet sorghum CN
Ethanol sugar beets CH
Methane sew age sludge
Methane grass biorefinery
100% Soy ME US
Methane biow aste
100% Palmoil ME MY
100% Rape ME CH
Methane manure+cosubstrate
Methane manure
100% Rape ME RER
Ethanol corn US
Ethanol rye RER
Ethanol potatoes CH
100% Soy ME BR
Natural gas, EURO3
Diesel, low sulphur EURO3
Petrol, low sulphur EURO3
CED
0%
20%
40%
60%
80% 100% 120%
SMOG
0%
100% 200% 300% 400% 500%
EUTR
0%
100% 200% 300% 400% 500%
ECOTOX
0%
100%
200%
300%
400%
500%
Figure 4
Overall environmental Life Cycle Assessment of all unblended biofuels studied in comparison to fossil reference. GWP = greenhouse warming potential,
CED = cumulated non-renewable energy demand, SMOG = summer smog potential, EUTR = excessive fertilizer use, ETOX = ecotoxicity. Reference ( = 100%) is petrol
EURO3 in each case. Biofuels are shown in diagram at left ranked by their respective GHG emission reductions. Fuels that have a total GHG emission reduction of more
than 50% as versus petrol are shown in green, those with GHG emissions reductions of more than 30% are yellow, those with GHG emissions reductions of less than
30% are red. In other diagrams green = better than reference; red = worse than reference. Cross-hatched fields = production paths from waste materials or residue.
VIII
Environmental assessment of biofuels, R. Zah et al., Empa
IX
Environmental assessment of biofuels, R. Zah et al., Empa
UBP 06
0%
100%
200%
300%
400%
500%
Eco-indicator 99
0%
100%
200%
300%
400%
500%
GWP
0%
20%
40%
60%
80%
100%
120%
Methane manure, optimized
Methane manure+cosubstrate, optimized
100% Recycled plant oil ME FR
Ethanol w hey CH
100% Recycled plant oil ME CH
Methanol fixed bed CH
Methane w ood
Methanol fluidized bed CH
Ethanol sugar cane BR
Ethanol grass CH
Ethanol w ood CH
Ethanol sw eet sorghum CN
Ethanol sugar beets CH
Methane sew age sludge
Methane grass biorefinery
100% Soy ME US
Methane biow aste
100% Palmoil ME MY
100% Rape ME CH
Methane manure+cosubstrate
Methane manure
100% Rape ME RER
Ethanol corn US
Ethanol rye RER
Ethanol potatoes CH
100% Soy ME BR
Natural gas, EURO3
Diesel, low sulphur EURO3
Petrol, low sulphur EURO3
Figure 5
Overall environmental Life Cycle Assessment of all unblended biofuels studied in comparison to fossil reference. GHG emissions reductions of more than 30% are
yellow, GHG emissions reductions of less than 30% are red. In other diagrams green = better than reference; red = worse than reference. Cross-hatched fields = produc-
tion paths from waste materials or residue. Error bar = 2.5 % / 97.5 % percentiles calculated using Monte Carlo simulation.
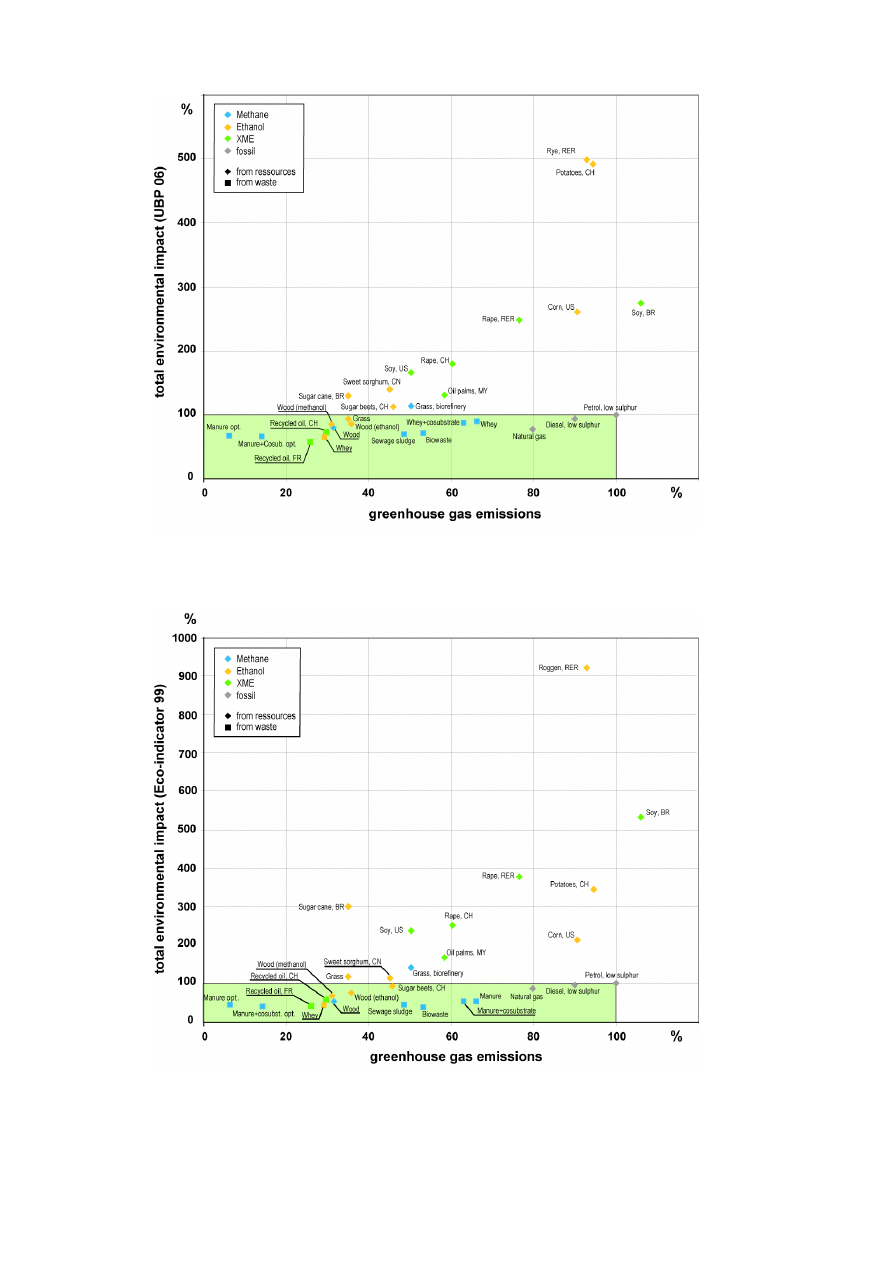
Figure 6
Two-dimensional representation of GHG emissions and overall environmental impact (UBP 06). Values are
relative to fossil reference petrol. Green area means both lower GHG emissions and lower overall environ-
mental impact than petrol.
Figure 7
Two-dimensional representation of GHG emissions and overall environmental impact (Eco-indicator 99). Val-
ues are relative to fossil reference petrol. Green area means both lower GHG emissions and lower overall envi-
ronmental impact than petrol.
X
Environmental assessment of biofuels, R. Zah et al., Empa
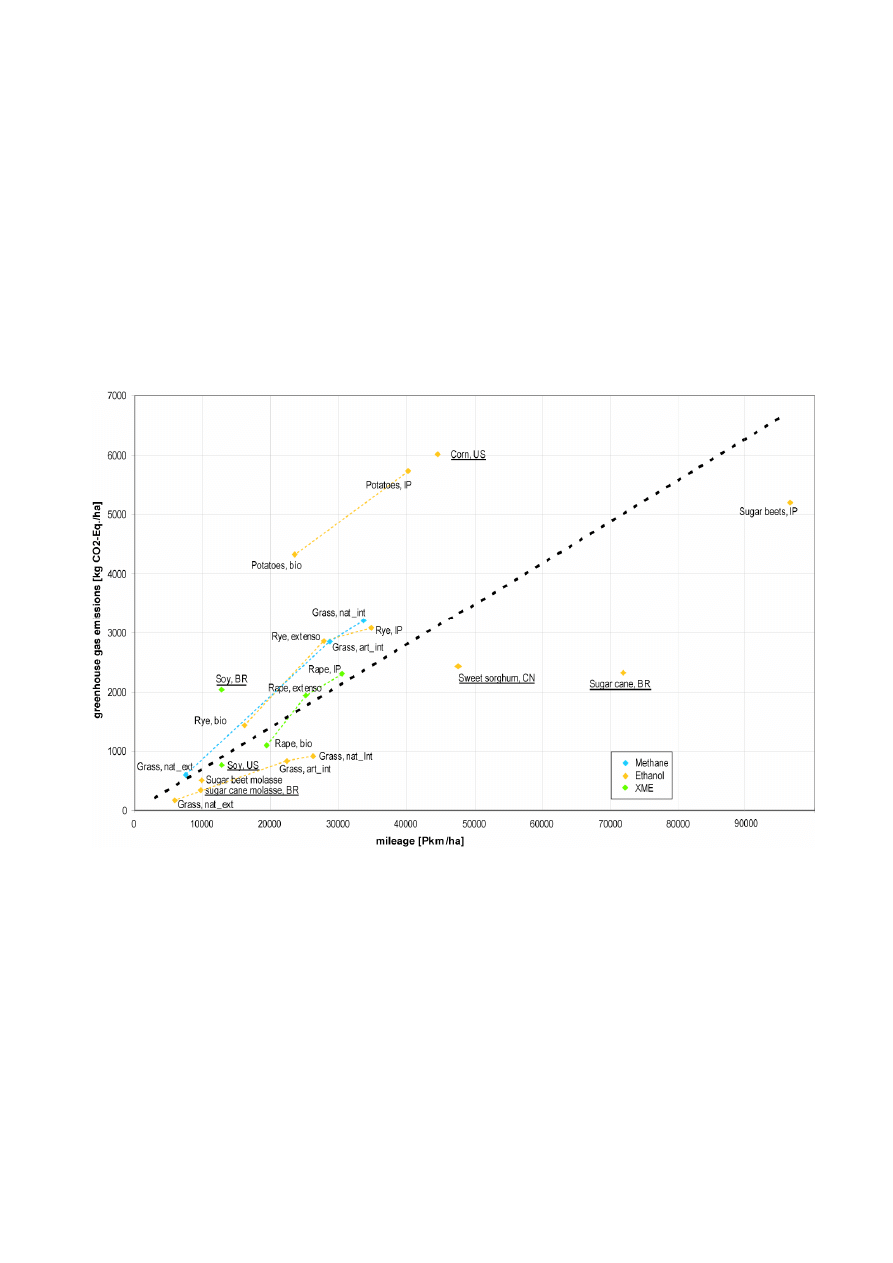
How high are the environmental impacts of fuel production per land unit?
Figure 8 shows the GHG emissions per hectare and year in comparison to the mileage that can be attained
with the biomass grown on that hectare. The figure reveals great differences in agricultural cultivation, both
as regards energy yield and GHG emissions.
The highest mileage can be attained with bioethanol from domestic sugar beets. The sugar beets give about
the same hectare yield as Brazilian sugar cane (approx. 70 t/a), but have a slightly higher saccharose con-
tent than sugar cane because of the much lower fiber content. If one compares the mileage / ha with the
GHG potential/ha, Brazilian bioethanol shows the greatest distance from the correlation line and thus the
best ratio.
When one takes the cultivation forms “IP“, “extenso“ and ”bio“ among domestic agricultural products, there
are lower GHG emissions obtainable with potatoes, rye, grass and rapeseed in extensive cultivation; how-
ever the mileage declines in a similar way, so no clear preferences can be seen.
Figure 8
Two-dimensional representation of mileage and GHG impact per hectare for various energy plants. Black
dotted line represents mean value (linear regression). Colored dotted lines connect various cultivation forms
of respective products. Underlined = foreign product.
XI
Environmental assessment of biofuels, R. Zah et al., Empa
Which energetic utilization is the most environmentally friendly?
Biogenic energy carriers such as wood, biogas or ethanol can be used for purposes other than fuel; they can
also be used for heat and / or electric power, for instance. Not all these utilization possibilities are equally
advantageous when seen from an environmental perspective because they involve different percentages of
conventional energy carriers, many of them fossil. Therefore in this study we asked in a second stage what
energetic utilization is the most environmentally friendly? This entailed calculating the resulting net utility for
various biogenic energy carriers using the following formula:
Net utility =
environmental impact avoided by using substitutes for fossil energy carriers
-
environmental impact (produced)
by using biogenic energy carrier XY
The functional unit for these tests was a certain quantity of biogenic energy carrier (for instance, 1 kg of
whey). This quantity yielded a certain quantity of energy to be used as heat, electric power or transportation.
The environmental impacts of this quantity of energy and the quantity of fossil energy it is substituted for
were calculated using the above formula, and then the net utility.
It was not possible within the scope of the present study to analyse all the ways that biogenic energy carriers
can be used; instead this study has been limited to those cases for which specific data were gathered in the
first part of the project including the utilization possibilities contained in the database ecoinvent. The study
was limited to a comparison with those energy carriers that are common today, i.e. primarily fossil energy
carriers.
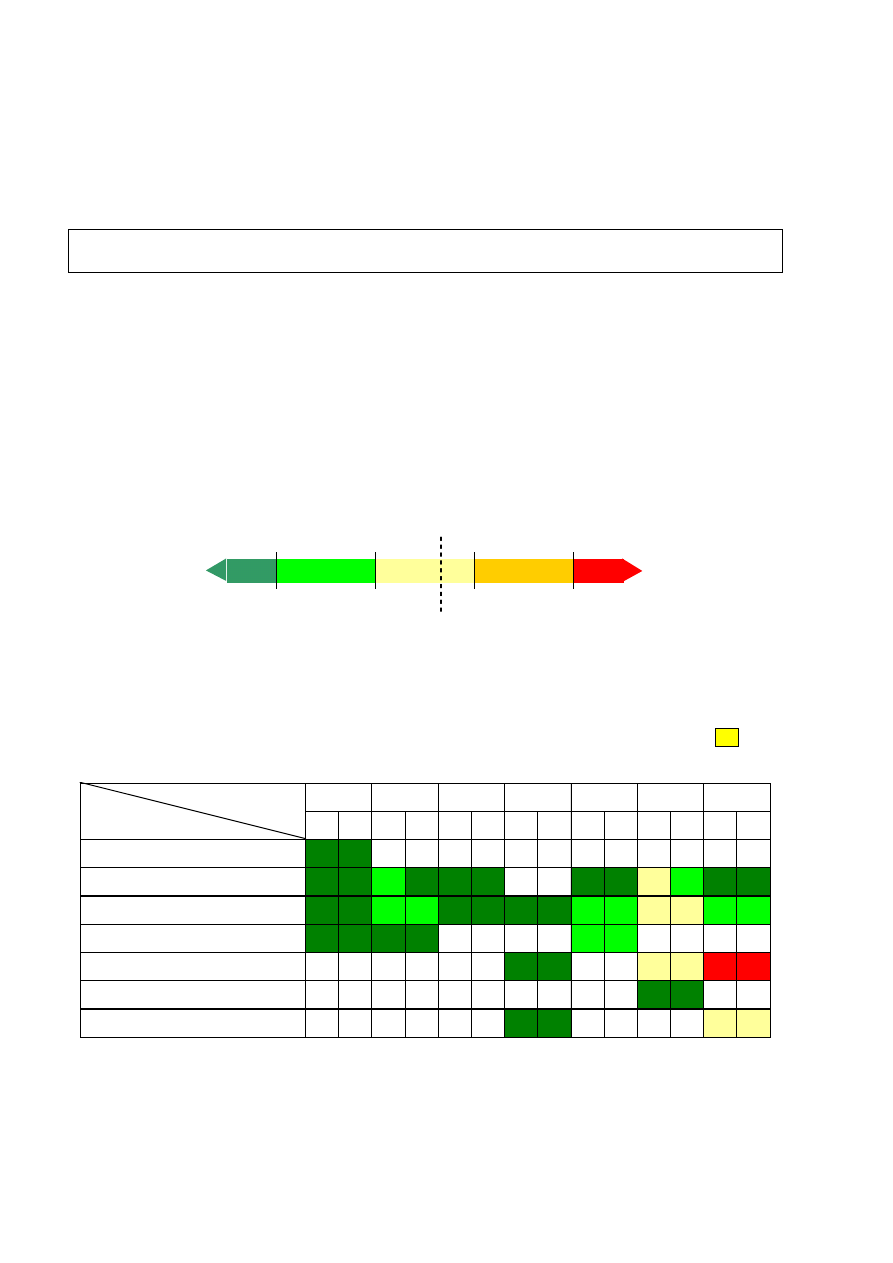
Below you will find the results of the utility comparison for the stages Global Warming Potential (GWP) and
the overall evaluation (using Eco-indicator ’99 and the method of ecological scarcity, Version 2006) of all
energy carriers tested. The following color scheme has been used to represent this summary:
50%
125%
-25%
-100%
--
++
+
~
-
0%
This scale shows how high the utility of a biogenic secondary energy carrier is in comparison to its environ-
mental impact. Since the primary interest is on a positive net utility, a scale has been used that is 25%
asymmetrical. (Calculation example: 1 kg of biowaste as fuel yields a net utility given a GWP of 0.13 kg CO
2
-
Eq. The requirement for fermenting biowaste to methane is 0.39 kg CO
2
-Eq. Thus the calculation follows:
0.13 kg/0.39 kg, corresponding to 33% and thus yielding a result according to the scale above of ~ for the
range “-25% to +50%“).
energy carrier
use path
m in
m ax
m in
m ax
m in
m ax
m in
m ax
m in
m ax
m in
m ax
m in
m ax
++ ++
++ ++
+
++ ++ ++
++ ++
~
+
++ ++
++ ++
+
+
++ ++ ++ ++
+
+
~
~
+
+
++ ++ ++ ++
+
+
++ ++
~
~
--
--
++ ++
++ ++
~
~
Sewage
sludge
Wood
Manure
Waste
w ood
Whey
Grass
Biow aste
Cem ent kiln
Municipal solid w aste incineration
"latest technology"
Municipal solid w aste incineration
"average technology"
Car (ethanol)
Car (m ethane)
Cogeneration (CHP)
Heating
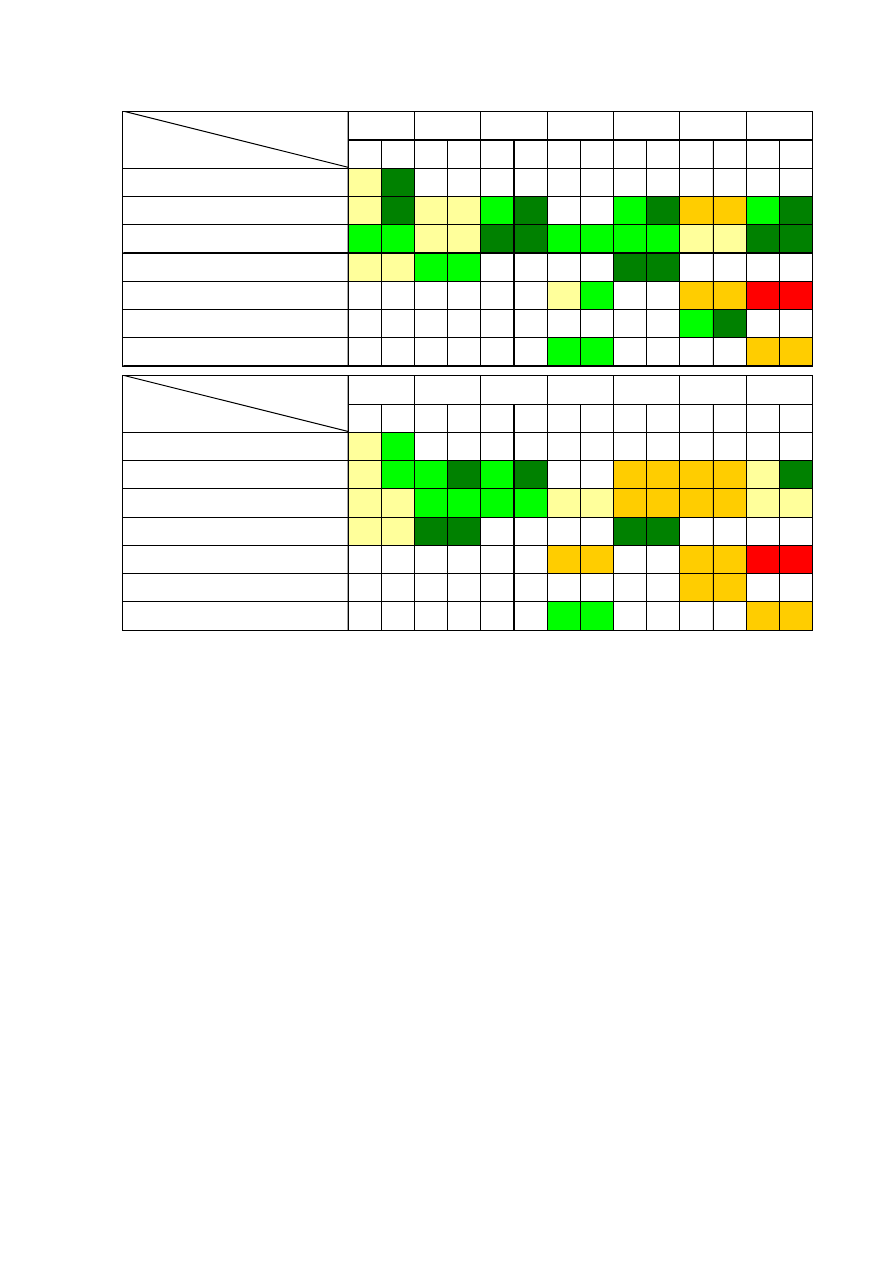
Figure 9
Net utility in relation to Global Warming Potential. Table shows all variations investigated in Chapter 4, where
utility is plotted relative to environmental impact of biogenic secondary energy carrier (see text for explana-
tions). Chapter 4 investigated two scenarios for production of conventional electrical power and heat respec-
tively – causing net utility to fall somewhere between a minimal (“Min” column) and maximal value (“Max” col-
umn). White fields indicate variations not investigated.
XII
Environmental assessment of biofuels, R. Zah et al., Empa
energy carrier
use path
m in
m ax
m in
m ax
m in
m ax
m in
m ax
m in
m ax
m in
m ax
m in
m ax
~
++
~
++
~
~
+
++
+
++
-
-
+
++
+
+
~
~
++
++
+
+
+
+
~
~
++
++
~
~
+
+
++
++
~
+
-
-
--
--
+
++
+
+
-
-
Municipal solid w aste incineration
"average technology"
Municipal solid w aste incineration
"latest technology"
Cem ent kiln
Heating
Cogeneration (CHP)
Car (m ethane)
Car (ethanol)
Wood
Grass
Manure
Waste
w ood
Whey
Biow aste
Sewage
sludge
energy carrier
use path
m in
m ax
m in
m ax
m in
m ax
m in
m ax
m in
m ax
m in
m ax
m in
m ax
~
+
~
+
+
++
+
++
-
-
-
-
~
++
~
~
+
+
+
+
~
~
-
-
-
-
~
~
~
~
++
++
++
++
-
-
-
-
--
--
-
-
+
+
-
-
Whey
Biow aste
Wood
Grass
Manure
Waste
w ood
Municipal solid w aste incineration
"average technology"
Municipal solid w aste incineration
"latest technology"
Cem ent kiln
Heating
Cogeneration (CHP)
Car (m ethane)
Car (ethanol)
Sewage
sludge
Figure 10
Net utility in relation to overall evaluation on basis of Eco-Indicator 99 (at top) and on basis of UBP 06 (at bot-
tom). Table shows all variations investigated in Chapter 4, where utility is plotted relative to environmental im-
pact of biogenic secondary energy carrier (see text for explanations). Chapter 4 investigated two scenarios for
production of conventional electrical power and heat respectively – causing net utility to fall somewhere be-
tween a minimal (“min” column) and maximal value (“max” column). White fields indicate variations not inves-
tigated.
The result for the GHG emissions in Figure 9 correlates with that for the cumulated non-renewable energy
requirement (KEA). In most cases the utility is 50 and more % greater than the impact that using he biogenic
energy carrier entails. However the situation does not look as positive only for the two secondary energy
carriers biowaste and sewage with their high water content because using them often entails a whole series
of drying steps connected with fossil energy consumption.
If one does an overall LCA using the methodologies Eco-Indicator 99 and UBP 06, one gets a somewhat
more optimistic picture, as shown in Figure 10. However here too it becomes apparent that it is not so simple
to find a biogenic energy carrier that gives positive results both as regards GHG emissions and environ-
mental LCA. Utilization of liquid manure (from farms) brings the best results – as it shows up as good to very
good in the two methods used. The use of biowaste, however, shows a much less positive picture. The main
reason for that is the heavy-metal emissions that are released when the fermentation mass is used in agri-
cultural crops.
A horizontal perspective that compares the various utilization possibilities (use in a CHP plant, as fuel, etc.)
show positive and less positive sometimes even negative cases everywhere. Current-day incinerators do not
appear to be very efficient in using biogenic secondary energy carriers.
All in all, it can be concluded from the comparisons done that using the biogenic variations tested here as
substitutes for traditional fossil energy carriers will bring positive results as regards GHG emissions – i.e. less
environmental impact. However many of the variations tested display clear disadvantages when compared
with the fossil variations used today in other environmentally relevant aspects, so that an environmental LCA
certainly does not produce positive results for using biogenic energy carriers in all cases.
XIII
Environmental assessment of biofuels, R. Zah et al., Empa

Conclusion
The present study shows that with most biofuels a trade-off exists between minimizing GHG emission and a
positive environmental LCA. It is true that reductions in GHG emissions of more than 30% can be obtained
with many biofuels; however the most of the production paths display higher impacts than petrol in various
other environmental indicators. The transport of foreign biofuels into Switzerland is of only secondary impor-
tance. Instead, the manner in which the biofuel is produced is much more important.
The central finding of this study is that most of the environmental impacts of biofuels are caused by agricul-
tural cultivation. In the case of tropical agriculture this is primarily the slash-and-burning of rainforests which
sets great quantities of CO
2
free, causes air pollution and has severe impacts on biodiversity. Concrete certi-
fication guidelines for biofuels that counteract these problems, for instance, like the guidelines of the Forest
Stewardship Council (FSC) are urgently needed. In the moderate latitudes it is partially the low crop yields,
partially the intensive fertilizer use and mechanized tilling that cause the unfavorable environmental impacts.
Then one should search for an optimal ratio of energetic yield and low environmental impact through variety
and crop rotation. A favorable LCA could also be achieved with the energetic utilization of agricultural co-
products such as molasses or sorghum straw.
It is the energetic utilization of waste materials and residues that wins the prize in this study because firstly
the high impacts from the supply of raw materials are avoided, and secondly the environmental emissions
can be reduced that otherwise would come from waste treatment such as waste water degradation with
whey or the methane emissions that result from fertilizing with unfermented liquid manure. One critical factor
is the high methane emission that at times comes from the production and processing of biogas. In this area
as well, the overall LCA could be much improved by taking appropriate measures. On the one hand, these
are already being done with new plants, whereas on the other hand, research work needs to be devoted to
the separation of CO
2
.
The energetic utilization of wood also brings good results because the environmental impacts of supply of
the raw material are very low. One possible technology for the future is the gasification of wood, if ever GHG-
active methane emissions can be minimized through closed processing. However even if such processes
are to be regarded as future perspectives, an evaluation of their future significance must still be left open due
to the limited availability of the raw material and the many competing alternative forms of utilization.
The results of this study show on the whole that promoting biofuels, for instance, through a tax break, must
be done in a differentiated way. Not all biofuels are per se suitable to reduce environmental impact as com-
pared to fossil fuels. Of all the production paths tested, at present it is primarily the utilization of biogenic
waste material and wood and the utilization of grass for ethanol production that bring a reduction in environ-
mental impact as versus the fossil reference. Nonetheless the environmental impact of biofuels – unlike that
of fossil fuels – can be reduced a lot by appropriate measures. Because of this optimization potential, one
may expect that in future it will be possible to achieve better results for a number of production paths. In ad-
dition to this, innovative processes such as Biomass-To-Liquid (BTL) will become more important, although it
has not been possible to include them in this study.
The potential of domestic bioenergy is limited today – and will remain so in future. If energy plants were culti-
vated in Switzerland on a large scale, it would have a negative influence on the food self-sufficiency of the
country, or would cause added environmental impact by requiring the intensification of food production.
Therefore our energy problems will not be solved by biofuels alone. Only if the biomass is transformed into
energy efficiently and in an environmentally friendly way, while consumption is reduced and energy efficiency
increased, could these alternative energy carriers play a role in our future energy supply that should not be
neglected in conjunction with other renewable energy forms.
XIV
Environmental assessment of biofuels, R. Zah et al., Empa
Wyszukiwarka
Podobne podstrony:
Wikipedia Dyskusja o Bioenergoterapii, satanizm opetanie egzorcyzmy
techn bioenerg sprawozdanie 5
sprawko bioenergetyka
Bioenergoglupota id 86822 Nieznany (2)
Okultyzm,magia, spirytyzm,czary, wróżby,New Age,bioenergioterapia,medycyna alternatywna,niekonwencjo
bioenergoterapeuci
bioenerg PS2
technologie bioenergetyczne wykłady, Ochrona Środowiska, Technologie bioenergetyczne
Bioenergoterapia wśród ludzi wierzących, odnowa-charyzmaty
turnusy bioenergoterapeutyczne, satanizm opetanie egzorcyzmy
Homeopatia i bioenergoterapia(1)
samouzdrawianie, Bioenergoterapia
Niezwykłe techniki obrazowania pól bioenergetycznych (2)
BioenergoteraPIATekst zaczerpnięty z dwumiesięcznika Miłujcie Się, satanizm opetanie egzorcyzmy
Jak usunąć bioenergetyczne blokady z organizmu, Leczenie falami milimetrowymi (CEM-TECH i in)
22 Zbilansowanie bioenergetyki
Bioenergoterapia - Świadectwa, ►CZYTELNIA
więcej podobnych podstron