
TOPICS
ni.com/training
0

TOPICS
ni.com/training
A. Arrays
B. Common Array Functions
C. Polymorphism
D. Auto-Indexing
1
E. Clusters
F. Type Definitions
G. Plotting Data
– Charts
and Graphs
Data Structures

ni.com/training
A. Arrays
1D and 2D Arrays
Creating an Array Control and Constant
Initializing Arrays
2

ni.com/training
Arrays
An array:
• Is a collection of data elements
that are of same type.
• Has one or more dimensions.
• Contains up to (2
31
)
–1 elements
per dimension, memory
permitting.
• Accesses elements by its index.
Note: The first element is index 0.
3

ni.com/training
1D array
One row of 10-elements
1.2 3.2
8.2 8.0
4.8 5.1
6.0 1.0
2.5 1.7
0 1 2 3 4 5 6 7 8 9
2D array
Five-row by seven-column table of
35 elements
0 1 2 3 4 5 6
0
1
2
3
4
4
Arrays
– 1D and 2D Examples
Index
numbers

ni.com/training
Why Use Arrays?
Use arrays when you work with a collection of
similar data and when you perform repetitive
computations.
5

ni.com/training
Creating an Array Control
For a new array:
1. Select an Array control from
the Controls palette on the
front panel.
2. Place a data object, such as
a numeric control, into the
array shell.
3. Add more dimensions, if
necessary, by resizing the index display.
From a block diagram terminal or wire:
1. Right-click the object and select
Create»Control or
Create»Indicator.
6

ni.com/training
Creating an Array Constant
For a new array:
1. Select Array Constant from the
Functions palette on the block
diagram.
2. Place a constant, such as a numeric,
into the array shell.
3. Add more dimensions, if necessary, by
resizing the index.
From a block diagram terminal or wire:
1. Right-click and select
Create»Constant.
7

ni.com/training
2D Arrays
• 2D arrays:
− Store elements in a grid.
− Require a row index and a column index to locate
an element, both of which are zero-based.
• Create a multidimensional array on the front
panel by right-clicking the index display and
selecting Add Dimension from the shortcut
menu, or:
• Resize the index display until you have as many
dimensions as you want.
8

ni.com/training
Viewing Arrays on the Front Panel
The element selected in the index display always
refers to the element shown in the upper-left
corner of the element display.
First
element at
index 1
Second
element at
index 2
The element at
index 0 is not shown
because element 1
is selected in the
index display.
9

ni.com/training
Initializing Arrays
• You can initialize an array or leave it uninitialized.
• For initialized arrays, you define the number of
elements in each dimension and the contents of
each element.
• Uninitialized arrays have dimension but no
elements.
10

ni.com/training
B. Common Array Functions
Array Size
Initialize Array
Array Subset
Build Array
Index Array
11

ni.com/training
Common Array Functions
• Array Size
• Initialize Array
• Array Subset
• Build Array
• Index Array
12

ni.com/training
13
Array Size

ni.com/training
14
Initialize Array

ni.com/training
15
Array Subset

ni.com/training
Build Array
16

ni.com/training
Index Array
17

ni.com/training
C. Polymorphism
18

ni.com/training
Polymorphism
Functions are polymorphic to varying degrees:
• None, some, or all of their inputs can be polymorphic.
• Some accept numeric or Boolean values.
• Some accept numeric or strings.
• Some accept scalars, numeric arrays, or clusters of
numerics.
19
Polymorphism - The ability of VIs and
functions to automatically adapt to accept
input data of different data types

ni.com/training
Arithmetic Functions Are
Polymorphic
Combination
Result
20

ni.com/training
D. Auto-Indexing
Use in For Loops and While Loops
Auto-Indexing with a Conditional Terminal
Creating 2D Arrays
Auto-Indexing Input to a Loop
21

ni.com/training
Auto-Indexing
• Allows loops to
accumulate arrays at their
boundaries.
• Is the default behavior for
For Loops.
• Is disabled by default for
While Loops.
• Is enabled/disabled by
right-clicking on a tunnel.
• Produces arrays that are
always equal in size to the
number of iterations of the
loop.
22
Wire becomes thicker
Wire remains the same size
Auto-Indexing Disabled
Auto-Indexing Enabled
Only one value (last
iteration) is passed out
of the loop
1D Array
0 1 2 3 4 5

ni.com/training
Auto-Indexing with a Conditional
Tunnel
23
Right-click on a tunnel and
select Tunnel
Mode»Conditional.

ni.com/training
• Inner loop creates column elements (creates single rows).
• Outer loop stacks column elements into a 2D array.
24
1D Array
0 1 2 3 4 5
2D Array
Creating 2D Arrays

ni.com/training
Auto-Indexing Input
If the iteration count terminal is wired and arrays of
different sizes are wired to auto-indexed tunnels, the
actual number of iterations becomes the smallest of
the choices.
25
25

ni.com/training
Auto-Indexing Input
Use an auto-indexing input array to perform
calculations on each element in an array.
•
Wire an array to an auto-indexing tunnel on a For Loop.
•
You do not need to wire the count (N) terminal.
−
The For Loop executes
the number of times
equal to the
number of
elements in the array.
−
The Run button is not broken.
26
26

DEMONSTRATION
Concept:
Polymorphism and Manipulating Arrays
Build a VI where an array and a scalar are added
in two ways:
– Polymorphic Add of array + scalar
– Auto-indexed array elements added to scalar
and verify that the results are the same.

ni.com/training
E. Clusters
Reasons To Use Clusters
Clusters vs. Arrays
Creating a Cluster Control and Constant
Ordering Items and Resizing Clusters
Disassembling and Modifying Clusters
28

ni.com/training
Clusters
• Clusters group data elements of mixed types.
• Clusters are similar to a record or a
struct
in
text-based programming languages.
29
29

ni.com/training
Why Use Clusters?
• Keep data organized.
− Logically group related data values together.
− Improve diagram readability by eliminating wire
clutter.
• Reduce the number of connector pane terminals.
30

ni.com/training
Clusters vs. Arrays
• A cluster has a fixed
number of elements.
• One cluster can contain
mixed data types.
• A cluster can contain
another cluster directly.
• A cluster can be a control,
an indicator, or a constant.
− All cluster elements have
to be controls, indicators,
or constants.
• An array can vary in size.
• One array contains only
one data type.
• An array cannot contain
another array directly.
• An array can be a control,
an indicator, or a constant.
− All array elements have to
be controls, indicators, or
constants.
31
31

ni.com/training
Create a Cluster Control
For a new cluster:
1. On the front panel, select Cluster
from the Controls palette.
2. Place a data object into the
cluster shell.
3. Place additional data objects,
if necessary, into the shell.
From block diagram terminal or wire:
1. Right-click and select
Create»Control or
Create»Indicator.
32
32

ni.com/training
Create a Cluster Constant
For a new cluster:
1. On the block diagram, select
Cluster Constant from the
Functions palette.
2. Place a constant into the cluster
shell.
3. Place additional data objects, if
necessary, into the cluster shell.
From block diagram terminal or
wire:
1. Right-click and select
Create»Constant.
33
33

ni.com/training
Autosizing Clusters
• Autosizing helps you
arrange elements in
clusters.
• NI recommends the
following:
− Arrange cluster elements
vertically.
− Arrange elements
compactly.
− Arranges elements in
their preferred order.
34

ni.com/training
Cluster Order
• Cluster elements have a
logical order unrelated to
their position in the shell.
• You can view and modify
the
cluster order by right-
clicking
the cluster border and
selecting Reorder
Controls
In Cluster.
35

ni.com/training
Disassembling a Cluster
• Use the Unbundle By Name function whenever
possible.
• Use Unbundle function when some or all cluster
elements are unnamed.
36

ni.com/training
Modifying a Cluster
• Use Bundle By Name whenever possible to
access elements in a cluster.
• Use Bundle when some or all cluster elements
are unnamed.
37
You
must
wire the
input
cluster
terminal.

ni.com/training
Creating a Cluster on the Diagram
• Use the Bundle function to programmatically create
a cluster on a block diagram.
• If the elements that are bundled have labels, you
can access them using the Unbundle By Name
function. Otherwise use the Unbundle function.
38

ni.com/training
Error Clusters
• LabVIEW uses error clusters to pass error information.
• An error cluster contains the following elements:
− status—Boolean value that reports True if an error occurs.
− code—32-bit signed integer that identifies the error.
− source—String that identifies where the error occurred.
39

DEMONSTRATION
Demonstration:
Clusters
Create clusters, reorder clusters, and use the
cluster functions to assemble and disassemble
elements.
40

DISCUSSION
Group Exercise
Concept: Bundle and Unbundle
Functions
• What happens to VIs using your cluster if you
reorder cluster elements:
– if you use Bundle By Name and Unbundle By Name
in your VIs?
– if you use Bundle and Unbundle in your VIs?

DISCUSSION
Group Exercise
Concept: Editing Cluster Elements
You perform some operations on a cluster, e.g.
replace one element as in the picture above. What
happens if you add a cluster element to Output
cluster (by editing the front panel indicator)?

ni.com/training
F. Type Definitions
Type Definitions and Custom Data Types
Creating and Identifying Type Definitions
Controls
Strict Type Definitions
43

ni.com/training
Type Definition (Type Def)
• A type definition is a master copy of a custom
data type (control, indicator, or constant).
− A custom data type is saved in a .ctl file.
− Instances of a type def are linked to the .ctl file.
• Instances can be controls, indicators, or
constants.
• When the type def changes, instances
automatically update.
− Changes include data type changes, elements
added, elements removed, and adding items to an
enum.
44

ni.com/training
Creating a Type Definition (Type Def)
1. Right-click a control, indicator or constant and select
Make Typedef.
1. Right-click the object again and select Open Type Def.
2. Edit control, if needed.
3. Save control as a .ctl file.
45

ni.com/training
Identifying Type Definitions (Type
Def)
• Look for a glyph marking the upper left corner of
terminals and constants.
• Hover cursor over glyph to view tip strip.
• View Context Help while hovering cursor over
terminal or constant.
46

DEMONSTRATION
Demonstration:
Type Definition
Create and modify a type-defined cluster control.
Use the type definition in a calling VI and a subVI.
47
ni.com/training
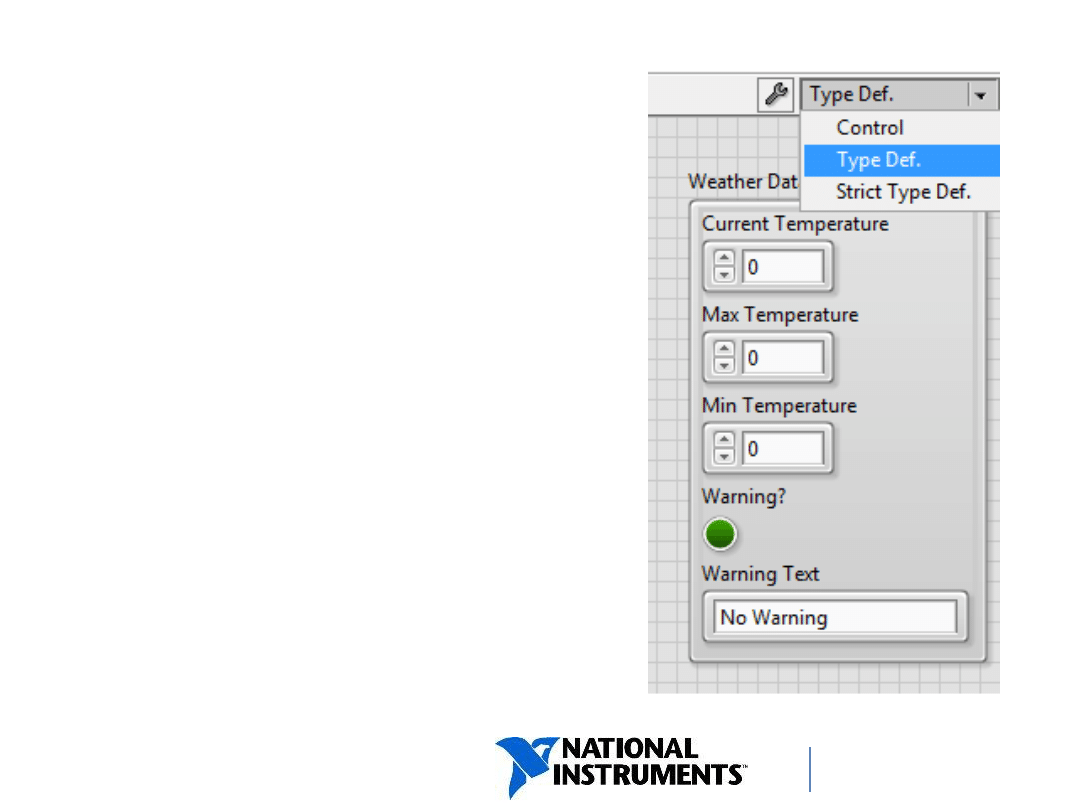
Other Control Options
You can save a custom
control as:
• Control
• Type Definition
• Strict Type Definition
48
48
ni.com/training
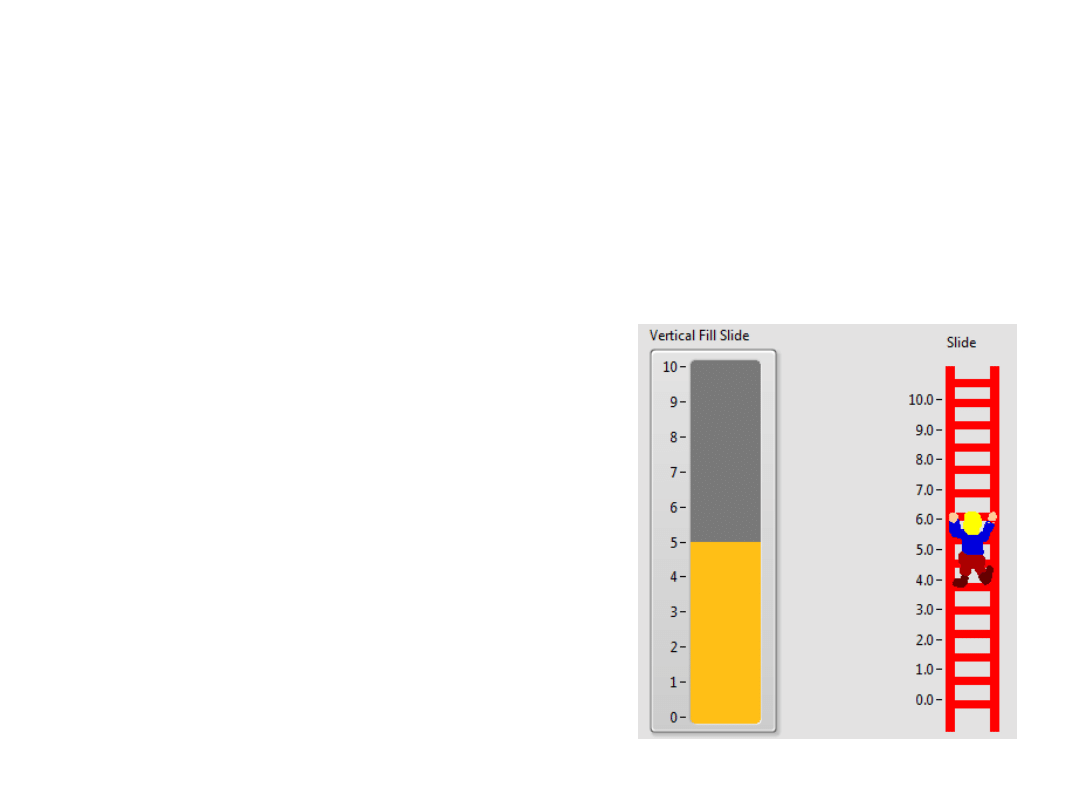
Control
• Instances are not linked to a.ctl file.
• Each instance is an independent copy of the
control.
• Used to create controls
that behave like existing
controls but look different.
49

ni.com/training
Strict Type Definition
• Strict type definitions are similar to a type definition in
that:
− All instances link to .ctl file.
− When attributes or data types change, all instances
update.
• Examples: Changing a knob to a dial, a round LED to
a square LED, or a double to an integer.
• Strict type definitions enforce every aspect of a
instance except label, description, and default value.
• Use strict type definitions to ensure all front panel
instances have the same appearance.
50
50
ni.com/training
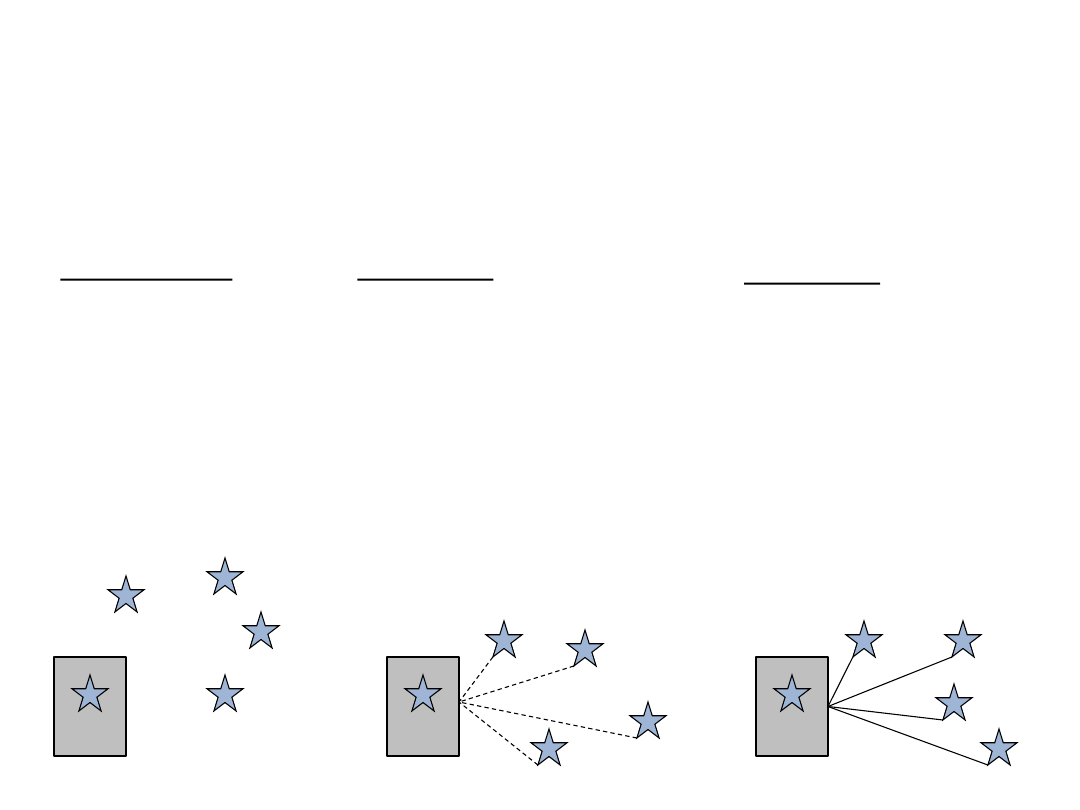
.ctl File Options Summary
Control
•
No connection
between the one
you saved and the
instance in the VI
•
Update to the file
will not update
any instances
Type Def
•
Connection between the
saved file and all
instances
•
Forces the data type of
each instance to be
identical (clusters, enum)
•
Changes made to file will
populate throughout each
instance
Strict Type Def
•
Connection between
saved file and all
instances
•
Forces everything about
an instance to be
identical to the strict type
definition, except:
•label
•description
•default value
*.ctl
*.ctl
*.ctl

DISCUSSION
Group Exercise
Concept: Type Definitions
If your cluster is saved as a type definition and you
use this cluster in five places in your VIs, how
many instances of the cluster would need to be
updated to add more cluster elements?

ni.com/training
G. Plotting Data
– Charts and
Graphs
Waveform Chart
Waveform Graph
XY Graph
Multiplot Charts and Graphs
53
ni.com/training
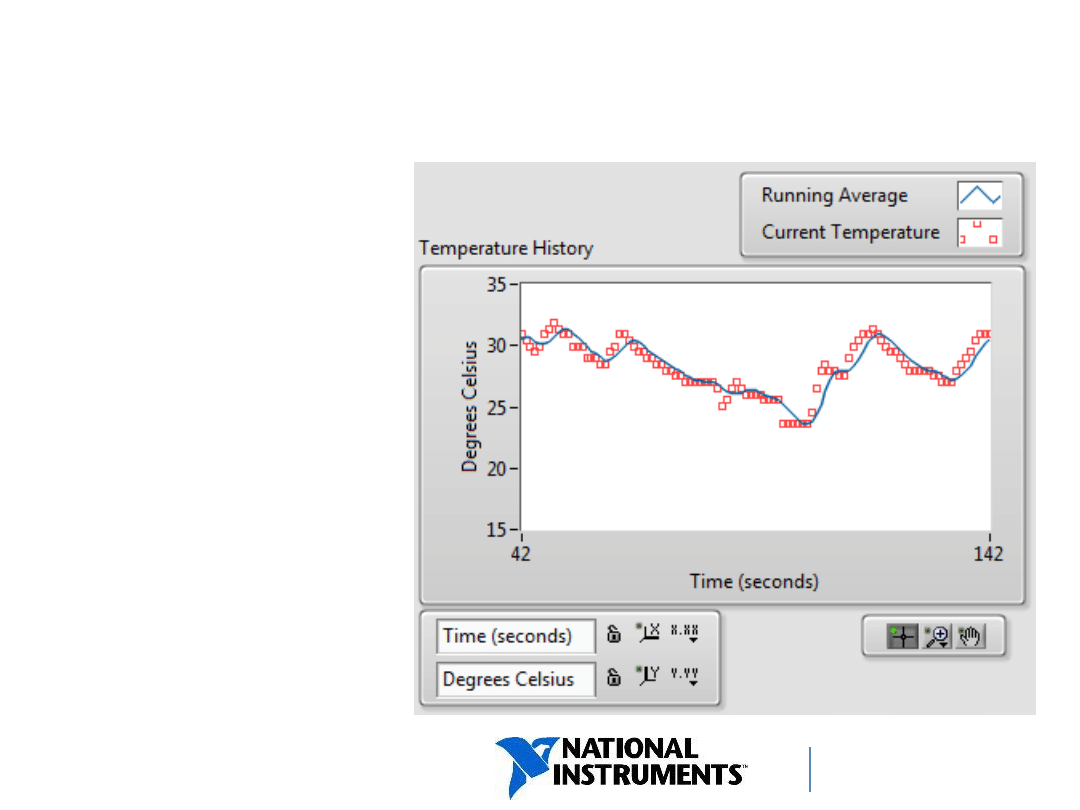
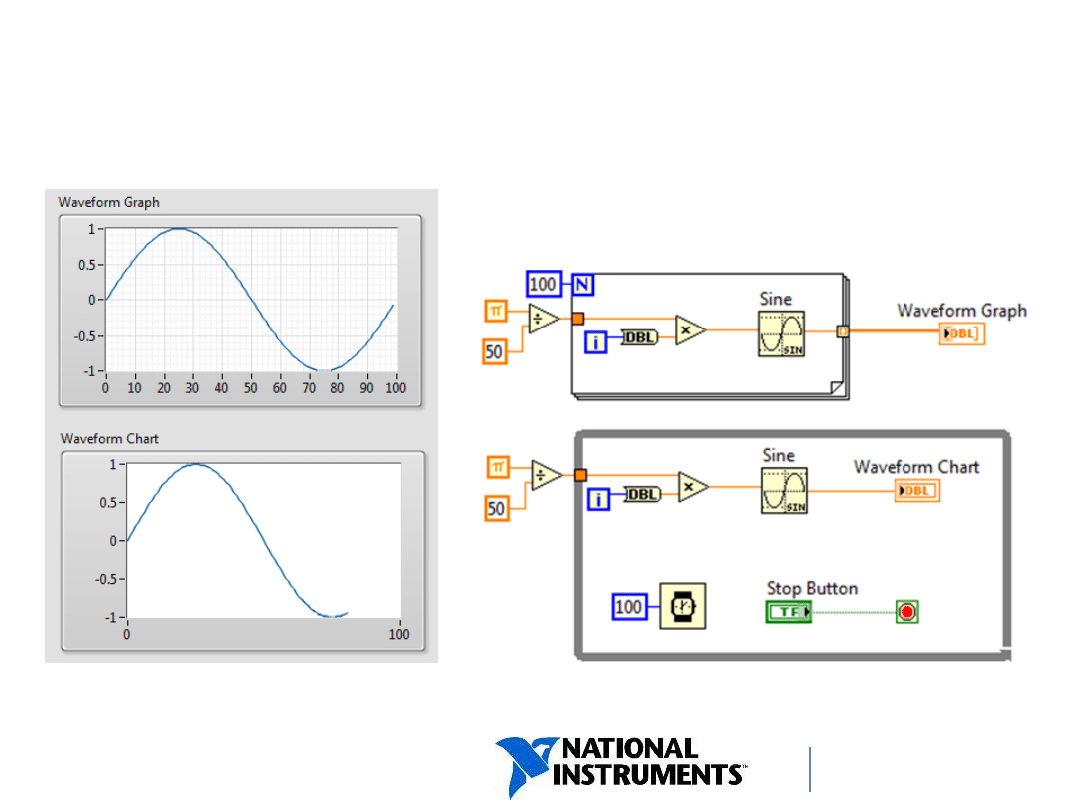
Waveform Chart
• Waveform chart
is a special type
of numeric
indicator.
• Waveform
charts display
single or
multiple plots.
54
ni.com/training
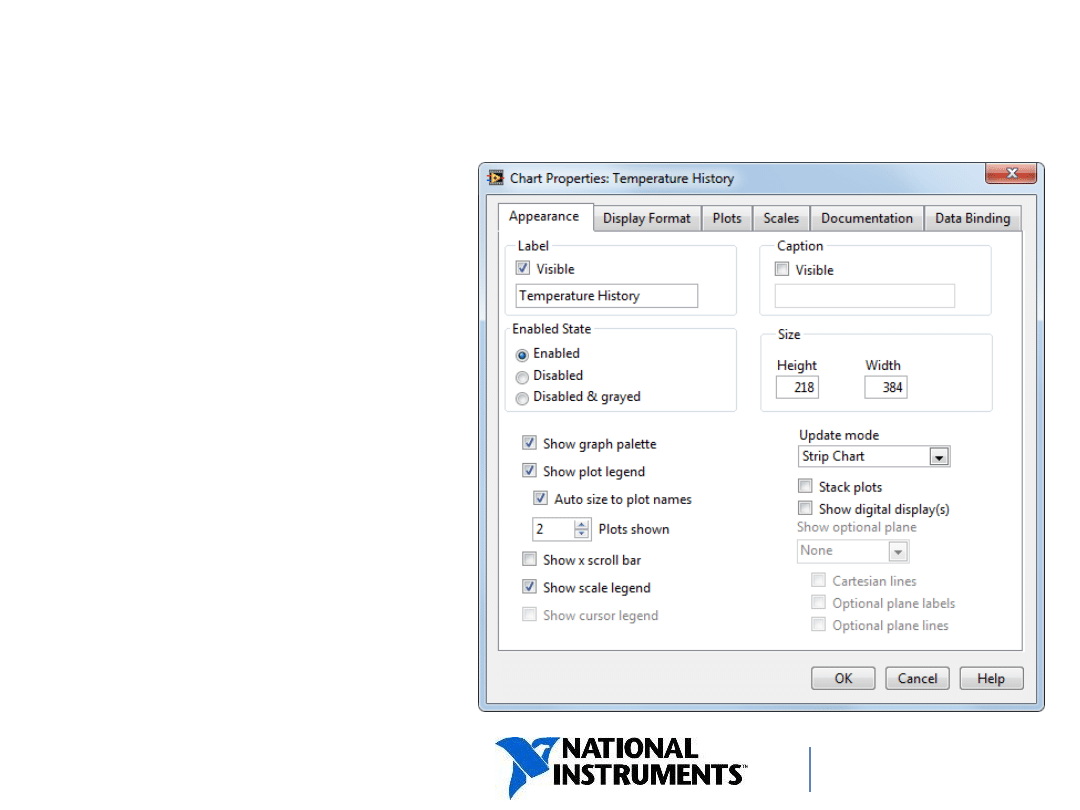
Waveform Chart Properties
Extensive plot
customization lets
you:
• Show or hide
legends.
• Change color and
line styles.
• Change
interpolation
styles.
55
ni.com/training
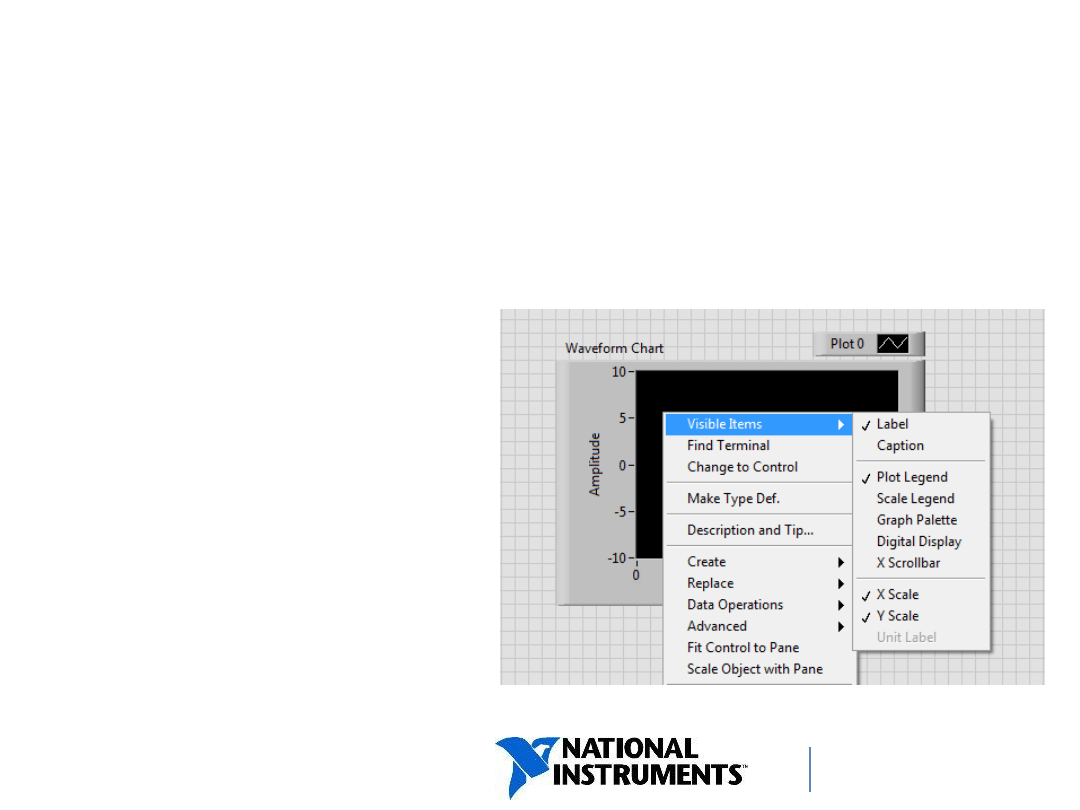
Waveform Chart
– Visible Items
Charts also have elements that can be made visible
on the front panel so the user can change chart
appearance when
the application
is running.
These are e.g.:
• Plot Legend
• Scale Legend
• Graph Palette.
ni.com/training
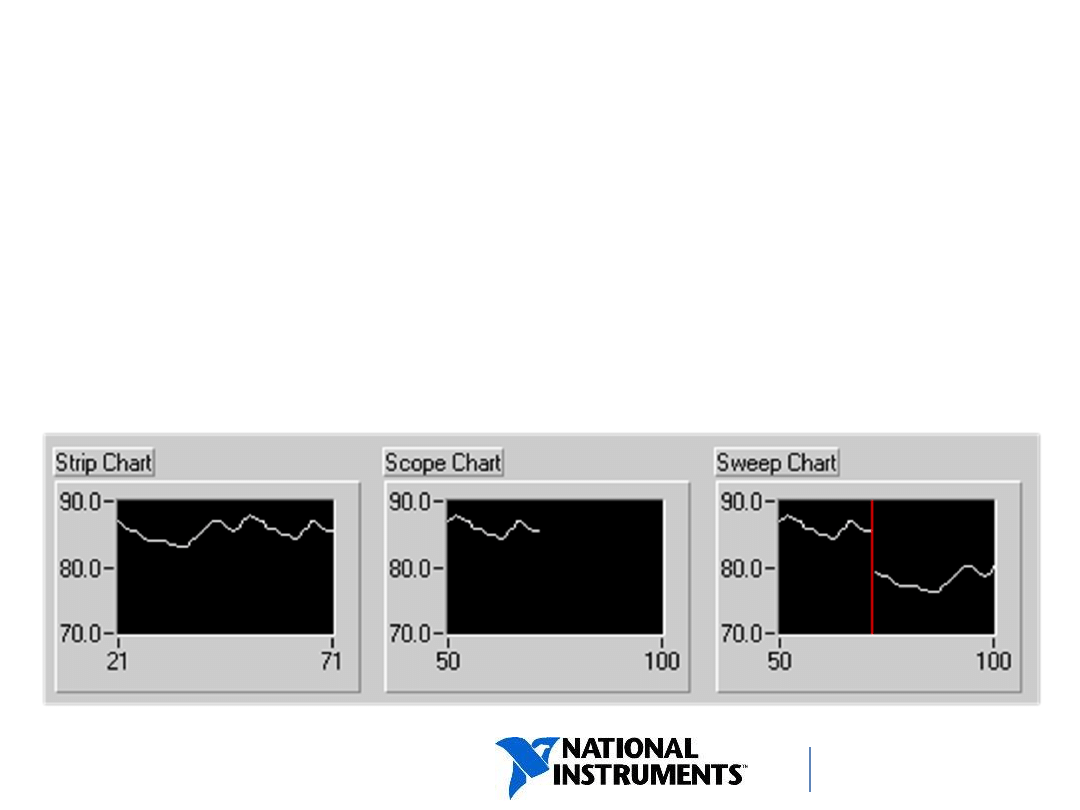
• Right-click the chart and select Advanced»Update Mode
from the shortcut menu.
• Strip chart is the default update mode.
• Scope chart and sweep chart modes display plots
significantly faster than the strip chart mode.
Chart Update Modes
ni.com/training
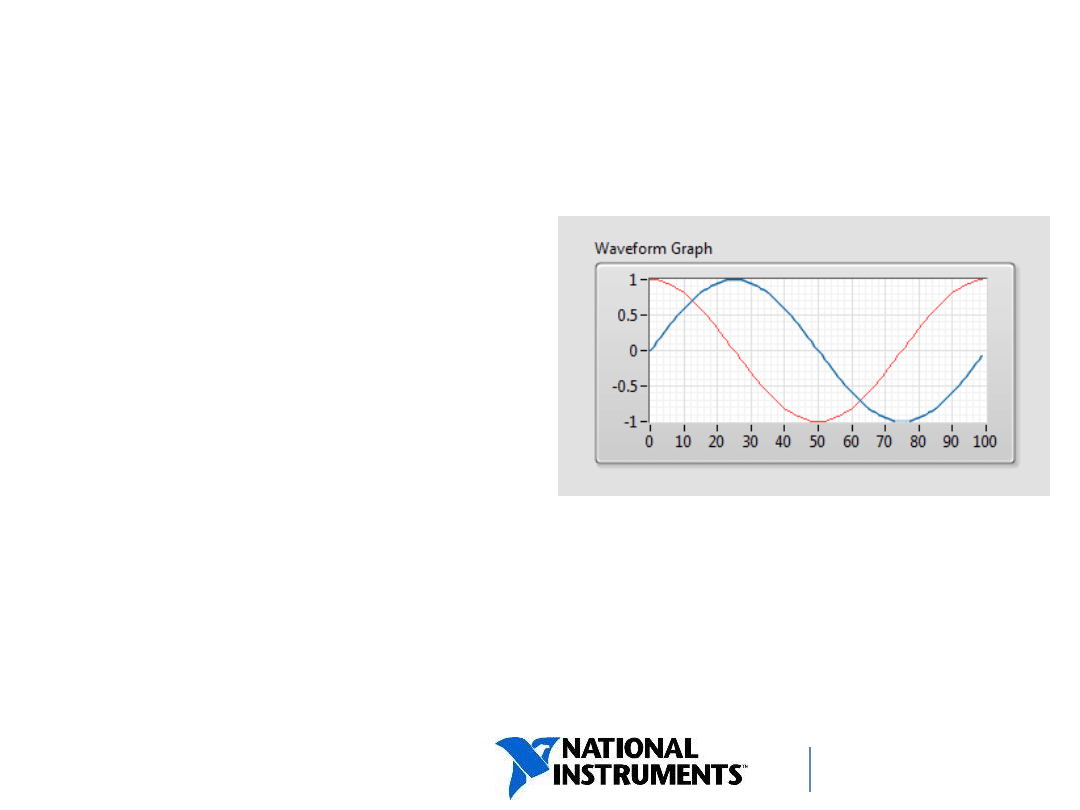
Waveform Graph
• Is a graphical display
of data.
• Displays one or more
plots of evenly sampled
measurements.
• Is used to plot pre-
generated arrays of data.
• Can display plots with any number of data points.
58
ni.com/training
Charts vs. Graphs
– Single Plot
59
ni.com/training
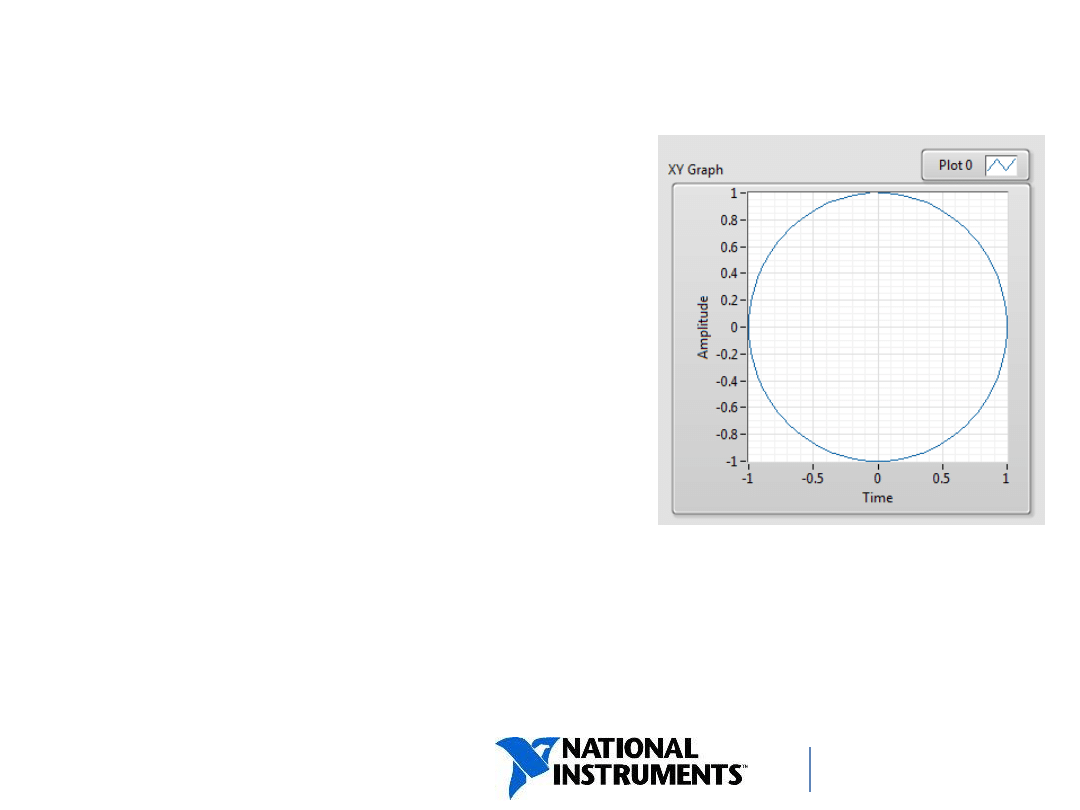
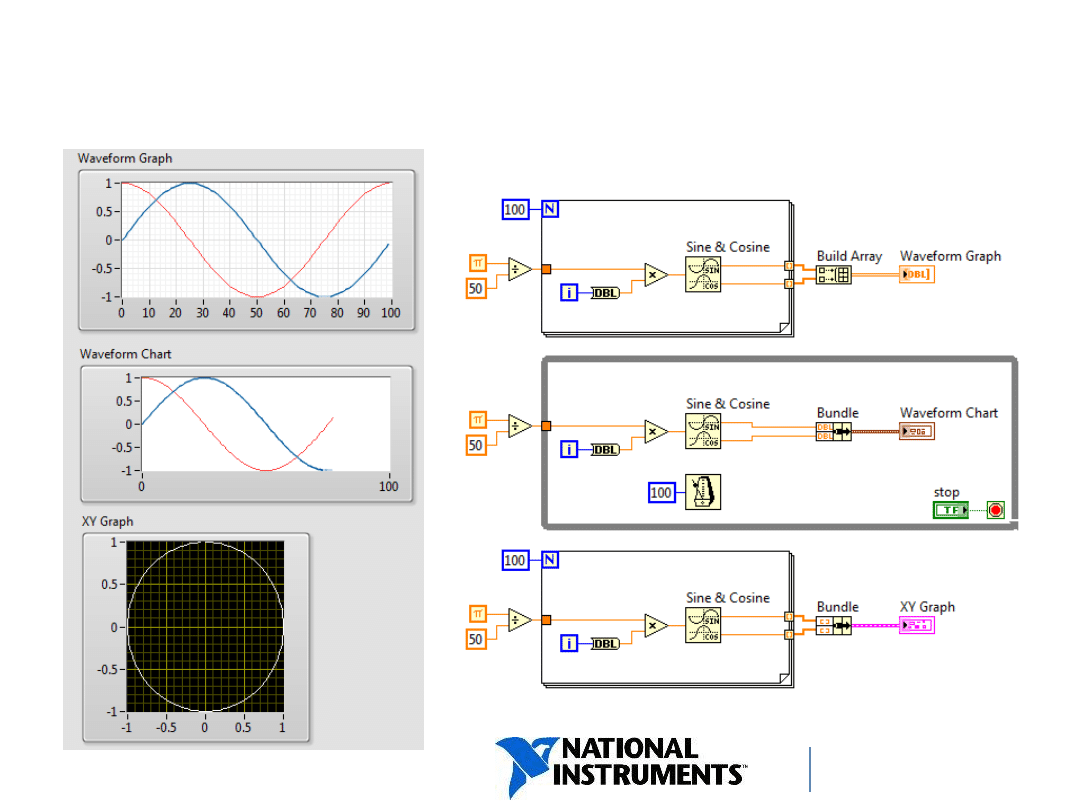
XY Graph
• Is a graphical display of data.
• Can display plots such as
circular shapes or
waveforms with
a varying time base.
• Data points may be evenly
sampled or not.
• Is used to plot pre-generated arrays of data.
• Can display plots with any number of data points.
60
ni.com/training
Charts vs. Graphs
– Multi-plot
and XY Graph
61
ni.com/training
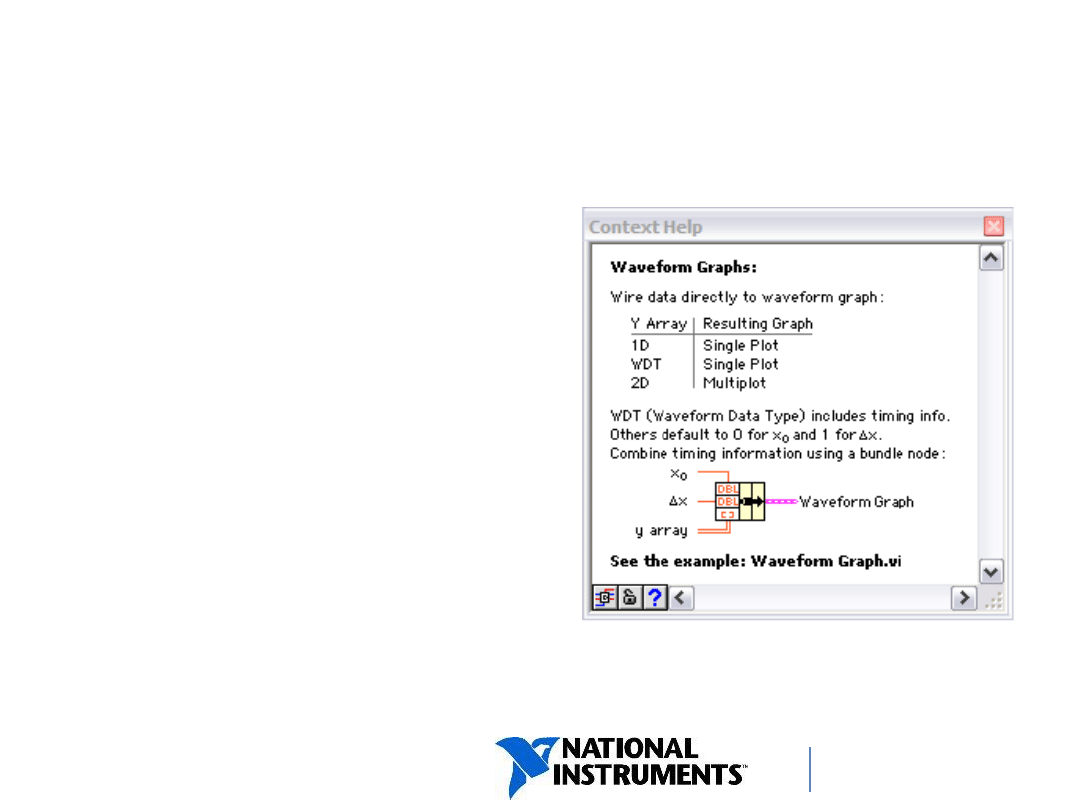
Plotting Data
Use the Context Help
window to determine
how to wire data
(including multi-plot data)
to Waveform Graphs,
Waveform Charts and
XY Graphs.
62

ni.com/training
Homework: Data Structures
Practice creating and using:
• arrays
• clusters
• custom controls and type definitions.
The instructions are provided on the website.

ni.com/training
Homework: Lotto
Utilize your knowlegde about arrays,
For and While loops, and Case Structures
to implement a
”Pick 6” lottery.
The instructions are provided on the website.
Wyszukiwarka
Podobne podstrony:
Homework Data Structures
lecture5 6 data structure 2
lecture5 6 data structure
Homework Data Structures
Polymorphing Software by Randomizing Data Structure Layout
43 flytunes data structure example
Structures sp11
196 Capital structure Intro lecture 1id 18514 ppt
4 Plant Structure, Growth and Development, before ppt
CW2006EX Mill Turn data sheet web
3 Data Plotting Using Tables to Post Process Results
PAT DS 350 Graphic Modular GM Service Data
An%20Analysis%20of%20the%20Data%20Obtained%20from%20Ventilat
cx5500 data sheet enus
Lesley Jeffries Discovering language The structure of modern English
data
Data 09 Święto Niepodległości, Scenariusze i hospitacje - praktyki
Eurocode 5 EN 1995 1 1 Design Of Timber Structures Part 1 1 General Rules
CS Structured Cabling
więcej podobnych podstron