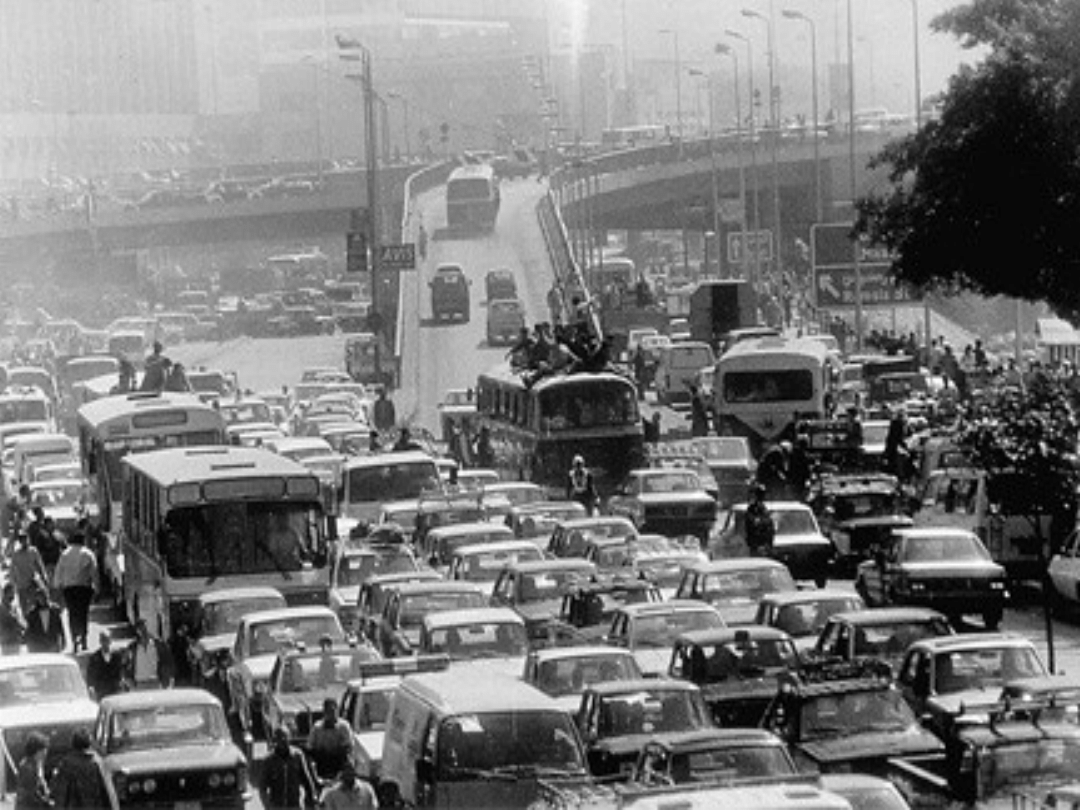
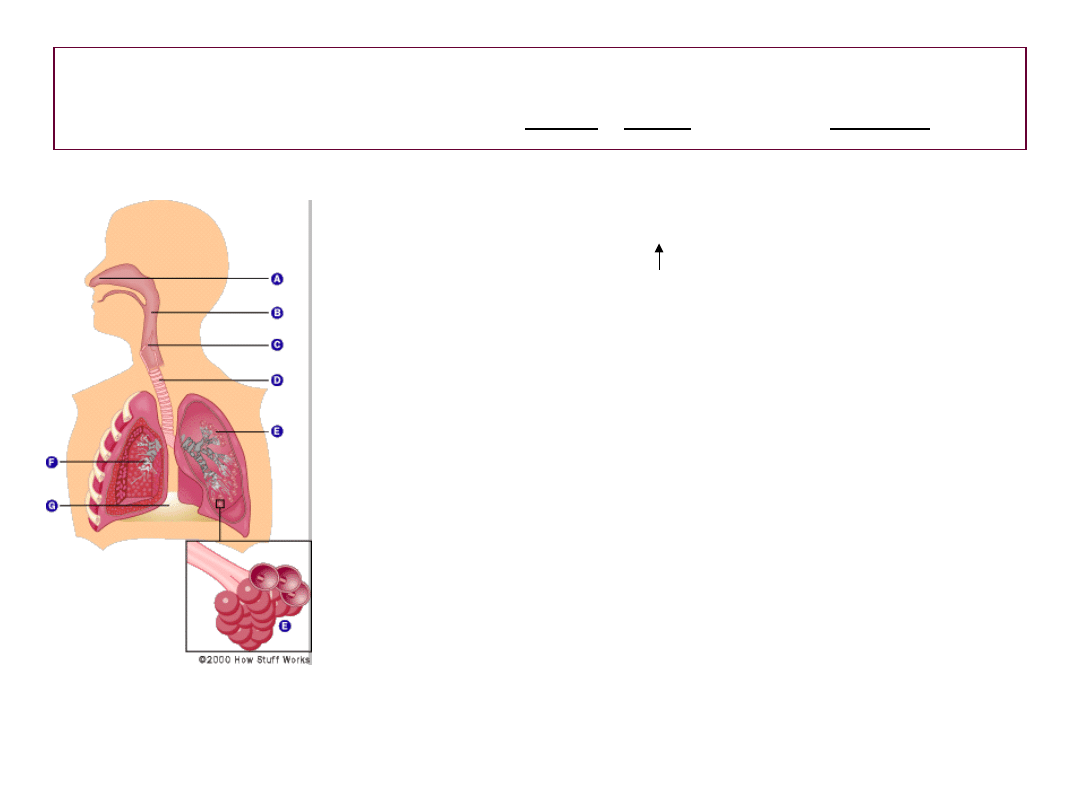
Where we live and
breathe
500ml/breath x 15 breaths/min x
60 min/hr x 24hr/day
>10,000 LITERS
>10,000 LITERS
Of air pass through our
lungs every day of our
lives.

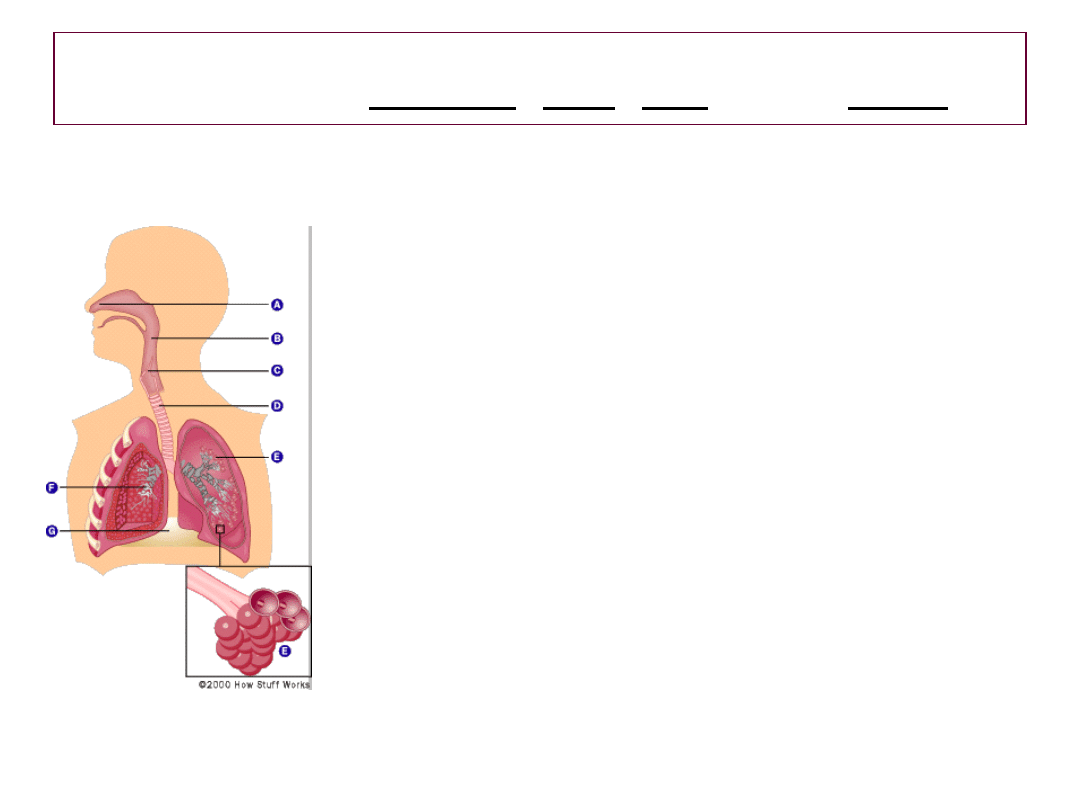
Air pollution
• Of the many components of air pollution, those
thought to pose the greatest threat to the lungs
include:
Ozone
Particulate matter
Carbon monoxide
Sulfur dioxide
Nitrogen dioxide
Lead

Smog and lung injury
Smog and lung injury
• In London, December of 1952, smog (i.e smoke,
fog and air pollution), coupled with unusually low
temperatures and a 5- day temperature inversion
conspired to produce a calamitous excess of
respiratory illness and death.
• The major pollutants came primarily from
industrial and domestic discharges of smoke
probably with a prominence of acidic aerosols
among them.

Risk groups include the elderly and the
young as well those with underlying
respiratory and cardiac illness
• CHILDREN:
– Particularly vulnerable
– Smaller and narrower airways
– > breaths/min than adults
– needs for oxygen
– More time outdoors
– The longer the duration of exposure the greater the effect
concern about chronic effects since
the effect outlasts the
exposure

Acute Effects
• Given a threshold dose, the first effects are
seen in the trachea and bronchi.
• Symptoms will include a reflex-mediated
cough
• An acute inflammatory response will ensue
the magnitude of which will depend on
various intrinsic as well as extrinsic
factors.
(cellular infiltration, edema, exudation,
ulceration, bleeding and sloughing of the mucosa)

Airway hyperesponsiveness
(inflammatory processes)
Bronchoconstriction
(obstructive derangement of the
airways)
Symptoms
(cough – productive or dry,
dyspnea, wheezing, chest
tightness, activity restriction)
OZONE: bronchial hyperesponsiveness, decline
in lung function (with time delay) -symptoms
include:substernal chest pain, tearing, burning
2 hrs @ 120
ppb
10-20% of
population
12% decline
FEV1
8 hrs @120ppb
Population
average
20%decline
FEV1
6.6 hrs
@120ppb
Asthmatics and
nonasthmatics
Non-specific
Bronchial
hyperesponsive
ness
1 hr@120ppb
asthmatics
specific
bronchial
hypresposivene
ss
Pulmonary Function Response to Various
Ozone Exposures
pollutants: Ozone, PM, CO, SO
2
,
NO
2
,
pollutants: Ozone, PM, CO, SO
2
,
NO
2
,
PM
3-30
- SIZE MATTERS !
Determines
deposition
site and resultant effect
(bronchitis,chronic cough, resp.
illness, COPD exacerbation,
longevity
A 10mcg/m
3
increase in PM
10
lead to a
rise in:
- total mortality 1%
- CVS mortality 1.4%
- Respiratory mortality 3.4%
- Asthma hospitalization 1.9%
- Asthma ED visits 3.4%
- Asthma exacerbation and increased use
of bronchodilator use 3%.
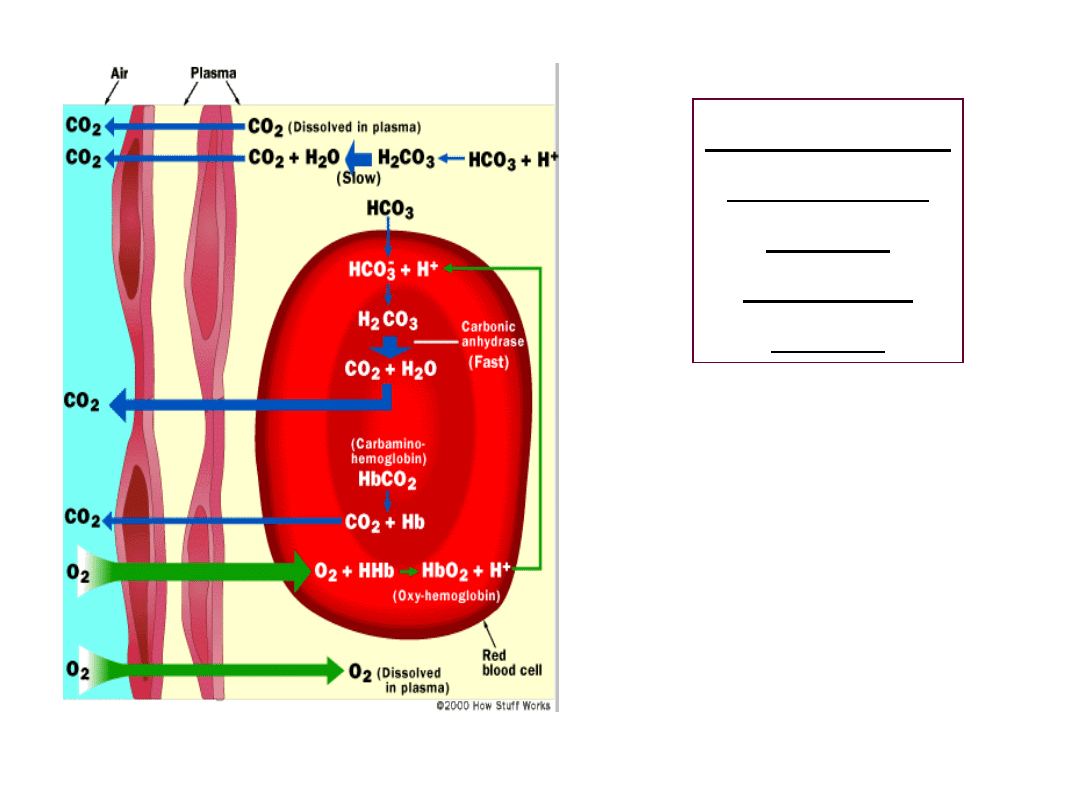
Normal gas
exchange
at the
alveolar
level.
CO competes with O
2
for hemoglobin with an
4 -fold greater affinity
CO - interferes with
normal gas exchange and
is directly responsible for
hypoxemia
pollutants: Ozone, PM, CO, SO2, NO2,
SO2 -
mucosal irritation of
upper respiratory tract. Level
of exposure is important level
may be lethal causing mucosal
sloughing and alveolar
hemorrhage
-0.5ppm = odor threshold
-6-10 ppm – irritation of eyes, nose and
throat
-0.25 ppm – can provoke asthma
exacerbation in exercising asthmatics
pollutants: Ozone, PM, CO, SO2, NO2,
-15ppb: stuffy nose and cough
->30 ppb: airway hypereactivity
-80ppb: associated with and inc. in
acute resp. infection, sore throat,
colds
-2-5ppm for 3 hrs.: airway
inflammation
(IgE, local IgA, IgG )
NO2- low concentrations:
impaired mucociliary clearance,
impaired local and cellular immunity.

Air pollution exacerbates
existing respiratory illness and
provokes asthmatic reaction
• Demonstrated by decrements in pulmonary
function testing ( flow rates, lung volumes,
impaired diffusion).
(
spirometry and body plethysmography indices
including FEV1, PEF, DLCO, TLC, IC, RV)
• Elevated levels of
biomarkers
detected in
exhaled air, blood, urine, sputum and
broncoalveolar lavage correlate with the above
(NO (exhaled nitric oxide), cell type and number,
cytokines, arachidonic acid metabolites, oxygen
radicals, fibronectin, protein, interleukins, TNF-α and
various enzymes
Document Outline
- Slide 1
- Slide 2
- Slide 3
- Slide 4
- Slide 5
- Slide 6
- Slide 7
- Slide 8
- Slide 9
- Slide 10
- Slide 11
- Slide 12
- Slide 13
Wyszukiwarka
Podobne podstrony:
Our contaminated world(air pollution)
Ściągi, Angielski 4, air pollution zanieczyszczenie powietrza alternative energy energia alternatywn
Air Pollution A Z
42 Air pollution PL
Air pollution
Air pollution control equipment selection guide
Law, Property Rights, and Air Pollution
Air Pollution A Z
AIR POLLUTION
SR 8 Adaptive Air Conditioning ULA[1]
DIELEKTRYKI cz1 AIR
Popular Mechanics Finding And Fixing Water And Air Leaks
Dawning Star Terraformer 10 Eotian Air Carriers
Prog wyk TMM AiR 2010
Poprawkowy AiR 2008 2009
więcej podobnych podstron