
In-tube solid phase micro-extraction–gas chromatography of
volatile compounds in aqueous solution
Boon Chong Dennis Tan,
a
Philip J. Marriott,*
a
Hian Kee Lee
b
and Paul D. Morrison
a
a
Royal Melbourne Institute of Technology, Department of Applied Chemistry, GPO Box
2476V, Melbourne, Victoria 3001, Australia. E-mail: Philip.Marriott@rmit.edu.au
b
National University of Singapore, Department of Chemistry, 10 Kent Ridge Crescent,
Singapore 119260, Singapore
Received 2nd March 1999, Accepted 30th March 1999
This paper describes the use of conventional coated capillary gas chromatography columns for sorption of organic
solutes from aqueous solution, with subsequent gas chromatographic analysis. The essential principles are similar
to those of solid phase extraction (SPE) and solid phase micro-extraction (SPME); this approach may be referred
to as in-tube solid phase micro-extraction (ITSPME). The technique was evaluated using toluene in water as the
initial test solute, and a mixture of BTEX solutes (benzene, toluene, ethylbenzene, xylenes) in Milli-Q water was
used to further characterise ITSPME. A 1 m length of capillary GC column was used for sorption of analytes from
aqueous solution passed through the capillary by using nitrogen pressure. Collection of small fractions of aqueous
solution issuing from the capillary enabled a sorption profile to be generated, with initial fractions depleted in
analyte. A Boltzmann curve could be fitted to the sorption profile data, exhibiting good agreement with
experimental data. For recovery of sorbed toluene, a single 100
mL aliquot of hexane was passed through the
column as a stripping solvent. The back-extraction step was quantitative. Equilibrium extraction of solutes shows
that the total amount of recovered solute is proportional to its initial concentration in the extracted aqueous
solution and allows distribution constants to be readily estimated. For BTEX solutes, K values were similar to
those reported for SPME and literature K
ow
values. For toluene, log K decreases from 2.47 to 1.48 when the
sorption column temperature increases from 20 to 30 °C; adding salt or reducing the pH of the aqueous solution
increases the degree of extraction of phenols, agreeing with general considerations on solute partitioning
behaviour.
Introduction
Solvent free sample preparation methods or those employing
less organic solvent are becoming increasingly important
1
and
may induce a major change in analytical methodology.
2
Practical alternatives to existing sample preparation methods
may therefore need to be formulated. Solid phase extraction
(SPE) and solid phase micro-extraction (SPME) have emerged
as efficient, popular alternative extraction techniques.
3
A broad
array of applications have been reported, such as determining
octanol–water partition coefficients,
4
detecting BTEX in water
5
and analysing pesticide solutions. Gas-phase extraction and a
variety of headspace applications are available. Whilst these
show that SPE and SPME are good alternative methods, basic
principles still require evaluation.
6
An effective alternative to
these techniques is presented in this paper, in-tube solid phase
micro-extraction (ITSPME). Recently, Pawliszyn and co-
workers have reported the automation of a similar approach
involving coupling of the extraction column to high-perform-
ance liquid chromatography (HPLC).
6
By extension, ITSPME
should also have the potential to be coupled to other analytical
instruments, such as gas chromatography (GC) or capillary
electrophoresis (CE).
ITSPME utilizes similar principles to SPME. Exhaustive
extraction might not occur, with equilibrium partitioning of the
analyte between the sample solution and the extraction medium
(the stationary phase coated to the inner walls of the extracting
capillary column). The sorbing phase can be selected according
to the type of analytes to be determined, e.g., a non-polar phase
if the analyte of interest is non-polar.
1,7
In ITSPME, analyte
solution is passed through the capillary at a reasonably slow
flow rate. The amount of analyte sorbed by the stationary phase
at equilibrium is directly related to its concentration in the
sample solution, which can be described in a similar manner to
SPME
1,4
by equation (1):
M
KV
C
V
KV
V
s
sample
sample s
s
sample
=
+
(1)
where M
s
is the mass of an analyte sorbed by the stationary
phase, V
s
and V
sample
are the volumes of the stationary phase and
the sample passing through the capillary column, respectively,
K is the partition coefficient of the analyte between the
stationary phase and the sample matrix, and C
sample
is the initial
concentration of the analyte in the sample in mass per unit
volume. As in SPME, if V
sample
is large (V
sample
> KV
s
), the
amount of the analyte extracted
8
is:
M
s
= KC
sample
V
s
(2)
Following aqueous sample extraction, the sorbed analyte can be
stripped from the stationary phase with minimum amount of
organic solvent, and the extract analysed by GC-FID. In
addition, the aqueous solution can be monitored both prior to
extraction and also in the stream which issues from the
extraction capillary. The problem of analysing aqueous samples
has been addressed.
9
Conceptually, ITSPME should preserve
the advantages of SPE and SPME, but may offer potential
benefits regarding quantitation and automation. ITSPME may
use conventional capillary GC columns for sorption, with
thermally stable, non-extractable bonded phases making the
phase more robust than thick film phases on fibres. Conversely,
thick films are not readily prepared for wall-coated capillary
columns. Thus, ITSPME possesses complementary advantages
to SPME, as outlined in this paper.
Analyst, 1999, 124, 651–655
651
Experimental
Reagents
All reagents used were of analytical reagent grade. Benzene,
toluene, ethylbenzene, o-xylene, m-xylene, p-xylene, m-ni-
trophenol, p-cresol, p-tert-butylphenol, 2,4-dichlorophenol,
2,4,6-trichlorophenol, acetone, hexane, methanol, potassium
chloride, sodium chloride, concentrated hydrochloric acid and
2-hexanone were purchased from BDH (Sydney, Australia) or
Aldrich (Sydney, Australia); Milli-Q water (Millipore, Bedford,
MA, USA) was used throughout. The following stock standard
solutions were prepared in water and hexane (BTEX analysis)
or methanol (phenols analysis): 100 mg L
21
toluene, 100
mg L
21
ethylbenzene, and mixtures of 100 mg L
21
of each
component of BTEX and 100 mg L
21
of each component of
phenols. 2-Hexanone (100 mg L
21
) in hexane solution and 100
mg L
21
o-xylene in methanol were also prepared. In order to
ensure that the chemicals were adequately dissolved in the
solvent, 0.5 mL of acetone was used to dissolve the reagent first,
followed by dilution as required with solvent Milli-Q water or
hexane.
5,10
The effect of pH and salt on efficiency of extraction
in the ITSPME technique was examined. A pH 2 buffer was
prepared with 25 mL of 0.2 m KCl and 6.5 mL of 0.2 m HCl in
100 mL of water, and saturated salt solutions were prepared
with NaCl.
Instrumentation
A Shimadzu GC 17A with an autosampler and FID detector
(Shimadzu Scientific Instruments, Rydalmere, NSW, Australia)
was used for all gas chromatographic analyses. The fused silica
capillary column used for GC was 30 m
3 0.25 mm with 0.25
mm film thickness BPX5 phase (SGE International, Ringwood,
Australia). The conditions for the analysis were as follows.
BTEX analysis: column flow approximately 1.9 mL min
21
;
linear velocity approximately 35.6 cm s
21
; column oven at
93 °C (this temperature allowed acceptable analysis time
without causing the toluene peak to overlap with trace acetone
solvent peak); injection port at 250 °C with split injection (split
ratio 1 : 20); FID detector at 320 °C. Phenols analysis: column
flow approximately 1.4 mL min
21
; linear velocity approx-
imately 30 cm s
21
. The injector, operated in splitless mode, was
maintained at 200 °C; the FID detector was at 275 °C. The
temperature program was 50 °C for 1 min, ramp to 190 °C at
10 °C min
21
, final hold time 1 min at 190 °C.
In-tube solid phase micro-extraction (ITSPME). To
perform extraction of BTEX and phenols using ITSPME, 2
different types of capillary GC columns were used. The first was
1 m long, 0.25 mm internal diameter with 3.5
mm thick BP1
(100% methylsiloxane) stationary phase, while the second was
1 m long, 0.32 mm internal diameter with 1
mm thick BP20
(polyethylene glycol) stationary phase (both columns from SGE
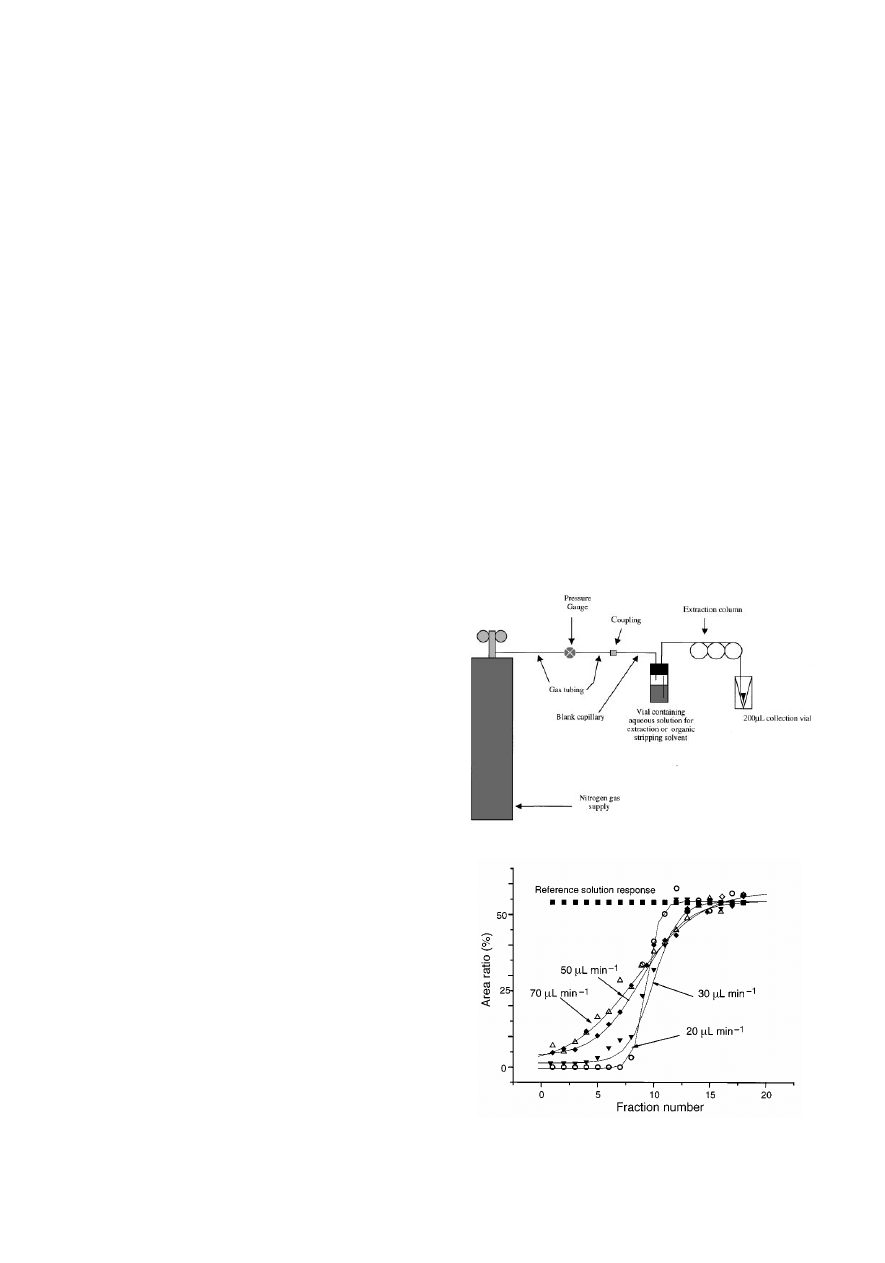
International, Ringwood, Australia). Nitrogen gas was used to
provide head pressure to the sample vial to force the aqueous
solution through the capillary (Fig. 1). Most extractions were
carried out at 20 °C and the capillary may be immersed in a
water bath for temperature control. Two forms of extraction
were performed, forward extraction and back extraction, as
described below.
Forward extraction. A volume of solution (in water) was
prepared at the desired concentration from the stock solution. It
was then forced through the capillary by applying nitrogen head
pressure. Solution was passed through as a continuous stream,
and collected in separate vials in 100
mL volumes or fractions.
A suitable internal standard was added in the fractions. The
analytical results of the collected aliquots could be used to
generate a sorption profile. A separate standard was prepared in
water to serve as a reference solution against which the
collected aliquots could be compared. The extraction experi-
ment may be conducted with different linear velocities of
aqueous solution passing through the capillary column, by
means of controlling the head pressure of nitrogen in the vial
using control gauge pressure.
Back extraction. After a specific volume of solute in water at
a fixed concentration was passed through the extraction
capillary column, the capillary was dried with a nitrogen flow
and then a minimum volume of organic solvent was passed
through the extracting capillary to strip the sorbed solute. A
suitable internal standard was added, and the solution was
analysed by using GC-FID. The result was then compared with
the calibration plot from a series of standard solutions in the
same organic solvent to estimate the amount of recovered
solute.
Results and discussion
Sorption profiles
Using forward extraction, four sorption profiles of aqueous
toluene passing through the 1 m capillary GC column at flow
rates of 20, 30, 50 and 70
mL min
21
were obtained. The 100
mL
fractions collected were analysed by GC-FID after addition of
the internal standard. Each flow rate was repeated 3 times and
Fig. 2 presents representative results from individual studies.
Fig. 1
Experimental set up for the ITSPME technique.
Fig. 2
Experimental sorption profiles for toluene at different flow rates.
Lines of best fit based on a Boltzmann distribution are shown for each set
of data. (2) 20
mL min
21
; (!) 30
mL min
21
; (/) 50
mL min
21
; (Ω) 70
mL min
21
.
652
Analyst, 1999, 124, 651–655
Variation in peak areas or area ratios may arise from (i) injection
volume uncertainty, or (ii) variation in volume of either the
collected toluene fraction or the added ethylbenzene volume.
The toluene volume has the greatest uncertainty since the 100
mL volumes collected could not be controlled with precision. An
alternative procedure would involve weighing the collection
vial. For the 20
mL min
21
flow data, the absence of toluene in
fractions up to fraction 4 is noted; fraction 13 and later fractions
have essentially the same level of toluene as that in the reference
solution, shown as a broken line in Fig. 2, indicating 100%
‘breakthrough’. As the flow rate, and hence velocity, of the
aqueous toluene through the extracting capillary increases,
extraction is less complete for the early collected fractions, and
traces of toluene could be detected in fraction 1 of the sorption
profiles for faster flow rates. The curves also become less steep
than those at slow velocities. Experimental uncertainties meant
that data for the extraction profile did not precisely fit a smooth
curve; however, a Boltzmann-type curve could be fitted to
experimental data, as seen for the sorption profile data in Fig. 2.
The steepness of the curve increased for slower flow rates.
Integration of the Boltzmann equation can be used to give an
estimate of the total sorbed solute amount.
Determination of partition coefficient, K, for toluene
between water and BP1 phase
The 1 m BP1 capillary has a stationary phase volume of 2750
nL. Each 100
mL fraction of aqueous solution passing through
the capillary has a maximum amount of 2
mg of toluene that can
be sorbed, with less sorbed when breakthrough occurs. Using
results for a 20
mL min
21
flow of aqueous toluene, the total
amount of toluene sorbed by the capillary is 16.2
mg (Table 1).
Using K = C
s
/C
m
(where C
s
is the concentration in the
stationary phase and C
m
the concentration in the mobile phase)
the K value of toluene between water and stationary phase can
be calculated. At equilibrium (i.e., at 100% breakthrough) C
s
=
16.2
mg per 2750 nL = 5801 mg L
21
and C
m
is the
concentration of the original toluene standard, i.e., C
m
= 20
mg L
21
. Thus, log K = 2.47, which is in good agreement with
the K value determined by equation (2), log K
ow
and log K
determined from SPME (Table 2)
8,11–16
reported for the same
temperature. Recovery of the sorbed toluene by back extraction
should yield 81 mg L
21
of toluene (16.2
mg per 100 mL of
hexane, diluted 1 : 1 with IS solution). The 100
mL hexane strip,
with an added IS, was found to contain 66 mg L
21
toluene,
indicating a recovery of about 80% toluene; again, the volume
uncertainty can lead to error in the calculated value.
Determination of partition coefficient, K, for BTEX
compounds
K values for BTEX compounds were determined as above, in
triplicate. A 2.5 mL mixture of BTEX (each 20 mg L
21
) in
Milli-Q water was passed through the capillary and it was
assumed that each solute reached 100% sorption. Results
showed that different analytes had different recoveries, and
hence a different affinity for the stationary phase of the
extraction column. K values are reported and compared to
literature log K
ow
and log K (SPME) values (for a BP1-like
coating fibre) (Table 2). Good agreement was found, so
apparently the methyl siloxane stationary phase behaves
similarly to octanol in the octanol–water partition experiment.
Dependence of ITSPME on extraction temperature,
solution pH and salt content
The back extraction procedure for 20 mg L
21
toluene was
repeated at least 4 times with the same piece of capillary to
ensure that the extraction was consistent. The extraction was
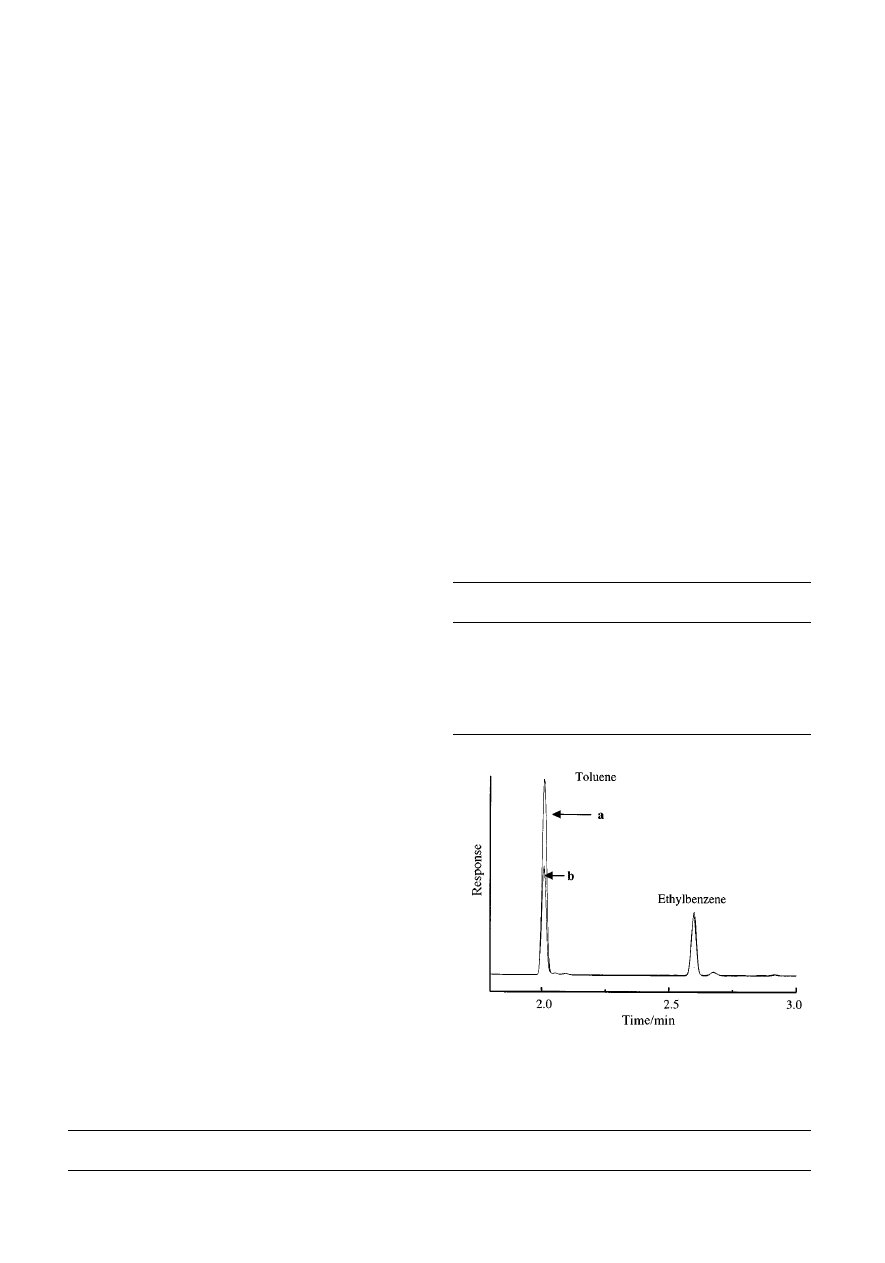
then carried out at a temperature of 30 °C, with a decrease in the
amount of toluene sorbed expected and confirmed (Fig. 3).
Increasing the temperature decreases the analyte C
s
; in other
words, there is less affinity for the stationary phase. Log K at
30 °C is estimated to be 1.48 and a temperature increase of
10 °C decreases the value of K by a factor of 10. This result is
as expected from chromatographic results, where higher
temperature gives a smaller retention volume in GC and in
HPLC, and so smaller k and K values. Since salt affects solute
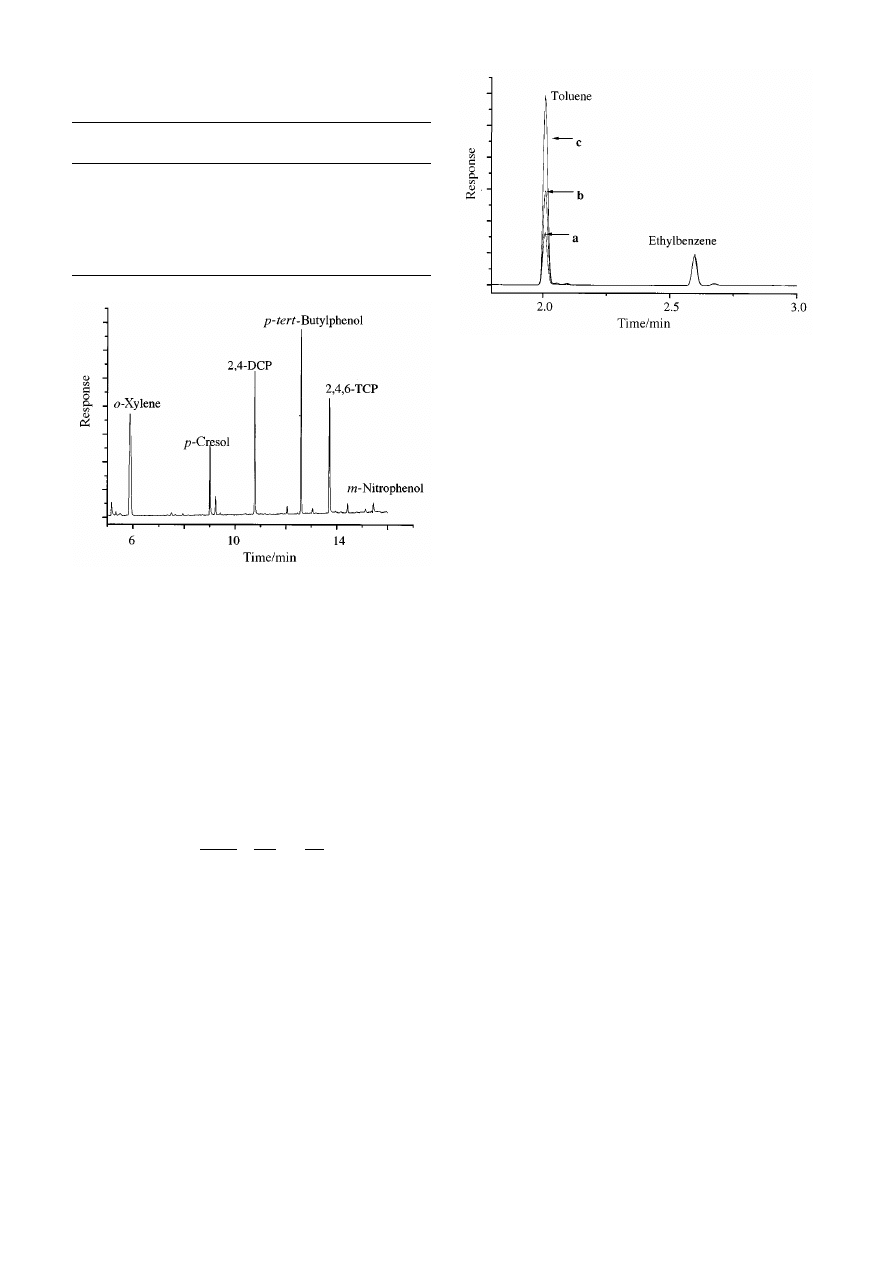
solubility, a further study to test ITSPME for extraction of
phenols from aqueous solution showed that both saturated salt
solution and lowering the solution pH increase the extent of
extraction by up to 10–20 times. For example, from Table 3
data, the peak for 2,4,6-TCP increases by about 3.5-fold, and p-
tert-butylphenol by about 25-fold. Fig. 4 is a representative GC
trace of the extraction of the saturated salt, pH 2 buffered,
aqueous solution. Since pKa values of phenols are
!7, there is
Table 1
Estimated amount of toluene sorbed per 100
mL of aqueous solution for the 20 mL min
21
sorption profile at 20 °C
Fraction number
1
2
3
4
5
6
7
8
9
10
11
12
13
Total
Toluene sorbed/
mg
2
2
2
2
2
1.7
1.6
1.3
0.9
0.5
0.2
0
0
16.2
Table 2
Distribution coefficient, K, data determined by ITSPME in
comparison with literature log K
ow
and log K (SPME) (for 100% methyl
siloxane coating)
BTEX
compound
Log K
(ITSPME)
a
Log K
ow
Log K (SPME)
b
Benzene
1.77 (7.4)
2.13
17
, 2.13
15
2.30
11
, 2.10
12
, 2.30
8
Toluene
2.47 (4.2)
2.69
17
, 2.69
15
2.88
11
, 2.53
12
, 2.88
8
Ethylbenzene
2.75 (3.9)
2.84
13
, 3.15
15
3.33
11
, 2.72
12
, 3.33
8
p- and m-Xylene 2.81 (4.8)
3.15
14
3.31
11
, 3.31
8
o-Xylene
2.69 (5.0)
2.77
14
, 2.77
15
3.26
11
, 2.82
12
, 3.26
8
a
Experimental value, this work; triplicate determinations; %rsd values in
parentheses.
b
Values quoted for SPME studies.
Fig. 3
Chromatograms of the hexane strip with different temperatures
used for the aqueous extraction of 20 mg L
21
of toluene. Curve a, extraction
capillary at 20 °C; curve b, extraction capillary at 30 °C.
Analyst, 1999, 124, 651–655
653
only a moderate increase in extracted amounts with reduction in
pH.
Linearity of ITSPME extraction of toluene from water
Equilibrium extraction conditions are established between the
aqueous and stationary phase, so concentration and recovered
solute should be linearly correlated.
11,16
According to chroma-
tographic theory, the partition ratio, k, is [equation (3)]
k
C V
C V
N
N
K
V
V
=
=
=
s s
m m
s
m
s
m
(3)
where N
s
and N
m
are the number of moles of toluene in the
stationary phase and mobile phase, respectively, and V
s
and V
m
are the volumes of the respective phases (note that V
m
/V
s
is
normally referred to as the phase ratio). Rearranging the
expression (3), and substituting C
m
V
m
for N
m
, gives
N
s
= KV
s
C
m
= AC
m
where A = KV
s
= constant at a given temperature. Back
extraction of 10, 20 and 40 mg L
21
aqueous solutions of
toluene, with added internal standard, was conducted in
triplicate with an %RSD of about 4% for each concentration.
Fig. 5 shows an overlay of one representative GC trace for each
extracted concentration. The calibration graph of concentration
versus area ratio (toluene/IS) had an R
2
of 0.999. The gradient
of the line allows determination of the partition coefficient if the
volume of the stationary phase is known. The slope A is
approximately 0.83 mL, giving an estimated log K value of
2.48, which is close to the previous estimation of log K for
toluene between water and BP1 stationary phase.
Conclusions
Initial studies have proven ITSPME to be an effective extraction
technique. Due to the availability of different polarity stationary
phases, optimised extractions for target analytes of interest in
routine analysis should be possible. If the extraction column is
directly connected to the analytical column, maximum mass
conservation in transferring the sorbed analyte to the analytical
step can be realised. The first experiments using this have been
encouraging. A solvent vent or waste line is required, and rather
than solvent stripping, thermal desorption of extracted analyte
will be explored with refocussing of the analyte at the head of
the analytical column to minimise band broadening. A simple
solution to this problem will be to use a recently demonstrated
cryogenic technique to focus the target analyte band on the
analytical column prior to chromatographic analysis.
18
This
preconcentration effect makes ITSPME suitable for sample
preparation for trace analysis.
Results presented here were logical and in agreement with
expectations. The K values determined by ITSPME are
comparable to those obtained with SPME and literature K
ow
values. It is anticipated that ITSPME will be suitable for routine
analysis. The extraction capillary column can be re-used; thus
far, there have been no carry-over problems, nor any evidence
of performance deterioration in the extracting column. Bonded
phase capillary columns are stable to organic solvent flushing.
Large particulate material may require filtration prior to
extraction, and, if necessary, a water rinse can be included
between sorption and back extraction.
Acknowledgement
The authors wish to thank SGE International, Ringwood,
Australia for providing the GC capillary columns for perform-
ing the extractions and Shimadzu Scientific Instruments,
Rydalmere, Australia for GC facilities.
References
1
Z. Zhang, M. J. Yang and J. Pawliszyn, Anal. Chem., 1994, 66,
844A.
2
D. Noble, Anal. Chem., 1993, 65, 693A.
3
C. L. Arthur and J. Pawliszyn, Anal. Chem., 1990, 62, 2145.
Table 3
Comparison of extracted amounts of phenols (10 mg L
21
each)
from different aqueous matrices, as area ratio per cent of phenol peak/
xylene internal standard
Milli-Q water
pH 2 buffer
pH 2 buffer
+ salt
a
p-Cresol
10.1 (4.0)
b
11.3 (6.2)
27.0 (3.7)
2,4-DCP
8.2 (9.6)
11.7 (3.4)
55.1 (2.0)
p-tert-butylphenol
21.3 (2.8)
25.2 (9.1)
72.3 (4.3)
2,4,6-TCP
1.9 (6.2)
5.8 (3.5)
47.1 (5.5)
m-Nitrophenol
0.7 (14.3)
1.6 (12.5)
4.5 (17.8)
a
Refer to Fig. 4 for the chromatogram of this solution.
b
%RSD (n =
3) values in parentheses.
Fig. 4
Chromatogram of phenols sorbed from solution saturated with salt
and buffered to pH 2. BP20 polyethylene glycol capillary used for sorption,
with phenols back extracted from the capillary with 190
mL methanol. o-
Xylene (10
mL of 25 mg L
21
concentration) was added to collected
methanol as internal standard.
Fig. 5
Chromatograms of the hexane strip for aqueous extractions of
toluene aqueous solution concentrations of (a) 10 mg L
21
, (b) 20 mg L
21
and (c) 40 mg L
21
. Ethylbenzene is added to each extracted solution as
internal standard at 25 mg L
21
.
654
Analyst, 1999, 124, 651–655

4
J. R Dean, W. R. Tomlinson, V. Makovskaya, R. Cumming, M.
Hetheridge and M. Comber, Anal. Chem., 1996, 68, 130.
5
S. P. Thomas, R. Sri Ranjan, G. R. B. Webster and L. P. Sarna,
Environ. Sci. Technol., 1996, 30, 1521.
6
J. Pawliszyn and R. Eisert, Anal. Chem., 1997, 69, 3140.
7
R. G. Belardi and J. Pawliszyn, Water Pollut. Res. J. Can., 1989, 24,
179.
8
C. L. Arthur, D. W. Potter, K. D. Buchholz, S. Motlagh and J.
Pawliszyn, LC-GC, 1992, 10, 656.
9
K. Grob, Split and Splitless Injection in Capillary Gas Chromato-
graphy with some remarks on PTV Injection; Huthig Verlag,
Heidelberg, Germany, 1993.
10
C. L. Arthur, L. M. Killam, K. D. Buchholz, J. Pawliszyn and J. P.
Berg, Anal. Chem., 1992, 64, 1960.
11
D. W. Potter and J. Pawliszyn, J. Chromatogr., 1992, 625, 247.
12
C. L. Arthur, L. M. Killam, S. Motlagh, D. W. Potter and J.
Pawliszyn, Environ. Sci. Technol., 1992, 26, 979.
13
C. T. Chiou, D. W. Schmedding and M. Manes, Environ. Sci.
Technol., 1982, 16, 4.
14
K. Verschuren, Handbook of Environmental Data on Organic
Chemicals, Van Nostrand Reinhold, New York, USA, 2nd edn.,
1983.
15
C. T. Chiou, Environ. Sci. Technol., 1985, 19, 57.
16
L. P. Sarna, G. R. B. Webster, M. R. Friesen-Fischer and R. Sri
Ranjan, J. Chromatogr. A, 1994, 677, 201.
17
T. Fujita, J. Iwasa and C. Hansch, J. Am. Chem. Soc., 1964, 86,
5175.
18
R. M. Kinghorn and P. J. Marriott, Anal. Chem., 1997, 69, 2582.
Paper 9/02567G
Analyst, 1999, 124, 651–655
655
Wyszukiwarka
Podobne podstrony:
Comparison of Different Fibers in the Solid Phase Microextra
Solid phase microextraction for the detection of termite cut
Solid phase microextraction for the analysis of biological s
Application of Solid Phase Microextraction Gas Chromatograp
Solid phase microextraction coupled to gas chromatography a
AIRBORNE SAMPLES SOLID PHASE extraction
bioanalitical apllications solid phase extraction
Solid Phase Microextraction Analyses of Flavor Compounds in
AIRBORNE SAMPLES SOLID PHASE extraction
Solid phase microextration in biomedical analysis
Solid phase microextraction for herbicide determination in
Kinetics of solid phase extraction and solid phase microextr
Solid phase microextraction in pesticide residue analysis
Trends in solid phase microextraction for
Gas Chromatpgraphy Overview
Polypeptide Synthesis, Solid Phase Method
kwasy gas chromatography
więcej podobnych podstron