
TRAC 2565 27-7-99
Trends in solid-phase microextraction for
determining organic pollutants in
environmental samples
A. Penìalver, E. Pocurull, F. Borrull, R.M. Marceè*
Department de Qu|èmica Anal|ètica i Qu|èmica Orgaénica, Universitat Rovira i Virgili, Imperial Tarraco 1,
43005 Tarragona, Spain
Solid-phase microextraction (SPME) is a
recent technique for sample preparation. It
has been used successfully to analyze envi-
ronmental pollutants in a variety of matrices
such as soils, water, and air. SPME is a sol-
vent-free technique which has a number of
advantages over more conventional sample
preparation techniques such as liquid^liquid
extraction (LLE) and solid-phase extraction
(SPE). We describe the most recent develop-
ments in SPME and some which are being
developed, including its coupling to HPLC
and CE, the use of new ¢bers, and the automa-
tion of the entire SPME process and its appli-
cation to ¢eld analysis. A summary is given of
the most important parameters for applying
this extraction technique to the analysis of
environmental samples. z1999 Elsevier Sci-
ence B.V. All rights reserved.
Keywords: Solid-phase microextraction; Environmental
analysis; Organic compounds; Extraction techniques
1. Introduction
Solid-phase microextraction (SPME) is a relatively
new extraction technique. Devised by Pawliszyn and
his coworkers [ 1], it represents a valuable advance in
sample preparation and has a number of advantages
over conventional techniques for extracting organic
compounds from environmental samples. These
include liquid^liquid extraction (LLE) [ 2 ] and
solid-phase extraction (SPE) [ 3,4 ] for semivolatile
and non-volatile compounds, or headspace extraction
[ 5 ] and purge-and-trap (P and T) [ 6 ] for volatiles.
Solid-phase microextraction is based on the parti-
tion equilibrium of target analytes between a poly-
meric stationary phase, which is a coated fused silica
¢ber, and the sample matrix. In order to extract analy-
tes SPME does not require organic solvents, which are
expensive and may be harmful to health and to the
environment. The technique is very simple, fast, easily
automated, portable, and inexpensive. Also, only
small volumes of sample are needed. SPME can be
coupled easily to gas chromatography (GC) and,
with some modi¢cations, to high-resolution liquid
chromatography (HPLC) [ 7^10 ]. Recently, SPME
has also been coupled to capillary electrophoresis
(CE) [ 11,12 ], and the automated systems SPME^
GC [ 13,14 ] and SPME^HPLC [ 9 ] have been devel-
oped, which use conventional GC and HPLC autosam-
plers. New developments in SPME devices and ¢bers
make SPME a very promising technique for ¢eld anal-
yses [ 15,16 ]. Furthermore, solid-phase microextrac-
tion has proved to be very useful for achieving chem-
ical measurements such as in the determination of the
free concentration of organic compounds in complex
sample matrices [ 17 ], and the water solubility and the
octanol-water partitioning of hydrophobic chlorinated
substances [ 18 ].
The technique was introduced to determine rela-
tively volatile compounds in environmental samples,
but its use has now extended to the analysis of a wide
variety of matrices and analytes. To date, SPME has
been used successfully to analyze gaseous, liquid and
solid samples. Also, a wide range of analytes from
volatile to non-volatile compounds has been deter-
mined by SPME. They include environmental pollu-
tants such as pesticides [ 7,19^27 ], phenols [ 28^31],
polychlorinated biphenyls (PCBs) [ 32,33 ], polycy-
clic aromatic compounds (PAHs) [ 8,17,34 ] and, to
a lesser extent, inorganic compounds [ 35 ].
This review covers the most recent developments
and applications of SPME for determining organic
pollutants in environmental samples. We also summa-
rize the application of the most recently developed
SPME ¢bers and the effect of the various parameters
0165-9936/99/$ ^ see front matter
ß 1999 Elsevier Science B.V. All rights reserved.
PII: S 0 1 6 5 - 9 9 3 6 ( 9 9 ) 0 0 1 4 5 - 4
*Corresponding author.
trends in analytical chemistry, vol. 18, no. 8, 1999
557

TRAC 2565 27-7-99
that should be considered when developing method-
ologies based on solid-phase microextraction.
2. SPME procedure
The SPME process comprises two steps. First, the
target analytes are extracted from a sample matrix by
exposing a coated ¢ber to the sample for a predeter-
mined time. Secondly, the ¢ber is removed from the
sample and the retained analytes are then desorbed in
an analytical instrument in order to be separated and
quanti¢ed. The desorption step is usually carried out
by placing the ¢ber in a hot injector of a gas chromato-
graph (thermal desorption). It can also be performed
in an HPLC system by introducing an SPME^HPLC
interface. The entire process is very simple and can be
automated and coupled to GC [ 13,14 ] or HPLC [ 9 ].
Two basic types of sampling can be performed
using SPME: direct extraction, and headspace extrac-
tion, which is also called headspace solid-phase
microextraction (HS-SPME) [ 1]. In direct sampling,
the ¢ber is directly immersed in the liquid or gaseous
sample, while in HS-SPME the ¢ber is suspended in
the space above the sample. Direct extraction can be
applied to the analysis of gaseous and relatively clean
liquid samples. HS-SPME is better for analysing dirt-
ier liquid samples and can also be applied to solid
samples. As an example, Popp and Paschke [ 36 ] com-
pared the extraction of BTEX compounds from water
by direct immersion or by extracting them from the
headspace by using two different ¢bers, 80 Wm car-
boxen-polydimethylsiloxane (carboxen-PDMS) and
100 Wm polydimethylsiloxane (PDMS). Table 1
shows the limits of detection (LOD) of BTEX com-
pounds from both the direct immersion and headspace
sampling modes. For example, with the PDMS coating
the results for the most volatile compounds were better
using the extraction from the headspace.
The theory of the thermodynamic and kinetic
aspects of the SPME process, both using direct and
headspace extraction, have been studied widely
[ 1,37 ]. Thermodynamic studies have shown that the
amount of analyte extracted by the coating at the equi-
librium time is directly proportional to the concentra-
tion of the analyte in the sample, and is independent of
the location of the ¢ber in the system. The terms `par-
tition coef¢cient' or `distribution constant' between
the ¢ber coating and the sample matrix (K
fs
), or the
headspace (K
fh
), were introduced. The partition
coef¢cients are temperature dependent and character-
istic of each coating-analyte pair. Mathematical mod-
els which describe the kinetics of the absorption proc-
ess in both the direct and headspace extraction modes,
have also been developed [ 1]. The equilibrium time
depends on the analyte's diffusion rate from the sam-
ple into the coating and can be quite different if the
¢ber is directly immersed in the sample or in the head-
space. Usually, equilibration times are greater in the
headspace than with direct immersion.
2.1. Parameters which affect the absorption
process
The amount of analyte extracted by the ¢ber in
SPME can be affected by several parameters, e.g. the
characteristics of the coating, the temperature and time
of the extraction process, the addition of salt or an
organic solvent to the sample, pH modi¢cation, agi-
tation of the sample, and the sample volume. Matrix
effects and the introduction of a derivatization step can
also affect the extraction of analytes in SPME.
Table 1
Detection limits (LOD) of BTEX compounds for direct immersion and headspace sampling modes, with two different coatings,
polydimethylsiloxane and carboxen-polydimethylsiloxane (reprinted with permission from [ 36 ])
Substance
LOD (ng l
31
)
Headspace extraction
Direct extraction
80 Wm carboxen-PDMS
100 Wm PDMS
80 Wm carboxen-PDMS
100 Wm PDMS
Benzene
55
480
45
1200
Toluene
50
430
35
550
Ethylbenzene
60
225
35
225
m-Xylene+p-xylene
60
200
40
215
o-Xylene
55
215
35
220
558
trends in analytical chemistry, vol. 18, no. 8, 1999

TRAC 2565 27-7-99
2.1.1. Coatings
The choice of the most suitable coating is very
important for achieving good selectivity for the target
analytes. The principle of `like dissolves like' can be
applied to ¢ber selection. As shown in Table 2, a num-
ber of polymers is available commercially as coatings
for SPME ¢bers. In addition to these commercially
available ¢bers, some authors have developed other
methods for preparing `custom-made' ¢bers which
present speci¢c properties for extracting selected ana-
lytes [ 38,39 ]. For example, Mangani and Cenciarini
[ 38 ] have developed a method for coating a fused
silica ¢ber with graphitized carbon black, Carbograph
1. Fibers coated by phenyl, C
8
, and monomeric and
polymeric C
18
stationary phases have also been devel-
oped and applied to determine PAHs in water samples
[ 39 ].
Polydimethylsiloxane and polyacrylate were the
¢rst coated ¢bers to be used for SPME. PDMS is apo-
lar and presents a high af¢nity for non-polar com-
pounds such as BTEX compounds ( benzene, toluene,
ethylbenzene and xylene) [ 40 ], volatile organic com-
pounds (VOCs) [ 41^43 ] and some pesticides
[ 25,27 ]. Polyacrylate is a more polar coating and
extracts more polar compounds, such as phenols and
their derivatives [ 28^31] and some pesticides [ 7,19^
24,26,27 ]. Coatings containing the more porous and
adsorbent materials, divinylbenzene (DVB), and car-
boxen blended in PDMS or Carbowax (CW), have
been introduced more recently: PDMS-DVB,
PDMS-carboxen and CW-DVB. These ¢bers are
more polar than PA and are suitable for extracting
more polar compounds such as alcohols and ethers
[ 44 ]. Moreover, carboxen-PDMS ¢bers have a larger
surface area and show great potential for extracting
organic compounds, such as VOCs with low molec-
ular weight, from the air [ 43 ]. As Table 1 shows,
PDMS-carboxen ¢bers offer much better results than
PDMS ¢ber for extracting BTEX compounds from
water. The DVB-TPR ¢ber, owing to the pore dimen-
sion in the coating, is designed to reduce molecular
weight discrimination between analytes which vary in
chain length [ 11].
The ¢rst SPME ¢bers were developed for GC use.
Nowadays, some coating ¢bers have been developed
for use in HPLC. The desorption step in HPLC can
only be performed when the ¢ber coating is stable to
the addition of organic solvents. Only bonded phases
are compatible with all organic solvents. Table 2
shows the recommended use (GC, HPLC, or both)
for the commercially available ¢bers.
Table 2
Fiber coatings commercially available for SPME use
Fiber coating
Film
thickness
Recom-
mended use
Maximum
temperature
(for GC use)
Application
Polydimethylsiloxane (PDMS)
100 Wm
c
GC^HPLC
280³C
Non-polar organic compounds
30 Wm
c
GC^HPLC
280³C
such as VOCs, PAHs and BTEX
7 Wm
a
GC^HPLC
340³C
Polyacrylate (PA)
85 Wm
b
GC^HPLC
320³C
Polar organic compounds such
as triazines and phenols
Polydimethylsiloxane-divinylbenzene (PDMS-DVB)
65 Wm
b
GC
270³C
Aromatic hydrocarbons and
60 Wm
b
HPLC
^
small volatile analytes such as
solvents; air analysis
Carboxen-polydimethylsiloxane (Carboxen-PDMS)
75 Wm
b
GC
320³C
VOCs and hydrocarbons
Carbowax-divinylbenzene (CW-DVB)
65 Wm
b
GC
265³C
Polar organic compounds such
as alcohols
Carbowax-templated resin (CW-TPR)
50 Wm
b
HPLC
^
Anionic surfactants
a
Bonded phase.
b
Partially cross-linked phase.
c
Non-bonded phase.
trends in analytical chemistry, vol. 18, no. 8, 1999
559

TRAC 2565 27-7-99
2.1.2. Time and temperature of the extraction
process
Since SPME is based on an equilibrium distribution
process, the maximum amount of analyte will be
extracted at the equilibrium time. Stirring the sample
reduces the time needed to reach equilibrium because
it enhances the diffusion of analytes towards the ¢ber.
Compounds with low distribution constants have long
equilibration times, so an extraction time shorter than
the equilibrium time has to be selected. In this
instance, the exposure time must be controlled very
well to ensure good reproducible data.
The extraction temperature has two opposing
effects on the SPME process. An increase in temper-
ature during extraction enhances the diffusion of ana-
lytes towards the ¢ber. Moreover, in the HS-SPME
sampling mode, the temperature helps transfer analy-
tes to the headspace. On the other hand, this increase in
temperature reduces the distribution constant of the
analytes because the absorption step is an exothermic
process. Pawliszyn et al. [ 1] introduced a modi¢ca-
tion of SPME, called internally cooled ¢ber SPME, to
solve this problem. This device allows the sample to be
heated and the ¢ber to be cooled simultaneously, thus
making the extraction process more ef¢cient.
2.1.3. pH modi¢cation and addition of salt
One way of increasing the amount of some analytes
retained in the ¢ber coating is given by adjusting the
pH. The pH of the sample can be adjusted to values
which enhance the presence of neutral form in the
extraction of acid and basic analytes such as phenols
and amines.
Most studies have shown that by the addition of a
salt, usually sodium chloride, the retention of the ana-
lytes in the ¢ber coating increases. For example, for
polar analytes such as triazines, the sensitivity can be
increased by a factor of up to ten [ 27 ]. This addition of
salt usually increases the ionic strength of the sample.
This reduces the solubility of analytes which are more
easily retained. This effect is not general and depends
on the polarity of the analyte, the concentration of salt,
and the sample matrix.
2.1.4. Addition of solvent
The addition of an organic solvent to aqueous sam-
ples has not yet been widely investigated. The pres-
ence of organic solvents in water samples usually
reduces the amount of analyte extracted. For example,
Eisert and Levsen [ 26 ] showed that increasing the
methanol content up to 20% reduced the peak response
of triazine compounds by a factor of two. On the other
hand, in soils and sludges, the addition of water or
organic solvents to the sample matrix provides a
very useful approach. Water or solvent is added to
remove analytes from the matrix and to enhance the
diffusion of analytes from the sample towards the ¢ber
coating [ 1].
2.1.5. Agitation of the sample
Stirring of the sample enhances the diffusion of the
analytes towards the ¢ber coating and reduces the
extraction time for both direct immersion and head-
space extraction [ 1]. In HS-SPME, stirring also facil-
itates mass transfer between the headspace and the
aqueous phase. Magnetic stirring is the most com-
monly used agitation technique but this does not mix
the sample ef¢ciently. Alternative stirring techniques,
such as sonication and intrusive mixing, improve the
extraction times but still do not provide perfect agita-
tion of the sample. More recent developments, such as
¢ber vibration and £ow-through cell design, should be
considered, especially for automated SPME systems
[ 13 ].
2.1.6. Volume of the sample
The sample volume is an important parameter to be
optimized in SPME because it is directly related to the
sensitivity of the method. The volume of the sample is
usually much higher than the volume of the ¢ber, and
the amount of analyte extracted is only proportional to
the partition coef¢cient, the sample concentration, and
the ¢ber volume. The partition coef¢cients of the ana-
lytes between the sample matrix and the ¢ber should
be considered because compounds with large K
fs
do
not achieve this approximation and are more affected
by changes in sample volume than compounds with
small af¢nities to the ¢ber. For this reason, a good
criterion for choosing the best sample volume uses
the value of K
fs
for the analytes [ 1].
In HS-SPME, the analytes are distributed among
the sample matrix, the ¢ber coating, and the head-
space, and the headspace volumes must generally be
small in order to concentrate the analytes before they
diffuse towards the ¢ber coating. If the headspace vol-
ume is too large, the sensitivity reduces considerably
[ 22 ].
2.1.7. Matrix effects
Some authors have investigated the effects of
matrix on the extraction ef¢ciency of analytes [ 19 ].
Organic matter such as humic and fulvic acids which
are present in real water samples can reduce the
amount of analyte extracted, owing to the interaction
560
trends in analytical chemistry, vol. 18, no. 8, 1999
TRAC 2565 27-7-99
between dissolved organic matter (DOM) and the ana-
lytes. For example, Poërschmann et al. [ 17 ] used
SPME to determine the binding state of low molecular
mass pollutants such as phenols and PAHs in conta-
minated water rich in humic organic matter.
2.1.8. Derivatization
Derivatization can enable polar compounds in envi-
ronmental samples to be determined by SPME. This
step and the SPME can be combined in three different
ways; direct derivatization in the sample matrix, deri-
vatization in the ¢ber coating, and derivatization in the
GC injection port [ 45 ].
The ¢rst approach is direct derivatization in the
sample matrix, followed by extraction of the deriva-
tives by SPME. For example, this has been used to
determine phenols by transforming them into the cor-
responding acetate derivatives before SPME [ 31].
Derivatization in the ¢ber coating can be achieved in
two ways: simultaneous derivatization and extraction,
and derivatization after extraction. In the ¢rst case, the
¢ber containing the derivatizing reagent is exposed to
the sample which contains the analytes. This approach
is very interesting because it can be applied in ¢eld
analysis [ 1]. In the second case, the analytes are
extracted by the ¢ber and then exposed to the deriva-
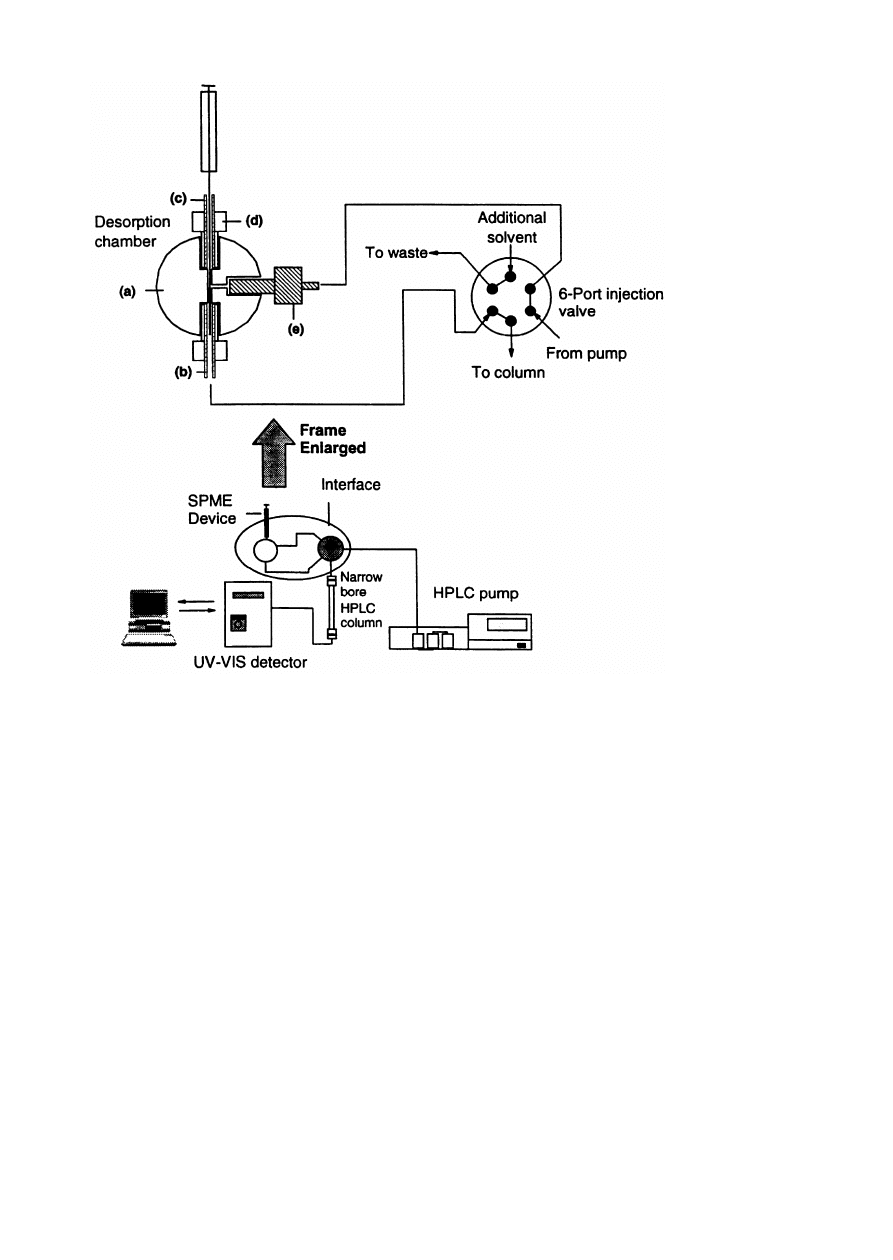
Fig. 1. SPME^HPLC interface: (a) stainless steel 1/16 in. tee; ( b) 1/16 in. stainless steel tubing; (c) 1/16 in. PEEK tubing
(0.02 in. i.d.); (d) two-piece, ¢nger-tight PEEK union; (e) PEEK tubing (0.005 in. i.d.) with a one-piece PEEK union. Reprinted,
with permission, from [ 1].
trends in analytical chemistry, vol. 18, no. 8, 1999
561
TRAC 2565 27-7-99
tizing reagent. Derivatization in the GC injection port
is performed when the analytes can be derivatized
when exposed to high temperatures. For example,
Pan and his coworkers [ 46 ] used this approach for
the determination of long-chain carboxylic acids in
water samples.
2.2. The desorption process
The analytes retained in the ¢ber coating can be
desorbed by GC, HPLC, or CE. To date, most appli-
cations of SPME are performed using GC because the
combination is very simple.
2.2.1. SPME^GC
SPME can easily be coupled to GC because the
injection port of the gas chromatograph can be used
for the thermal desorption of analytes from the ¢ber.
When the temperature increases, the af¢nity of analy-
tes towards the ¢ber is reduced and they are liberated.
Moreover, the £ow of carrier gas within a gas chroma-
tograph injector also helps to remove the analytes from
the ¢ber and to transfer them into the gas chromato-
graphic column. Insert liners with low volumes are
required to ensure rapid transfer of desorbed analytes
to the chromatographic column [ 1]. Desorption is
usually achieved in less than two minutes for most
compounds. Thermal desorption in GC can be affected
by several parameters such as the temperature of
the GC injector and the £ow rate of the carrier gas
that determines the desorption time of the SPME
process. In general, the injector temperature is set
at the maximum temperature for the stability of the
¢ber coating. However, the compounds with high
molecular weight normally need higher desorption
temperatures than this. Consequently, these com-
pounds can remain retained in the ¢ber coating and
appear in subsequent analyses (carry-over effect).
High desorption times can help to reduce this carry-
over effect.
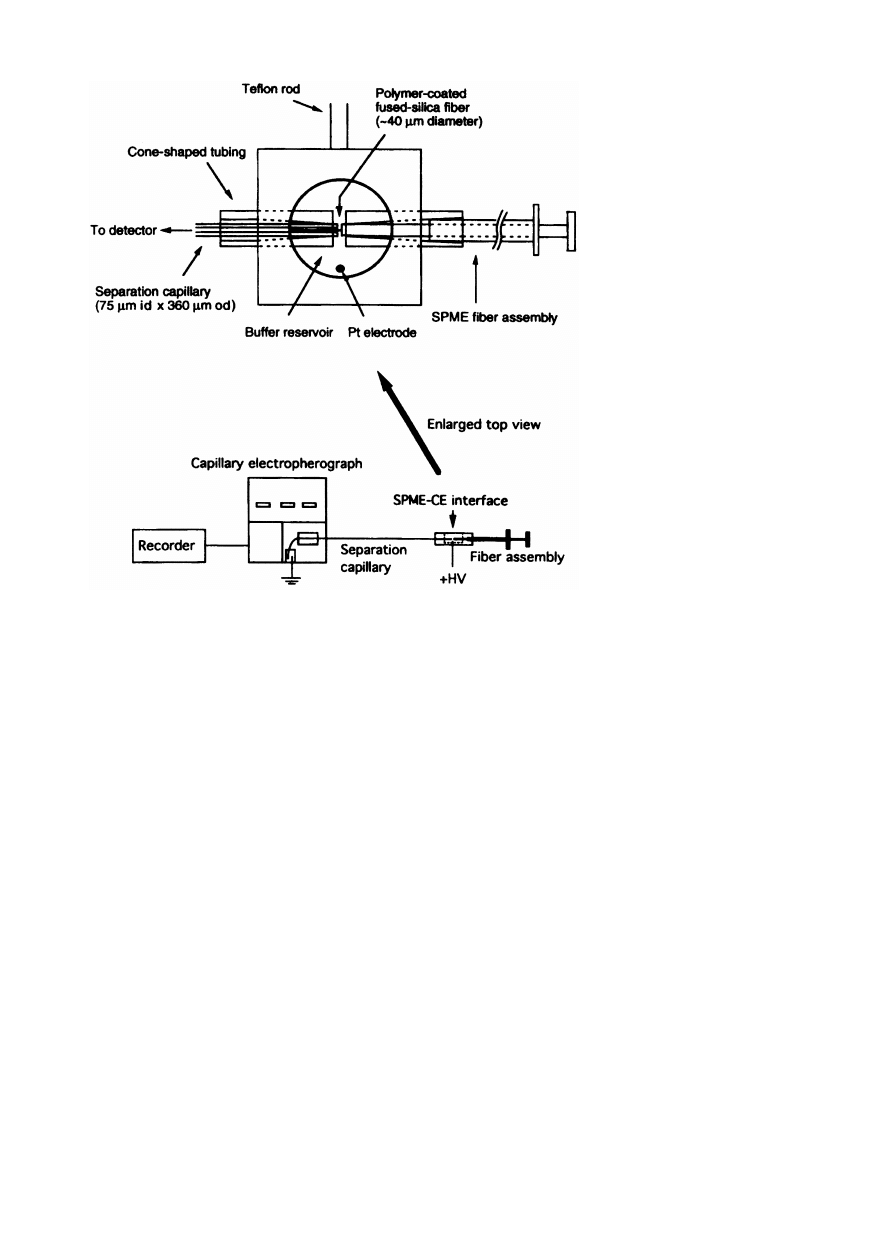
Fig. 2. SPME^CE interface (not to scale). Reprinted, with permission, from [ 12 ].
562
trends in analytical chemistry, vol. 18, no. 8, 1999

TRAC 2565 27-7-99
A wide range of applications has been developed for
the determination of environmental pollutants, e.g.
pesticides [ 19^27 ] and BTEX compounds [ 36,40 ],
by SPME^GC coupling. SPME-GC has been auto-
mated simply by using a modi¢ed commercial auto-
sampler [ 13,14 ]. This automated SPME device con-
trols the temperature and agitation in the extraction
process better and provides more reproducible results
than the manual SPME device. More recent develop-
ments in SPME^GC automated systems incorporate a
new agitation mechanism, ¢ber vibration, with better
results than the more conventional stirring of the sam-
ple [ 14 ]. This mode of agitation involves moving the
¢ber instead of the solution.
2.2.2. SPME^HPLC
SPME^HPLC coupling has been introduced
recently and is more complex than SPME^GC cou-
pling because it needs interfaces to desorb the analy-
tes. The analytes retained in the ¢ber are desorbed by
adding an organic solvent to the ¢ber in the desorption
chamber. These analytes are then introduced into the
HPLC analytical column by the mobile phase. An
example of an SPME^HPLC interface is shown in
Fig. 1. Some authors have evaluated parameters
which affect the desorption process in HPLC, such
as selecting the most appropriate solvent, and heating
the interface [ 8 ]. Organic solvents can damage the
¢ber coating. Therefore, not all the SPME ¢bers can
be used for HPLC applications (Table 1). New SPME
¢bers, such as 60 Wm PDMS-DVB and CW-TPR,
which are bonded phases and resist the addition of
organic solvents, were developed especially for
HPLC use.
A more recent development of SPME^HPLC,
called in-tube SPME, has been introduced [ 9 ] by
Eisert and Pawliszyn. This application permits the
development of an automated SPME^HPLC system.
In this new SPME design, a piece of open tubular
capillary GC column or a piece of a micro-LC capil-
lary column was used as the extracting phase. Only a
few groups of compounds have been determined by
SPME^HPLC. Non-ionic surfactants [ 10 ], phenyl-
urea and carbamate pesticides [ 7,9 ], and PAHs
[ 8,34 ] are some of these. However, to date, the limits
of detection are not very low.
Table 3
Environmental SPME applications
Compounds
Fiber coating
SPME conditions
ref
(absorption; desorption)
Other references
Pesticides
PDMS
30 min
a
; 3 min at 260³C
14
[ 16,18,20^22,25,27 ]
PA
45 min at 60³C; 2 min at 260³C
19
[ 7,13,20,23,25,26 ]
XAD coated
30 min
a
; 20 min at 270³C
20
PDMS-DVB
30 min
a
; 5 min at 280³C
25
Carbowax-DVB
Phenols and derivatives
PA
60 min
a
; 8 min at 250³C
29
[ 12,28,30,31]
Volatile organic compounds (VOCs)
PDMS
20 min at 80³C; 5 min at 200³C
41
[ 40 ]
PA
12 min
a
; 5 min at 260³C
40
Carboxen-PDMS
30 min
a
; 2 min at 300³C
36
BTEX compounds
PDMS
10 min
a
; 2 min at 150³C
39
[ 48 ]
Carboxen-PDMS
30 min
a
; 2 min at 300³C
36
Polycyclic aromatic compounds (PAHs)
PDMS
30 min
a
; 2 min
a;b;34
[ 17,42 ]
PDMS-DVB
^
[ 8 ]
Carbowax-DVB
^
[ 8 ]
Carbowax-TPR
^
[ 8 ]
C
18
30 min at 60³C; 1 min at 300³C
38
Polychlorinated biphenyls (PCBs)
PDMS
5 h
a
; 1 min at 300³C
33
[ 32 ]
Phenyl-bonded phase
30 min at 60³C; 1 min at 300³C
38
Chlorobenzenes
PDMS
25 min at 30³C; 3 min at 250³C
50
PA
30 min at 50³C; 5 min at 280³C
51
Fatty acids
PA
30 min
a
; 5 min at 300³C
44
Formaldehyde
PDMS-DVB
300 s
a
; 2 min at 210³C
47
a
At room temperature.
b
SPME^HPLC analysis.
trends in analytical chemistry, vol. 18, no. 8, 1999
563
TRAC 2565 27-7-99
2.2.3. SPME^CE
More recently, a few papers have been published
which describe methods of determining organic com-
pounds such as barbiturates [ 11] and phenols [ 12 ] by
SPME^CE coupling. This SPME^CE coupling is
more dif¢cult than SPME^HPLC because the inter-
face should allow the introduction of very small injec-
tion volumes. In CE, nanolitre volumes are injected,
while in HPLC microlitre volumes are injected.
Whang and Pawliszyn [ 12 ] have designed an inter-
face for SPME^CE that allows the SPME ¢ber to be
inserted directly into the injection end of a CE capil-
lary. They prepared a `custom-made' polyacrylate
¢ber to achieve the SPME^CE coupling. Fig. 2
shows a scheme of the SPME^CE interface. This inter-
face has been tested for determining phenols in water
samples and the limits of detection are low.
3. Application of SPME to the analysis of
environmental samples
All types of environmental samples, such as air
[ 43,45^50 ], water [ 7,19^27,29^33,40^42 ], and soil
or sludges [ 14,28,32 ] have been analyzed by SPME.
Table 3 summarizes some references and experimen-
tal conditions for SPME environmental analysis as
well as the type of ¢ber used in each application.
SPME has recently been introduced as a very useful
technique for ¢eld analysis [ 15,16 ]. A portable ¢eld
sampler has been designed for this purpose, and con-
tains a septum to prevent the ¢ber from being conta-
minated. Few papers have been published about this
modi¢cation of the SPME device but studies of the
stability of analytes stored in the ¢ber, and the combi-
nation of SPME with a portable GC, indicate that
SPME is a very promising technique for ¢eld analysis
[ 15 ].
3.1. Air samples
The application of SPME to the analysis of air sam-
ples has only appeared recently because there are some
drawbacks [ 43,45^50 ]. For example, it is dif¢cult to
prepare standards for gas sampling in a range of con-
centrations for the calibration process. Also, calibra-
tion and sampling always have to be done at the same
temperature to obtain reproducible results.
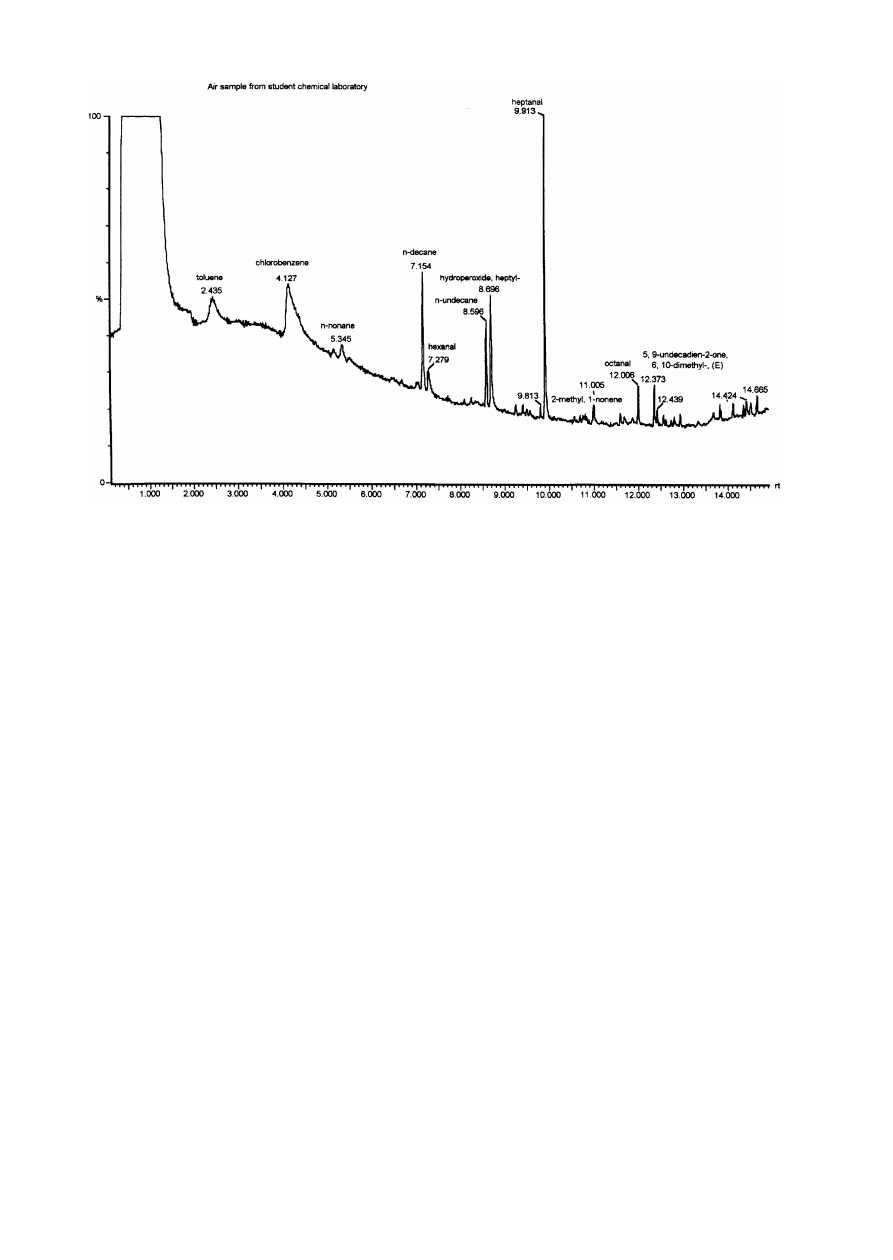
Namiesnik et al. [ 49 ] have developed a method for
determining organic pollutants from gaseous matrices
Fig. 3. Chromatogram obtained by SPME^GC^MS of an air sample from a student's chemical laboratory. Reprinted from [ 49 ],
with permission.
564
trends in analytical chemistry, vol. 18, no. 8, 1999
TRAC 2565 27-7-99
by preparing standard gaseous mixtures with the use of
an apparatus for the dynamic generation of gaseous
mixtures. They have also evaluated the ways in
which how temperature and humidity affect the
response of the compounds. Fig. 3 shows the chroma-
togram obtained when an air sample from a students'
chemical laboratory was analyzed by the SPME^GC^
MS method.
The standard sample preparation is not necessary to
quantify the analytes when partition coef¢cients are
determined. Martos and his coworkers [ 50 ] proposed
a method for estimating these coef¢cients by using a
linear temperature-programmed index. The depend-
ence of the amount extracted on the temperature was
determined by calculating the theoretical expression
Table 4
Analyses of a sample of sandy CRM-529 soil by HS-SPME^GC^MS, Soxhlet extraction, and intercomparison exercise; reprinted
from [ 51]
Compound
Concentration (Wg g
31
of soil)
Headspace SPME^GC^IT-MS
Soxhlet extraction
Intercomparison exercise
Mean
a
S.D.
a
Mean
b
S.D.
b
No. of results Mean
S.D.
1,2,3-Trichlorobenzene
0.591
0.032
0.639
0.052
9
0.623
0.064
1,2,3,4-Tetrachlorobenzene
1.557
0.055
1.703
0.135
10
1.517
0.251
Pentachlorobenzene
1.420
0.069
1.588
0.080
11
1.326
0.272
a
n = 3.
b
n = 5.
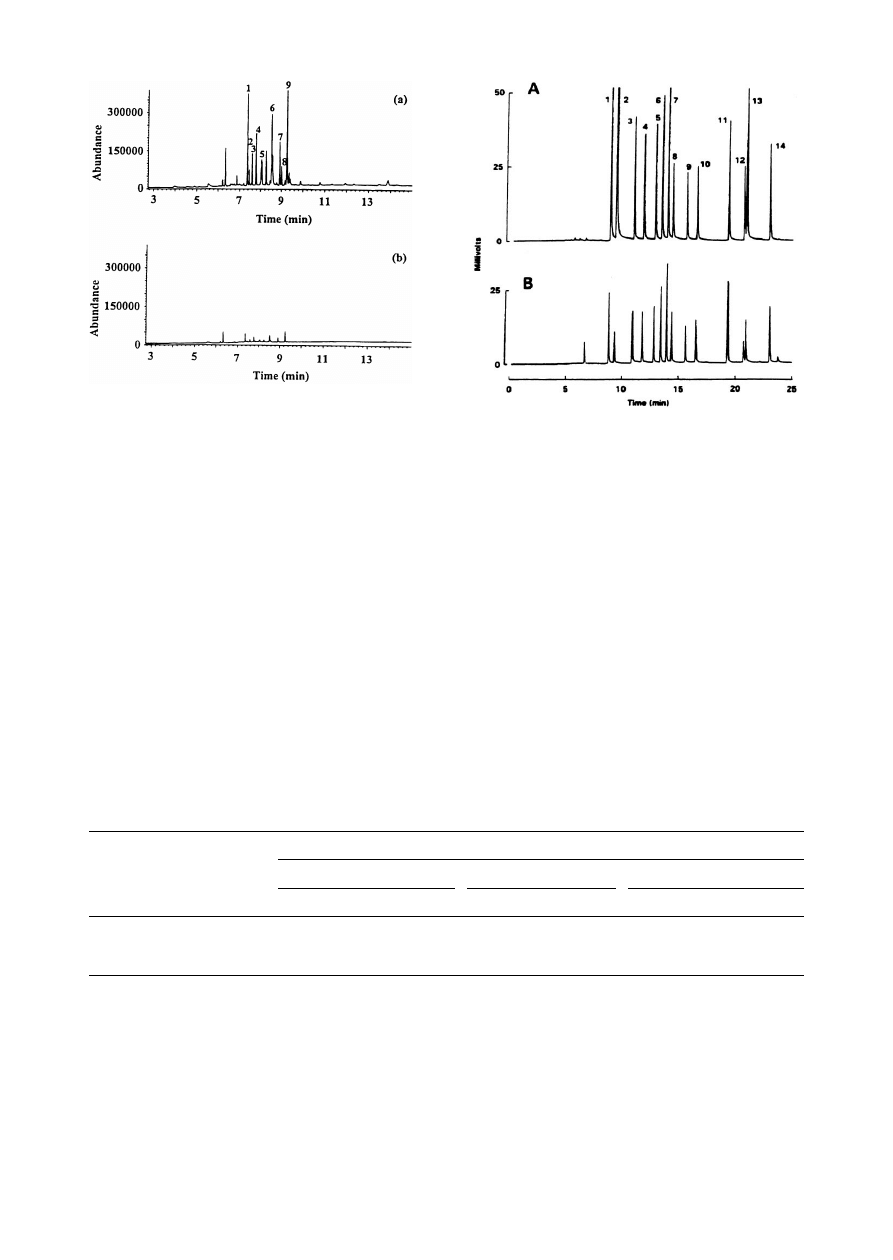
Fig. 5. Chromatograms obtained when a water sample
spiked with organochlorine pesticides in the range 1^10
ng was analyzed by: A: direct injection; B: HS-SPME, of 15
ml of salt-saturated water sample at 87³C. Peak assign-
ment: 1, HCB; 2, lindane; 3, heptachlor; 4, aldrin; 5, hepta-
chlor epoxide; 6, Q-chlordane; 7, trans-nonachlor; 8, p,p-
DDE; 9, o,p-DDT; 10, p,p-DDT; 11, mirex; 12, cis-perme-
thrin; 13, trans-permethrin; 14, DCBP. Reprinted, with per-
mission, from [ 22 ].
Fig. 4. Chromatogram obtained when a 25 Wg l
31
solution
of acidic herbicides and with 2.5 mg l
31
of humic acids is
extracted by (a) gas post-derivatization following SPME,
and ( b) SPME following methylation in water with diazo-
methane-ether solution. Peak assignments: 1, MCPP; 2,
dicamba; 3, MCPA; 4, 2,4-DP; 5, 2,4-D; 6, 2,4,5-TP; 7,
2,4,5-T; 8, dinoseb; 9, 2,4-DB. Reprinted, with permission,
from [ 24 ].
trends in analytical chemistry, vol. 18, no. 8, 1999
565
TRAC 2565 27-7-99
that describes the partition coef¢cient at any temper-
ature for each ¢ber^analyte pair [ 47 ]. This method has
been used to determine formaldehyde [ 48 ], iso-par-
af¢ns [ 50 ], and aromatic compounds such as styrene
[ 50 ]. Formaldehyde was determined by Martos and
Pawliszyn [ 48 ] by on-¢ber derivatization, and the
method detection limits (MDLs) and the precision as
relative standard deviation (RSD) were calculated at
different sampling times. For example, for 300 s sam-
pling, the MDLs were 4.6 ppb and the RSD was 22%.
New SPME ¢bers with high surface areas, such as
carboxen-PDMS, have allowed small volatile analytes
to be extracted from air samples as gases [ 43 ].
3.2. Aqueous samples
Direct immersion is the most frequently used SPME
sampling mode for aqueous samples [ 7,19^21,23^
26,29^33,40^42 ]. For instance, Lee et al. [ 24 ] have
developed a method for determining acidic herbicides
in water by using SPME followed by a gas-phase post-
derivatization of compounds retained in the ¢ber.
Acidic herbicides are very polar compounds that can-
not be determined directly by GC, but have to be deriv-
atized to the corresponding methyl esters to make
them suitable for GC analysis. In this paper [ 24 ],
after the analytes had been retained in the ¢ber coating
they were derivatized with diazomethane gas by `in-
¢ber derivatization'. PDMS and PA ¢bers were eval-
uated, and PA was more ef¢cient than PDMS for
extracting these compounds. They also studied how
varying the pH of the sample and adding salt and
humic acids affect the extraction procedure. Fig. 4
shows the chromatograms obtained when the analytes
were derivatized (a) after, and ( b) before, the SPME
process.
The HS-SPME sampling mode [ 22,29,31,42 ] is
also used for extracting organic compounds from
aqueous samples. For example, Page and Lacroix
[ 22 ] have developed a method for determining orga-
nochlorine pesticides in water samples by using HS-
SPME^GC^ELCD. They also evaluated how the addi-
tion of salt, the absorption temperature and time, and
the headspace and sample volumes, affected the
amount of analyte extracted. With small volumes of
sample (15 ml) the MDLs ranged from 0.3 to 0.8 ng
l
31
and repeatabilities were between 5.9 and 21.7%.
Fig. 5 shows the chromatograms obtained when a
water sample containing organochlorine pesticides
in a range between 1 and 10 ng was analyzed by
(a) direct injection, and ( b) HS-SPME of 15 ml of
sample.
3.3. Solid samples
Only a few papers have been published describing
methods for determining environmental pollutants
such as chlorobenzenes [ 51,52 ] and chlorophenols
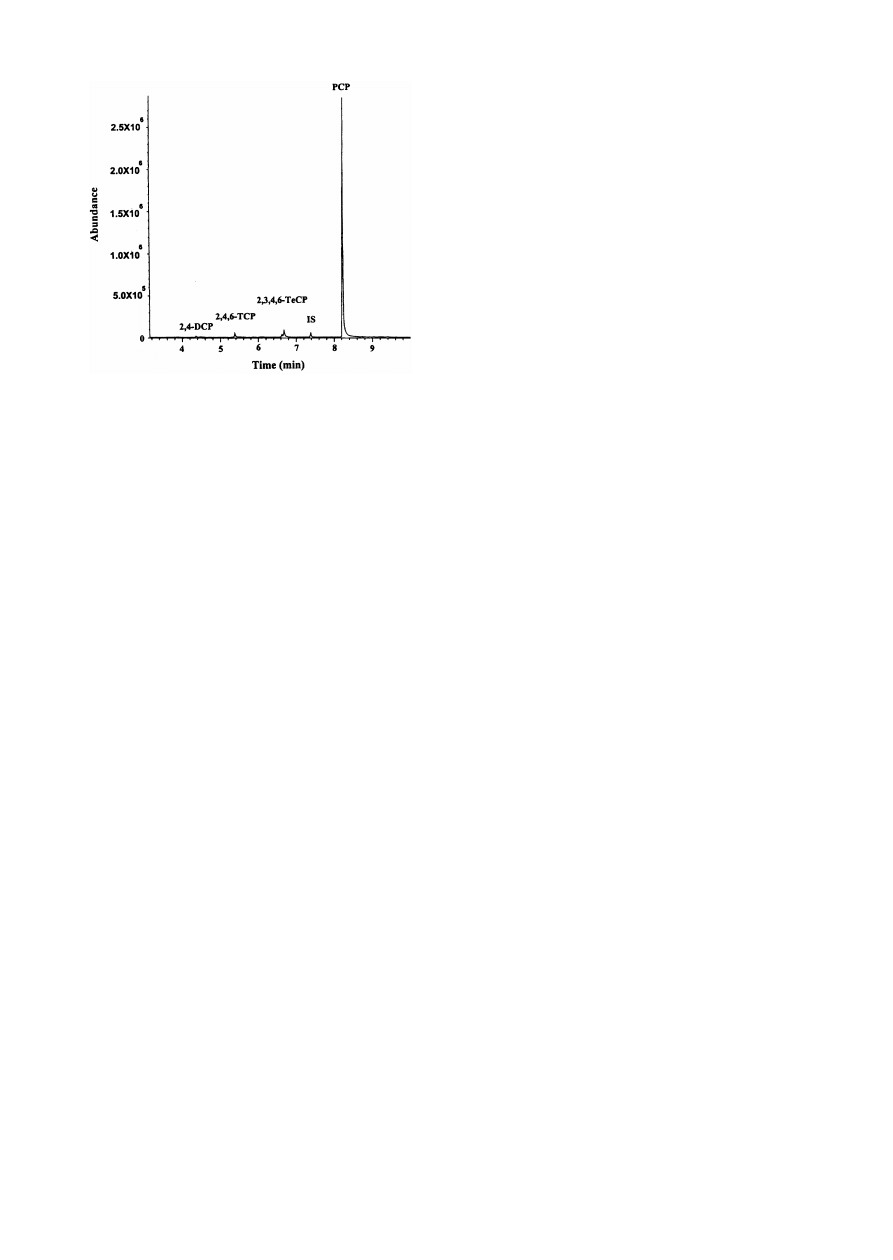
[ 28 ] from soil samples. Lee et al. [ 28 ] used SPME
to determine ¢ve chlorophenols in land¢ll leachates
and real soil samples. Before the real soil samples were
analyzed, they evaluated the absorption and desorp-
tion conditions and the effects of humic acids and
surfactants on the determination of chlorophenols in
water samples. Limits of detection of ng l
31
and rela-
tive standard deviations, in repeatability conditions,
ranged from 5 to 9% (n = 8) in water samples. Fig. 6
shows the chromatogram obtained when a real soil
sample was analyzed by the SPME^GC^MS method.
Santos et al. [ 51] developed a method based on HS-
SPME and GC^MS to determine chlorobenzenes in an
industrially contaminated soil which is a candidate
reference material (CRM). Parameters which affect
the SPME process in soil samples, such as adding
water and organic solvents to the sample, and the tem-
perature of extraction, were optimized. The authors
showed that increasing the extraction temperature
does not improve the response for chlorobenzenes.
This is probably explained by the reduction in the
partition coef¢cients between the ¢ber and headspace
when the temperature increases. They also compared
the effect of adding different volumes of ethanol,
methanol, dichloromethane and acetone. The results
were best when very low amounts of an organic sol-
Fig. 6. Chromatogram obtained by SPME^GC^MS of a
real soil sample. Reprinted, with permission, from [ 28 ].
566
trends in analytical chemistry, vol. 18, no. 8, 1999

TRAC 2565 27-7-99
vent were added. The results obtained with HS-SPME
agreed with those obtained by Soxhlet extraction and
those of a European intercomparison exercise. Chlo-
robenzenes in the CRM-529 soil sample were quan-
ti¢ed by standard addition. The reproducibility was
good, between 3 and 5%, and MDLs ranged from
0.03 to 0.01 ng g
31
of soil. Table 4 shows the results
of the analyses of this soil sample by the three meth-
ods.
4. Conclusions
To date, solid-phase microextraction has been pre-
sented as a very promising extraction technique,
allowing the determination of a great variety of
organic pollutants at trace levels from a wide range
of environmental matrices. Soils, sludge, water, and
air can be analyzed successfully using SPME, both
directly and with headspace extraction. Field analyses
can also be achieved by using this extraction techni-
que, and this modi¢cation of SPME is actually under
development.
SPME can be coupled easily to gas chromatography
(GC) and, with the use of interfaces, to high-resolu-
tion liquid chromatography (HPLC). Furthermore,
more recent developments have allowed the full auto-
mation of the SPME process coupled to either of these
two separation techniques.
The introduction of new SPME ¢bers that extend
the range of application of this technique to other
classes of analytes, such as inorganic compounds, as
well as the development of new SPME automated
devices with more advanced features, can show
SPME as a good alternative to more conventional
extraction techniques.
References
[ 1] J. Pawliszyn, Solid Phase Microextraction: Theory and
Practice, Wiley-VCH Inc., New York, 1997.
[ 2 ] D. Barceloè, J. Chromatogr. 643 (1993) 117.
[ 3 ] N. Masqueè, R.M. Marceè, F. Borrull, Trends Anal. Chem.
17 (6) (1998) 384.
[ 4 ] C. Aguilar, F. Borrull, R.M. Marceè, J. Chromatogr. A 771
(1997) 221.
[ 5 ] B. Zygmunt, J. High Resolut. Chromatogr. 20 (1997)
482.
[ 6 ] M.R. Lee, J.S. Lee, W.S. Hsiang, C.M. Chen, J. Chroma-
togr. A 775 (1997) 267.
[ 7 ] K. Jinno, T. Muramatsu, Y. Saito, Y. Kiso, S. Magdic,
J. Pawliszyn, J. Chromatogr. A 754 (1996) 137.
[ 8 ] H. Daimon, J. Pawliszyn, Anal. Chem. 34 (1997) 365.
[ 9 ] R. Eisert, J. Pawliszyn, Anal. Chem. 69 (1997) 3140.
[ 10 ] A.A. Boyd-Boland, J.B. Pawliszyn, Anal. Chem. 68
(1996) 1521.
[ 11] S. Li, S.G. Weber, Anal. Chem. 69 (1997) 1217.
[ 12 ] C.W. Whang, J. Pawliszyn, Anal. Commun. 35 (1998)
353.
[ 13 ] R. Eisert, K. Levsen, J. Chromatogr. A 737 (1996) 59.
[ 14 ] R. Eisert, J. Pawliszyn, J. Chromatogr. A 776 (1997)
293.
[ 15 ] R.E. Shirey, On-site ¢eld sampling of pesticides using
solid phase microextraction, Presented at the Residual
Pesticide Workshop, St. Petersburg, FL, July 1997.
[ 16 ] Application Note 143, Supelco.
[ 17 ] J. Poërschmann, F.D. Kopinke, J. Pawliszyn, J. Chroma-
togr. A 816 (1998) 159.
[ 18 ] A. Paschke, P. Popp, G. Schuëuërmann, Fresenius J. Anal.
Chem. 360 (1998) 52.
[ 19 ] I. Valor, J.C. Moltoè, D. Apraiz, G. Font, J. Chromatogr. A
767 (1997) 195.
[ 20 ] V. Loèpez-Aèvila, R. Young, W.F. Beckert, J. High Reso-
lut. Chromatogr. 20 (1997) 487.
[ 21] G.P. Jackson, A.R.J. Andrews, Analyst (Cambridge, UK)
123 (1998) 1085.
[ 22 ] B.D. Page, G. Lacroix, J. Chromatogr. A 757 (1997) 173.
[ 23 ] C. Aguilar, S. Penìalver, E. Pocurull, F. Borrull, R.M.
Marceè, J. Chromatogr. A 795 (1997) 105.
[ 24 ] M.R. Lee, R.J. Lee, Y.W. Lin, C.M. Chen, B.H. Huang,
Anal. Chem. 70 (1998) 1963.
[ 25 ] J. Dugay, C. Mieége, M.C. Hennion, J. Chromatogr. A 795
(1998) 27.
[ 26 ] R. Eisert, K. Levsen, Am. Soc. Mass Spectrom. 6 (1995)
1119.
[ 27 ] Z. Zhang, J. Pawliszyn, Anal. Chem. 67 (1995) 34.
[ 28 ] M.R. Lee, Y.C. Yeh, W.S. Hsiang, B.H. Hwang, J. Chro-
matogr. A 806 (1998) 317.
[ 29 ] P. Bartaèk, L. Cap, J. Chromatogr. A 767 (1997) 171.
[ 30 ] M. Moder, S. Schrader, U. Franck, P. Popp, Fresenius J.
Anal. Chem. 357 (1997) 326.
[ 31] K.D. Buchholz, J. Pawliszyn, Anal. Chem. 66 (1994)
160.
[ 32 ] Y. Yang, D.J. Miller, S.B. Hawthorne, J. Chromatogr. A
800 (1998) 257.
[ 33 ] Y. Yang, S.B. Hawthorne, D.J. Miller, Y. Liu, M.L. Lee,
Anal. Chem. 70 (9) (1998) 1866.
[ 34 ] M.R. Negrao, M.F. Alpendurada, J. Chromatogr. A 823
(1998) 221.
[ 35 ] T. Goèrecki, J. Pawliszyn, Anal. Chem. 68 (1996)
3008.
[ 36 ] P. Popp, A. Paschke, Chromatographia 46 (7,8) (1997)
419.
[ 37 ] H. Prosen, Trends Anal. Chem. 18 (1999) 272.
[ 38 ] F. Magnani, R. Cenciarini, Chromatographia 41 (1995)
678.
[ 39 ] Y. Liu, M.L. Lee, K.J. Hageman, Y. Yang, S.B. Haw-
thorne, Anal. Chem. 69 (1997) 5001.
[ 40 ] I. Valor, C. Cortada, J.C. Moltoè, J. High Resolut. Chro-
matogr. 472 (1996) 472.
[ 41] F.J. Santos, M.T. Galceraèn, D. Fraisse, J. Chromatogr. A
742 (1996) 181.
[ 42 ] T. Nilsson, F. Pelusio, L. Montanarella, B. Larsen, S.
Facchetti, J.O. Madsen, J. High Resolut. Chromatogr.
18 (1995) 617.
trends in analytical chemistry, vol. 18, no. 8, 1999
567

TRAC 2565 27-7-99
[ 43 ] M. Chai, J. Pawliszyn, Environ. Sci. Technol. 29 (1995)
693.
[ 44 ] R. Shirey, V. Mani, M. Butler, The Reporter, Supelco
Bull. 14 (5) (1995) 4.
[ 45 ] L. Pan, J. Pawliszyn, Anal. Chem. 69 (1997) 196.
[ 46 ] L. Pan, M.A. Adams, J. Pawliszyn, Anal. Chem. 67
(1995) 4396.
[ 47 ] H.L. Lord and J. Pawliszyn, LC-GC Int., May (1998)
S41.
[ 48 ] P.A. Martos, J. Pawliszyn, Anal. Chem. 70 (1998) 2311.
[ 49 ] J. Namiesnik, D. Gorlo, L. Wolska, B. Zygmunt, Analusis
26 (1998) 170.
[ 50 ] P.A. Martos, A. Saraullo, J. Pawliszyn, Anal. Chem. 69
(1997) 402.
[ 51] F.J. Santos, M.N. Sarrioèn, M.T. Galceran, J. Chromatogr.
A 771 (1997) 181.
[ 52 ] A. Fromberg, T. Nilsson, B. Richter Larsen, L. Montanar-
ella, S. Facchetti, J.O. Madsen, J. Chromatogr. A 746
(1996) 71.
book reviews
Commercial biosensors
Commercial Biosensors, by
Graham Ramsay, volume 148
in Chemical Analysis Series,
xvi+304 pages, Wiley, Chiches-
ter, 1998, ISBN 0-471-58505
PII: S0165-9936(99)00125-9
The ¢eld of biosensors has been a
very active area of research over the
past 30 years or so, and is continu-
ing to be so, given the combined
driving forces of the intellectual
challenge of combining biological
materials with physical trans-
ducers, and the great commercial
potential of such devices if they
are robust enough and capable of
being manufactured.
To date, despite the huge research
effort, the number of commercially
successful devices remains disap-
pointingly small, due to the irritat-
ing failure of biomaterials to
behave themselves when immobi-
lised on devices. This is re£ected
in the book, in which the usual sus-
pects are highlighted (glucose, lac-
tate, urea). While this is predictable
in terms of commercial electro-
chemical sensors, the real value of
this book is to highlight the com-
plexity of the challenge involved
from the manufacturer's point of
view. Hence aspects of device
assessment are discussed which
are rarely addressed in academic
research, such as the in£uence of
the ultimate end-user on the accu-
racy and precision of a measure-
ment, the impact of sampling (e.g.
skin and puncturing) on the sample
composition (e.g. glucose in
blood) and the in£uence of ease of
use and market size on the design
and
fabrication
technology
employed. In addition, valuable
comparisons
of
commercially
available instruments are given,
and in some cases, the design, fab-
rication and mode of use are
described in detail.
An excellent example is the chapter
on the iSTAT instrument by Gra-
ham Davis which should be recom-
mended reading for anyone consid-
ering commercialising a biosensor.
Although most of the measure-
ments involved are not biosensor-
based ( blood gases and electro-
lytes), the sensor array does include
glucose and urea biosensors. What
is most interesting in this chapter is
how the fabrication of each sensor
type in the array was made essen-
tially compatible by adopting a pla-
nar design and employing techni-
ques
developed
by
the
microelectronics industry.
The book is divided into three parts
called `Applications to clinical
samples', `Applications to biopro-
cess samples' and `Applications to
environmental samples'. Of these,
the last (one chapter by Klaus Rei-
del) really should be looked upon
as a review of the commercial
options for measuring BOD using
microbe-based biosensors, rather
than a broad view of the applica-
tions of biosensors in environmen-
tal analysis. The section on Biopro-
cess measurements (one chapter by
John Woodward and Robert Spo-
kane) addresses issues such as
aseptic sampling of bioprocesses
and reviews the types of biosensors
and associated instruments that are
available.
In addition to the iSTAT chapter,
part 1 contains two chapters on
SPR (Ronald Earp and Raymend
Dessy) and evanescent waves
(Duncan Purvis, Denis Pollard-
Knight and Peter Lowe). These
are particularly timely, given the
rapid growth in the use of these
approaches for biosensing. The
chapters cover the main companies
involved
in
commercialising
instruments
(Biacore
series,
IAsys, Arti¢cial Sensor Instru-
ments and Intersens Instruments).
There are many diagrams clearly
illustrating the principles of a num-
ber of approaches (SPR, resonant
mirror, ellipsometry, etc.), how
devices are fabricated and exam-
ples of results obtained. Examples
of recent developments in integra-
568
trends in analytical chemistry, vol. 18, no. 8, 1999
Wyszukiwarka
Podobne podstrony:
Solid phase microextraction for herbicide determination in
Solid phase microextraction for the detection of termite cut
Headspace solid phase microextraction for the determination
Solid phase microextraction for the analysis of biological s
Solid Phase Microextraction Analyses of Flavor Compounds in
Solid phase microextraction as a tool for trace element spec
Solid phase microextration in biomedical analysis
Solid phase microextraction a promising technique for sample
Solid phase microextraction in pesticide residue analysis
Comparison of Different Fibers in the Solid Phase Microextra
Application of Solid Phase Microextraction Gas Chromatograp
Headspace solid phase microextraction profiling of volatile
Solid phase microextraction as a clean up and preconcentrati
A Practical Guide to Quantitation with Solid Phase Microextr
Vinyl chloride analysis with Solid Phase Microextraction
Solid phase microextraction to concentrate volatile products
Kinetics of solid phase extraction and solid phase microextr
Optimisation of solid phase microextraction of volatiles
Applications of solid phase microextraction to
więcej podobnych podstron