Journal of Chromatography A, 873 (2000) 39–51
www.elsevier.com / locate / chroma
Kinetics of solid-phase extraction and solid-phase microextraction
in thin adsorbent layer with saturation sorption isotherm
,1
,2
*
*
Semen N. Semenov
, Jacek A. Koziel, Janusz Pawliszyn
Department of Chemistry
, University of Waterloo, Waterloo, Ontario, N2L 3G1 Canada
Received 28 August 1999; received in revised form 24 December 1999; accepted 27 December 1999
Abstract
The effects of sorbent saturation in thin adsorbent layers have been much overlooked in earlier research and should be
taken into account in both the theory and practice of solid-phase extraction (SPE) and solid-phase microextraction (SPME).
The adsorption kinetics of a single analyte into a thin adsorptive layer was modeled for several cases of agitation conditions
in the analyzed volume. The extraction process in the adsorbent layer was modeled using a Langmuir isotherm approximated
by the linear isotherm at low concentrations and by a saturation plateau at concentrations exceeding the critical saturation
concentration. Laplace transformations were used to estimate the equilibration time and adsorbed analyte concentration
profile for no agitation, practical and perfect agitation in the analyzed volume. The equilibration time may be significantly
reduced at high degrees of oversaturation and / or agitation in the analyzed volume. The resulting models indicated that the
adsorbent layer becomes saturated at some critical value of the oversaturation degree parameter. The critical value of the
oversaturation parameter is affected by both the concentration of the analyte in the analyzed volume and the sorbent
characteristics. It was also shown that the adsorption process is carried out via the propagation of the saturation adsorption
boundary toward the inner boundary of the adsorbent layer. These new adsorption models should serve as ‘‘stepping stones’’
for the development of competitive adsorption kinetic models for both SPE and SPME, particularly in cases where fast
sampling is used.
2000 Elsevier Science B.V. All rights reserved.
Keywords
: Adsorption isotherms; Mathematical modeling; Solid-phase microextraction; Solid-phase extraction; Kinetic
studies; Sorbent saturation
1. Introduction
thin, solid or liquid sorbent layer is widely used in
many scientific and technological applications, in-
Solute partitioning between a liquid or gas and a
cluding analyte extraction / sample preparation in
solid-phase extraction (SPE) and solid-phase mi-
croextraction (SPME). For SPE, a high-affinity
*Corresponding authors.
sorbent retains and concentrates organic compounds
E-mail addresses
:
sem@fly.triniti.troitsk.ru (S.N. Semenov),
from a dilute liquid or gaseous phase. These com-
janusz@uwaterloo.ca (J. Pawliszyn)
pounds are later desorbed and introduced into a
1
On leave from the Institute of Biochemical Physics, Russian
chromatograph or other analytical device. Limita-
Academy of Science, Kosygin Street 4, 117977 Moscow, Russia.
tions to SPE (mainly due to its large adsorbent layer)
Fax: 17-095-137-4101.
2
Tel.: 11-519-888-4641; fax: 11-519-746-0435
have been addressed by SPME [1], which since its
0021-9673 / 00 / $ – see front matter
2000 Elsevier Science B.V. All rights reserved.
P I I : S 0 0 2 1 - 9 6 7 3 ( 9 9 ) 0 1 3 3 8 - 2

40
S
.N. Semenov et al. / J. Chromatogr. A 873 (2000) 39 –51
introduction in the early nineties has found many
sive SPME theory for including competitive dynamic
applications [2]. For SPME, a thin layer of high-
adsorption processes. Such processes are very im-
affinity solid (or liquid for absorptive extraction / pre-
portant in cases where very short sampling times are
concentration) sorbent is coated on the surface of a
used, e.g. less than 10 s, and where the quantification
fused-silica fiber. Analytes partition to the sorbent
is based on molecular gas-phase mass transfer co-
and are later transferred to an analytical instrument,
efficients [8]. Adsorption kinetics including displace-
e.g. gas chromatograph, for sample desorption, sepa-
ment effects are well understood in processes involv-
ration and quantification. This method minimizes the
ing protein sorption [9,10]. However, the time scale
extraction / sample preparation time and allows for
for protein adsorption is often an order of magnitude
the same sorbent coating to be reused after each
greater than those used in fast sampling with SPME
sample extraction / injection / desorption cycle.
[11].
In a typical adsorptive SPME extraction analytes
Sorbent saturation is much different from the
diffuse from the analyzed volume onto the sorbent
‘‘linear’’ extraction regime. First, the time necessary
layer. To enhance analyte uptake, partition constant
for establishing equilibrium between the adsorbed
values for the sorbents used in commercially avail-
and free analytes should depend on the analyte
3
5
able SPME typically range from 10
to 10
[1].
concentration in the analyzed volume, since only a
However, sorbents with high partition constants may
part of the total amount of analyte can be adsorbed in
be quickly saturated even at relatively low analyte
the saturation regime. For the same reason, the final
concentrations, due to the limited number of avail-
concentration distribution and the amount of the
able adsorption sites. Typical specific surface areas
analyte adsorbed should not depend on its con-
2
3
for the solid adsorbents range between 10 and 10
centration in the analyzed volume, and should be
2
21
m g
[3]. The molecule size and the adsorption site
controlled by the adsorbent capacity only. Secondly,
29
area may be as low as approximately 10
m and
analyte ‘‘outflow’’ from the free to the bound
218
2
10
m , respectively. Thus, the maximum con-
(adsorbed) form, where it could not move across the
centration of adsorption sites available in these
adsorbent layer, should lead to slower observable
20
21
21
sorbents cannot exceed 10 –10
g
. Considering
diffusion. Thirdly, mass transfer conditions should
4
an average partition constant of approximately 10 ,
affect the equilibration process, e.g. the degree of
these sorbents may be saturated at analyte con-
agitation in the analyzed gas or liquid may control
16
17
21
centrations of 10 –10
g
, i.e., from 0.1 to 1 ppm.
the boundary layer thickness in a sample volume.
Larger molecules, e.g. greater than five characteristic
Finally, there is a potential for reversible binding and
atomic sizes, have an even smaller number of
the ‘‘displacement’’ of lower-molecular-mass ana-
available adsorption sites, and the critical concen-
lytes by higher-molecular-mass compounds.
tration for sorbent saturation may be lower, ranging
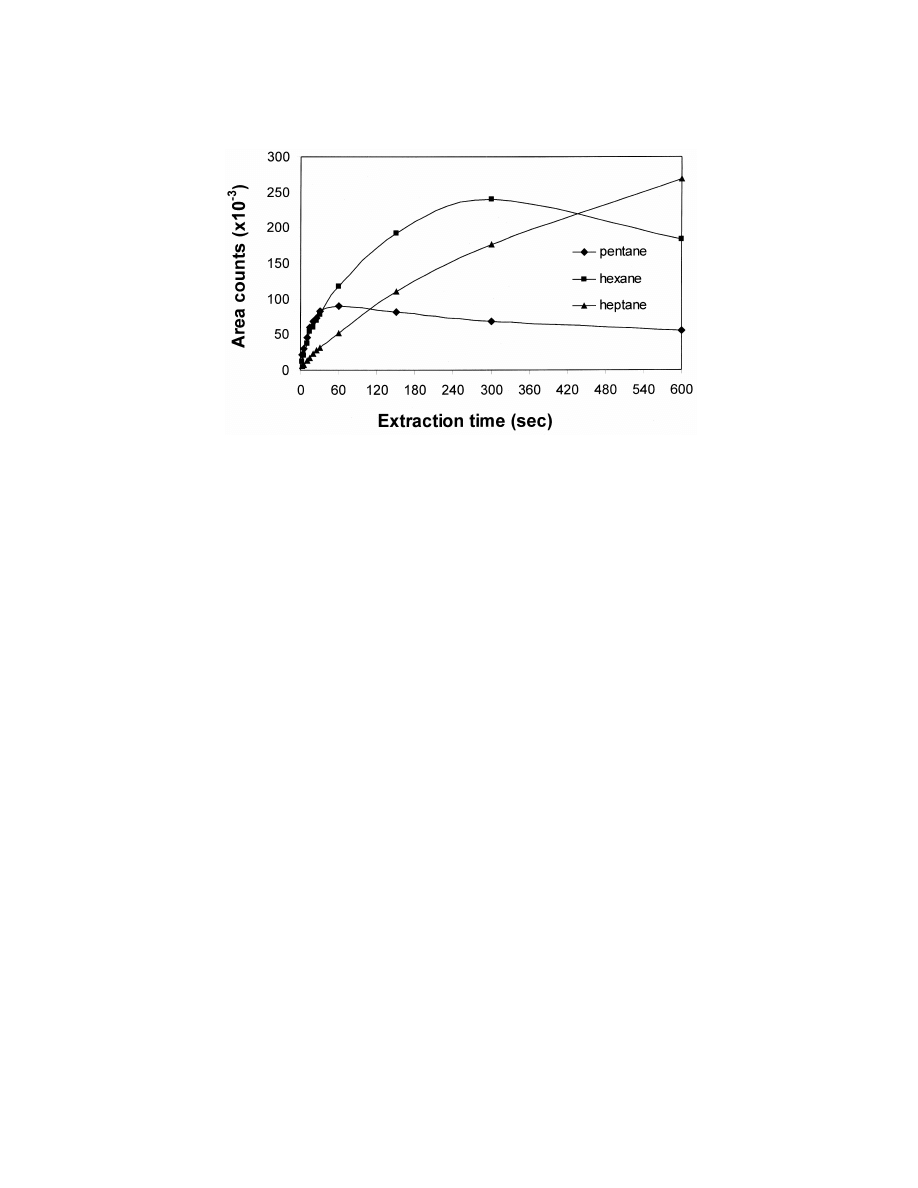
In addition, competitive adsorption has been ob-
from 10 to 100 ppb. As such, sorbent saturation can
served in SPME practice (Fig. 1). The effects of
be reached for typical SPME applications, and its
saturation and competitive adsorption in thin ad-
kinetics has not been fully addressed in the existing
sorbent layers were not fully taken into account in
literature.
previous theoretical developments of SPE / SPME
A comprehensive theory of extraction by absorp-
[1,2]. A full understanding of this process is crucial
tion-type SPME coatings was presented by Paw-
for expanding SPE / SPME applications to very com-
liszyn [1]. Recently, Ai developed a theoretical
plex analyte sample matrices. Thus, there is a
description of non-equilibrium absorption into SPME
growing need for models describing saturation ef-
coatings [2,4–6]. These models can be used to
fects and competitive adsorption in thin adsorbent
estimate mass of analytes absorbed with SPME,
layers for commercially available SPME fibers.
when achieving equilibrium extraction for quantifica-
In this research, the kinetics of single analyte
tion purposes requires an inconveniently long time.
adsorption into a thin layer during SPE and SPME
Gorecki et al. developed a steady-state theory for
was modeled. Several limiting cases of extraction /
analyte extraction via adsorption by selected porous
mass transfer were considered. Laplace transforma-
polymer fibers [7]. To date, there is no comprehen-
tions were used to estimate the analyte concentration
S
.N. Semenov et al. / J. Chromatogr. A 873 (2000) 39 –51
41
Fig. 1. Competitive adsorption for gas phase n-alkanes on a polydimethylsiloxane–divinylbenzene fiber.
time profiles for no agitation, typical and perfect
volume, D is the diffusion coefficient of the analyte
e
agitation conditions in a sample volume. The ex-
in the analyzed volume, t is the time, and x is the
traction kinetics were modeled in an adsorbent layer
transverse coordinate in the adsorption layer. The
with the saturation sorption isotherm approximated
initial condition to Eq. (1) has the form
by the linear isotherm at low concentrations and by a
c (t 5 0) 5 c
at x # 0
(2)
e
0
saturation plateau at concentrations exceeding the
critical
saturation
concentration.
The
resulting
models are based on several physicochemical and
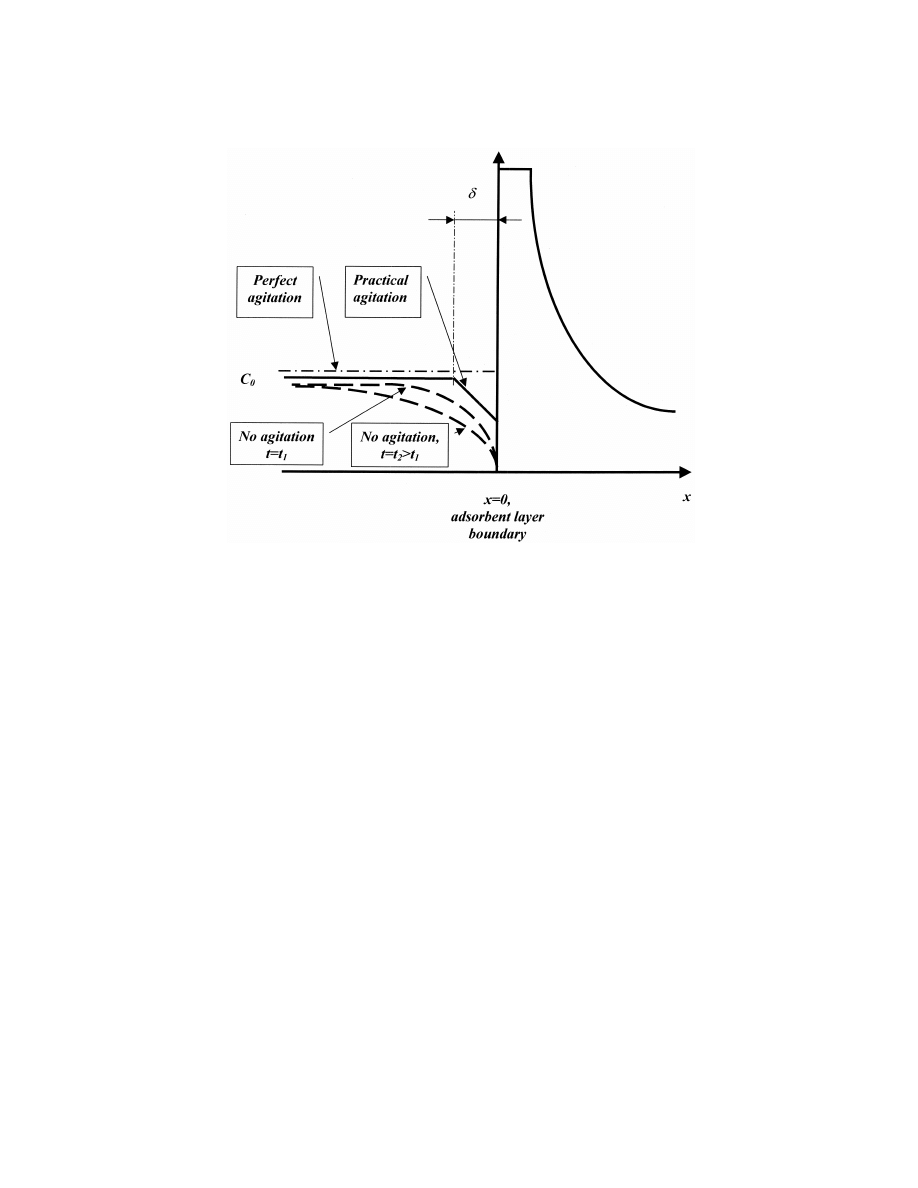
The boundary condition to Eq. (1) depends on the
extraction parameters, and should serve as a basis for
agitation regime. Several analyte concentration dis-
the development of new models for competitive
tributions in the analyzed volume near the adsorbent
adsorption in thin, solid or semi-solid-phases.
layer for several limiting cases of agitation are
presented in Fig. 2. Eq. (1) describes the analyte
concentration with no agitation conditions, where no
means are employed to agitate gas or liquid in the
2. Theoretical development
analyzed volume (the no agitation regime in Fig. 2).
The opposite case is represented by conditions of
2.1. Formulation of the mathematical problem
perfect agitation, where the concentration distribu-
tion is always uniform and does not depend on the
The concentration distribution of an analyte in a
analyte outflow onto the adsorbent layer (the perfect
given volume (outside of sorbent layer) is commonly
agitation regime in Fig. 2). In typical SPME applica-
described using a diffusion equation based on Fick’s
tions, some means for agitation are used, and uni-
second law. This relationship can be reduced to one
form analyte concentration exists in the analyzed
dimension assuming that for a thin adsorbent layer,
volume outside a thin boundary layer with constant
e.g. SPME, adsorptive coating curvature can be
thickness d determined by the agitation conditions
neglected:
(the practical agitation regime in Fig. 2). The analyte
2
concentration inside the boundary layer changes
≠c
≠ c
e
e
]
]]
5 D ?
(1)
linearly with the distance, i.e. decreasing toward the
e
2
≠t
≠x
boundary with the adsorbent layer [1].
where c is the analyte concentration in the analyzed
Inside the sorbent layer, i.e. between the outside
e
42
S
.N. Semenov et al. / J. Chromatogr. A 873 (2000) 39 –51
Fig. 2. Concentration distribution of the analyte in the vicinity of the adsorbent layer boundary.
and inside boundary of a sorbent, the analyte con-
layer. However, the initial saturated layer is extreme-
centration distribution is described by the following
ly thin compared to the adsorption layer width, and it
equation [3]
is established almost instantaneously (see Appendix
A).
2
≠c
≠ c
≠q
i
i
The diffusion and sorption of an analyte in Eq. (3)
]
]
]]
1
5 D ?
(3)
i
2
≠t
≠t
≠x
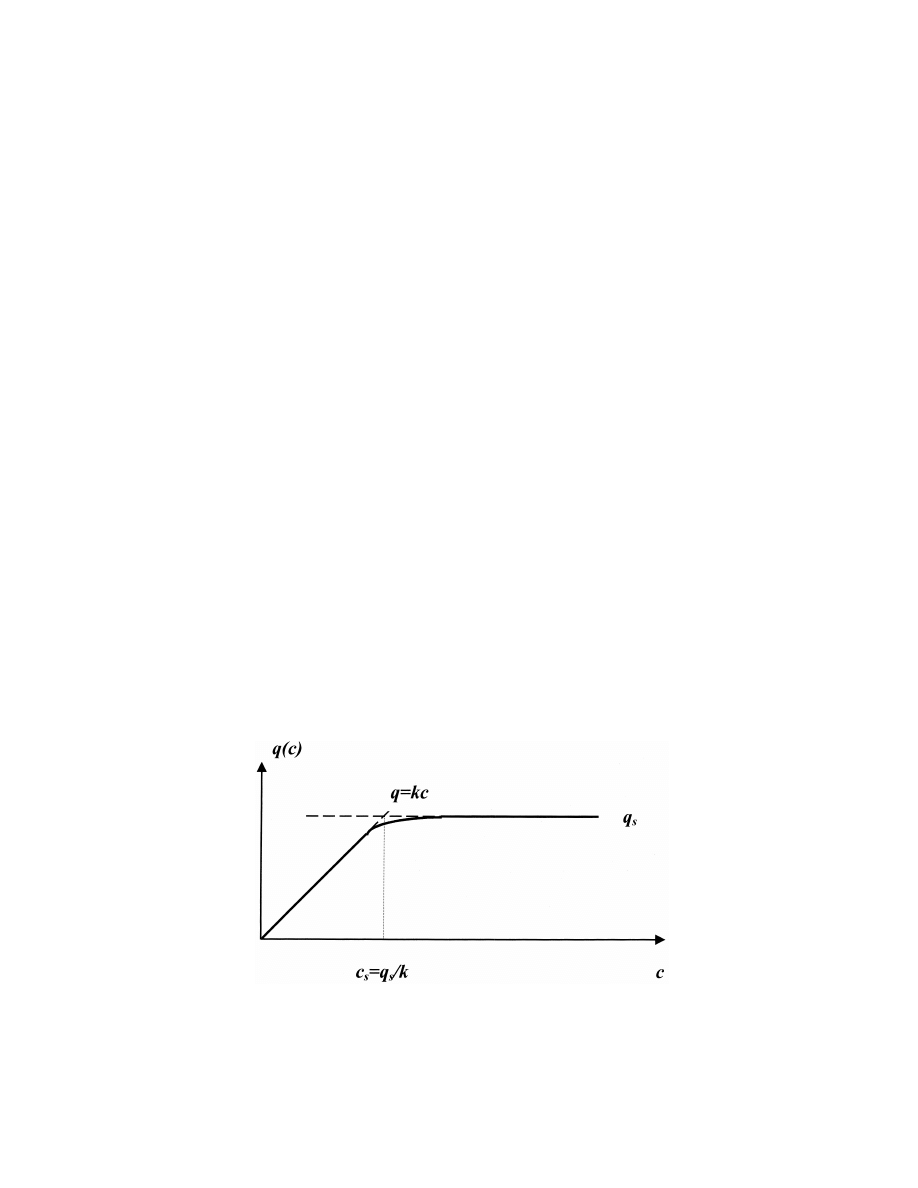
can be solved if q c , also identified as the adsorption
s d
isotherm, is known. The simplest form of this
where c is the concentration of the free analyte in
i
adsorption isotherm can be described by the Lang-
the adsorption layer, q is the concentration of the
muir isotherm [3]
bound (adsorbed) solute, and D is the diffusion
i
coefficient of the free analyte in the adsorption layer.
q kc
s
The initial boundary conditions may be described by
]]
q(c) 5
(6)
q 1 kc
s
initial extraction into pure adsorbent layer and the
condition of the wall impermeability at the inner
where q
is the maximum concentration of the
s
boundary of the adsorbent layer
adsorbed solute at saturation and k is the sorbent
partition constant. The adsorption isotherm was
c (t 5 0) 5 0
at x . 0
(4)
e
assumed to be the sum of two parts
and
q
s
≠c
]
i
q(c) 5 kc
at c #
(7)
] 5 0
at x 5 h
(5)
k
≠x
and
where h is the adsorbent layer thickness. It was
assumed that a very thin saturation layer is already
q
s
]
present at the external boundary of the adsorbent
q c 5 q
at c .
(8)
s d
s
k
S
.N. Semenov et al. / J. Chromatogr. A 873 (2000) 39 –51
43
This approach allows for the consideration of two
approach should be coupled with the examination of
separate regions in the adsorbent layer, i.e. saturation
the displacement process kinetics.
region, and non-saturation region, respectively (Fig.
For analyte concentrations low enough to consider
3). A transition between these two regions occurs,
the linear adsorption isotherm, Eq. (3) reduces to
when the free analyte concentration in the adsorbent
2
≠c
D
≠ c
i
i
i
layer reaches its critical value c 5 q /k. Further-
s
s
]
]] ]]
5
?
(11)
2
≠t
1 1 k
≠x
more, this approach simplifies the adsorption model
to the class of problems with moving boundaries
where the parameter D /(1 1 k) represents the effec-
i
[12]. The time dependence of the moving boundary
tive analyte diffusion coefficient which accounts for
coordinate x (t) between the aforementioned regions
0
the analyte adsorption / desorption in the sorbent
can be described by the equation
layer. This effective diffusion coefficient should be
q
relatively small for a strong adsorbent, i.e. for k 4
s
]
c x , t 5
(9)
s
d
i
0
1. Lower effective diffusion is common in chroma-
k
tography [12], where peak broadening may occur
The adsorption layer becomes completely saturated
due to diffusion combined with the adsorption / de-
for
sorption in a column coating.
x (t ) 5 h
(10)
The diffusion equation for the free analyte in the
0
eq
saturation region has the form
i.e., the saturation boundary approaches the inner
2
boundary of the adsorption layer. The adsorption
≠c
≠ c
i
i
]
]]
5 D ?
(12)
i
2
layer saturation time (t ), also known as the
≠t
eq
≠x
equilibration time, can be estimated by solving Eq.
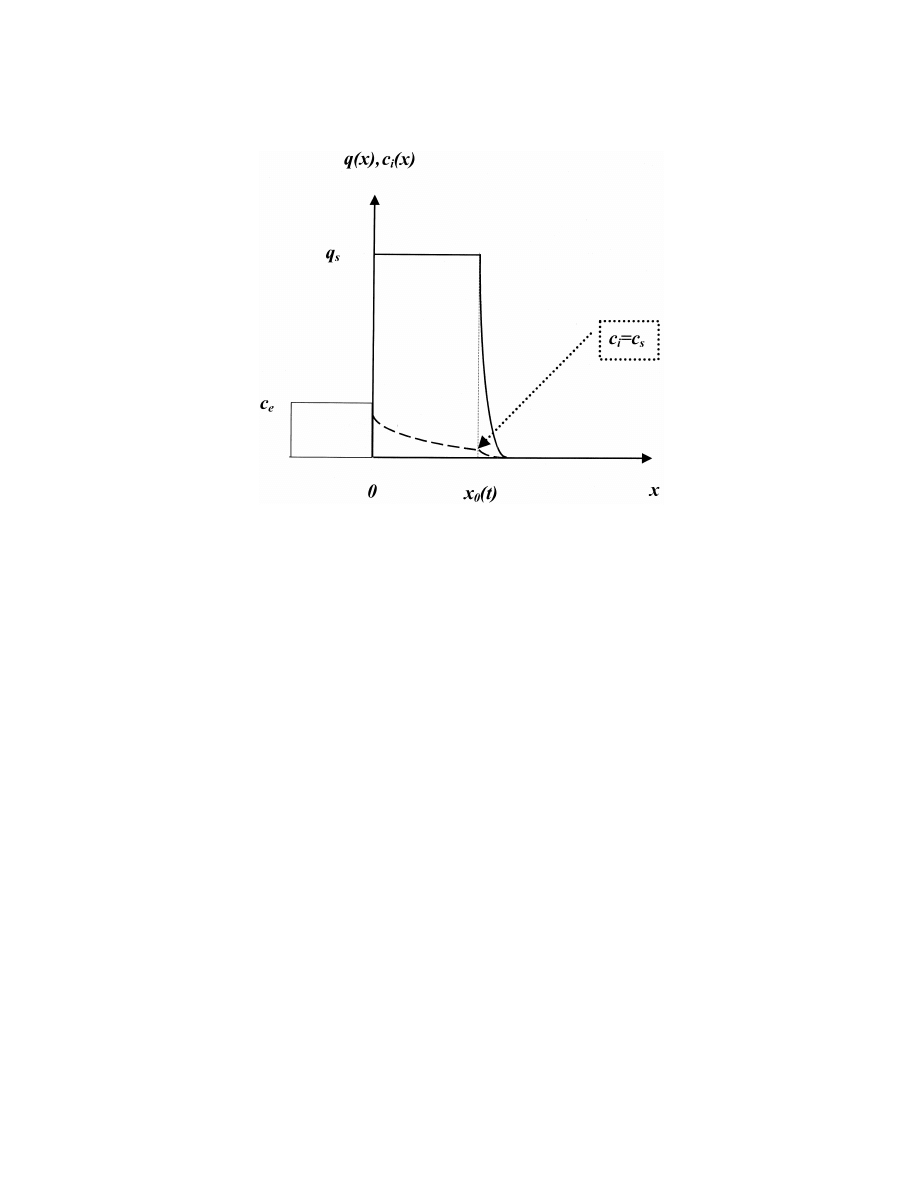
The typical distribution of both free and bound
(10). Similarly, the approximation of the adsorption
analyte in the adsorbent layer is presented in Fig. 4.
isotherm by Eqs. (7) and (8) reduces the mathemati-
The boundary conditions at the sorbent layer / ana-
cal problem to solving Eq. (3) in the saturated
lyzed volume boundary should describe the continui-
region.
ty of the analyte concentration and the analyte flow-
In addition, this approach allows one to model
rate in the direction perpendicular to the boundary.
cases where a single analyte or several analytes are
Thus, the first boundary condition can be written
extracted and adsorbed to different adsorption sites.
simply as
In the case where several analytes are extracted and
compete for the same adsorption sites, a similar
c x 5 0 5 c x 5 0
(13)
s
d
s
d
e
i
Fig. 3. Langmuir isotherm (solid line) and its approximation in this article (dashed line).
44
S
.N. Semenov et al. / J. Chromatogr. A 873 (2000) 39 –51
Fig. 4. Distribution of the free (dashed line, c ) and bound (solid line, q) analyte concentration in the adsorbent layer.
i
where c signifies the analyte concentration in the
analyte flux is controlled by diffusion only, as
i
sorbent pores. The bonded analyte concentration ( q )
described by Eqs. (13) and (14). For the practical
s
remains constant inside the sorbent layer from x 50
agitation regime (Fig. 3), analyte diffusion is present
to x 5 x (t). However, there is analyte flux to the
in the depletion layer (d ) only, and the boundary
0
bound (adsorbed) state (2q ≠x / ≠t), related to the
diffusion flow could be written as
s
0
motion of the saturation adsorption boundary. Thus,
≠c
A
i
e
]
]
D ?
5 2 D ?
at x 5 0
(16)
in the saturation region, the second boundary con-
i
i
≠x
d
dition may be written in the form
where A
is the concentration reduction in the
e
≠c
≠x
≠c
i
0
e
depletion layer. Thus, the second boundary condition
]
]
]
D ?
1 q ?
5 D ?
at x 5 0
(14)
i
s
e
≠x
≠t
≠x
in the practical agitation regime may be written as
A
≠x
≠c
Eqs. (1)–(14) completely define the adsorption
e
0
e
]
]
]
2 D ?
1 q ?
5 D ?
at x 5 0
(17)
i
s
e
kinetics into thin layers, assuming that equilibrium
d
≠t
≠x
exists between the free and bound analytes in the
Finally, the effects of the analyte concentration
adsorption layer as described by the Langmuir
distribution in the inner, non-saturated adsorption
isotherm (Eqs. (6)–(8)). For the case of the perfect
layer region were neglected. It can be shown that the
agitation regime (Fig. 3), where the diffusion in the
estimated concentration distribution will affect the
analyzed volume is faster than diffusion in the
equilibration time value only if the saturation bound-
adsorbent layer, i.e. D 4 D , Eq. (14) reflects ideal,
i
e
ary motion is very slow. A Laplace transformation
uniform analyte concentration in the analyzed vol-
was used to solve the aforementioned systems of
ume
equations for each agitation regime case
≠c
`
e
] ¯ 0 at x 5 0
(15)
2st
≠x
c s, x 5
E
c x, t e
dt
(18)
s
d
s
d
For the case of the no agitation regime (Fig. 3),
0

S
.N. Semenov et al. / J. Chromatogr. A 873 (2000) 39 –51
45
where s is the transformation parameter.
kc
0
]
y 5
(25)
0
q
s
2.2. No agitation conditions
where the parameter y may be defined as the degree
0
of oversaturation in the analyzed volume. Eq. (24)
For the no agitation regime, the analyte con-
may be further reduced for typical y, y and k values
centration distribution (Eq. (1)) with the initial
0
3
4
of approximately 10, 10, and 10 –10 , respectively,
condition (Eq. (2)) was used. Eqs. (12) and (11)
were used for the analyte concentration distribution
]
D
y
i
0
in the saturated and unsaturated adsorption layer,
]
]
k
ln y 5
(26)
D
s
œ
respectively, with Eq. (4) serving as the boundary
e
condition. Similarly, Eqs. (13) and (14) describe the
Eq. (26) can be solved for ln y and substituted into
boundary between the analyzed volume and the
Eq. (22)
adsorbent layer, i.e. at x 50. Then, in the Laplace
]
domain, the analyte concentration in the analyzed
D
y
e
0
] ]
x s 5
?
(27)
s d
volume and in the saturation region, respectively,
0
œ
s
sk
have the following form
In the non-saturated adsorbent region, the analyte
]]
c
0
(s / D )x
œ
e
]
concentration may be written using Eq. (12)
c x, s 5 A e
1
(19)
s
d
e
e
s
]]
q
]]
s
2 (sk / D )(x 2x )
œ
i
0
2 (s / D )x
]
q(x . x ) 5
? e
(28)
œ
i
0
c x, s 5 A e
(20)
s
d
s
i
i
q
The amount of analyte adsorbed by the sorbent per
s
]
q x, s 5
(21)
s
d
unit of the boundary surface area (Q ) can be
s
expressed as
The coefficients A and A can be found using the
e
i
`
boundary conditions, i.e. Eqs. (13) and (14). First,
the saturation boundary motion, i.e. Eq. (9) can be
Q(s) 5 q x s 1
E
q x . x
dx
(29)
s d
s
d
s
0
0
described by the following equation in the Laplace
x
0
domain
Eq. (29) may be solved using Eqs. (27) and (28)
]
D
i
]
]
x s 5
ln y,
(22)
s d
0
y
D
]
œ
0
e
s
23 / 2
] ]
Q s 5 D q ?
1 1 ? s
(30)
s d
S
D
œ
i
s
k
D
œ
i
where
Finally, in the time domain Q(s) can be expressed as
kA
i
]
y 5
(23)
]
]
q
s
y
D
D t
0
e
i
]
]
]
Q t 5 2q ?
?
1 1 ?
(31)
s d
S
D
s
œ
k
D
p
Variable y is the degree of ‘‘oversaturation’’ for the
œ
i
analyte in the adsorbent layer and could be estimated
Eq. (31) represents the contribution of the adsorbed
as the ratio of the free analyte concentration at the
analyte in both the saturated and non-saturated
analyzed volume / adsorbent layer boundary to the
adsorbent region, when the saturation boundary is far
critical concentration corresponding to the adsorbent
from the internal boundary of the adsorbent layer,
saturation. Next, Eqs. (19)–(21) were substituted
i.e. shortly after the initiation of the adsorption
into Eqs. (13) and (14), resulting in the following
process. Eq. (31) may be further simplified for high
equation
analyte concentrations and cases where the diffusion
]
]
in the analyzed volume is much greater than diffu-
D
D
y
i
i
0
]
]
]
1 1
y 1 k
ln y 5
,
(24)
S
D
sion in the adsorbent layer. In this case, i.e. ( y /
0
D
D
s
œ
œ
1 / 2
e
e
k)(D /D )
4
1, the contribution of the unsatu-
e
i
where
rated region to extraction may be neglected. Finally,

46
S
.N. Semenov et al. / J. Chromatogr. A 873 (2000) 39 –51
the equilibration time can be estimated by solving
D
y
e
0
] ]
Eqs. (10) and (27)
x s 5
?
t
(37)
s d
0
d
k
2
q
p
s
As expected, the saturation boundary propagates
]]
]
t
5
?
h
(32)
S D
eq
4D
c
e
0
much faster for the practical agitation regime with a
typically thin depletion layer (d ), in comparison to
The amount of the adsorbed analyte per unit bound-
the no agitation regime. The amount of analyte
ary area is constant and equal to Q
5 q h, for
eq
s
adsorbed by the sorbent per unit of the boundary
t . t .
eq
surface area can be expressed as
D
y
e
0
2.3. Practical agitation conditions
] ]
Q(s) 5 q ?
?
t
(38)
s
d
k
Like to the no agitation condition, Eqs. (1), (2),
Similarly, the equilibration time could be estimated
(11), (12) and (4) were used for the analyte con-
using the following equation
centration distribution in the analyzed volume, satu-
dh
k
rated and unsaturated adsorption layer, and initial
] ]
t
5
?
(39)
eq
D
y
e
0
concentration condition, respectively. In the practical
agitation regime, the boundary conditions at x 50,
and the amount of the adsorbed analyte per unit
were described by Eqs. (13) and (17). The resulting
boundary area should be constant and equal to Q
5
eq
analyte concentration in the analyzed volume had the
q h, for t . t .
s
eq
following form in the Laplace domain
c
2.4. Perfect agitation conditions
0
]
c x 5 0, s 5 2 A 1
(33)
s
d
e
e
s
The hypothetical case of perfect agitation con-
As in the case of no agitation conditions, in the
ditions should result in rapid mass transfer and / or
saturation region, the analyte concentration is de-
the strong oversaturation, i.e.
scribed by Eqs. (20) and (21). The saturation bound-
]
ary motion was described using Eq. (22), and
d D s
œ
i
]]
y 4 k ?
(40)
substituted into the boundary conditions, Eqs. (13)
D
e
and (17), respectively. The resulting expression
In the case of high oversaturation, the analyte
involving the degree of oversaturation in the ad-
concentration in the analyzed volume (c ) should be
0
sorbent layer had the following form
a few orders of magnitude lower than the maximum
]
]
concentration of the adsorbed analyte q . However, a
d D s
d D s
y
s
œ
œ
i
i
0
]]
]]
]
1 1
? y 1 k
ln y 5
(34)
S
D
much higher extraction enrichment could be reached
D
D
s
e
e
in the case of rapid mass transfer and decreased
and could be further reduced for typical sorbent
depletion layer thickness even at lower oversatura-
1 / 2
characteristics
tion degrees. In such a case, d(D s /D )
<
1 and
i
e
]
Eq. (34) may be reduced to the form
d D s
y
œ
i
0
]]
]
k ?
ln y 5
(35)
y
D
s
0
e
]
y 5
(41)
s
Eq. (35) could be solved for ln y and substituted into
for A 5 c . Subsequently, Eq. (10) for the saturation
i
0
Eq. (22)
boundary may be written in the form
D
y
]]
c
q
e
0
0
s
2 (sk / D )x
œ
i
] ]
x s 5
?
(36)
s d
]
]
? e
5
(42)
0
2
d
ks
s
ks
corresponding to the following linear time depen-
Eq. (42) corresponds to perfect agitation conditions,
dence of the saturation boundary motion
where the analyte concentration at the analyzed

S
.N. Semenov et al. / J. Chromatogr. A 873 (2000) 39 –51
47
volume / adsorbent layer boundary is the same as the
y /k ratio should be approximately equal to unity
0
1 / 2
analyte concentration in the analyzed volume far
and (D /D )
<
1.
i
e
from this boundary. Furthermore, the diffusion flow
from the analyzed volume to the adsorbent layer is
very small.
3. Discussion
The saturation boundary motion can be estimated
using a Laplace transformation [6]
The magnitude of the critical analyte concentration
in the analyzed volume necessary for the saturation
x
1
0
adsorption layer was predicted in all examined
]]
]
1 2 erf
5
(43)
]
S D
y
D t
0
œ
i
agitation conditions. These concentrations were com-
parable to the typical SPME conditions, where
Eq. (43) can only be satisfied at very large values of
3
4
partition constants range from 10 –10 . Furthermore,
the error function argument, for which the following
critical analyte concentrations y and y of approxi-
0
approximation may be used [13,14]
mately unity indicate the presence of a transition
2
2z
between saturated and unsaturated extraction. The
]
Œ
p e
] ]]
dependence of the equilibration time on the satura-
1 2 erf z
¯
?
(44)
s d
2
z
tion concentration was also predicted. Such a depen-
Thus, the saturation boundary motion can be esti-
dence is observed in experiments and is well-docu-
mated by substituting Eq. (44) into Eq. (43) and
mented in literature [1,2]. As expected, there should
transforming the latter equation to logarithmic form
be no such dependence in unsaturated conditions.
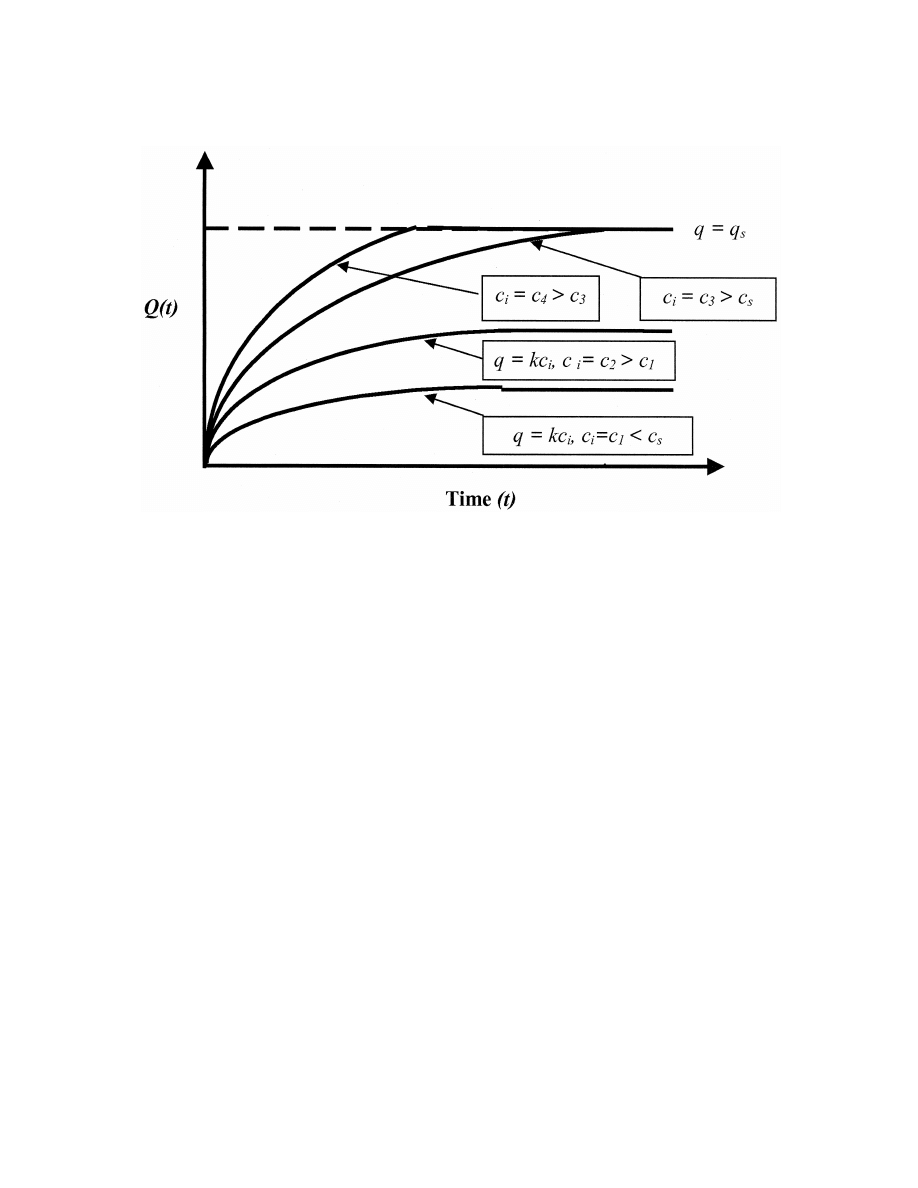
The extraction kinetic profiles for several extraction
]]]]]
]
Œ
p
regimes are illustrated in Fig. 5.
]
S
D
x t 5 ln
? y
? D t
(45)
s d
0
0
i
œ
2
Mass transfer between the analyzed volume and
the adsorbent layer is controlled by both the
Similarly, the equilibration time can be estimated as
equilibration time and the degree of agitation. For
2
the no agitation regime, mass transfer is controlled
h
]]]]]
t
5
(46)
]
eq
Œ
by the analyte diffusion near the boundary, and the
p
1 / 2
]
S
D
ln
? y
? D
0
i
analyte inflow is decreasing with time, i.e. by t
,
2
due to the spatial extension of the diffusion depletion
Eq. (46) can also be used to evaluate the thickness of
layer d. For practical agitation conditions, mass
the depletion boundary layer d at perfect agitation
transfer between the analyzed volume and the ad-
conditions. The characteristic values of the parameter
sorbing layer is both steady-state and linear, and is
21
s were assumed to be approximately t
, thus
eq
controlled by the degree of agitation only. Thus, the
equilibration time may be significantly reduced for
D h
c
e
0
]]]]] ]
d <
?
(47)
]]]]
the same analyte concentration by increasing the
]
Œ
k
p
agitation rate, as is often applied in SPME practice
]
S
D
D
ln
? y
i
0
œ
2
[1,2]. This statement can be further illustrated by
Since the diffusion coefficient in the adsorbent layer
comparing the equilibration times for no agitation
may be approximately five to ten times smaller than
and practical agitation conditions, i.e. Eqs. (32) and
in the liquid analyzed volume, this condition can be
(39). For the transition from no agitation to practical
satisfied in samples with much greater analyte con-
agitation, the reduction in equilibration time is
centrations. Thus, for SPME with a y /k ratio of
approximately (dc /hq ). Since the ratio c /q
is
0
0
s
0
s
approximately 0.1, the maximum value of d should
very small for typical extraction conditions, even
not be greater than d
¯ 0.01 h.
slight agitation should significantly reduce the
The condition equivalent to perfect agitation may
equilibration time for d $ h. Thus, in the saturation
also be reached for adsorption from a gas to solid
regime, the degree of agitation becomes a very
adsorbent impregnated with a liquid, or adsorption to
important parameter controlling extraction kinetics.
gel-like polymer sorbent. For such conditions the
Similarly, the effects of unsaturated and the satu-
48
S
.N. Semenov et al. / J. Chromatogr. A 873 (2000) 39 –51
Fig. 5. Extraction kinetics for no saturation (c 5 c , c , c ) and saturation conditions (c 5 c , c . c ).
I
1
2
s
I
3
4
s
rated regime on equilibration times could be ex-
very low and approximately y times lower than the
0
amined. For the no saturation regime, the characteris-
analyte concentration at the boundary between the
tic time necessary to reach the diffusion / adsorption
analyzed volume and the adsorbent layer. A much
equilibrium in the adsorbent layer can be estimated
shorter time is required to reach such a low analyte
using Eq. (11). This equilibration time is approxi-
concentration at the saturation boundary in com-
2
mately equal to (k 1 1)h /D , and does not depend
parison to the time necessary to achieve an analyte
i
on the boundary conditions. The ratio of the
concentration comparable to its boundary concen-
equilibration times for the saturated and unsaturated
tration. Furthermore, reaching a low analyte con-
regimes is approximately equal to d /(hy ), if D /
centration corresponds to the equilibrium in the no
0
i
D
¯ 1. Thus, the equilibration process is shorter for
saturation adsorption regime. Thus, for a highly
e
cases with increased agitation, e.g. d , h and / or
effective sorbent, a shorter equilibration time is
greater degree of oversaturation. However, it is not
required and may be facilitated by increased agita-
necessary to provide a high analyte concentration in
tion. In the case of the saturated regime, intensive
the analyzed volume, since a high oversaturation
mass transfer at the boundary between the analyzed
degree may be also reached using a highly effective
volume and the sorbent is crucial in providing a fast
sorbent. For example, a one or two order of mag-
extraction, similar to perfect agitation conditions. In
nitude reduction of the equilibration time should be
the case of perfect agitation conditions, where d ,
22
achieved for cases where the depletion layer thick-
10
h and a high oversaturation degree is achieved,
ness (d ) is approximately an order of magnitude less
e.g. y
¯ 0.1 k, the equilibration time should be
0
than the adsorbent layer width and the oversaturation
approximately of the same order as the time of the
degree y ranges from 3 to 10, respectively.
free analyte diffusion into an adsorbent layer as
0
Analyte concentration is another important param-
described by Eq. (46). Thus, perfect agitation con-
eter affecting the equilibration time. For a highly
ditions may be used to describe a fast extraction with
effective sorbent, the analyte concentration should be
relatively high analyte concentration.

S
.N. Semenov et al. / J. Chromatogr. A 873 (2000) 39 –51
49
In a typical SPME extraction, saturation adsorp-
dent diffusion in the adsorbent layer needs to be
tion may not be employed for the quantification of
considered. These concentration effects may be
the analytes in the analyzed volume. The ultimate
caused by the presence of bound analytes [16] in the
amount of the extracted analyte should be equal to
adsorbent layer and have been observed in SPME
q h and independent of the analyte concentration in
extractions.
s
the analyzed volume for the unit surface area of the
The modeling approach presented here is rela-
adsorbent layer. However, the equilibration time
tively simple and uses reasonable assumptions and a
itself could be used for quantification, i.e. from the
simple description of the boundary conditions. De-
analysis of the kinetic curves in the SPME fiber. To
spite its limitations in the proximity of the critical
date, however, the equilibration time for SPME may
analyte concentration, it has a potential for the
not be readily used for cases of competitive ad-
introduction of new adsorbent parameters, as well as
sorption between several analytes. It may also be
the introduction of competitive extraction of several
possible to use a sensor to monitor equilibration
analytes. Thus, the models developed and presented
time, e.g. concentration detection for SPE.
in this paper may serve as a ‘‘stepping stone’’ for the
A similar approach may be used for the modeling
development of competitive adsorption models in
of competitive adsorption of many analytes. In the
thin layers, e.g. SPME coatings.
simplest case of two analytes with identical diffusion
The models presented in this paper extend the
coefficients, a similar approach to that described in
knowledge related to adsorption processes in SPE /
this paper could be used, assuming a competitive
SPME. In particular, these models attempt to de-
Langmuir isotherm. Thus, the concentrations of the
scribe the kinetics of the adsorption process, and can
adsorbed analytes q and q , should be described by
be used in cases where fast sampling with porous
1
2
the following equations
coatings is used [8]. Fast sampling with SPME uses
fiber exposure times of less than 10 s, and relies on
k q
the diffusion coefficients for quantification. Such
1
s
]]
q 5
(48)
1
sampling is an excellent alternative in field air
k 1 k
1
2
sampling, fragrance and pheromone applications.
and
k q
2
s
]]
q 5
(49)
2
k 1 k
4. Conclusions
1
2
where k and k are the partition coefficients for the
The adsorption kinetics of a single analyte into
1
2
competing analytes ‘‘1’’ and ‘‘2’’, respectively.
thin adsorptive layer were modeled for several
The kinetics of desorption may be described as a
different agitation conditions in the analyzed volume.
significant decrease of the equilibrium coefficient k.
The resulting models indicated that at some critical
At such a state, saturation cannot occur, since the
value of the oversaturation degree parameter, the
critical saturation concentration is very high. This
saturation of the adsorbent is completed. The critical
situation is described by Eq. (11) and the boundary
value of the oversaturation parameter was defined by
conditions in Eq. (12).
both the concentration of the analyte in the analyzed
It is often assumed that the adsorption equilibrium
volume and the sorbent characteristics. Secondly, it
between the free and adsorbed analytes is established
was shown that the adsorption process may be
at the analyzed volume-adsorbent layer boundary
described as the propagation of the saturation ad-
[15,16]. Then, the diffusion of the free and bound
sorption boundary toward the inner boundary of the
analytes in the adsorbent layer may be examined
adsorbent layer. Furthermore, the equilibration time
together without any differences between them. This
as a function of analyte concentration was estimated
approach allows simplifying the mathematical prob-
for all modeled agitation cases. The equilibration
lem of the diffusion into the adsorbent layer to the
time can be significantly shortened at high degrees of
diffusion equation. However, concentration-depen-
oversaturation and agitation in the analyzed volume.

50
S
.N. Semenov et al. / J. Chromatogr. A 873 (2000) 39 –51
Acknowledgements
adsorption layer. Eqs. (A.1)–(A.3) can be solved
using a Laplace transformation
This work was supported in part by the Natural
]]
c
0
(s / D )x
œ
e
]
c x, s 5 A e
1
(A.8)
s
d
Sciences and Engineering Research Council of
e
e
s
Canada and the Russian Foundation for Basic Re-
]]]]]
( 11(k
/ s 1k
))?(s / D )x
œ
2
1
i
search (Grant
[ 98-03-32728). The authors would
c x, s 5 A e
(A.9)
s
d
i
i
like to thank Bryn Shurmer and Heather Lord for
k c x, s
s
d
2 i
their help with editing the manuscript.
]]]
q x, s 5
(A.10)
s
d
s 1 k
1
where A and A are the constants, and can be found
e
i
Appendix A
using the boundary conditions, i.e. Eqs. (A.6) and
(A.7), respectively. Finally, the free analyte con-
Eq. (3) and the boundary conditions described by
centration distribution in the adsorption layer can be
Eqs. (14) and (17) may be not valid at the initial
estimated using the following equation
stage of the adsorption when the adsorbent layer is
]]]]]
not saturated by the solute. Eq. (3) assumes satura-
2 ( 11(k
/ s 1k
))?(s / D )x
œ
2
1
i
c
e
0
tion and the establishment of the equilibrium be-
] ]]]]]]]
c x, s 5
?
(A.11)
s
d
]]]]]]
i
s
k
D
2
i
tween free and bound analytes in the adsorbent layer.
]]
]
1 1
1 1
?
S
D
s 1 k
D
œ
Thus, for the analyte concentration distribution in the
1
e
analyzed volume
The case of a highly efficient adsorbent and fast
2
saturation corresponds to very high values of the
≠c
≠ c
e
e
]
]]
5 D ?
at x # 0
(A.1)
e
2
transformation parameter s. Assuming a short satura-
≠t
≠x
tion time, e.g. s 4 k , k , the adsorbent will
1
2
the initial adsorption kinetics should be considered
become saturated earlier than the adsorption equilib-
2
rium
≠c
≠ c
i
i
]
]]
5 D ?
2 k c 1 k q
at x . 0
(A.2)
i
2
2 i
1
]]
c
≠t
0
2 (k
/ D )x
≠x
œ
2
i
]]]]
c x, s 5
? e
(A.12)
s
d
]
i
D
i
≠q
]
s ? 1 1
S
D
] 5 k c 2 k q
at x . 0
(A.3)
2 i
1
D
œ
≠t
e
for the free and bound analyte in the adsorption
k c x, s
s
d
2 i
]]]
q x, s 5
(A.13)
s
d
layer, respectively. Coefficients k
and k
are
1
2
s
desorption and adsorption rate constants, respective-
Eqs. (A.12) and (A.13) describe a steady-state,
ly. At the beginning of the adsorption process, the
exponentially decreasing free analyte concentration,
initial conditions can be described using the follow-
and simultaneously increasing spatial profile of the
ing equations
bound analyte concentration
c t 5 0 5 c
at x # 0
(A.4)
s
d
]]
e
0
2 (k
/ D )x
œ
2
i
e
]]]]
q x, s 5 c k t ?
(A.14)
s
d
]
0
2
c (t 5 0) 5 0,
q(t 5 0) 5 0
at x . 0
(A.5)
D
i
i
]
1 1
S
D
D
œ
e
The boundary conditions at x 5 0 may be written in
the standard form
The profile described by Eq. (14a) should increase
linearly with time until the analyte concentration
c x 5 0 5 c x 5 0
(A.6)
s
d
s
d
i
e
reaches the critical saturation value. Since the bound
≠
≠
analyte distribution decreases with the increasing
]
]
D ?
c x 5 0 5 D ?
c x 5 0
(A.7)
s
d
s
d
e
e
i
i
≠x
≠x
distance from the adsorbent surface, the saturation
Eq. (A.7) corresponds to the conservation of the
should be first established at the boundary x 5 0 ,
s
d
analyte mass in the analyzed volume and in the
when q x 5 0, t 5 q and
s
d
s

S
.N. Semenov et al. / J. Chromatogr. A 873 (2000) 39 –51
51
]
[3] I. Stanetzek, U. Giese, R.H. Schuster, G. Wuensch, Am. Ind.
D
i
Hyg. Assoc. J. 57 (1996) 128.
]
q ? 1 1
S
D
s
D
œ
[4] J. Ai, Anal. Chem. 6 (1997) 1230.
e
]]]]]
t 5
(A.15)
s
[5] J. Ai, Anal. Chem. 16 (1997) 3260.
c k
0
2
[6] J. Ai, Anal. Chem. 22 (1998) 4822.
For large adsorption rate constants, the saturation
[7] T. Gorecki, X. Yu, J. Pawliszyn, Analyst 124 (1999) 643.
[8] M. Jia, J. Koziel, J. Pawliszyn, Field Anal. Chem. Technol.,
time t should be very small in comparison to both
s
in press.
the diffusion equilibration time and the equilibration
[9] C. Chang, A. Lenhoff, J. Chromatogr. A 827 (1998) 281.
time for saturation. Thus, immediately after the
[10] G. Garke, R. Hartmann, N. Papamichael, W. Deckwer, F.
initiation of the extraction process, a thin saturated
Anspach, Sep. Sci. Technol. 34 (1999) 2521.
layer is established close to the boundary between
[11] J. Koziel, M. Jia, A. Khaled, J. Noah, J. Pawliszyn, Anal.
Chim. Acta 400 (1999) 153.
the adsorption layer and the analyzed volume, with a
1 / 2
[12] G. Guiochon, S.H. Shirazi, A.M. Katti, Fundamentals of
width of approximately (D /k )
. As a result, the
i
2
Preparative and Nonlinear Chromatography, Academic Press,
time necessary for initial saturation is very short and
Boston, 1994.
may be neglected in the analysis of the propagation
[13] J. Crank, Mathematics of Diffusion, Clarendon Press, Lon-
of the saturation boundary.
don, UK, 1975.
[14] J. Mattews, R.L. Walker, Mathematical Methods of Physics,
W.A. Benjamin, New York, 1965.
[15] N.N. Tunitskij, V.A. Kaminskij, S.F. Timashev, Methods of
References
Physicochemical Kinetics, Khimija, Moscow, 1972, in Rus-
sian.
[1] J. Pawliszyn, Solid Phase Microextraction – Theory and
[16] N. Fillipova, J. Colloid Interface Sci. 203 (1998) 464.
Practice, Wiley, New York, 1997.
[2] J. Pawliszyn (Ed.), Applications of Solid Phase Microextrac-
tion, Royal Society of Chemistry, Cambridge, UK, 1999.
Wyszukiwarka
Podobne podstrony:
Application of Solid Phase Microextraction Gas Chromatograp
Solid Phase Microextraction Analyses of Flavor Compounds in
Headspace solid phase microextraction profiling of volatile
Solid phase microextraction as a clean up and preconcentrati
Solid phase microextraction for the detection of termite cut
Optimisation of solid phase microextraction of volatiles
Applications of solid phase microextraction to
Comparison of Different Fibers in the Solid Phase Microextra
Application of solid phase microextraction to the analysis o
Development of a headspace solid phase microextraction–gas c
Solid phase microextraction for the analysis of biological s
02 Modeling and Design of a Micromechanical Phase Shifting Gate Optical ModulatorW42 03
The Discrete Time Control of a Three Phase 4 Wire PWM Inverter with Variable DC Link Voltage and Bat
The Discrete Time Control of a Three Phase 4 Wire PWM Inverter with Variable DC Link Voltage and Bat
Solid phase microextraction as a tool for trace element spec
A Practical Guide to Quantitation with Solid Phase Microextr
Vinyl chloride analysis with Solid Phase Microextraction
Design and construction of three phase transformer for a 1 kW multi level converter
Solid phase microextration in biomedical analysis
więcej podobnych podstron