
963 (2002) 381–392
Journal of Chromatography A,
www.elsevier.com / locate / chroma
Development of a headspace solid-phase microextraction–gas
chromatography–mass spectrometry method for the identification of
odour-causing volatile compounds in packaging materials
´
*
˜
´
Oscar Ezquerro, Begona Pons, Marıa Teresa Tena
˜
Department of Chemistry
, University of La Rioja, C / Madre de Dios 51, E-26006 Logrono, La Rioja, Spain
Abstract
A method for the identification of volatile organic compounds in packaging materials is presented in this study. These
compounds are formed by thermooxidative degradation during the extrusion coating process in the manufacture of
packaging. Headspace solid-phase microextraction (HS-SPME) was used as sample preparation technique prior to the
determination of the volatile organic compounds by gas chromatography–mass spectrometry (GC–MS). The effects of
extraction variables, such as the type of fibre, the incubation temperature, the pre-incubation time, the size of the vial and the
extraction time on the amounts of the extracted volatile compounds were studied. The optimal conditions were found to be:
carboxen–polydimethylsiloxane 75 mm fibre, 5 min of pre-incubation time, 100 8C of incubation temperature, 20-ml vial,
and 15 min of extraction time. The chromatograms obtained by HS-SPME and static headspace extraction were compared in
order to show that the HS-SPME method surpasses the static headspace method in terms of sensitivity. Twenty-five
compounds were identified including carbonyl compounds (such as 3-methyl-butanal, 3-heptanone or octanal), carboxylic
acids (such as pentanoic acid or hexanoic acid) known as odour causing compounds and hydrocarbons (such as decane,
undecane or dodecane). Finally, the method was applied to different packaging samples (one odour-unacceptable, two
odour-acceptable, and three odourless samples) and to the raw materials in order to find out the odour-responsible volatile
organic compounds and their source.
2002 Elsevier Science B.V. All rights reserved.
Keywords
: Headspace analysis; Solid-phase microextraction; Packaging materials; Off-flavor compounds; Volatile organic
compounds
1. Introduction
are hydrocarbons, but odour-responsible compounds
are mainly carbonyl compounds such as aldehydes,
Flexible multilayer packaging materials obtained
ketones and carboxylic acids [1–3]. Odour can be
by extrusion coating process are widely used to
produced by a single chemical compound or by a
contain food, cosmetics or medicines. The presence
mixture of several compounds, depending on their
of low molecular mass compounds can impart unde-
threshold odour concentration (TOC, the lower con-
sirable odours and tastes to the content of the
centration of a compound in the air which can be
packaging. The majority of the identified compounds
smelt). The TOC values of hydrocarbons are usually
much higher than those of carbonyl compounds (e.g.
5
3
3
ethane 6.47310
mg / m
and ethanal 0.70 mg / m
*Corresponding author. Tel.: 134-941-299-627; fax: 134-941-
[4]).
299-621.
E-mail address
: maria-teresa.tena@dq.unirioja.es (M.T. Tena).
Volatile organic compounds (VOCs) in packaging
0021-9673 / 02 / $ – see front matter
2002 Elsevier Science B.V. All rights reserved.
P I I : S 0 0 2 1 - 9 6 7 3 ( 0 2 ) 0 0 2 1 1 - X

963 (2002) 381–392
382
´
O
. Ezquerro et al. / J. Chromatogr. A
materials are mostly produced by thermooxidative
SPME reported in this field has been the determi-
degradation of polyolefins in the extrusion coating
nation of residual acetaldehyde in polyethylene
process. This process is necessary to achieve good
terephthalate bottles [16]. VOCs are extracted by
adhesion properties, and entails depositing melting
HS-SPME, separated and identified by GC–MS.
polymers on solid surfaces. The combination of high
The experiments started from a real packaging
temperatures, often extreme shear stress and the
sample with an odour problem. In order to select the
presence of oxygen lead to the formation of organic
SPME conditions to extract VOCs from the packag-
radicals, and the combination of these radicals
ing, the influence of SPME variables on the amount
produces oxygenated compounds [5].
of compound extracted was studied. A gas chromato-
The parameters of the extrusion coating process
graph with a flame ionisation detector and an auto-
may influence the nature and the amount of VOCs in
mated injector, allowing static headspace and SPME
the packaging materials. Since the TOC of odour-
injection, was used. Then, the reproducibility was
responsible VOCs is usually very low (e.g. below 10
determined under optimal conditions and the chro-
3
mg / m in fumes and 10 mg / l in leachates), a very
matogram was compared with that obtained by static
sensitive method is necessary in order to control the
headspace injection. In order to identify the com-
quality of the process.
pounds involved in the analytical signals obtained for
The determination of VOCs in polymers by gas
the packaging with an unacceptable odour, GC–MS
chromatography has been usually carried out by
analysis was performed after manual SPME. The
purge and trap [1,2,6–10], and direct thermal desorp-
reproducibility was determined and, finally, the
tion techniques [11]. Bravo and Hotchkiss [12]
SPME–GC–MS method was applied to the analysis
reported a purge and trap method in which the trap
of several packaging samples and raw materials.
was cooled in liquid N and VOCs were extracted
2
from the traps by washing with ultrapure Freon-113.
The analysis of the fumes formed during the extru-
2. Experimental
sion coating process using a solid adsorbent (Tenax
GR) and a thermal desorption device has also been
2.1. Samples
reported
[3].
Gas
chromatography–mass
spec-
trometry with simultaneous sniffing [1–3] has been
The samples were flexible packaging materials
demonstrated to be a suitable method to identify the
consisting of a layer of cellulose (Cel), clay-coated
off-odour compounds formed during the extrusion
paper (CCP) or satin cellulose (Sat), a layer of
coating
process
of
low-density
polyethylene.
polyethylene (PE), a layer of aluminium, and another
Besides, Fales et al. [13] reported a methodology for
layer of polyethylene, copolymer (Cp) or ionomer
˜
the correlation of the objective GC–MS analytical
(Ion), and were provided by Tobepal (Logrono,
data with the odour panel results. The compounds
Spain).
that cause the off-flavors were identified by Villberg
The samples were classified as odourless, odour
et al. [1–3] mainly as carbonyl compounds, and by
acceptable and odour unacceptable by an odour panel
Hodgson et al. [7,8] as aldehydes, while alkanes and
composed of laboratory staff from Tobepal and
alkenes rarely impart odour.
following the procedure described in Ref. [13]. The
In this work, a method for the identification of
raw materials used in the manufacture of the multi-
VOCs in flexible packaging based on headspace
layer packaging: cellulose, aluminium and poly-
solid-phase microextraction (HS-SPME)–GC–MS is
ethylene were also provided by Tobepal. The raw
presented.
Solid-phase
microextraction
(SPME)
materials were all classified as odourless by the
[14,15] is a solvent-free technique for sample prepa-
odour panel.
ration, which allows a direct, simple and rapid
analysis of solid samples, particularly recommended
2.2. Chemicals
for volatile analytes. This is the first time that HS-
SPME has been used for the direct analysis of this
The following chemicals were used to identify the
kind of sample; up to now, the only application of
volatile
compounds:
pentanoic
acid
($99.0%),

963 (2002) 381–392
383
´
O
. Ezquerro et al. / J. Chromatogr. A
butanal ($97.0%), pentanal ($98%), 2,4-pentane-
or 20-ml headspace glass sealed vial (automatic HS-
dione ($99.5%), 3-methylbutanal ($98%), cyclo-
SPME). The sample was incubated at 100 8C for 5
hexanone ($99.5%), hexanal ($98%), heptanal
min to speed up the release of off-odour-responsible
($95%), 3-heptanone ($99.5%), 2-ethylhexanal
volatile compounds from the packaging, and then
($97%), octanal ($98%), nonanal (|97%), decanal
equilibrated
with
a
75-mm
carboxen–polydi-
(|97%), undecanal (|97%), and dodecanal (|97%)
methylsiloxane (CAR–PDMS) fibre immersed in the
from
Fluka,
hexanoic
acid
(199.5%),
decane
headspace above the packaging for 15 min. The
(199%), undecane (199%), and dodecane (199%)
VOCs were thermally desorbed in the injector port of
from Aldrich, acetone (99.8%) and toluene (99.8%)
the chromatograph for 15 min and transferred to the
from Carlo Erba, and acetic acid (80%) from Pan-
chromatograph column where they were separated,
reac.
and finally the VOCs were carried to the mass
Stock solutions of pure compounds were made in
spectrometer for their identification.
2
2
methanol; dilutions of 1–10 mg / ml in water were
Sixty cm
of cellulose, 60 cm
of aluminium
used to identify the compounds. A volume (1 ml) of
(30-mm thick), and a polyethylene pellet (32.4 mg)
the diluted solution of the pure compounds was
were processed following the manual HS-SPME
placed in a headspace glass sealed vial and analysed
procedure described for packaging samples.
by SPME–GC as described below for packaging
samples.
2.5. Chromatographic conditions
2.3. Instruments and materials
The GC–MS system was equipped with a CP5860
wall-coated open tubular (WCOT) fused-silica col-
A Varian 3900 gas chromatograph with a Varian
umn (30 m30.25 mm I.D. with a 0.25 mm CP-SIL8
Saturn 2100T MS detector was used for the identifi-
CB low-bleed / MS phase, Varian). An initial oven
cation of volatile compounds and for the analysis of
temperature of 35 8C for 5 min was used, followed
packaging samples and raw materials. The extraction
by an increase in the temperature at a rate of 10 8C /
of compounds was performed manually with an
min to 230 8C. A 0.8 mm I.D. insert was used, and
SPME holder from Supelco, together with a hot plate
the carrier gas was helium, at 1 ml / min. The injector
from Corning and a metal support for eight vials of
was maintained at 280 8C, with a 1:20 split ratio at
15-ml. The assignment of each chromatographic
initial time, followed by a 1:50 split ratio at 0.5 min.
peak was determined using a GC–MS mass spectral
Although the splitless injection is recommended in
library (US National Institute of Standards and
SPME–GC [14], a split injection was used since the
Technology, NIST). Once the peaks were identified,
splitless injection gave rise to poor resolution and
individual standard solutions of the compounds were
tailing peaks in GC–MS chromatograms. The mass
injected in order to make quite sure of the assign-
spectrometer was scanned from m /z 33 to 650 at a
ment by retention time.
cycle of 1 s, the fragmentation was made by elec-
A Varian 3800 gas chromatograph with a flame
tronic impact, and the ion trap temperature was
ionization detector (FID) and a Combipal autosam-
200 8C.
pler (CTC Analytics), which allows automated static
The GC–FID system was equipped with a CP-
headspace and SPME injections using 10- and 20-ml
Select 624 column (30 m30.32 mm I.D. with 1.8
vials, were used to optimise the SPME conditions
mm phase). An initial GC temperature of 35 8C for 5
and to compare the HS-SPME–GC and the static
min was used, followed by an increase in the
HS-GC methods.
temperature at a rate of 10 8C / min to 200 8C and to a
final hold at 200 8C for 5 min. The carrier gas was
2.4. Sampling procedure
helium, at 1.7 ml / min. The detector temperature was
300 8C, with a make up flow of 25 ml / min, a H
2
2
Sixty cm of flexible multilayer packaging materi-
flow of 30 ml / min and an air flow of 300 ml / min.
al was bent to provide freer surface and placed in a
The conditions in the SPME injections were an
15-ml sealed vial with screw top (manual HS-SPME)
injector temperature of 280 8C and a splitless mode

963 (2002) 381–392
384
´
O
. Ezquerro et al. / J. Chromatogr. A
at the initial time, followed by a 1:50 split ratio at
fibre, the incubation temperature, the extraction time,
0.5 min. A 0.8 mm I.D. insert was used. The
the pre-incubation time or the size of the vial on the
conditions in the static headspace injections were as
amount of VOCs extracted were studied using the
follows: an incubation step at 100 8C for 10 min, an
univariate method. The aim of the study was to find
agitation speed of 500 rev. / min, a syringe tempera-
out the optimal values providing the maximal
ture of 110 8C, an injection volume of 500 ml, an
amount extracted and a good reproducibility.
injector temperature of 250 8C and a 1:20 split ratio
at initial time, followed by a 1:50 split ratio at 1.0
3.1.1. Type of fibre
min. A 3.4 mm I.D. insert was used.
The polarity of the fibre depends on the coating
material. Several fibres with different polarity and
2.6. HS-SPME–GC signal reproducibility
thickness were tested including: 85 mm polyacrylate
(PA 85), 100 mm polydimethylsiloxane (PDMS
On the one hand, 10 replicates were analysed by
100), 65 mm polydimethylsiloxane–divinylbenzene
HS-SPME–GC–FID under the following conditions:
(PDMS–DVB 65), 50 / 30 mm divinylbenzene–car-
the samples were placed in 20-ml headspace glass
boxen–PDMS (DVB–CAR–PDMS 50 / 30), 75 mm
sealed vials, the incubation temperature was 100 8C,
carboxen–polydimethylsiloxane (CAR–PDMS 75)
the pre-incubation time was 5 min, and the com-
and 85 mm carboxen–polydimethylsiloxane (CAR–
pounds were extracted with a CAR–PDMS 75 mm
PDMS 85) fibres.
fibre for 30 min. The SPME was performed auto-
Samples were placed in 20-ml headspace glass
matically. On the other hand, five replicates were
sealed vials, and the extraction was made at room
analysed by HS-SPME–GC–MS using 15-ml vials
temperature for 15 min. Duplicate extractions were
with screw top, the incubation temperature was
performed. Table 1 shows the relative area values
100 8C, the pre-incubation time was 5 min, and the
obtained with the different types of fibres for several
compounds were extracted with a CAR–PDMS 75
selected compounds. The worst results were obtained
mm fibre for 15 min. The SPME was performed
using the most polar fibre (PA) and the most non-
manually.
polar fibre (PDMS). As expected from the nature of
the analytes, CAR–PDMS and DVB–CAR–PDMS
fibres provided the best results in terms of amount of
3. Results and discussion
compound extracted; CAR–PDMS fibre provided the
best results for low molecular mass compounds and
3.1. Optimisation of HS-SPME variables
DVB–CAR–PDMS fibre for high molecular mass
compounds. As a compromise, CAR–PDMS 75 was
The influence of variables such as the type of
selected for further experiments.
Table 1
a
Influence of the type of fibre on the HS-SPME of VOCs in packaging materials
Compound
PA
PDMS
PDMS–DVB
DVB–CAR–PDMS
CAR–PDMS
CAR–PDMS
85
100
65
50 / 30
75
85
Acetone
–
–
2
51
100
15
Butanal
69
–
–
80
99
100
Pentanal
13
–
15
48
68
100
Toluene
4
2
47
95
100
42
Hexanal
5
–
47
65
59
100
Heptanal
–
–
80
100
54
53
Cyclohexanone
3
12
62
100
77
27
Octanal
–
23
86
100
41
39
Nonanal
24
62
87
100
25
53
a
Relative area values are the mean of two replicates. For HS-SPME and GC–FID conditions, see the text.
963 (2002) 381–392
385
´
O
. Ezquerro et al. / J. Chromatogr. A
3.1.2. Incubation temperature
This is one of the most important variables in the
extraction of VOCs. On the one hand, the tempera-
ture affects the distribution constants of the equilib-
rium fibre–gas and sample–gas, therefore it deter-
mines the amounts of analyte extracted from the
fibre; an increase in the temperature resulted in an
increase in the concentration of VOCs in the gas
phase. On the other hand, the temperature affects the
kinetics of the process since the diffusion rates of
VOCs in the polymer matrix and the fibre coating
increase with the increase of temperature. Wyatt [6]
reported on the headspace extraction of VOCs from
polymers that low molecular mass compounds with
significant vapour pressure can be extracted at room
temperature, but when increasing temperature high-
er-molecular-mass compounds can also be extracted.
In this study, the samples were placed in 20-ml
headspace glass sealed vials, preheated for 5 min,
and the headspace was equilibrated with a CAR–
PDMS 75 mm fibre for 15 min. The incubation
temperatures were studied within the range of 40–
120 8C. The experiments were performed in dupli-
cate. Fig. 1 shows the relative areas obtained be-
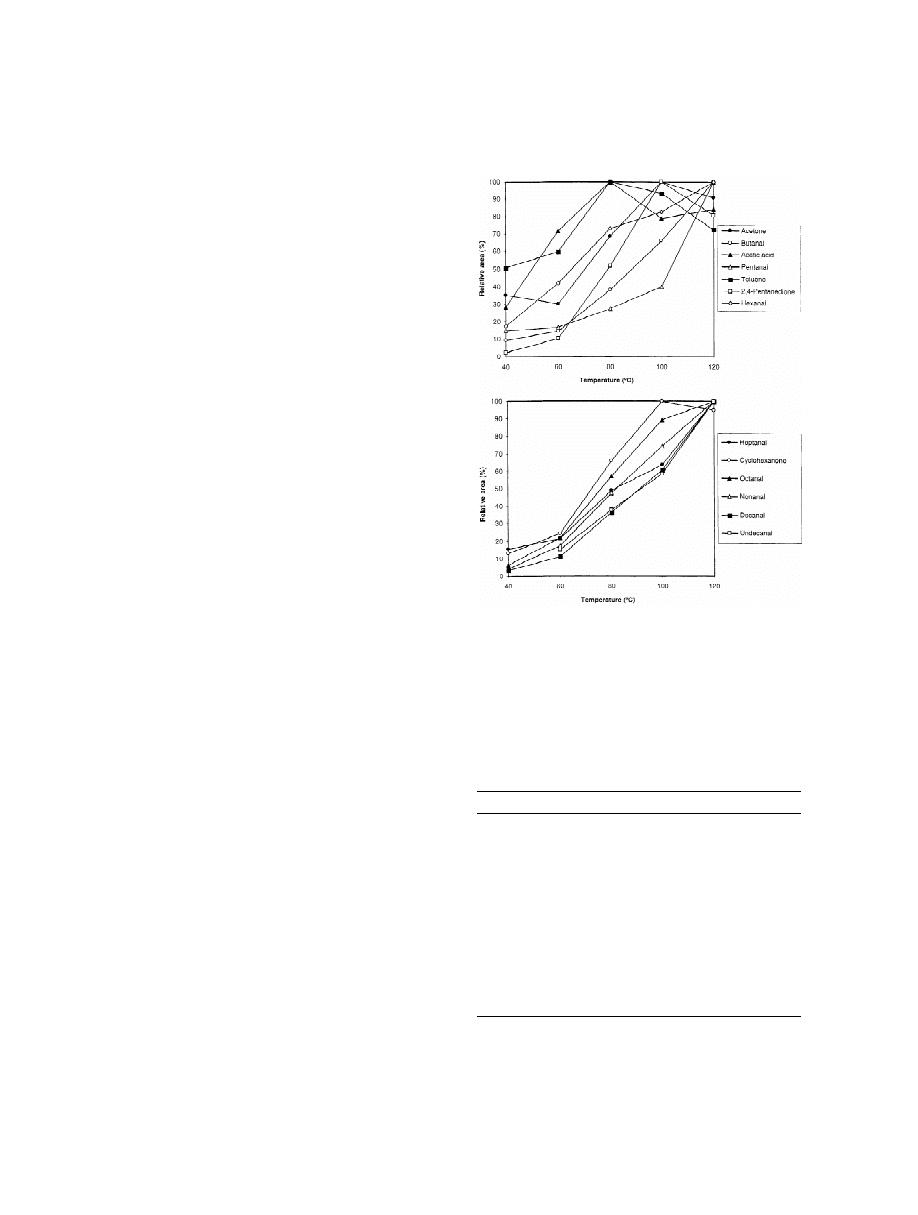
tween 40 and 120 8C for several selected compounds.
Fig. 1. Influence of the incubation temperature on the HS-SPME
As expected, the amount of compound extracted
of VOCs in packaging materials. For HS-SPME and GC–FID
increased by increasing the temperature. The effect
conditions, see the text.
of temperature on the extracted amount depended on
each compound, while the amount of aldehydes still
increased at 120 8C, other compounds such as acetic
acid, toluene, or acetone achieved a plateau at 80 or
100 8C. However, an incubation temperature of
Table 2
100 8C was selected for further experiments because
Influence of pre-incubation time on the area of several identified
a
some polymer melting was observed at 120 8C.
VOCs
Compound
5 min
10 min
15 min
3.1.3. Pre-incubation time
Acetone
100
74
77
The time during which the samples were preheated
Butanal
100
78
98
to volatilise the VOCs from the sample matrix before
Acetic acid
84
100
88
extraction was also optimised. Samples were placed
Pentanal
85
89
100
in 20-ml headspace glass sealed vials, heated at
Toluene
100
50
45
2,4-Pentanedione
100
71
82
100 8C and the extraction was made with a CAR–
Hexanal
80
91
100
PDMS 75 mm fibre for 15 min. Three pre-incubation
Heptanal
76
87
100
times were studied: 5, 10 and 15 min. The experi-
Cyclohexanone
93
80
100
ments were performed in duplicate. The relative
Octanal
87
89
100
areas obtained for several selected compounds at
Nonanal
69
94
100
Decanal
70
95
100
these three pre-incubation time values are shown in
Undecanal
78
90
100
Table 2. The pre-incubation time was not a signifi-
a
cant variable, there was no tendency, and the signals
Relative area values are the mean of two replicates.
963 (2002) 381–392
386
´
O
. Ezquerro et al. / J. Chromatogr. A
were similar within the experimental error. There-
were performed. The relative areas of identified
fore, 5 min of pre-incubation was chosen as a
peaks versus the extraction time are shown in Fig. 2.
condition for further experiments.
The extraction time needed to reach the distribution
equilibrium depends on the compound. Thus, 15–25
3.1.4. Vial size
min were enough for the smaller compounds, such as
The size of the vial determines the volume of the
acetic acid, acetone, toluene or cyclohexanone, while
headspace, so it affects the sensitivity of SPME.
the equilibrium was not reached in 60 min for
Headspace glass sealed vials of 10 ml and 20 ml
volatile compounds with an increased number of
were tested. Before the extraction, the samples were
carbon atoms, such as octanal, nonanal, decanal or
preheated for 5 min at 100 8C, and then the ex-
undecanal. An extraction time of 15 min was select-
traction was carried out using a CAR–PDMS 75 mm
ed for further experiments as a compromise between
fibre for 15 min at 100 8C. Duplicate extractions
sensitivity and analysis time.
were performed. Table 3 shows the relative areas
obtained with 10-ml and 20-ml vials for several
3.2. Comparison of HS-SPME–GC–FID and static
selected compounds. The amount extracted increased
HS-GC –FID methods
using 20-ml vials for the lower molecular mass
compounds, whereas 10-ml vials provided better
In order to compare the sensitivity of the HS-
results for higher molecular mass compounds (less
SPME–GC–FID and the HS-GC–FID methods, 60
volatile compounds).
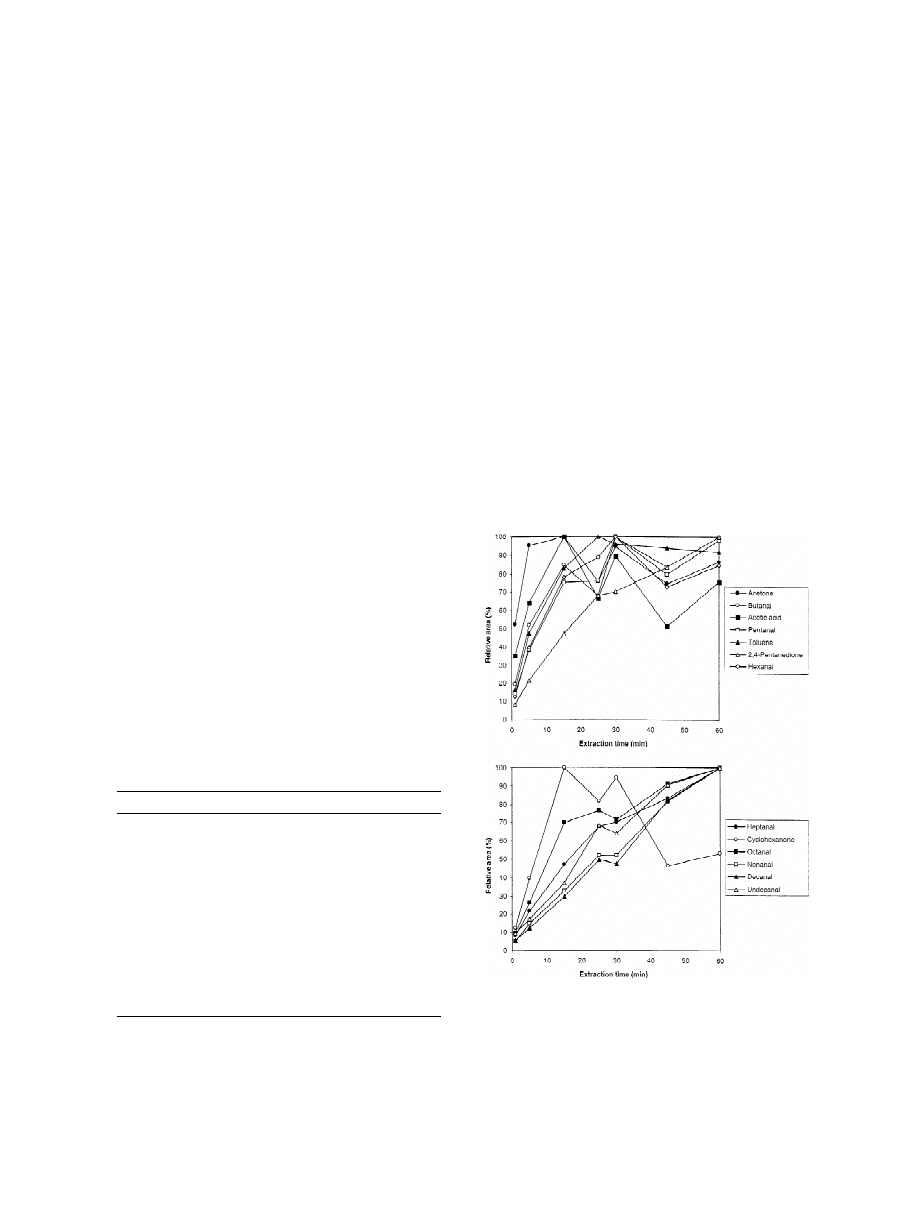
3.1.5. Extraction time
The
measurements
when
the
equilibrium
is
reached are more reproducible than non-equilibrium
measurements. Therefore, the time the fibre was
exposed to the headspace gas was optimised in order
to determine the equilibrium time.
The samples were placed in 20-ml headspace glass
sealed vials, a 5 min pre-incubation time was used,
and the extraction was carried out using a CAR–
PDMS 75 mm fibre at 100 8C. The extraction time
varied from 1 to 60 min, and duplicate extractions
Table 3
a
Influence of size of vial on the area of several identified VOCs
Compound
10 ml vial
20 ml vial
Acetone
96
100
Butanal
76
100
Acetic acid
100
98
Pentanal
89
100
Toluene
23
100
2,4-Pentanedione
100
99
Hexanal
100
96
Heptanal
100
87
Cyclohexanone
65
100
Octanal
87
100
Nonanal
100
62
Decanal
100
62
Fig. 2. Influence of the extraction time on the HS-SPME of VOCs
Undecanal
100
69
in packaging materials. For HS-SPME and GC–FID conditions,
a
Relative area values are the mean of two replicates.
see the text.
963 (2002) 381–392
387
´
O
. Ezquerro et al. / J. Chromatogr. A
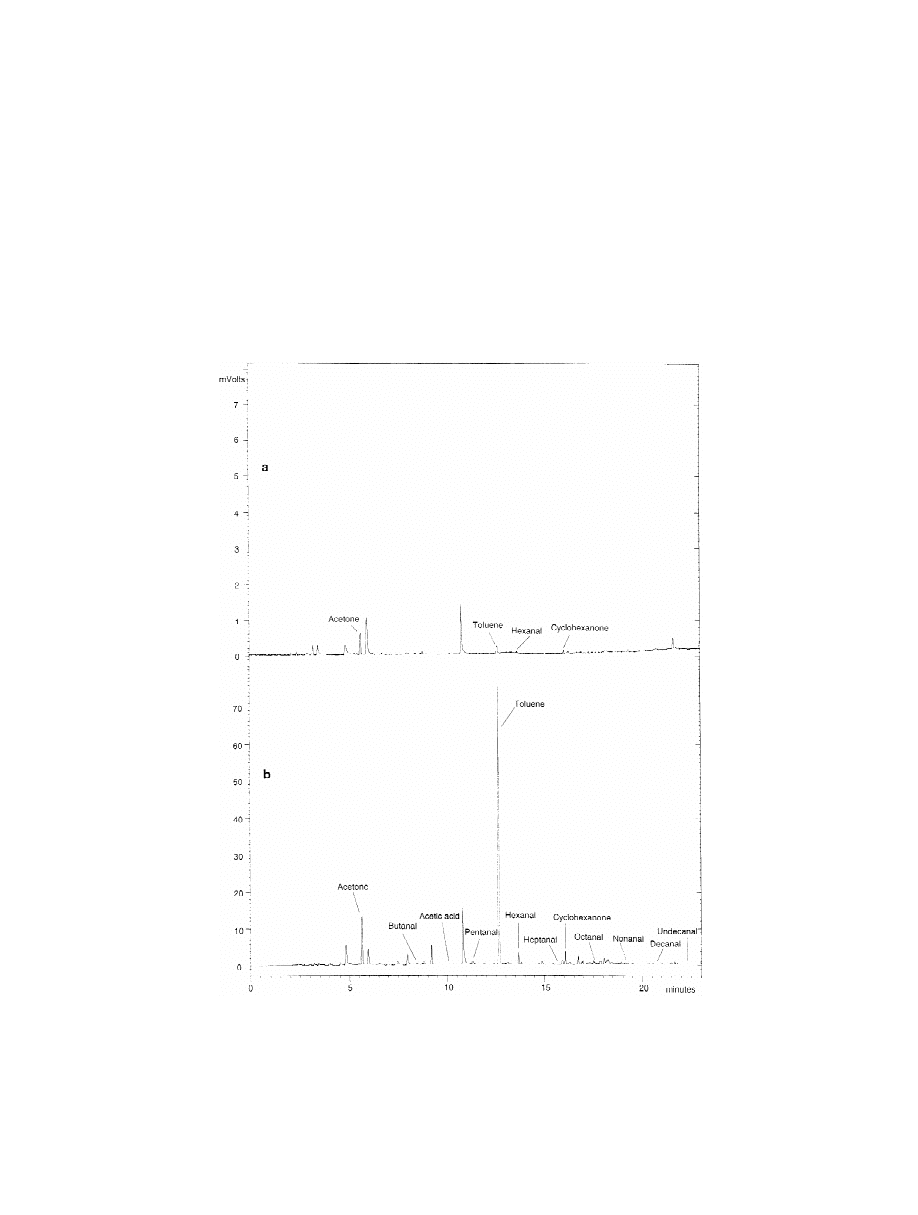
2
cm
of an odour unacceptable sample were pro-
hexanal and cyclohexanone. The HS-SPME–GC
cessed in 20-ml vials. In the HS-SPME–GC method
signal was 24, 430, 58 and 47 times higher for
the compounds were extracted using a CAR–PDMS
acetone, toluene, hexanal, and cyclohexanone, re-
75 mm fibre for 15 min at room temperature. The
spectively. Consequently, the HS-SPME method is
HS-GC conditions are described in the Experimental
more sensitive than the static headspace method.
section. Fig. 3 shows the HS-SPME–GC and the
HS-GC chromatograms obtained for the sample.
3.3. HS-SPME–GC signal reproducibility
Only four compounds provided significant signals
using the static headspace method: acetone, toluene,
After the optimisation of the HS-SPME variables,
Fig. 3. Chromatograms obtained for an odour unacceptable packaging by (a) the HS-GC–FID and (b) HS-SPME–GC–FID method. For
HS-GC–FID and HS-SPME–GC–FID conditions, see the text.

963 (2002) 381–392
388
´
O
. Ezquerro et al. / J. Chromatogr. A
Table 4
Relative standard deviation (%) of the areas in compounds identified by the HS-SPME–GC–FID and the HS-SPME–GC–MS method
Compound
RSD %
HS-SPME–GC–MS (n 55)
HS-SPME–GC–FID (n 510)
(manual)
(automated)
Acetone
11.6
11.3
Acetic acid
11.0
32.1
Butanal
33.1
12.8
3-Methylbutanal
17.2
Pentanal
8.8
8.7
Toluene
8.8
11.8
2,4-Pentanedione
9.9
11.3
Hexanal
4.0
7.1
Pentanoic acid
23.9
3-Heptanone
13.2
Cyclohexanone
15.0
30.5
Heptanal
8.0
5.4
2-Ethylhexanal
15.9
Hexanoic acid
26.4
Decane
13.9
Octanal
7.6
7.5
Undecane
11.9
Nonanal
8.0
13.8
Dodecane
7.7
Decanal
12.5
14.5
Undecanal
9.3
8.2
Dodecanal
9.0
a study of reproducibility was carried out. The
checked by HS-SPME injection of water–methanol
relative standard deviations of the areas for the
solutions of the pure compounds. Table 5 shows the
identified peaks are shown in Table 4. The results
compounds identified, their retention time, and the
obtained were between 4 and 15%, except for acetic
area of the compound obtained for the odour un-
acid, butanal, 3-methylbutanal, pentanoic acid and
acceptable sample divided by the area of the com-
hexanoic acid, which showed very low concentration
pound obtained for the odourless sample. Twenty-
levels.
five compounds, including hydrocarbons, alcohols,
aldehydes, ketones and carboxylic acids, were iden-
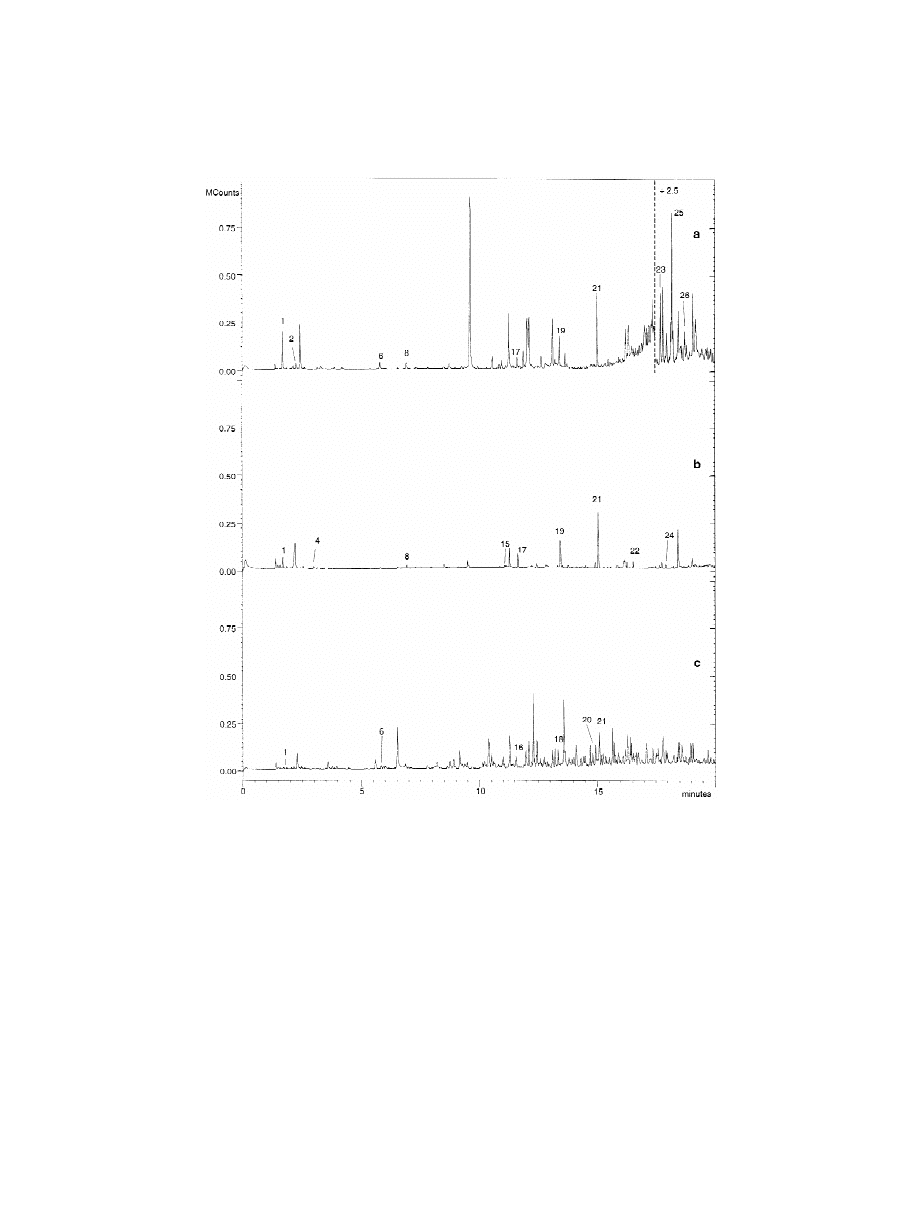
3.4. Identification of volatile compounds
tified. The levels of VOCs, particularly of com-
pounds such as 3-methylbutanal, toluene, 2,4-pen-
Two types of packaging materials with the same
tanedione, 3-heptanone, hexanoic acid, and undecan-
multilayer composition but obtained under different
al were higher in the unacceptable odour sample than
extrusion coating conditions, one of them with an
in the odourless sample. Also, the amount of
unacceptable odour and the other with an acceptable
azulenes was higher.
odour, were analysed by HS-SPME–GC–MS. The
odour-responsible volatile compounds must show
3.5. Analysis of the raw materials
higher signals in the unacceptable odour packaging
material chromatogram. Fig. 4 shows the chromato-
The raw materials used in the manufacture of the
grams of these two packaging materials and a blank.
multilayer packaging: cellulose, aluminium and poly-
The assignment of each chromatographic peak was
ethylene were analysed by HS-SPME–GC–MS in
done using a GC–MS mass spectral library (NIST),
order to determine the presence of VOCs in these
and the identification of the volatile compounds was
materials. Fig. 5 shows the chromatograms obtained.
963 (2002) 381–392
389
´
O
. Ezquerro et al. / J. Chromatogr. A
Fig. 4. Chromatograms of (a) an odour unacceptable packaging, (b) an odour acceptable packaging and (c) a blank. For HS-SMPE and
GC–MS conditions, see the text. Peak assignment as in Table 5.
Azulenes were found in the cellulose samples, these
3.6. Analysis of multilayer packaging materials
compounds are used to get whiter cellulose and are
not responsible for odour problems. Octanal, nonanal
Six packaging materials with different composi-
and decanal were found in aluminium, and they
tion were analysed by HS-SPME–GC–MS in order
might have been formed by the oxidation of the oils
to compare their levels of volatile organic com-
used to get good aluminium properties [6]. Odour-
pounds.
responsible compounds were not found in poly-
Table 6 shows the area percentage of each volatile
ethylene or had very low concentrations.
organic compound in the packaging material related

963 (2002) 381–392
390
´
O
. Ezquerro et al. / J. Chromatogr. A
Table 5
Compounds in an odour unacceptable packaging identified by HS-SPME–GC–MS
Peak number
Compound
Retention time (min.)
Odour / odourless level ratio
1
Acetone
1.71
2.7
2
Acetic acid
2.18
2.3
3
Butanal
2.27
3
4
3-Methylbutanal
3.02
8.8
5
Pentanal
3.81
2.6
6
Toluene
5.82
3.6
a
7
2,4-Pentanedione
6.26
43.1
8
Hexanal
6.93
1.7
a
9
2,4-Pentanedione
7.42
–
10
Pentanoic acid
9.09
2.7
11
3-Heptanone
9.17
3.6
12
Cyclohexanone
9.39
2.5
13
Heptanal
9.57
3.3
14
2-Ethylhexanal
10.69
2.7
15
Hexanoic acid
11.09
3.7
16
Decane
11.57
1.9
17
Octanal
11.66
2.7
18
Undecane
13.35
1.8
19
Nonanal
13.46
1.7
20
Dodecane
14.94
1.8
21
Decanal
15.08
1.4
22
Undecanal
16.56
3.2
b
23
1,2,4-Methenoazulene,
17.68
9.2
decahydro-1,5,5,8a-tetramethyl,
[1S-(1a,2a,3ab,4a,8ab,9R)]-
24
Dodecanal
17.95
1.4
b
25
1,4-Methanoazulene, decahydro-
18.17
11.3
4,8,8-trimethyl-9-methylene-,
[1S-(1a,3ab,4a,8ab)]-
b
26
1H-Cycloprop[e]azulene,
18.72
19.3
1a,2,3,5,6,7,7a,7b-octahydro-
1,1,4,7-tetramethyl-,
[1aa,7a,7ab,7ba)]-
a
2,4-Pentanedione gives rise to two tautomer peaks.
b
Only identified by NIST library.
to the area of the compound in a sample with an
useful for the identification of volatile compounds
unacceptable odour (sample 1). As it can be seen, the
contained in packaging materials and formed during
amounts of VOCs depend on the multilayer com-
the extrusion coating process and can be used to
position and the conditions of the extrusion coating
control the quality of the raw materials. Also, the
process. The highest levels of VOCs were found in
HS-SPME method surpasses the static headspace
the sample with an unacceptable odour.
method in terms of sensitivity.
Regarding the optimisation of HS-SPME vari-
ables, the type of fibre, the extraction time and the
temperature were the most influencing parameters for
4. Conclusions
the amount of VOCs extracted.
Hydrocarbons and carbonyl compounds such as
The HS-SPME–GC–MS method proposed is very
aldehydes, ketones and carboxylic acids were found
963 (2002) 381–392
391
´
O
. Ezquerro et al. / J. Chromatogr. A
Fig. 5. Chromatograms of raw materials: (a) cellulose, (b) aluminium and (c) polyethylene. For HS-SMPE and GC–MS conditions, see the
text. Peak assignment as in Table 5.
in packaging samples obtained by extrusion coating
be the most probable reason for the organoleptic
of polyethylene. No compounds with a significant
problems.
odour were found in the raw materials used in the
packaging manufacture.
The highest level of carbonyl compound was
Acknowledgements
found in the packaging with an unacceptable odour.
˜
Carbonyl compounds, formed from hydrocarbons
The authors thank Tobepal S.A. (Logrono, Spain)
during the heating of polyethylene, are supposed to
for
financing
this
study
through
contract

963 (2002) 381–392
392
´
O
. Ezquerro et al. / J. Chromatogr. A
Table 6
a
b
Comparison of the areas of the volatile compounds in different packaging materials
Compound
Sample 1
Sample 2
Sample 3
Sample 4
Sample 5
Sample 6
Acetone
100
54
7
7
50
39
Acetic acid
100
14
14
10
15
34
Butanal
100
44
4
6
54
32
3-Methylbutanal
100
27
0
0
39
31
Pentanal
100
37
6
7
42
47
2,4-Pentanedione
100
2
7
7
74
0
Hexanal
100
65
10
12
79
90
3-Heptanone
100
31
8
16
41
15
Cyclohexanone
100
2
49
59
4
2
Heptanal
100
8
10
12
12
27
2-Ethylhexanal
100
29
0
0
70
10
Hexanoic acid
100
23
15
0
20
37
Octanal
100
85
16
16
105
119
Nonanal
100
29
35
33
41
70
Decanal
100
25
29
29
34
58
Undecanal
100
134
22
18
137
243
Dodecanal
100
23
13
12
19
44
a
The results are the mean value of two replicates expressed as an area percentage related to the areas of sample 1.
b
Sample 1, Cel–PE–Al–PE (odour unacceptable); sample 2, CCP–PE–Al–Ion (odour acceptable); sample 3, Sat–PE–Al–PE (odourless);
sample 4, Sat–PE–Al–PE (odourless); sample 5, CCP–PE–Al–Cp (odourless); sample 6, CCP–PE–Al–PE (odour acceptable).
´
[8] S.C. Hodgson, R.J. Casey, J.D. Orbell, S.W. Bigger, J. Chem.
OTEM001218. O.E. also thanks the Comunidad
Educ. 77 (2000) 1631.
´
Autonoma de La Rioja for his grant.
[9] S. Jacobsson, J. High Resolut. Chromatogr. Chromatogr.
Commun. 7 (1984) 185.
[10] A. Hagman, S. Jacobsson, J. Chromatogr. 395 (1987) 271.
References
[11] W.V. Ligon Jr., M.C. George, J. Polym. Sci. Polym. Chem.
Ed. 16 (1978) 2703.
[12] A. Bravo, J.H. Hotchkiss, J. Appl. Polym. Sci. 47 (1993)
¨
[1] K. Villberg, A. Veijanen, I. Gustafsson, K. Wickstrom, J.
1741.
Chromatogr. A 791 (1997) 213.
[13] N.J. Fales, L.C. Stover, J.D. Lamm, Polym.-Plast. Technol.
[2] K. Villberg, A. Veijanen, I. Gustafsson, Polym. Eng. Sci. 38
Eng. 21 (1983) 111.
(1998) 922.
[14] J. Pawliszyn, Solid Phase Microextraction, Theory and
[3] K. Villberg, A. Veijanen, Anal. Chem. 73 (2001) 971.
Practice, Wiley–VCH, New York, 1997.
[4] M. Meilgaard, G.V. Civille, B.T. Carr, Sensory Evaluation
[15] J. Pawliszyn (Ed.), Applications of Solid Phase Microextrac-
Techniques, CRC Press, New York, 1991.
tion, Royal Society of Chemistry, Cambridge, 1999.
[5] W. Voigt, R. Todesco, in: Proceedings of the 1st International
[16] H. Cizkova, M. Voldrich, J. Dobias, Czech J. Food Sci. 16
Conference on Polymer Modification Degradation and
(1998) 81.
Stabilisation, Palermo, September, 2000.
[6] D.M. Wyatt, J. Plast. Film Sheet 2 (1986) 144.
[7] S.C. Hodgson, M.J. O’Connor, R.J. Casey, S. Bigger, J.
Agric. Food Chem. 46 (1998) 1397.
Wyszukiwarka
Podobne podstrony:
Headspace solid phase microextraction profiling of volatile
Headspace solid phase microextraction for the determination
Application of Solid Phase Microextraction Gas Chromatograp
Solid Phase Microextraction Analyses of Flavor Compounds in
Solid phase microextraction for the detection of termite cut
Kinetics of solid phase extraction and solid phase microextr
Optimisation of solid phase microextraction of volatiles
Applications of solid phase microextraction to
Comparison of Different Fibers in the Solid Phase Microextra
Application of solid phase microextraction to the analysis o
Solid phase microextraction for the analysis of biological s
Solid phase microextraction as a clean up and preconcentrati
Solid phase microextraction as a tool for trace element spec
A Practical Guide to Quantitation with Solid Phase Microextr
Vinyl chloride analysis with Solid Phase Microextraction
Solid phase microextration in biomedical analysis
Solid phase microextraction for herbicide determination in
Solid phase microextraction to concentrate volatile products
Solid phase microextraction a promising technique for sample
więcej podobnych podstron