
Effect of sensory education on school children’s food perception: A 2-year
follow-up study
Sari Mustonen
*
, Reetta Rantanen, Hely Tuorila
Department of Food Technology, University of Helsinki, P.O. Box 66, FI-00014 University of Helsinki, Finland
a r t i c l e
i n f o
Article history:
Received 19 October 2007
Received in revised form 4 October 2008
Accepted 4 October 2008
Available online 11 October 2008
Keywords:
Child
Sensory education
Taste
Smell
Food perception
Neophobia
a b s t r a c t
We studied the effect of sensory education on taste and odor awareness and food ratings in school children.
Second and fifth graders (n = 244, 7–11 years at the baseline) from two schools in Helsinki area participated
in the study. At the completion of the study at two years, the groups consisted of 96 (education, school one)
and 79 (control, school two) students. At baseline and in four follow-up measurements, both groups per-
formed six tasks: (1) free odor naming (five odors), (2) taste identification (six solutions), (3) descriptive
characterization of two breads, (4) ratings of the extent to which subjects paid attention to sensory prop-
erties of food, (5) willingness-to-try ratings of unfamiliar vs. familiar foods and (6) aided odor naming (five
odors, 10 verbal labels). Subsequently, the education group received two waves of sensory education: the
first wave comprised of 10 Classes du goût lessons and the 2nd of 5 lessons familiarizing the children with
different food categories. The second wave was performed only for 2/3 of the education group. The edu-
cated children improved their skills in identifying tastes and odors, and characterizing foods, while no dif-
ference was seen in the performance of the control group. However, effects of education were mainly
observed for the younger children only. Although the improvements were small and not always consistent
over the study period, their general direction was encouraging: the sensory education activated children’s
odor and taste perceptions and improved their ability to describe sensory properties of food.
Ó 2008 Elsevier Ltd. All rights reserved.
1. Introduction
Flavor preferences established early in life track into later child-
hood (
Mennella, Pepino, & Reed, 2005
). The information concerning
children’s use of their senses of taste and smell, and learning their
preferences, is still rather scarce. It is, however, well known that
children like sweet-tasting foods and beverages.
has
found that children under five years base their food preferences
on two dimensions: sweetness and familiarity. Thus, children’s food
preferences and dietary choices might be driven primarily by sen-
sory qualities of food, whereas adults tend to be more concerned
with the nutritional and health qualities of the diet (
2000; Nicklaus, Boggio, Chabanet, & Issanchou, 2004
A common belief is that children are more sensitive to smell and
taste stimuli than adults, although researchers have not been able
to show any difference in sensitivity (
). The belief
may be a misconception due to children’s tendency not to accept
new or unfamiliar foods, called neophobia. Neophobia is a protec-
tive mechanism preventing animals and humans from eating what
could be harmful to them. At the same time it leads humans to
choose the familiar and safe food instead of new and unfamiliar,
potentially harmful food. Neophobia appears in all age groups,
but the strength of neophobia varies between individuals (
). In children, strong neophobia is probably due to
the lack of earlier experiences on different foods (
), as
exposures to a large variety of unfamiliar foods can reduce the neo-
phobic reactions towards other novel, at least similar, foods (
Gunder, Grimm-Thomas, & Laing, 1998
). Also
have shown that exposing humans to novel foods
can reduce their food neophobia. Thus, humans tend to widen their
preferences also to initially rejected foods, but they need a compel-
ling force to do so. According to
, and
, social influence may also help to reduce neophobia, espe-
cially in children. The present paper describes a sensory education
program that provides children social interaction with their peers
as well as increases their awareness of and curiosity towards foods.
Sensory education may act as the compelling force needed to
increase willingness to taste unfamiliar foods.
In industrialized countries, changing society and busy lifestyles
drive people to more convenient and, at the same time, to monot-
onous food choices and increased use of snack foods (
). The current lifestyle also acts as a main
barrier to planning regular and balanced meals in the family: par-
ents are busy and the need for convenience drives them more and
more often to feed their children with easy options like fast food or
snacks (
Gillman et al., 2000; Haapalahti, Mykkänen, Tikkanen, &
0950-3293/$ - see front matter Ó 2008 Elsevier Ltd. All rights reserved.
doi:10.1016/j.foodqual.2008.10.003
*
Corresponding author. Present address: Valio Ltd, R&D, P.O. Box 30, FI-00039
Valio, Finland. Tel.: +358 10 381 3047; fax: +358 10 381 3372.
E-mail address:
(S. Mustonen).
Food Quality and Preference 20 (2009) 230–240
Contents lists available at
Food Quality and Preference
j o u r n a l h o m e p a g e : w w w . e l s e v i e r . c o m / l o c a t e / f o o d q u a l

). This kind of a change does not promote the adop-
tion of new food experiences (
Carruth et al., 1998; Neumark-
Sztainer, Hannan, Story, Croll, & Perry, 2003
). Instead, it leads chil-
dren and adolescents to repeatedly choose the same and familiar
foods, causing monotonous and unhealthy diet in the long run
(
). Because of this blunting trend, the
future generation may be unable to demand high quality or to have
the courage to try new, exotic foods. Therefore, it is important to
invent and develop new ways to encourage children to try different
foods and pay attention to the quality of foods. This may eventually
have beneficial effects on children’s diets in terms of greater vari-
ety and better quality of food.
In France,
developed and described
‘‘taste lessons” (Classes du goût). This education program for school
children has been used in several European countries, e.g. in Swe-
den (
). The program aims to teach young
children to become well-informed consumers with awareness of
the quality and differentiation of foods through their smells, tex-
tures and tastes. Children’s awareness is developed by awakening
their interest and curiosity towards foods by exercising their
senses. Although widely used, the evidence of the impact of the
education program is still rather scarce. To date, no systematic re-
search on the effects have been available in scientific literature.
has reported that, as a result of the program, chil-
dren’s interest in food quality increased and their ability to de-
scribe sensory properties of food improved compared to the
control group, but no measurements were conducted at the base-
line level. Thus, development in sensory awareness over time could
not be proven.
Sune, Lacroix, and de Kermanec (2002)
compared
children who attended the Classes du goût program with their
non-trained peers and adults in sensory characterization of choco-
late and found that despite the education, children described the
chocolate in their own way and adults in their own way.
In Finland, we started a 2-year follow-up study with school chil-
dren, representing two age groups (7–8 and 10–11 years), to track
the development of chemosensory awareness and food-related
perceptions influenced by the program. One-half of children re-
ceived up to two waves of taste lessons (first, a Finnish application
of Classes du goût program and second, activating lessons on main
food categories) and another half performing baseline and follow-
up measurements only. Two age groups were included to the study
to examine whether the possible effect of education would depend
on the age at which the lessons are attended. The education group
was further divided into two subgroups, as the second wave of
education was given only to 2/3 of the education group, to examine
whether the children would benefit from a prolonged education.
The effects of the sensory education were studied with (1) sensory
tests conducted in the laboratory and (2) background question-
naires on subjects’ food behavior that were sent to parents three
times during the follow-up period. This paper describes the results
of sensory measurements at the baseline and in the four follow-up
measurements, all conducted in the laboratory during two years of
time. The first education wave was expected to increase sensory
awareness, improve food description skills and increase the will-
ingness to taste unfamiliar foods. Due to the nature of the lessons
in the second education wave, it was expected to maintain the
interest in chemosensory perception achieved during the first
wave, and increase the interest in trying unfamiliar foods.
2. Materials and methods
2.1. Development and selection of the sensory instruments
A preliminary study was carried out during the autumn 2004 to
develop and select the sensory instruments for the proper study.
Three classes of third graders and three classes of fourth graders
participated in the preliminary study, testing different sensory
measurements (odor naming, taste identification, descriptive tasks,
etc). The tests were conducted twice, and between the sessions one
group of the children (N = 35) received a lesson on the sense of
taste, another group (N = 34) received a lesson on the sense of
smell and the third group (N = 40) received no lesson. Children par-
ticipating in the pilot taste lesson showed slight improvement in
their taste identification. No improvement was seen in the odor
naming abilities of the group receiving the olfactory lesson, but it
was expected that after a profound sensory education on tastes
and odors the effects would emerge. The descriptive abilities were
expected to improve due to the sensory education that included
descriptive tasks, although after the pilot lessons the only effect
was a decrease in the number of preference-related descriptors.
The willingness to taste unfamiliar foods was expected to increase
due to the tasting experiences and the overall increase of knowl-
edge on different foods during the sensory education. The tests that
seemed to have potential in showing education effects in the pre-
liminary study were chosen to the proper study (described in detail
below).
2.2. Subjects
In the proper study, 244 students (aged 7–11 years) from two
primary schools in Helsinki were recruited. The schools chosen
were approximately similar in size and their students had more
or less the same level of socio-economical background (between
middle and high). Of the students, 175 participated in all follow-
up measurements, and are therefore included in the data analyses.
In the beginning of the study, they were students at the second (7–
8 years) and fifth (10–11 years) grades in Viikki Teacher Education
School at Helsinki University (education group, n = 96) and Puistola
Primary School (control group, n = 79). The students from the first-
mentioned school were chosen to be the education group for prac-
tical reasons, as sensory lessons fitted into their curriculum. The
profiles of the subjects (grades and gender distribution) are shown
in
. The drop-outs in the last follow-up measurement were
due to some of the students in the older group moving on to an
upper level of comprehensive school, and thus to a different sys-
tem or even to a new school.
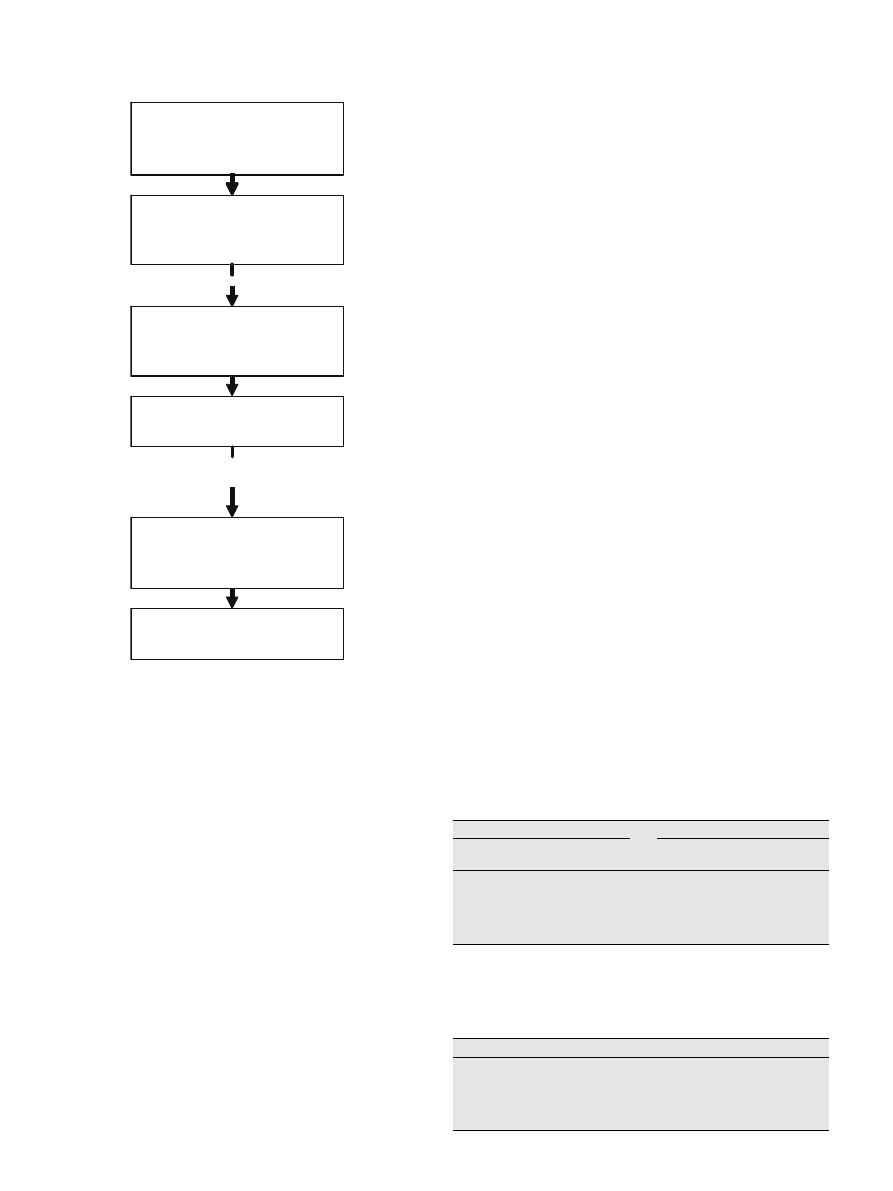
2.3. Overview of the proper study
At baseline (January 2005), both groups performed sensory
tests, and subsequently, one group (education group) participated
in sensory education. The tests were conducted four times during
the two years’ period: after the first education wave (May 2005),
before and after the second education wave (January and May
2006, respectively) and finally in January–February 2007 (
).
Additionally, a questionnaire was sent to the parents three times
during the follow-up period (results reported elsewhere).
The study protocol followed the ethical principles of sensory
testing in our laboratory, approved by the ethical committee of
Table 1
The study population. In the beginning of the study the children were 8-year-old
(second graders) and 11-year-old (fifth graders).
Group and grade
N boys/girls
N (2005–2006) baseline
and 1st–3rd follow-ups
N (2007)
4th follow-up
Education
2nd–4
th
19/22
41
38
5th–7th
30/25
55
38
Control
2nd–4
th
12/22
34
31
5th–7th
26/19
45
30
Total
87/88
175
137
S. Mustonen et al. / Food Quality and Preference 20 (2009) 230–240
231
the Faculty of Agriculture and Forestry. An additional approval was
applied as the subjects were minors (under 18 years of age). The
parents signed an informed consent before the study began. The
subjects themselves gave a verbal assent to participate.
2.4. Laboratory sessions
The measurements (lasting approximately 1.5 h) were con-
ducted in the sensory laboratory of the University of Helsinki (ex-
cept for the last session for the older group, which was performed
in the school auditoria). All measurements were made during the
school day (9 a.m. to 3 p.m.). One class at a time (N = 17–28) came
to the laboratory with a teacher and performed the tasks in a given
order in ten sensory booths or at a round table with screens pre-
venting visual interaction between the ten seats. During the ses-
sion, the places were switched for each task so that each subject
was placed in both the booths and at the round table. In each ses-
sion, the subjects performed six tasks in the following order: (1)
pleasantness ratings, intensity ratings, and free naming of five odor
stimuli; (2) taste identification of six aqueous solutions (sweet,
salty, bitter, sour, umami, and water); (3) descriptive characteriza-
tion of two breads; (4) ratings of the extent to which subjects paid
attention to sensory properties of food; (5) willingness to taste
unfamiliar (five in the baseline and first follow-up, seven in the
second-final follow-ups) and familiar (seven) foods (the procedure
adapted from that by
), and (6) aided odor naming (five
odors, list of 10 verbal labels provided). Before every task, the sub-
jects were familiarized with the evaluation forms and scales. The
tasks are described in detail below. After the sessions, the subjects
were rewarded with small food gifts (lollipops, xylitol chewing
gums etc.), and in the end of the final session, they were invited
to make and consume their favorite ice cream portions using a
selection of ice creams, jam, sauce, nonpareils, wafer, and
decorations.
2.4.1. Sensory instruments
2.4.1.1. Free odor naming and ratings for pleasantness and intensity
(Task 1). The test included five aqueous aroma solutions: straw-
berry, carrot, vinegar, cardamom, and vanilla (
). The samples
(10 ml each) were presented in small brown glass vials coded with
five letters (Z, D, F, X, G) and the presentation order was random-
ized in five different ways for practical reasons. The same five or-
ders were used for each follow-up, without controlling the order
individually for each child. The subjects also rated the pleasantness
and intensity of each sample. The pleasantness was rated using se-
ven categories (1 = bad and 7 = good), extreme ends supported by
facial symbols, and the intensity was rated using seven categories
(1 = weak, 7 = strong). The purpose of these ratings was to maxi-
mize the attention paid to each sample. After ratings, the subjects
were asked to name each odor. If uncertain, they were asked to
guess.
shows the mean ratings of pleasantness and intensity
given to the aroma solutions at the baseline measurement.
2.4.1.2. Taste identification (Task 2). The test included aqueous solu-
tions of five taste stimuli (sweet, salty, sour, bitter, umami) and
water (
). The solutions (approximately 15 ml each) were
presented in white plastic cups coded from 1 to 6. The presentation
order was randomized in six different ways. The labels of the tastes
were listed, and the subjects ticked the box they thought was the
correct answer. Umami was described as ‘‘umami (meaty)”. The
subjects compared the solution to plain tap water when they tried
to identify the taste. In case they did not identify the taste, they
were asked to guess.
2.4.1.3. Descriptive characterization of two breads (Task 3). The sub-
jects were presented with two bread samples in each session. All
breads were commercial Finnish breads (brand names in parenthe-
ses below) and represented different sensory properties. At the
baseline they were wheat toast (Reilu, Fazer Bakeries) and a whole-
January 2005
BASELINE MEASUREMENT
Sensory instruments
Questionnaire to parents
October-December 2004
PILOT TESTING
RECRUITMENT
Informed consent (parents)
1
st
WAVE OF SENSORY EDUCATION
April-May 2005
1
st
FOLLOW-UP MEASUREMENT
Sensory instruments
Questionnaire to parents
January 2006
2
nd
FOLLOW-UP MEASUREMENT
Sensory instruments
2
nd
WAVE OF SENSORY EDUCATION
(for 2/3 of the education group)
May 2006
3
rd
FOLLOW-UP MEASUREMENT
Sensory instruments
Questionnaire to parents
January 2007
4
th
FOLLOW-UP MEASUREMENT
Sensory instruments
Fig. 1. Flow chart of the experimental procedure of the study.
Table 2
Aqueous aroma solutions (dissolved in tap water) used in the free and aided odor
naming.
Free odor naming (Task 1)
Aided odor naming (Task 6)
Aroma/Ingredient
Concentration
(%, w/v)
Aroma/Ingredient
Concentration
(%, w/v)
Vanilla
1
0.4
Pineapple
2
0.3
Cardamom
1
0.1
Cocoa
1
0.4
Strawberry aroma
1
0.15
Lemon
1
0.02
Carrot
2
(powder)
0.5
Onion
2
(powder)
0.4
Vinegar
3
33.3
Peppermint
1
0.15
Manufacturers: (1) Quest International, The Netherlands; (2) Givaudan, Switzer-
land; (3) Rajamäki, Finland.
Table 3
Mean ratings (SD) of pleasantness and intensity of the aroma solutions in the free
odor naming at the baseline (Task 1).
Aroma/ingredient
Pleasantness (scale 1–7)
Intensity (scale 1–7)
Vanilla
5.3 (1.8)
4.0 (1.6)
Cardamom
4.8 (1.7)
4.3 (1.6)
Strawberry
4.5 (1.9)
4.6 (1.5)
Carrot
3.3 (1.8)
4.6 (1.7)
Vinegar
2.1 (1.7)
5.5 (1.7)
232
S. Mustonen et al. / Food Quality and Preference 20 (2009) 230–240

meal rye bread (Real, Fazer Bakeries Oululainen); in the first fol-
low-up regular rye bread (Ruispuikula, Fazer Bakeries) and a sweet
loaf (Setsuuri, Fazer Bakeries); in the second follow-up dark loaf
(Maalahden limppu, Malax Limpan Ltd.) and grainy wheat toast
(Jyväinen IsoPaahto, Vaasan and Vaasan Oy); in the third follow-
up two premium breads, garlicky cheese ciabatta (Artesaani, Prim-
ula Oy) and grainy rye bread (Artesaani, Primula Oy); and in the
last follow-up measurement the subjects described the same
breads that were presented in the baseline measurement. The sub-
jects described separately the appearance, smell, taste and texture/
mouthfeel of both samples. They were told to avoid words relating
to preference. They rinsed their mouths with tap water between
the samples.
2.4.1.4. Ratings of the extent to which subjects paid attention to
sensory properties of food (Task 4). In this task, the subjects rated
the extent to which they paid attention to sensory properties
(appearance, odor, taste, texture) of food (scale: 1 = not at all,
2 = slightly, 3 = quite much, 4 = very much).
2.4.1.5. Willingness to taste unfamiliar vs. familiar foods (Task 5). The
subjects were presented with 12 (baseline and first follow-up) or
14 (other measurements) pictures of familiar (seven) and unfamil-
iar foods (five/seven) in color. The task was to identify which food
was in the picture. The subjects then got another booklet in which
the same foods were presented in black and white, with the name
of the food in the upper edge of each picture. They were asked to
reply yes/no to the following questions: (1) ‘‘Have you ever seen
this food before?” (2) ‘‘Have you ever tasted this food before?”
and (3) ‘‘Would you like to taste this food?” The first two questions
were used to check whether the foods actually were unfamiliar for
the children. Although the results were not analyzed individually,
the distributions strongly suggested that the foods expected to
be unfamiliar to the children actually were unfamiliar.
The familiar foods (rye bread, ice cream, blueberry, meat balls,
Edam cheese, carrot, chocolate cookie) were the same for each fol-
low-up point, but the unfamiliar foods were changed. At the base-
line and at the first follow-up, the unfamiliar foods were goat
cheese, lychee, sun-dried tomatoes, Naan bread, and frog legs. At
the second and third follow-up they were: squid, sheep milk
cheese, carambola, artichoke, couscous, kidney pie, and shiitake.
At the last follow-up they were: oyster, Camembert, pitahaya, avo-
cado, sweet potato, reindeer tongue aspic, and endive. Even if the
two successive follow-up measurements had the same pictures
of the unfamiliar foods, the familiarity status of each food did
not change as we instructed the children to answer ‘‘yes” only if
they had seen the food for real, not in a picture. The food pictures
were kept similar for two successive sessions to make the compar-
ison reliable. If the foods had been changed every time, the unfa-
miliarity may have changed because of the foods chosen, and not
for the reasons we were measuring. Yet, we had to change some
of the foods a few times during the study, to avoid familiarity
and boredom with the same foods.
The task was not performed by the older group in the last fol-
low-up session, as that session had a limited space and time frame
that required adjustments.
2.4.1.6. Aided odor naming (Task 6). The test included five aqueous
aroma solutions: cocoa, pineapple, lemon, onion, and peppermint
(
). The aroma samples (10 ml each) were presented in small
brown glass vials coded with five letters (H, J, N, L, R) and the
presentation order was randomized in five different ways. The sub-
jects were asked to connect the odor (letter codes in the evaluation
form) to the correct label. They could choose from 10 labels, of
which five were correct. The labels (correct ones marked with
bold) were: black pepper, banana, cocoa, pineapple, onion, cinna-
mon, apple, orange, lemon, peppermint.
2.5. Sensory education program
The first wave of sensory education was held between the base-
line and the first follow-up measurement in February–April 2005
(
). It comprised of nine sensory lessons and a restaurant visit.
The lessons followed the principles of the program ‘‘Classes du
goût” (
), but modifications were made to
the contents and reference materials to suit better to the Finnish
environment and the current scientific information on the issues
dealt with. Each lesson comprised of a short lecture (adapted to
be suitable for children) on the topic, discussion and practical exer-
cises. The lessons (approximately 1.5 h each) took place at school.
Two experimenters responsible for the measurements and an
assistant gave the lessons each week. The contents of the lessons
are described in
The second wave of sensory education took place in February–
April 2006 (
), between the second and third follow-up mea-
surement, and consisted of five lessons related to a specific food
category at a time (dairy, cereal or meat). Only two school classes
out of three from the education group participated in the second
education wave. The second wave was performed in collaboration
with Finnish food industry. The personnel of the collaborating food
companies, all with an academic degree in food science, gave the
lessons. Otherwise the practices were similar to the first wave. In
spite of the effort, no fruit and vegetable supplier nor a fish sup-
plier participated in the second wave of education. Basically the
lessons were similar to the first wave, with a short introduction
to the topic and practical exercises. The contents of the lessons
are described in
. In both education waves, the practical
exercises and activation of senses played a major role.
2.6. Data analysis
The ratings of the two subgroups (one wave or two waves) of
the education group did not differ, and thus, the education group
was pooled to include all children who received education. Re-
peated measures of ANOVA (between subjects: treatment educa-
tion/control and age group; within-subject: session) were used to
examine the effect of age group and sensory education on the per-
formance in each of the sensory tasks. In the bread description
task, only the baseline and final follow-up measurement were in-
cluded in the analysis, as the results in between were not compa-
rable because different breads were used every time. The score of
the description task was a sum of descriptive words for appear-
ance, smell, taste and texture/mouthfeel (hedonic terms excluded).
The effect of education was expected to appear as an interaction of
education session. Significant interactions between different ses-
sions (within-subject contrasts) are reported, when appropriate.
The two age groups were analyzed also separately when a trend
for age group difference was observed (main effect of age group
or interaction of education age group session).
Table 4
Aqueous taste solutions (dissolved in tap water) used in the taste identification test
(Task 2).
Taste identification
Taste compound
Concentration (%, w/v)
Sucrose (sweet)
1
2
NaCl (salty)
2
0.2
Citric acid (sour)
2
0.04
Caffeine (bitter)
2
0.04
Monosodium glutamate (umami)
3
0.3
Manufacturers: (1) Dan Sukker, Finland; (2) Fluka Chemicals, Germany; (3) Merck,
Germany
S. Mustonen et al. / Food Quality and Preference 20 (2009) 230–240
233

In the free odor naming task, the subjects got one score for each
correctly named odor. If they could name a source of an odor clo-
sely associated with the exact odor they got a score 0.5. Thus, the
total score of the odor naming task (0–5) for each subject was the
sum of correctly named and closely associated odors. The accepted
associations are shown in
. The score of the aided odor nam-
ing task was a sum of correctly named odors, thus it could vary
from zero to five (no half scores given).
The score for willingness ratio for trying unfamiliar vs. familiar
foods was calculated by dividing the number of affirmative an-
swers given to the question ‘‘Are you willing to try this food?”
for the unfamiliar foods by the corresponding number for the
familiar foods. Higher scores reflected greater willingness to taste
unfamiliar foods. To correct the uneven ratio of unfamiliar foods
and familiar foods in the baseline and 1st follow-up, the sum of
unfamiliar foods tasted in those two measurements were multi-
plied by 7/5, thus 1.4. Scores lower than 1 reflected a situation in
which the child was willing to taste a greater number of the famil-
iar foods than the unfamiliar foods, and scores higher than 1 the
opposite situation. If a child answered ‘‘No” to all familiar foods
the denominator is equal to 0, thus the ratio is undefined (infinite).
However, none of the children in the present study answered ‘‘No”
to all familiar foods. A score equal to1 meant that a child was
equally willing to taste the unfamiliar and familiar foods. For five
unfamiliar and seven familiar foods, the range of scores was 0–
2.3 and for seven unfamiliar and seven familiar foods, 0–2, respec-
tively. Subtractions between positive answers to the question
‘‘Have you ever seen this food” for unfamiliar foods in the first fol-
low-up and at the baseline (five foods), and between third and sec-
ond follow-up (seven foods) were calculated for each child and
subsequently, the subtractions of the control group and education
group were compared using univariate ANOVA.
To check whether an improvement in one task was related to an
improvement in another task a ‘‘score evolution difference” was cal-
culated for each task and each subject separately. The individual
improvement in one task leading to improvement in other task were
reported for the three chemosensory tests, i.e. free odor naming,
aided odor naming, and taste identification tasks for the education
group. The calculations were done manually. The score evolution
differences of the tasks were cross-tabulated and Pearson’s correla-
tions between the score evolution differences of the tasks were cal-
culated, but no significant results, even trends were found and
therefore these results have not been included in the result section.
3. Results
3.1. The effect of sensory education on performance
in the two age groups
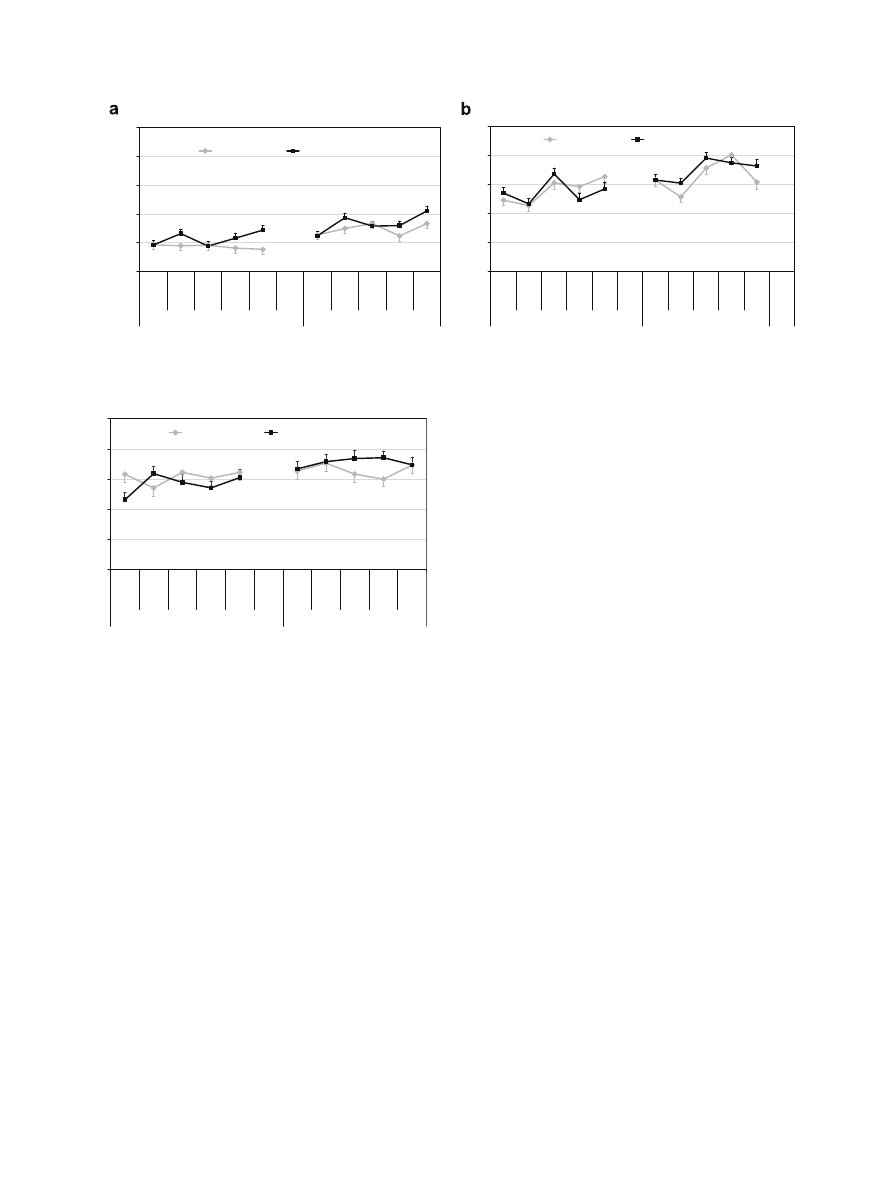
3.1.1. Free (Task 1) and aided (Task 6) odor naming
In the free odor naming task, children were able to correctly
name an average of one odor out of five only. The median and
mode for both age groups were 1 and 1. However, in some cases
they gave a name that was closely associated to the exact odor.
The sensory education improved the free odor naming of both
the younger age group, 2nd–4th graders [interaction education
session F(4, 62) = 3.90, p = 0.007] and the older group, 5th–7th
graders
[interaction
education
session
F(4,
60) = 2.80,
p = 0.034] with the exception of the second follow-up measure-
ment, in which the performance got poorer compared with the ear-
lier measurement. The free odor naming of the control group
stayed approximately at the same level during the whole study
period in both age groups (
a).
In the aided odor naming, approximately three odors out of five
were identified. The median and mode for the young group were 3
and 3. For the older group, the corresponding scores were 4 and 3.
No education effect was found. Instead, in the younger age group,
the control group performed better than the education group in the
last two follow-up measurements [interaction of education ses-
sion between 2nd and 3rd follow-up F(1,65) = 4.66, p = 0.035]. In
the older age group, the performance of the control group impaired
after the third follow-up, while the number of correct responses of
the education group stayed at the baseline level after the 1st edu-
cation wave, but improved in the second follow-up measurement
[interaction of education session between 2nd and 3rd follow-
up F(1, 66)=3.93, p = 0.052; between 3rd and 4th follow-up
F(1,66)=5.31, p = 0.024] (
b).
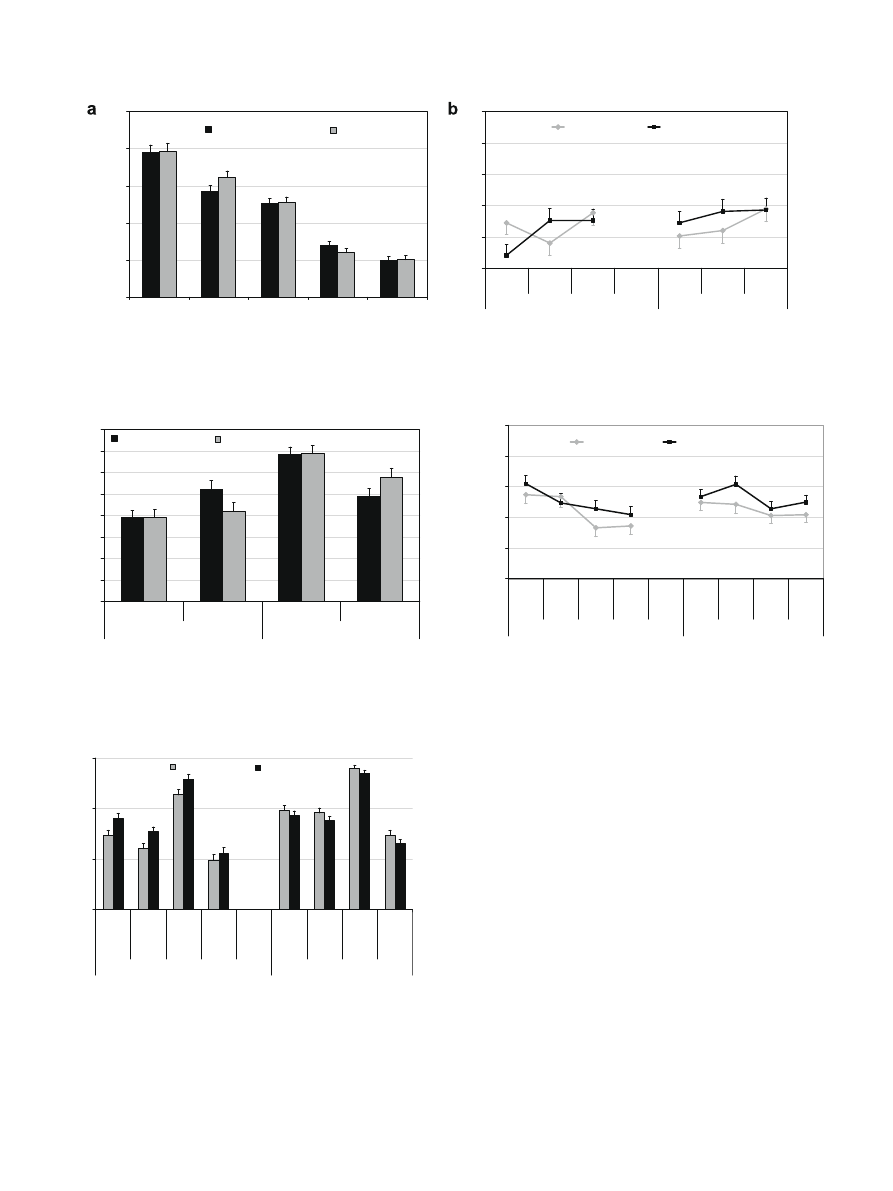
3.1.2. Taste identification (Task 2)
shows the mean performance of the children in the taste
identification task [interaction of education x session F(4,
260) = 2.72, p = 0.030]. At first, the performance of the younger
age group was improved: the education group identified more
tastes after the first education period than at the baseline, while
no difference was seen in the performance of the control group
[interaction of education x session between baseline and 1st fol-
low-up F(1, 65) = 11.76, p = 0.001]. In the following sessions, no
differences between the groups in the taste identification task
were found. The education did not have a significant effect on taste
identification performance of the older age group (p = 0.322).
The percentage of correctly identified tastes (both age groups
combined) in the baseline measurement are shown in
a. In
all sessions, the easiest taste to identify was sweet (of all sub-
jects, 78% identified), followed by salty (60% correct identifica-
tions) and sour (51% correct identifications). Bitter and umami
proved to be the most difficult, with identification percentages
24% and 20%, respectively.
b shows that sensory education
improved the identification of the most difficult taste, umami,
in the younger age group [interaction of education session
F(2, 131) = 3.07, p = 0.05] whose identification rate at the baseline
was 8.3% and in the final measurement 30.5%. For the older chil-
dren in the education group, the corresponding figures were
29.1% and 37.3%, respectively. The change in the number of cor-
rect identifications was not significant for the older group. For
bitter taste, the increase in identification percentage was not sig-
nificant (p = 0.59).
3.1.3. Descriptive characterization of two breads (Task 3)
The number of descriptive words (preference-related words ex-
cluded) for breads increased in the younger children of the educa-
tion group during the study period, while for the control group the
number of words was approximately the same for the whole study
period [interaction of education session between baseline and
final follow-up F(1, 67) = 6.67, p = 0.012] (
In the older children, both the education group and the control
group, the number of descriptive words decreased from baseline to
the final follow-up measurement [main effect of session F(1, 63) =
22.07, p < 0.001]. Overall, the number for descriptive words for
Table 5
Free naming of odors (Task 1): descriptions receiving 0.5 score.
Odor
Close association
Strawberry
Candy, cough medicine
, chewing gum, raspberry, lemonade, cherry,
fruit, juice, marmalade
Carrot
Potato, root vegetable, earth, beetroot, rutabaga, pea, vegetable,
zucchini
Vinegar
Wine, salad dressing, alcohol, mustard, pickled cucumber
Cardamom
Bun (pulla), mulled wine (glögi), cinnamon, spice, gingerbread,
doughnut, ginger
Vanilla
Chocolate, caramel, toffee, honey, apple soda
, marshmallow, candy,
ice cream, pastry, syrup, cake
a
In Finland, children’s cough medicine is often strawberry-flavored.
b
Finnish apple soda is flavored with vanilla.
234
S. Mustonen et al. / Food Quality and Preference 20 (2009) 230–240
breads was higher in the older children than in the younger chil-
dren [main effect of age group F(1, 130) = 48.77, p < 0.001].
3.1.4. Ratings of the extent to which subjects paid attention to sensory
properties of food (Task 4)
shows that children rated themselves to pay the most
attention to taste and least attention to texture of food in both
age groups. The only evolution due to sensory education during
the study period was seen as a slight trend in the younger group
to pay more attention to texture of food compared with the control
group [interaction of education session F(4, 228) = 1.98,
p = 0.086]. In the younger children, the education group rated
themselves overall to pay more attention to appearance [main ef-
fect of education F(1, 58) = 6.02, p = 0.017], odor [F = 6.15,
p = 0.016], and taste [F = 4.81, p = 0.032] (means over all sessions),
although no difference was seen at the baseline [ main effect of
education F(4, 69) = 0.64, p = 0.633]. In the older age group, no dif-
ference between the education group and the control group was
found in any of the ratings of attention (
).
3.1.5. Willingness to try unfamiliar vs. familiar foods (Task 5)
The willingness to taste unfamiliar foods did not change signif-
icantly in either the young group [interaction of education ses-
sion F(3, 67) = 0.87, p = 0.46] or in the old group [interaction of
education session F(3, 87) = 0.70, p = 0.55] (
).
The number of positive answers to the question ‘‘Have you ever
seen this food before” did not change significantly between the
sessions. For the five unfamiliar foods at the baseline and in the
1st follow-up, the mean change in the education group was 0.79.
The change was mostly due to one food, lychee, which was present
in one of the lessons in the first education wave. For the control
group the corresponding change was 0.56 (effect of education,
p = 0.24). Mean change in the number of positive answers between
2nd and 3rd follow-up was 0.14 for the education group and 0.28
for the control group (effect of education, p = 0.72).
3.1.6. Evolution of performance in the three tests measuring
chemosensory awareness
Of the education group, only 26 children in both age groups im-
proved in their performance in the free odor naming and 25 chil-
dren in the taste identification during the study. In the aided
odor naming test, 11 children in the younger group and 12 children
in the older group improved their performance during the study. In
each group, half of them were girls and half of them were boys.
In the education group, four children of the young group im-
proved in all three tests (free and aided odor naming and taste
identification). The corresponding figure for the older group was
two. Improvement in both the free odor naming and the aided odor
naming tasks, but not in taste identification was seen in three chil-
dren of the young group and six children of the old group. Four
children of the young group and one of the old group improved
their performance in both aided odor naming and in taste identifi-
cation. Finally, improvement in free odor naming and in taste iden-
tification was seen in ten children of the young group and 11
children of the old group.
4. Discussion
The free naming of odors proved to be a difficult task for the
school children. That is not surprising, as according to
, the task is very difficult also for adults. In their
study, adults identified approximately two out of the six odors pre-
sented, if no cues were given. In the cued situation, the correspond-
ing figure was five odors out of six (
). In the
present study, the identification score was at the baseline approx-
imately 1 (one odor out of five identified), thus slightly lower than
for adults in de Wijk and Cain study.
have concluded that children possess equal olfactory sensi-
tivity compared with adults, but their odor identification is limited
due to limitations in linguistic capabilities and familiarity of odor-
ants. Although the free odor naming task in the present study was
difficult, improvement in the performance was observed in the
education group after the sensory education period. The improve-
0
1
2
3
4
5
Baseline
-
1. follow
up
-
2. follow
up
-
3. follow
up
-
4. follow
up
Baseline
-
1. follow
up
-
2. follow
up
-
3. follow
up
-
4. follow
up
2.-4. graders
5.-7. graders
Correctly named odors
Control (N=79)
Education (N=96)
0
1
2
3
4
5
Baseline
-
1. follow
up
-
2. follow
up
-
3. follow
up
-
4. follow
up
Baseline
-
1. follow
up
-
2. follow
up
-
3. follow
up
-
4. follow
up
2.-4. graders
5.-7. graders
Correctly identified odors
Control (N=79)
Education (N=96)
Fig. 2. (a) Free naming of odors, (b) aided naming of odors: mean number (+SEM) of correctly named (or in free naming task also closely associated) odors for the education
group and the control group (2nd–4th and 5th–7th graders separately) in the baseline and in the four follow-up measurements (maximum score 5).
0
1
2
3
4
5
Baseline
1. follow-
up
2. follow-
up
3. follow-
up
4. follow-
up
Baseline
1. follow-
up
2. follow-
up
3. follow-
up
4. follow-
up
2.-4. graders
5.-7. graders
Correctly identified tastes
Control (N=79)
Education (N=96)
Fig. 3. Taste identification: Mean number (+SEM) of correct responses of the
education group and the control group (2nd–4th and 5th–7th graders separately) in
the baseline and in the four follow-up measurements (maximum score 5).
S. Mustonen et al. / Food Quality and Preference 20 (2009) 230–240
235
ment was most likely due to familiarization with odors during the
education and to the improved ability to recall odor names.
eng, Zuckerman, Cardinal, and Kaciroti (2005)
demonstrated an
association between language development and flavor recall in
preschool-aged children: accurate and consistent labeling of flavor
improved recall for a variety of stimuli. In the present study, the
education included labeling of different types of stimuli which pos-
sibly led to improved ability to name odors. Yet,
Lulejian, Schiet, and See (1998)
showed that general training of
odor identification does not improve identification of odors that
are not in the training set. In the present study, the same odorants
were used for each session, thus the possible improvement in the
ability to name odors not presented before remains open.
Aided odor naming turned out to be a relatively easy task and
no benefit of sensory education was observed. Although the scores
did not reach maximum at the baseline, the effect of sensory
education was assumingly not strong enough to improve an al-
ready good performance. Furthermore, lemon odor seemed to be
more difficult to identify than the others (data not shown), sug-
gesting that the lemon aroma used was not a well representative
of the odor.
Taste identification of the younger children improved after the
first wave of education period and remained more or less at the
achieved level throughout the study period. In the older group,
no clear improvement was observed. The most difficult taste to
identify was umami: This is in line with our earlier findings (
lemans, Mustonen, Esselström, & Tuorila, 2006
), measuring taste
identification of a partially separate group of 8-, 9-, 10- and 11-
year-old children (n = 348). Although approximately one-third of
0
20
40
60
80
100
Sweet
Salty
Sour
Bitter
Umami
Correct identifications (%)
Education (N=9
6)
Control (N=79)
0
20
40
60
80
100
Baseline
1. follow-up
Final
follow-up
Baseline
1. follow-up
Final
follow-up
2.-4. graders
5.-7. graders
Correct identifications (%)
Control (N=79)
Education (N=96)
Fig. 4. (a) Percentage of correctly identified tastes by subjects in the control group and education group in the baseline measurement, age groups pooled, (b) percentage of
correct identifications of umami taste for the education group and the control group (2nd–4th and 5th–7th graders separately) in the baseline, 1st and final follow-up
measurement. (Means and SEM).
0
2
4
6
8
10
12
14
16
Baseline
Final follow-up
Baseline
Final follow-up
2.-4. graders
5.-7. graders
Mean number of descriptive
words
Education (N=96)
Control (N=79)
Fig. 5. Mean number (+SEM) of sensory descriptions per session (preference-
related words excluded) of the bread samples by the education group and the
control group (2nd–4th and 5th–7th graders separately) in the baseline and in the
final follow-up measurement.
1
2
3
4
Appearance
Odor
Taste
Texture
Appearance
Odor
Taste
Texture
2.-4. graders
5.-7. graders
Attention to sensory properties
Control (N=79)
Education (N=96)
Fig. 6. Mean ratings (+SEM) of attention paid to sensory properties of food by the
education group and the control group (2nd–4th and 5th–7th graders separately),
over all follow-up points.
0
1
B
as
eline
1. follow-
u
p
2. follow-
u
p
3. follow-
u
p
B
as
eline
1. follow-
u
p
2. follow-
u
p
3. follow-
u
p
2.-3. graders
5.-6. graders
Willingne
ss
ratio unfamiliar
/familiar food
s
Control (N=79)
Education (N=96)
0.8
0.6
0.4
0.2
Fig. 7. The ratio of willingness to try unfamiliar vs. familiar foods by the education
group and the control group (2nd–3rd and 5th–6th graders separately) in the
baseline and in the three follow-up measurements (the older age group did not
perform this task in the final follow-up measurement, and therefore the final
follow-up point is excluded). See Data analysis for the calculation of the ratio.
236
S. Mustonen et al. / Food Quality and Preference 20 (2009) 230–240

the respondents of the present study were included in the data by
Oerlemans et al., some comparison can still be made. In the study
by Oerlemans et al., 82, 66, 52, 27 and 23% of children identified
sweet, salty, sour, bitter, and umami tastes, and age groups per-
formed significantly differently only in the identification of salty
taste (8-year-old did not reach the level of the other age groups).
The overall improvement of the taste identification performance
of the younger education group was mostly due to improved iden-
tification of umami. Bitter was also a difficult taste to identify at
the baseline, but the identification performance of it did not im-
prove during the study. One reason for the improvement of the
identification of umami, but not of bitter might be that umami
was overall a new term for almost all of the children and the curi-
osity towards this new taste may thus have improved the identifi-
cation rate.
In the sensory characterization of breads, older children used a
greater number of words than did the younger. This is in line
with the consistent finding in product evaluation, as younger chil-
dren (3–7 years old) use fewer attributes or dimensions in com-
paring products and forming preferences than older children
(11–16 years old) (
). The two comparable sessions
using the same breads – the first and the last – showed that in
the younger education group, the number of descriptive words in-
creased significantly. Earlier studies have shown that verbaliza-
tion of sensory experiences is supported by taste lessons in 12-
year-old school children (
Jonsson, Ekström, & Gustafsson, 2005
In contrast,
found that despite attending the
taste lessons (Classes du goût program), children described choco-
late in their own way that was different from that of adults. In
the present study, the number of words of the older children of
the education group was, unexpectedly, at its lowest in the last
session and for the control group the number was smaller than
at the baseline. This may partly be due to the incipient puberty:
in the final follow-up measurement, the students, especially in
the education group, were restless while performing the descrip-
tion task.
Children reported to pay attention to taste of food while eating,
rather than to other sensory modalities. Children at ages 7–11 are
categorized to be at the analytical stage of socialization as consum-
ers (
), thus they are able to orientate features requir-
ing special attention (e.g. taste) of a product rather than
immediately observable perceptual features (e.g. appearance).
The latter is typical for perceptual stage (ages 3–7 years). Taste re-
mained as the most important attribute for all subjects. The overall
ratings show that the younger group paid more attention to
appearance, odor and taste of food than the control group during
the study, although the groups did not differ in their ratings at
the baseline. Hence, education in general seemed to activate the
younger children to pay more attention to these attributes in food.
The ratio of willingness to taste unfamiliar to familiar foods was
approximately 0.6 at the baseline for both age groups, which was
slightly higher than the corresponding figure of Canadian children
(0.5) in
. The results are not fully comparable,
as in Pliner’s study, children were supposed to actually taste the
foods that they reported to be willing to taste, while in the present
study the willingness to taste was rated based on photographs of
foods. In the present study, the willingness to taste unfamiliar
foods did not change significantly, although the mean values
tended to decrease. The result suggests that sensory education
does not affect the willingness to taste unfamiliar foods. Yet,
erdy, Chesnel, Schlich, Köster, and Lange (2008)
studied children
aged 8–10 years and found that declarative food neophobia of
the education group decreased significantly and the willingness
to taste novel food seemed to increase compared to the control
group. However, the effect was only temporary, disappearing after
10 months of the education period.
Looking only at the results of the baseline and the first follow-
up measurement, it seems that willingness to taste unfamiliar
foods tended to increase in the older age group after the first edu-
cation wave, while the effect was opposite for the younger group.
This age difference was also observed by
who found that the exposure to novel foods decreased will-
ingness to taste novel foods in 7–9-year-old children, while it in-
creased willingness to taste novel foods in 10–12-year-old
children. An age effect may thus exist, and the increase in willing-
ness to taste unfamiliar foods may result from a certain develop-
mental process. However, the procedure may also have played a
role: the number of follow-up measurements was rather high
and may have caused a learning effect in the control group. The
sensory experiences provided in the follow-up measurements, in-
creased children’s awareness of food odors and flavors, and thus
may also have increased their interest in new food experiences.
The result may have been different, if tasting of the foods rather
than photographs had been included. In
original
willingness ratio as neophobia measurement, children were sup-
posed to actually taste the foods that they reported to be willing
to taste, increasing the validity of the measurement.
The education effect was not quite stable. This is in line with re-
sults by
, who found the education-induced in-
crease of willingness to taste novel foods in children disappearing
ten months after the education period. In the present study, in the
tests measuring chemosensory awareness (odor naming and taste
identification), the effect was at its strongest right after the educa-
tion period and the performance did not improve, but even im-
paired later. In the free odor naming task, the performance got
worse in the second follow-up measurement, while the perfor-
mance was at its highest in the final measurement. A similar trend
could be observed for the taste identification task in the younger
age group, but not for other tasks for either age group. The second
education wave did not affect the performance in the laboratory
tasks, perhaps because the education concentrated on fairly general
matters rather than on specific chemosensory performance or skills.
In a deeper exploration of the reasons for the rather weak effect
of education we observed that the sensory education affected sig-
nificantly only a limited number of the children in the tests mea-
suring chemosensory awareness. The groups with a greater
evolution in their performance were equal in their gender distribu-
tion and heterogeneous in terms of the class they belonged. Thus,
no clear reason can be found for that these children evolved in
their performance more than the others. Overall, the education
had hardly any effects on the performance and perceptions of the
older children, compared to the young ones. This could partly be
explained by the incipient puberty: as the sensory education was
more informal than the school curriculum in general, the older
children may have related to measurements carelessly. Also, the
large number of follow-up measurements with similar tests may
have decreased their motivation, especially when no feedback on
one’s performance was given during the study period. In line with
this,
found in their longitudinal study
over two years that learning motivation of school children de-
crease over the elementary school years.
The present study shows that sensory education has potential in
activating children’s chemosensory awareness and improving their
attention towards foods and also skills to describe foods. The ef-
fects may not be dramatically large, but they exist. The effects were
stronger in the younger children, suggesting that a suitable time to
start the sensory education program and getting the most of it
could be at the age of eight years or even earlier. In addition to
the measurable effects, the sensory education appealed both to
children and school staff. It provided a positive and enjoyable
way of highlighting food-related sensory issues in the school, as
seen in focus group interviews of children and parents (
S. Mustonen et al. / Food Quality and Preference 20 (2009) 230–240
237

), and teachers (
). The improved skills and
interest in food and eating is not necessarily a measurable effect,
but such development broadens the perspectives to foods and eat-
ing and provides tools in coping with food choices. At its best, sen-
sory education encourages children to try different foods and pay
attention to food quality, which may lead to more healthy and bal-
anced eating habits.
Acknowledgements
The authors thank research technician Kaisu Taskila for her
skillful help in laboratory measurements and lessons, and Dr. Anna
Huotilainen for conducting the lessons in the first education wave.
The representatives of the Finnish companies Valio Ltd., Raisio Ltd.,
Fazer Bakeries and Biofincon Ltd., and Mr. Olavi Törmä, MSc, from
the meat pilot plant of the Department of Food Technology are
thanked for contributions to second education wave. The anony-
mous reviewers are thanked for their great effort that helped us
improve the paper. The interest and encouragement of the SAPERE
group (
), headed by Mr. Roelof Huurn-
eman, is acknowledged. This study was funded by the research
program of Ministry of Agriculture and Forestry, Finnish Innova-
tion Fund (Sitra) and by Emil Aaltonen Foundation, Finland.
Appendix A. Appendix
The first wave of the sensory education program.
Topic
Contents of the lesson (practical
exercises)
Introduction to senses
-introduction to the teaching method
-SIGHT: bananas at different ripening
states
-SMELL: onion and garlic, what does
their smell hint of their other
properties?
-HEARING: peeling of potatoes, grating
of carrots, biting a crispbread, peeling a
banana (identification blind-folded)
-TASTE: dried fruits differing in flavor
and color, choosing the favorites and
discussion whether the flavor was as
expected
-TOUCH: mouthfeel of carrot and
crispbread, comparison of how they feel
in hands
Sense of taste
-learning of basic tastes
-addition of sugar to a sour black currant
juice: what happens?
-foods with different salt content: do
you taste the difference?
-connecting food with taste (pictures of
different foods and taste names)
Sense of smell
-learning and description of smell of
different aromas (cardamom, carrot,
vinegar, pineapple, lemon)
-demonstration of retronasal odor (sip of
vanilla aroma solution nose pinched and
unpinched)
-comparison of the smells of orange
peels, juice and marmalade (intensity,
pleasantness)
-drawing task: fruits that smell good
-homework: which spices are used at
home and how is their smell
Interactions of taste
and smell (flavor)
-discussing of foods that go well
together
-balancing flavor: tasting plain lemon and
discussing the flavor and after that, adding
sugar on the lemon and tasting again
-off-flavors: fruit salad that has been
contaminated with onion flavor
-discussion of different off-flavors and
their reasons
Sense of sight
-pictures of foods with different color,
shape, size
-pictures of gourmet dinner, fast food,
everyday food: how do they differ?
-juices with inappropriate colors (for
example red orange juice): discussion
-coca cola and diet pepsi: similar
appearance, different flavor
-green and red salsa, why do they look
different?
-homework: description of school lunch
Sense of touch and
texture of food
-samples with different texture in
opaque bags, description and
identification based on touching them
with hands
-fruits and vegetables (apple, pineapple,
potato), touching and describing the
texture, cutting them with knives and
evaluating the hardness
-temperature, cold and hot water in a
bottle: comparison
-dairy products (yogurt, sour milk and
‘‘viili”) in transparent bottles, observing
the movements
-mouthfeel of fat: tasting table spread
-trigeminal sensations, hot and cold
(chili and peppermint):discussion
Traditional Finnish
foods
-tasting traditional Finnish food
products like sal ammoniac
(‘‘salmiakki”), Finnish Easter pudding
(‘‘mämmi”) and oven-baked cheese
(‘‘leipäjuusto”)
-where do milk and meat come from?
-seasonal foods in Finland: discussing food
traditions from January to December
Geography of foods
(ethnic foods)
-pictures of ethnic foods, discussion
-sensory description of ethnic fruits:
lychee, avocado, pitahaya, rambutan,
cape gooseberry
-description of appearance, smell and
touch feel of herbs
-learning and description of the smell of
ethnic spices
-red and green chili sauce
Recapitulation
-recapitulation of contents of the earlier
lessons
-practical exercises on using one’s senses
in eating
Visit to a restaurant
-introduction to restaurant environment
and food: preparing of the food, menus,
set out of food, ordering of food, setting
for dinner
238
S. Mustonen et al. / Food Quality and Preference 20 (2009) 230–240

References
Birch, L. L. (1979). Preschool children’s food preferences and consumption patterns.
Journal of Nutrition Education, 11, 189–192.
Birch, L. L. (1999). Development of food preferences. Annual Reviews of Nutrition, 19,
41–62.
Birch, L. L., Gunder, L., Grimm-Thomas, K., & Laing, D. G. (1998). Infants’
consumption of a new food enhances acceptance of similar foods. Appetite,
30, 283–295.
Cain, W. S., de Wijk, R. A., Lulejian, C., Schiet, F., & See, L.-C. (1998). Odor
identification: Perceptual and semantic dimensions. Chemical Senses, 23,
309–326.
Carruth, B. R., Skinner, J., Houck, K., Moran, J., Coletta, F., & Ott, D. (1998). The
phenomenon of ‘‘Picky Eater”: A behavioral marker in eating patterns of
toddlers. Journal of the American College of Nutrition, 17, 180–186.
De Wijk, R. A., & Cain, W. S. (1994). Odor quality: Discrimination versus free and
cued identification. Perception and Psychophysics, 56, 12–18.
Drewnowski, A. (2000). Sensory control of energy density at different life stages.
Proceedings of the Nutrition Society, 59, 239–244.
Gillman, M. W., Rifas-Shiman, S. L., Frazier, A. L., Rockett, H. R. H., Camargo, C. A., Jr.,
Field, A. E., et al. (2000). Family dinner and diet quality among older children
and adolescents. Archives of Family Medicine, 9, 235–240.
Guinard, J.-X. (2001). Sensory and consumer testing with children. Trends in Food
Science and Technology, 11, 273–283.
Haapalahti, M., Mykkänen, H., Tikkanen, S., & Kokkonen, J. (2003). Meal patterns and
food use in 10- to 11-year-old Finnish children. Public Health Nutrition, 6,
365–370.
Hagman, U., & Algotson, S. (2000). Mat för alla sinnen-sensorisk träning enligt SAPERE-
metoden. Stockholm: Blomberg & Jansson.
Huotilainen, A. (2005). Teachers’ evaluation of sensory education. Unpublished
report, April 7, 2005 (in Finnish).
Jahns, L., Siega-Riz, A. M., & Popkin, B. M. (2001). The increasing prevalence of
snacking among US children from 1977 to 1996. Journal of Pediatrics, 138,
493–498.
Jonsson, I. M., Ekström, M. P., & Gustafsson, I.-B. (2005). Appetizing learning in
Swedish comprehensive schools: An attempt to employ food in a new form of
experimental education. International Journal of Consumer Studies, 29, 78–85.
Lehrner, J. P., Glück, J., & Laska, M. (1999). Odor identification, consistency of label
use, olfactory threshold and their relationships to odor memory over the human
lifespan. Chemical Senses, 24, 337–346.
Loewen, R., & Pliner, P. (1999). Effect of prior exposure to palatable and unpalatable
novel foods on children’s willingness to taste other novel foods. Appetite, 32,
351–366.
Lumeng, J. C., Zuckerman, M. D., Cardinal, T., & Kaciroti, N. (2005). The association
between flavor labeling and flavor recall ability in children. Chemical Senses, 30,
565–574.
Mennella, J. A., Pepino, M. Y., & Reed, D. R. (2005). Genetic and environmental
determinants of bitter perception and sweet preferences. Pediatrics, 115,
e216–e222.
Neumark-Sztainer, D., Hannan, P. J., Story, M., Croll, J., & Perry, C. (2003). Family
meal
patterns:
Association
with
sociodemographic
characteristics
and
improved dietary intake among adolescents. Journal of the American Dietetic
Association, 103, 317–322.
Nicklaus, S., Boggio, V., Chabanet, C., & Issanchou, S. (2004). A prospective study of
food preferences in childhood. Food Quality and Preference, 15, 805–818.
Oerlemans, P., Mustonen, S., Esselström, H., & Tuorila, H. (2006). Sensory and food
related perceptions of 8-, 9-, 10- and 11-year-old school children: Baseline
measurements. Research report in EKT series 1362. Helsinki: Department of
Food Technology, University of Helsinki, University Press.
Pliner, P. (1994). Development of measures of food neophobia in children. Appetite,
23, 147–163.
Pliner, P., Pelchat, M., & Grabski, M. (1993). Reduction of food neophobia in humans
by exposure to novel foods. Appetite, 20, 111–123.
Pliner, P., & Salvy, S-J. (2006). Food neophobia in humans. In R. Shepherd & M. Raats
(Eds.), Psychology of food choice (pp. 75–92). Wallingford: CABI Publishing.
Popper, R., & Kroll, J. J. (2005). Conducting sensory research with children. Journal of
Sensory Studies, 20, 75–87.
Puisais, J., & Pierre, C. (1987). Le goût de l’enfant. Paris: Flammarion.
Reverdy, C., Chesnel, H., Schlich, P., Köster, E. P., & Lange, C. (2008). Effect of sensory
education on willingness to taste novel food in children. Appetite, 51, 156–165.
Roedder, D. J. (1999). Consumer socialization of children: A retrospective look at
twenty-five years of research. Journal of Consumer Research, 26, 183–213.
Salo, A. (2007). Children as food experts – Perceptions of sensory education. M.Sc.
thesis in food economics series 204. Department of Economics and
Management. University of Helsinki, Helsinki: University Press (in Finnish).
Appendix B. Appendix
The second wave of the sensory education program.
Topic
Content of the lesson
Cereal products (porridge)
(Raisio Ltd)
-tasting and description of porridges made from oat, barley, wheat or rye
-effect of temperature on sensory properties of porridge: demonstration
-preparation and tasting of cereal-based snacks: fruit smoothie and fresh strawberry
porridge
Yogurt and aromas (Valio Ltd
and Biofincon Ltd)
-adding strawberry jam to yogurt: what happens to sweetness, sourness, thickness and
flavor intensity?
-tasting salty yogurt and then dipping bread to it: which option do you like more?
-acting as a product developer: flavoring of yogurts with different jams (apricot, licorice,
banana, tutti-frutti, chocolate, toffee, citrus); letting others to taste and comment
Cereal products (rye bread)
(Fazer Bakeries Ltd)
-visit to a large Finnish bakery
-tasting of rye bread snacks
-creation of descriptive words or slogans related to rye
-making sandwiches of rye bread
- getting acquainted with large-scale bread manufacturing
(from dough to packages)
Cheese (Valio Ltd)
-introduction to cheese manufacturing
-description of four cheese types: Emmenthal, Edam, Brie, blue cheese using cheese flavor
wheel
-how fat content affects to sensory properties of cheese (edam)
-feta cheese made from cow’s or goat’s milk: how does the milk quality affect their sensory
properties?
Meat products (meat pilot
plant of the
Department of Food
Technology)
-getting acquainted with manufacturing of frankfurter in a pilot plant
-sensory description of two different types of meat products, salami and frankfurter
S. Mustonen et al. / Food Quality and Preference 20 (2009) 230–240
239

Spinath, B., & Spinath, F. M. (2005). Longitudinal analysis of the link between
learning motivation and competence beliefs among elementary school children.
Learning and Instruction, 15, 87–102.
Sune, F., Lacroix, P., & de Kermanec, F. H. (2002). A comparison of sensory attribute
use by children and experts to evaluate chocolate. Food Quality and Preference,
13, 545–553.
Ton Nu, C. (1995). Effects of a teaching programme about taste and gastronomy on
school children’s eating behavior and food neophobia. Food for the consumer.
AIR-CAT meeting reports vol 1: Progress during 1995 (p. 74), AIR-CAT Project, c/o
MATFORSK, Ås, Norway.
Veugelers, P. J., & Fitzgerald, A. L. (2005). Prevalence and risk factors for childhood
overweight and obesity. Canadian Medical Association Journal, 173, 607–613.
240
S. Mustonen et al. / Food Quality and Preference 20 (2009) 230–240
Document Outline
- Effect of sensory education on school children’s food perception: A 2-year follow-up study
- Introduction
- Materials and methods
- Results
- The effect of sensory education on performancein the two age groups
- Free (Task 1) and aided (Task 6) odor naming
- Taste identification (Task 2)
- Descriptive characterization of two breads (Task 3)
- Ratings of the extent to which subjects paid attention to sensory properties of food (Task 4)
- Willingness to try unfamiliar vs. familiar foods (Task 5)
- Evolution of performance in the three tests measuring chemosensory awareness
- The effect of sensory education on performancein the two age groups
- Discussion
- Acknowledgements
- Appendix
- References
- Appendix
Wyszukiwarka
Podobne podstrony:
Effect of sensory education on food preferences in children
Biologic Effects of Lead on School Children of Urban and Suburban Tokyo
Effect of Kinesio taping on muscle strength in athletes
53 755 765 Effect of Microstructural Homogenity on Mechanical and Thermal Fatique
Effect of File Sharing on Record Sales March2004
Effects of the Great?pression on the U S and the World
1 Effect of Self Weight on a Cantilever Beam
Possible Effects of Strategy Instruction on L1 and L2 Reading
Effect of magnetic field on the performance of new refrigerant mixtures
76 1075 1088 The Effect of a Nitride Layer on the Texturability of Steels for Plastic Moulds
Effect of he Environment on Westward Expansion
Effect of heat treatment on microstructure and mechanical properties of cold rolled C Mn Si TRIP
Effects of kinesio taping on proprioception at the ankle
Effect of Kinesio taping on muscle strength in athletes
53 755 765 Effect of Microstructural Homogenity on Mechanical and Thermal Fatique
Inhibitory effect of tea flavonoids on the ability of cell to oxidaze LDL
The Effect of DNS Delays on Worm Propagation in an IPv6 Internet
więcej podobnych podstron