
Surface charge and adsorption from water onto
quartz sand of humic acid
A. Jada
a,*
, R. Ait Akbour
a
, J. Douch
b
a
ICSI-CNRS-UHA, 15 rue Jean Starcky, B.P. 2488, 68057 Mulhouse, France
b
Faculte´ des Sciences d’Agadir, Universite´ Ibn Zohr, Agadir, Morocco
Received 17 June 2005; received in revised form 27 December 2005; accepted 28 December 2005
Available online 14 February 2006
Abstract
The surface charge of humic acid under different conditions of ionic strength, pH, and the presence of various cationic ions (Cu
2+
,
Zn
2+
, Ba
2+
, and Ca
2+
) was determined by a titration method using a cationic polyelectrolyte as titrant. Adsorption isotherms in batch
experiments of the polymer from water onto quartz sand were determined at 20
C, 40 C, and 60 C and under different conditions of
ionic strength, pH, and the presence of various cationic ions (Cu
2+
, Zn
2+
, Ba
2+
, and Ca
2+
). The data indicate significant decrease of
humic acid surface charge by decreasing the pH value from 10.0 to 4.1. Similar decrease of humic acid surface charge was observed
by increasing either the ionic strength or the affinity of the divalent cation toward the humic acid. At ambient temperature the adsorption
of humic acid on the quartz sand seems to be controlled mainly by electrical interaction between the organic particle and the solid sub-
strate. A correlation is found between the surface charge and the adsorbed amount of the polymer, the adsorbed amount increases when
the surface charge of humic acid decreases. The increase of the adsorbed amount with the temperature suggests that adsorption process is
endothermic.
2006 Elsevier Ltd. All rights reserved.
Keywords: Humic acid; Quartz sand; Environment; Adsorption; Streaming induced potential
1. Introduction
The adsorption of natural organic matter on inorganic
particles surfaces such as clay and quartz is an important
geochemical process that occurs in soil and aquatic media
(
Sposito, 1984; Stevenson, 1994; MacCarthy, 2001
). Such
adsorption is a function of the medium conditions and
the surface properties of the soil and organic matter. The
adsorption of the organic matter leads in turn to the
modification of the wettability, the surface charge, and
the size of the inorganic particles (
1982; O’Melia, 1990; Kretzschmar and Sticher, 1997
).
The organic compounds naturally present in the soil in-
clude mainly humic and non-humic substances (
). Further, the humic and non-humic
substances can be classified on the basis of their solubility
in acid and base. Hence, fulvic acids are soluble in acid
and base, humic acids are soluble in base only and humin
is totally insoluble. The fulvic and humic acids are the
major natural organic matter (60%), which affect the soil
fertility and facilitate the transport of contaminants
through soils and aquatic media (
). How-
ever, the physicochemical behaviour, the mobility, and the
accumulation in the soil of humic substances are function
of various parameters, such as the pH, the nature, and
the amount of metal ions present in the medium. Either
humic or fulvic acid contains mainly carboxylic and pheno-
lic acidic groups that are naturally oxidized, giving the
humic substance a negative surface charge in aqueous med-
ium. Further, if divalent cations such as Cu
2+
, Ba
2+
, Ca
2+
,
and Zn
2+
are present in the soil, formation of coordination
complexes between the humic substance acidic groups and
0045-6535/$ - see front matter
2006 Elsevier Ltd. All rights reserved.
doi:10.1016/j.chemosphere.2005.12.063
*
Corresponding author. Tel.: +33 3 89 60 87 09; fax: +33 3 89 60 87 99.
E-mail address:
(A. Jada).
www.elsevier.com/locate/chemosphere
Chemosphere 64 (2006) 1287–1295

the divalent cations may occur, affecting hence the mobility
through the porous medium of the organic colloid
(
Kretzschmar and Sticher, 1997; Ait Akbour et al., 2002
The complexing efficiency is a function of the nature of
divalent cation and humic substance content of oxygen-
containing functional groups, such as carboxylic, phenolic,
and carbonyl groups. In addition, others properties of
humic substances such as their conformation and aggrega-
tion states, are also function of their surface charge and the
composition of the surrounding media (
Since the adsorption of humic acid onto inorganic par-
ticles occurs in aqueous medium, the aim of the present
work is to investigate the effects of pH, the ionic strength,
the nature of the divalent cation present in the aqueous
phase, on the behaviour of humic acid (HA) in the absence
and the presence of quartz sand. Such knowledge will be
necessary to predict the geochemical processes that occur
in soil and aquatic media.
2. Experimental
2.1. Materials
The quartz sand used is Fontainebleau sand from
Alsace (France) and contains mainly quartz according to
the elementary analysis (Si = 45.03%; O = 52.18%; C <
0.3%; H < 0.3%; Ca = 100 mg l
1
; Al = 185 mg l
1
; Mg <
10 mg l
1
; Na < 50 mg l
1
and Fe = 150 mg l
1
). The mea-
sured BET surface area for this sample is 5.099 ±
0.09931 m
2
/g, while the pH
zpc
(zero point charge) was
below 3.78 as measured by potentiometric method.
The humic acid, sodium salt (HA) was purchased from
Aldrich and was used as received without further purifica-
tion, its molecular weight as determined by fluorescence
polarization study was around 2000 g/mol. The C, H,
N, O, and S contents of the sample were determined by
an elemental analysis and are C (38.02%), H (3.76%), N
(0.52%), O (57.4%), and S (<0.3%). In the elemental ana-
lysis, the procedure used for carbon and hydrogen con-
tents consist of heating the sample at 1050
C in oxygen
atmosphere and analysing the formed carbon dioxide
and water by electrochemical and infrared methods. Sim-
ilar procedure was used to measure the nitrogen content;
the sample was heated at 1050
C under helium and
oxygen atmosphere. After heating, the formed nitrogen
oxides were reduced to molecular nitrogen and then quan-
tified by thermal conductivity. To determine the sulphur
content, the sample was heated at 1350
C under oxygen
atmosphere and the sulphur-containing sample was then
transformed to sulphur dioxide, which was then analysed
by using infrared method. Finally, the oxygen content
was determined by heating the sample at 1080
C under
nitrogen atmosphere. The formed oxygen was trans-
formed to carbon monoxide by passing through active
carbon at 1120
C and then analysed by infrared detec-
tors.
2.2. Surface charge of quartz sand particles aqueous
dispersions
The zeta potential of the quartz sand particles aqueous
dispersions was measured at ambient temperature using
microelectrophoresis method as described elsewhere (
). The apparatus used, converts the
electrophoretic mobility l into the zeta potential f accord-
ing to the Henry’s equation (
)
l
¼
2
3
e
g
ff
ðjaÞ;
ð1Þ
where g and e are, respectively, the viscosity and the
permittivity of the aqueous medium, j is the inverse of
the double layer thickness and f(ja) is a corrector factor
having values in the range 1–1.5. The pH values of the
aqueous dispersions were varied in the range 2.2–10.3 by
adding to the dispersions small amounts of sodium hy-
droxide (NaOH) or hydrochloric acid (HCl) aqueous
solutions.
2.3. Surface charge titration of HA in aqueous medium
A stock solution of the HA was prepared by solubiliz-
ing, at ambient temperature, the polymer in distilled water
in the absence or the presence of monovalent or divalent
chloride salts. The solution was then diluted with water
to give the desired final concentrations of HA and salt.
The HA surface charge under various experimental con-
ditions, was evaluated by titration of the negatively
charged humic aqueous suspensions with a cationic poly-
electrolyte
(Poly(diallyl-dimethyl-ammonium
chloride),
PDADMAC) and using a potential measuring device
(particle charge detection, PCD, Mu¨teck instrument). The
measuring cell is composed of a cylindrical poly (tetraflu-
oroethylene) (PTFE) container with a PTFE piston inside.
The titratable aqueous humic suspension (10 ml) was filled
into the gap (0.5 mm) between the container wall and the
piston, and various amounts of the aqueous PDADMAC
solution were then added. The resulting streaming induced
potential (SIP) was measured between two gold electrodes
located at the top and the bottom of the gap. During the
measurements, the piston moves sinusoidally up and down
at a frequency of 4 Hz and forces the aqueous suspension
to move and to stream through the gap along the container
wall. The SIP measured during the piston movement,
results from the separation of the counterions from the
humic particles adsorbed on the container wall. These
counterions are compensated by adding cationic polyelec-
trolyte PDADMAC that has opposite surface charge as
compared to humic particles. From the titration curve,
the point of neutral charge (PNC) or the endpoint of titra-
tion is determined, which allows the calculation of the
charge density of the humic particles. It should be men-
tioned that the PCD, Mu¨teck instrument allows the mea-
surement of only relative potential values and no
calibration with this apparatus is possible.
1288
A. Jada et al. / Chemosphere 64 (2006) 1287–1295
2.4. Adsorption of HA from water onto quartz sand particles
In order to study the effects of various parameters
(pH, salt, amount of the solid, and temperature) on the
adsorption isotherm of HA on quartz sand, various
series of quartz sand-HA aqueous dispersions were pre-
pared.
In the first series dealing with the effects of the ionic
strength, the nature of divalent cation and the pH, a weight
amount of grinded quartz sand (1.5 g) was placed in stop-
pered bottles and known volumes (50 ml) of salt (monova-
lent or divalent cation) aqueous solutions containing
various amounts of humic acid, (initial HA concentration,
C
initial
, ranging from 1 to 8 mg l
1
) were added. To study
the effect of ionic strength, samples containing various
NaCl concentrations (10
3
–10
1
M) at pH 6 were pre-
pared. The effect of divalent cation was studied by adding
various salts (CaCl
2
, CuCl
2
, BaCl
2
, ZnCl
2
) to the disper-
sions at fixed salt concentration = 10
3
M and at pH 6.
The effect of pH was investigated by adjusting the HA-
quartz aqueous dispersions to desired pH values (pH 3
and pH 6 ± 0.1) at NaCl = 10
3
M.
In the subsequent series dealing with the effect of the
solid content, various weight amounts (0.5 g and 2.5 g) of
grinded quartz sand were placed in stoppered bottles and
known volumes (50 ml) of monovalent (NaCl = 10
3
M)
aqueous solutions containing various amount of humic
acid, (initial HA concentration, C
i
, ranging from 1 to
8 mg l
1
) were added.
In all cases the resulted dispersions, having pH 6, were
agitated at 20
C for 24 h, then centrifuged at ambient tem-
perature at 15 000 rpm to settle HA-covered quartz sand
particles. A known volume of the supernatant was placed
in an optical cell and analysed at ambient temperature by
fluorescence spectroscopy to yield the residual HA concen-
tration, C
e
, expressed in mg l
1
. The fluorescence excitation
spectra were recorded on Shimadzu RF-5001 PC and
were measured at 20
C using the excitation wavelength
range 280–450 nm and the emission wavelength = 530 nm.
The adsorbed amount, C, as expressed in milligram of HA
per gram of the sand, was determined from the differ-
ence between the initial concentration (C
initial
) and the
residual concentration (C
equilibrium
), according to the
equation
C
¼
ð50 10
3
ÞðC
initial
C
equilibrium
Þ
m
;
ð2Þ
where m is the amount of the adsorbent, expressed in
grams, C
initial
and C
equilibrium
, are respectively, the HA
initial and the residual concentrations, expressed in
mg l
1
.
To study the effect of temperature on adsorption iso-
therm, the HA-quartz sand aqueous dispersions were agi-
tated at 20
C, 40 C, and 60 C and similar procedures
as described above were used for analysing the supernatant
and determining the HA adsorbed amount.
3. Results and discussion
3.1. Surface charge of quartz sand particles in water
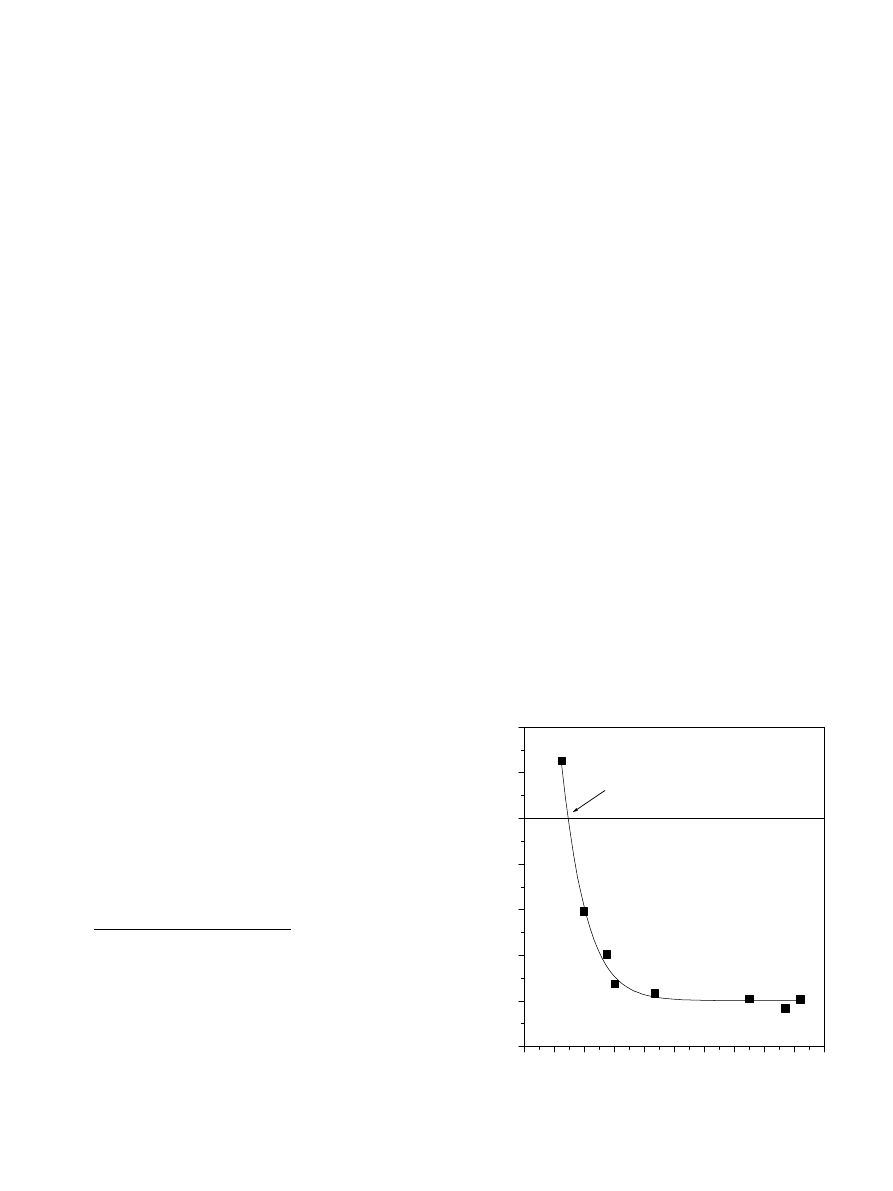
shows the variation of the zeta potential versus
the pH, for the quartz sand particles in NaCl = 10
3
M
aqueous dispersions. The main cause of quartz surface
charge generation at quartz–water interface is due to disso-
ciation of silanol groups at the interface. The H
+
and OH
ions are the potential determining ions, i.e. ionic species of
the aqueous medium that enter the inner part of the electri-
cal double layer and undergo specific interaction with the
surface. Hence, due to the amphoteric character of the sil-
anol groups the quartz surface may gain or lose a proton
depending on the pH value of the aqueous phase.
indicates the isoelectric point (IEP) of the quartz sand par-
ticles, i.e. the pH at which the zeta potential, f = 0 occurs
at pH 2.44. Other authors observed similar IEP value of
quartz sands in aqueous media (
). Below and above the IEP value, the quartz
particles are respectively, positively and negatively charged.
3.2. Factors affecting the HA surface charge
3.2.1. Effect of salt concentration
In the presence of CaCl
2
and before titrating the HA
with the PDADMAC, the counterions of the polyelectro-
lyte, i.e. the HA sodium ions, are exchanged by the calcium
ions. Such ion exchange is a function of the CaCl
2
concen-
tration and leads to the modification of HA polyelectrolyte
chain conformation and aggregation states. Thus, one can
expect that for a given HA concentration, a critical CaCl
2
1
2
3
4
5
6
7
8
9
10
11
-50
-40
-30
-20
-10
0
10
20
IEP=2.44
Zeta potential (mV)
pH
Fig. 1. Zeta potential of Fontainebleau quartz sand particles in water
(NaCl = 10
3
M, sample concentration = 0.2 wt%).
A. Jada et al. / Chemosphere 64 (2006) 1287–1295
1289
concentration exists, above which the HA polyelectrolyte
network collapses and aggregates. This critical salt concen-
tration is in turn a function of the viscosity and/or dimen-
sion of the HA polyelectrolyte free salt solution (
et al., 1993; Dragan and Cristea, 2001
). In addition, it
can be assumed that either the rigid or the collapsed HA
polyelectrolyte behaves in water as a solid particle develop-
ing at its surface an electrical double layer (
).
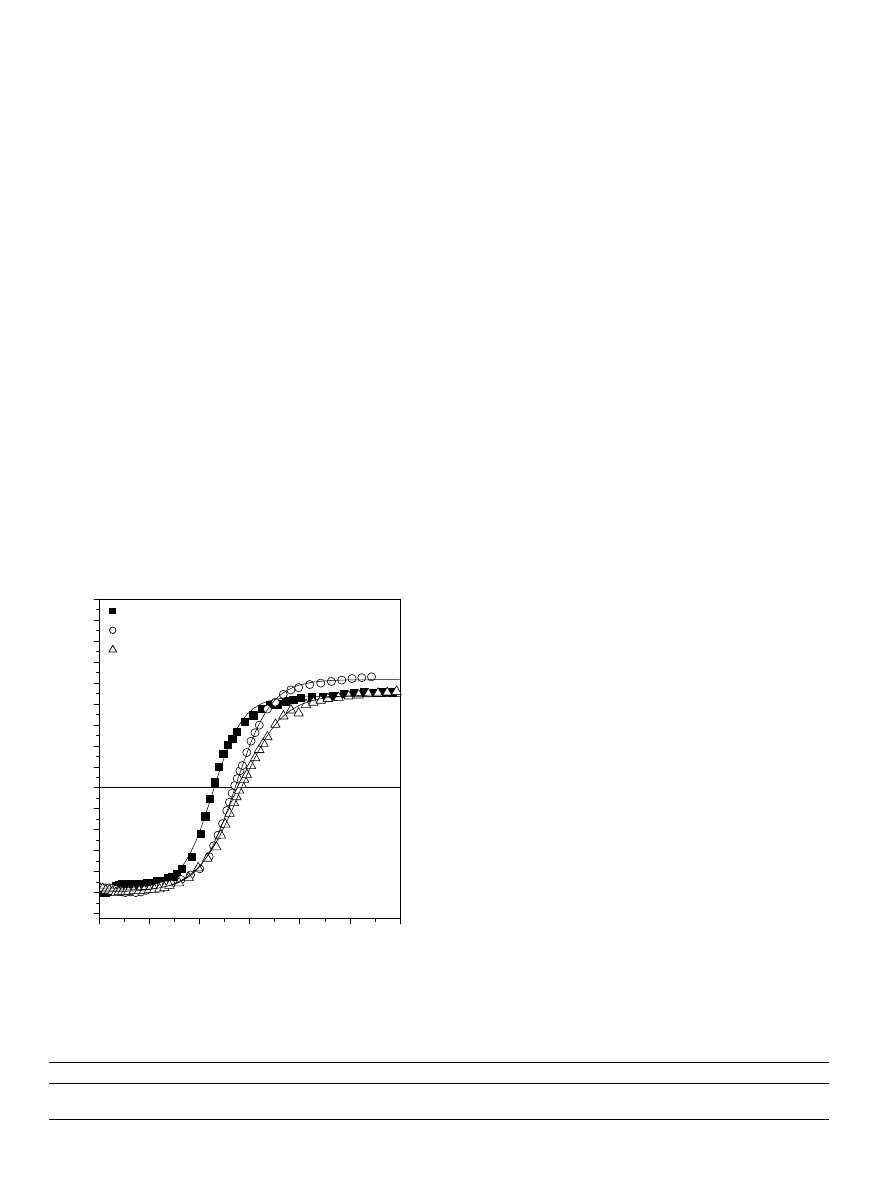
shows the titration curves of HA by the PDAD-
MAC in the presence of various concentrations of CaCl
2
at pH 6. As can be seen in the figure, in all instances,
the amplitude of normalized streaming induced poten-
tial (SIP) decreases as the PDADMAC concentration,
C
PDADMAC
, increases up to the PNC, at which SIP =
0 mV. Beyond the PNC, the magnitude of the SIP increases
with the PDADMAC concentration and reaches a plateau
value. Furthermore,
indicates that in the absence of
PDADMAC, the HA is negatively charged owing to the
ionization of the carboxylic surface groups.
All the titration curves shown in
involve three sit-
uations of the net surface charge, Dr =
r
HA
+ r
PDADMAC
,
of HA polymer containing the adsorbed PDADMAC,
where r
HA
and r
PDADMAC
are, respectively, the surface
charge density of the HA polymer and the PDADMAC.
Thus, at low PDADMAC concentrations, i.e. C
PDADMAC
<
PNC, Dr < 0, the HA surface charge is under compensated,
while at C
PDADMAC
= PNC, Dr = 0, as resulting from
compensation of HA surface charge by PDADMAC macro-
molecules. Further, the increase of PDADMAC con-
centration beyond the PNC, leads to Dr > 0, i.e. an
overcompensation and charge reversal of HA surface charge
by the PDADMAC macromolecules. The mechanism by
which the PDADMAC modifies the surface charge density
of HA polyelectrolyte, results from ion exchange process.
In this process counterions of the HA polymer (i.e. the cal-
cium ions) move toward the solution and are replaced by
the PDADMAC polyion at the surface. The driving forces
are entropic; entropy loss due to polyelectrolyte and entropy
gain due to the liberation of counterions from the surface.
The amount of the PDADMAC exchanged and adsorbed
on the HA surface decreases when the CaCl
2
concentration
increases.
From the values of the PNC obtained at various values
of CaCl
2
concentrations and using the known equivalent
charge of PDADMAC, the HA equivalent charge was cal-
culated and are presented in
. As can be seen in
, the HA equivalent charge decreases from
2.41
· 10
4
to 1.35
· 10
4
eq g
1
by increasing the CaCl
2
salt concentration in the range 10
5
–5
· 10
4
M.
3.2.2. Effect of pH
shows similar variation of the SIP versus
C
PDADMAC
and
indicates the corresponding
decrease in the HA equivalent charge from 3.20
· 10
4
to
0.52
· 10
4
eq g
1
by decreasing the pH of the aqueous
phase in the range 10.0–4.1.
The decrease of the HA equivalent charge by increasing
the CaCl
2
concentration, at pH 6 is due to the increase of
complexes formed between the HA ionized carboxylic
groups and the Ca
2+
ions located on a Stern plane. The
increase of ionic state of the HA with the pH on the other
hand, results from the deprotonation first of the carboxylic
groups at low pH, followed by the phenolic groups at high
pH. From the data presented in
, it can be
seen that H
+
ions as compared to Ca
2+
, seem to be more
efficient in reducing the equivalent charge of HA polymer.
However, the HA is less charged (maximum surface charge
observed = 3.18
· 10
4
eq g
1
) as compared to other pH
dependent surface charge polyelectrolytes such as sodium
polyacrylate, PAA, and poly (ethylenimine), PEI. Reported
studies on charge/pH isotherms of the PEI (
) have shown that the charge density of PEI
is highly dependent on the pH and falls from a value of
about 1.97 eq g
1
at pH 3 to zero at pH 11.1, in the pres-
ence of NaCl salt.
0.0
5.0x10
-5
1.0x10
-4
1.5x10
-4
2.0x10
-4
2.5x10
-4
3.0x10
-4
-1.2
-1.0
-0.8
-0.6
-0.4
-0.2
0.0
0.2
0.4
0.6
0.8
1.0
1.2
1.4
1.6
1.8
Normaliz
ed potential (a.u.)
[PDADMAC] (equivalent/liter)
CaCl
2
=5 10
-4
M
CaCl
2
=10
-4
M
CaCl
2
=10
-5
M
Fig. 2. Titration curves of HA by PDADMAC at various values of ionic
strength.
Table 1
Variation of HA equivalent charge with the CaCl
2
concentration
[Ca
2+
] (M)
10
5
5
· 10
5
10
4
3
· 10
4
5
· 10
4
[PDADMAC] (eq/l)
1.55
· 10
4
1.40
· 10
4
1.39
· 10
4
1.33
· 10
4
1.18
· 10
4
C
AH
(eq g
1
)
2.41
· 10
4
1.94
· 10
4
1.92
· 10
4
1.73
· 10
4
1.35
· 10
4
1290
A. Jada et al. / Chemosphere 64 (2006) 1287–1295
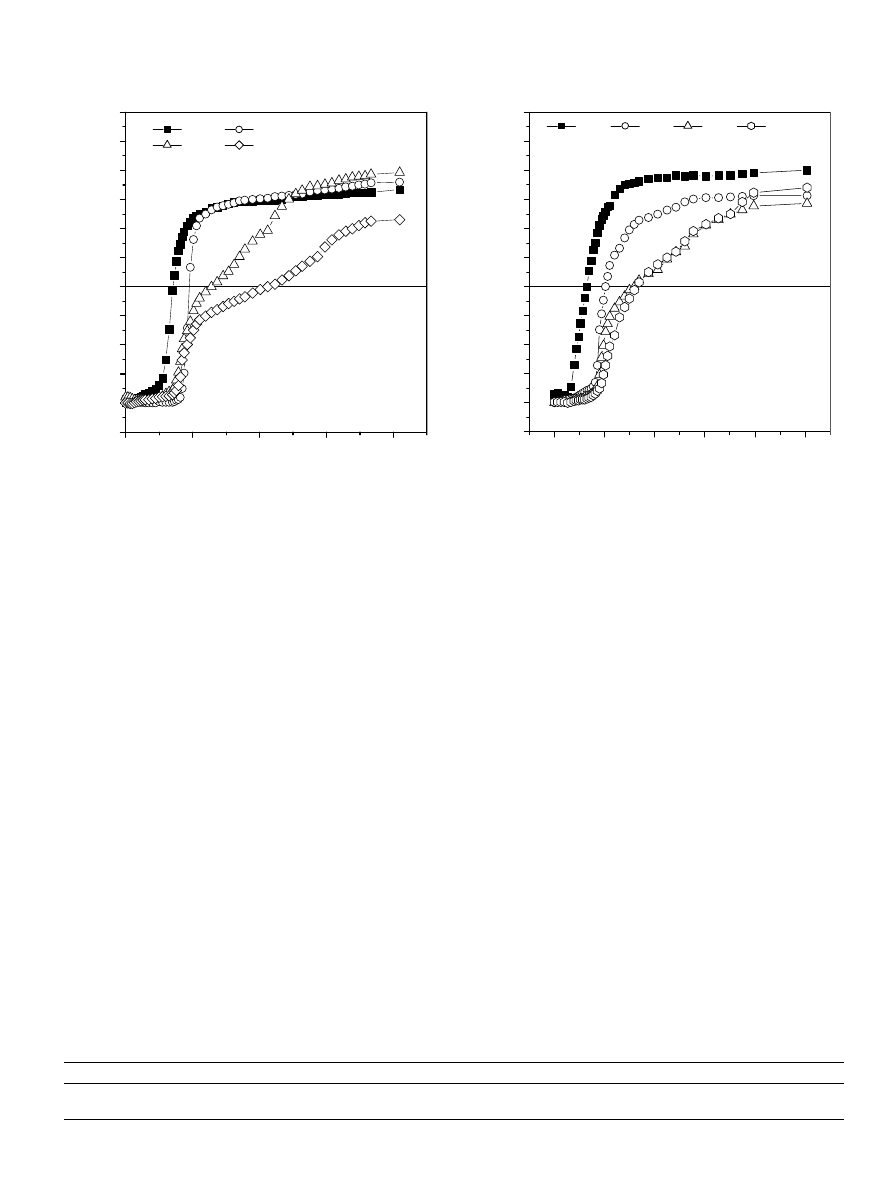
3.2.3. Effect of the nature of the divalent cation
shows the SIP variation of HA versus the PDAD-
MAC concentration, in the presence of various divalent
cations (Ca
2+
, Ba
2+
, Zn
2+
, and Cu
2+
) at constant salt con-
centration = 3
· 10
4
M. The values of HA equivalent
charge, as calculated from the various PNC values are pre-
sented in
. The curves of
show marked differ-
ences in initial slopes and PNC values depending on the
nature of the HA adsorbed divalent cation. As can be
observed in the figure, divalent cations such as Cu
2+
and
Zn
2+
exhibit greater decrease of HA surface charge as com-
pared to Ca
2+
and Ba
2+
. This difference in behaviour of
HA polymer in the presence of various cations is related
to the electronic structure (
), and the adsorptive affinity of
the cation (
). Further, the mechanism by
which divalent cations affect the surface charge of HA
polymer involves contributing forces arising from electro-
static attraction, formation of coordination complexes
(
) and solvent effect. Hence, in all
cases the adsorption of divalent cations such as Cu
2+
,
Zn
2+
, Ca
2+
, and Ba
2+
from bulk water onto the HA sur-
face reduces the thickness of the HA electrical double layer
and the zeta potential (i.e. the electrical potential at the
shear plane). In addition, in the presence of Cu
2+
and
Zn
2+
ions, the formation of coordination complexes
between these ions and the negatively charged HA surface
groups, decreases further the HA surface charge as shown
in
.
3.3. Factors affecting HA adsorption onto quartz sand
particles
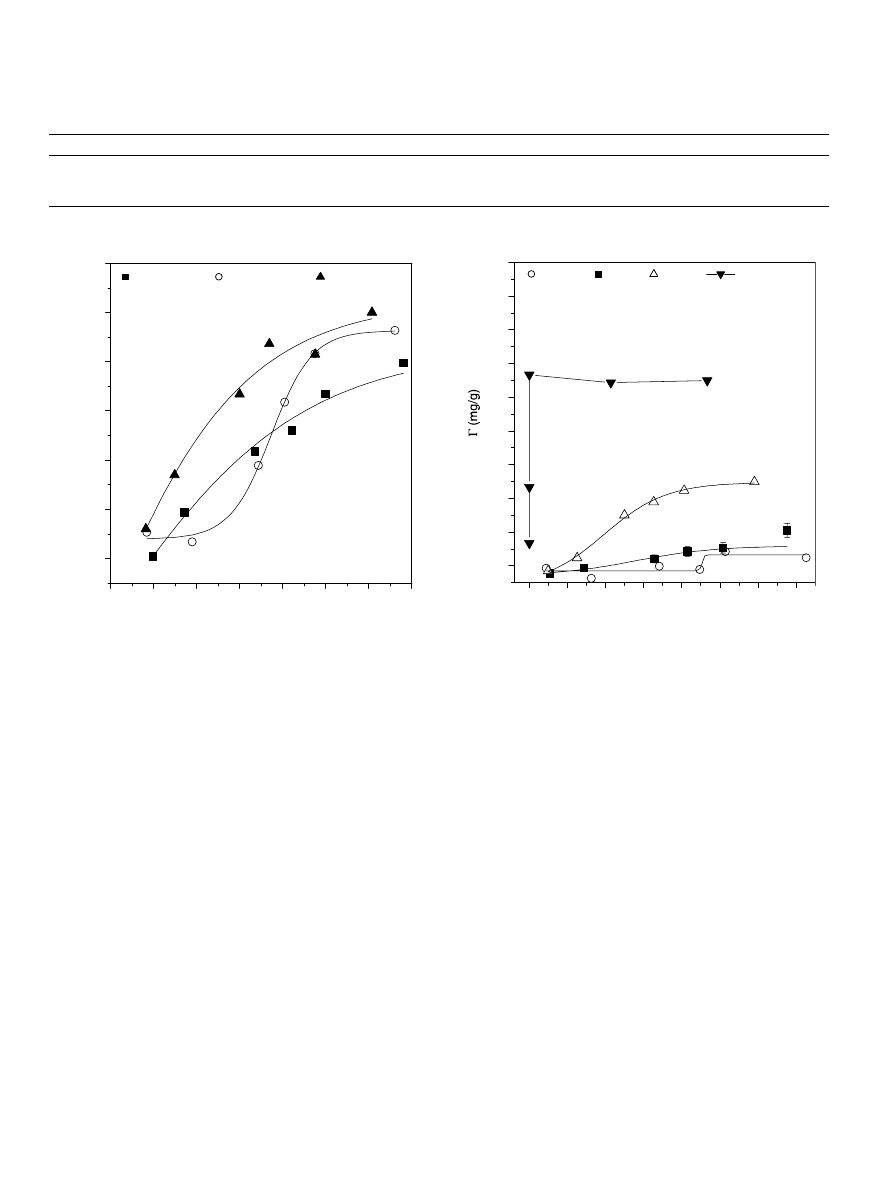
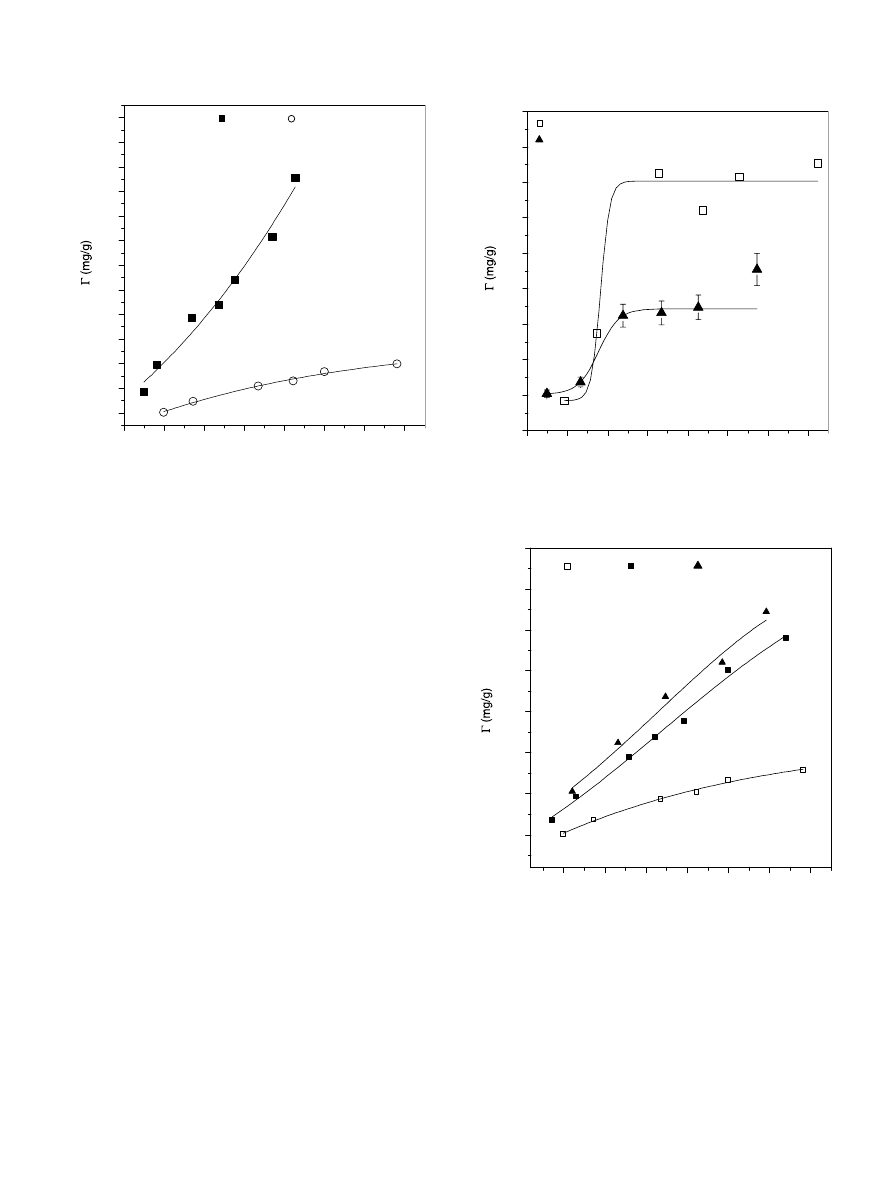
3.3.1. Effect of salt concentration
represents the effect of NaCl concentration on the
adsorption isotherms of HA from water onto quartz sand
at ambient temperature and at pH 6. In all cases the uptake
of HA increases with increasing the HA initial concentra-
tion and reaches plateau value. Further, as can be seen in
the figure, the maximum adsorbed amount of HA increases
as the NaCl concentration increases in the range 10
3
–
10
1
M. It should emphasized that at pH 6 and in the pres-
ence of low salt concentration, both HA and the quartz
sand particles are negatively charged and are expected to
develop pronounced repulsive barriers (
Israelachvili, 1992; Elimelech et al., 1995
), which will lead
to reduction of HA adsorption. By increasing the salt con-
centration above a certain ionic strength, the repulsive
energy barriers of both the components are reduced due
0.0
1.0x10
-4
2.0x10
-4
3.0x10
-4
4.0x10
-4
-1.25
-1.00
-0.75
-0.50
-0.25
0.00
0.25
0.50
0.75
1.00
1.25
1.50
Normalized potential (a.u.)
[PDADMAC] (equivalent/liter)
pH=4.1
pH=5.2
pH=6.7
pH=10.0
Fig. 3. Titration curves of HA by PDADMAC at various pH of the
aqueous phase.
Table 2
Variation of HA equivalent charge with the pH of the aqueous phase
pH
10.0
6.7
5.2
4.1
[PDADMAC] (eq/l)
1.76
· 10
4
1.48
· 10
4
1.03
· 10
4
0.75
· 10
4
C
AH
(eq g
1
)
3.18
· 10
4
2.20
· 10
4
1.83
· 10
4
0.52
· 10
4
Normalized potential (a.u.)
[PDADMAC] (equivalent/liter)
0.0
5.0x10
-5
1.0x10
-4
1.5x10
-4
2.0x10
-4
2.5x10
-4
-1.25
-1.00
-0.75
-0.50
-0.25
0.00
0.25
0.50
0.75
1.00
1.25
1.50
CuCl
2
ZnCl
2
BaCl
2
CaCl
2
Fig. 4. Titration curves of HA by PDADMAC in the presence of various
divalent cations.
A. Jada et al. / Chemosphere 64 (2006) 1287–1295
1291
to decrease of the electrical double layer thickness, and this
will lead to an increase of HA adsorbed amount as shown
in
.
To study colloidal adsorption or deposition in porous
medium, step-input or short-pulse columns are usually
used (
). In these experiments
the deposition may be either reaction or transport limited,
at respectively, low or high ionic strength. Such colloidal
deposition processes occurring in step-input or short-pulse
column are likely involved in the batch experiments used in
the present work. However, in batch as well as in column
experiments, the deposition is a function of various para-
meters such as the solid particles size, the solid content
and its accessible surface area, the pH, the nature and the
concentration of the divalent cation present in the medium.
Similar parameters were also found to affect mercury
adsorption from water onto activated carbons surface
(
3.3.2. Effect of the nature of the divalent cation
shows the effect of divalent cation (Cu
2+
, Ba
2+
,
Zn
2+
, and Ca
2+
) on the adsorption isotherms of HA from
water onto quartz sand particles, at pH 6 and salt con-
centration = 3
· 10
4
M. As was mentioned above, the
divalent cations Cu
2+
and Zn
2+
form coordination com-
plexes with the negatively charged HA surface groups
and are more efficient than Ba
2+
and Ca
2+
in reducing
the HA surface charge. However, in investigating the HA
adsorption onto the quartz sand particles one should take
into account the effect of the divalent cation on the reduc-
tion of the surface charges and/or zeta potentials of both
quartz particles and HA polymer (
1990a,b; Kihira et al., 1992; Litton and Olson, 1993
). Thus
the highest adsorption of HA on quartz particles in the
presence of Cu
2+
is likely due to strong reduction of the
HA surface charge and quartz particles zeta potential.
Adsorption to a lesser degree is expected to occur in the
presence of Zn
2+
as shown in
. However, the higher
adsorbed amount observed in the presence of Ba
2+
as com-
pared to Zn
2+
or Ca
2+
is likely due to the preferential
adsorption of the Ba
2+
on the quartz surface as resulting
from it is high ionic radius.
3.3.3. Effect of pH
shows the HA adsorption isotherms onto the
quartz sand particles at ambient temperature, and at pH
3 and pH 6. At pH 3, the adsorbed amount increases sev-
eral fold by increasing HA concentration and do not level
Table 3
Effect of the nature of cation Me
2+
on the HA equivalent charge
[Me
2+
] = 3.10
4
M
Ca
2+
Ba
2+
Zn
2+
Cu
2+
Ionic radius (nm)
0.099
0.135
0.074
0.069
[PDADMAC] (eq/l)
1.33
· 10
4
1.21
· 10
4
1.00
· 10
4
2.24
· 10
5
C
AH
(eq g
1
)
1.73
· 10
4
1.42
· 10
4
0.96
· 10
4
0.45
· 10
5
0
1
2
3
4
5
6
7
0.00
0.01
0.02
0.03
0.04
0.05
0.06
NaCl=10
-3
M
NaCl=5 10
-2
M
NaCl=10
-1
M
Γ
(mg/g)
C
equilibrium
(mg/l)
Fig. 5. Adsorption isotherms of HA on quartz sand particles at various
values of ionic strength.
C
equilibrium
(mg/l)
0
1
2
3
4
5
6
7
0.02
0.04
0.06
0.08
0.10
0.12
0.14
0.16
0.18
0.20
CaCl
2
ZnCl
2
BaCl
2
CuCl
2
Fig. 6. Adsorption isotherms of HA on quartz sand particles in the
presence of various divalent cations.
1292
A. Jada et al. / Chemosphere 64 (2006) 1287–1295
out, even at high polymer concentration. Such behaviour
indicates that the reduction of HA surface charge and
energy barrier of quartz particles leads to an exponential
increase of the deposition rate (
). However, the HA adsorbed amount is at lesser
degree at pH 6, due to electrostatic repulsion between the
negatively charged HA polymer and quartz particles.
3.3.4. Effect of the solid content
shows the effect of adsorbent mass on the HA
adsorption isotherm at pH 6, NaCl = 10
3
M and ambient
temperature. As was expected the adsorbed amount
decreases as the quartz sand content increases, due to the
increase of available surface area of the adsorbent. As
can be observed in
, the maximum adsorbed amount
of HA polymer decreases more than 50% by increasing the
mass of the quartz sand by 5-fold. It should be emphasised
that the adsorption isotherms are obtained after 24 h of
contact between the solute and the adsorbent. As illus-
trated in
, the adsorbed amount levels at a certain
HA concentration, due to saturation of available quartz
sand actives sites, its likely that the adsorption of HA on
quartz sand involves one or more contributing forces aris-
ing from electrostatic and hydrophobic interactions, hydro-
gen bonding, and solvent effects (
3.3.5. Effect of temperature
shows the variation of the HA adsorbed amount
on quartz sand particles, versus the residual concentration,
at 20
C, 40 C, and 60 C and at fixed pH and ionic
strength values (pH 6, NaCl = 10
3
M). As can be
observed in the figure the HA uptake increases several folds
as the temperature increases, indicating an endothermic
process. Further, the adsorption curves at 40
C and
60
C as compared to the one obtained at 20 C do not
level out, even at high HA concentrations. Such adsorption
is similar to that obtained at pH 3 and T = 20
C (see
) and the exponential increase of the adsorption
shown in
at 40
C and 60 C result likely from an
enhanced HA deposition rate due to an increased mobility
C
equilibrium
(mg/l)
0.0
1.0
2.0
3.0
4.0
5.0
6.0
7.0
0.00
0.02
0.04
0.06
0.08
0.10
0.12
0.14
0.16
0.18
0.20
0.22
0.24
pH=3±0.1
pH=6±0.1
Fig. 7. Adsorption isotherms of HA on quartz sand particles at various
pH values of the aqueous phase.
C
equilibrium
(mg/l)
0
1
2
3
4
5
6
7
0.00
0.01
0.02
0.03
0.04
0.05
0.06
0.07
0.08
0.09
Amount of sand = 1 wt%
Amount of sand = 5 wt%
Fig. 8. Adsorption isotherms of HA on quartz sand particles at various
solid contents.
1
2
3
4
5
6
7
0.000
0.025
0.050
0.075
0.100
0.125
0.150
0.175
T=20
°C T=40 °C
T=60
°C
C
equilibrium
(mg/l)
Fig. 9. Adsorption isotherms of HA on quartz sand particles at various
temperatures.
A. Jada et al. / Chemosphere 64 (2006) 1287–1295
1293

or transport of HA polymer from bulk solution towards
the quartz surface. Similar increase with temperature of
the HA uptake on activated carbon was also observed by
other authors (
Khalil and Girgis, 1995; Daifullah et al.,
). Accordingly, the increase of the adsorption with
the temperature may be attributed to the acceleration of
some originally slow adsorption steps or the creation of
some new active sites on the adsorbent surface. Finally,
the adsorption of HA from water onto quartz sand parti-
cles seems to involve mainly two steps: a transport step
during which HA polymer diffuses from bulk water onto
quartz surface and an attachment step during which it
adsorbs onto quartz surface. The kinetics of transport
and the attachment are under control of various factors
such as the ionic strength, the pH of the aqueous phase
and the temperature.
3.3.6. Mechanism of HA adsorption from water onto
quartz particles
Various mechanisms have been proposed to explain the
sorption of humic substances that occur in soils, river
sediments, and natural aquifer materials (
). Such mechanisms involve ligand exchange, electro-
static as well as hydrophobic attractions between humic
substances and solid surface. In the present study it is
shown that various factors such as pH, ionic strength, nat-
ure of divalent cations, and temperature, control the sur-
face charge and the adsorption mechanisms of HA on
quartz. The variation of these factors should affect the elec-
trical double layer structures of both HA and quartz
surfaces. Hence a decrease of HA surface charge by
increasing the ionic strength or decreasing the pH of the
aqueous phase is followed by an increase of HA adsorption
on quartz particles. Further, it should be emphasised that
HA contains both functional groups (carboxylic, phenolic,
and carbonyl groups) and hydrophobic moieties. In the
adsorption process the HA functional groups are mainly
involved in electrostatic interaction with the quartz hydro-
xyl surface groups, whereas the HA insoluble part (hydro-
phobic moiety) allows the polymer to accumulate on the
inorganic surface. Therefore, it is likely that electrostatic
as well as hydrophobic interactions are the most important
forces involved in the mechanism of HA adsorption on
quartz surface.
The adsorption isotherms of HA on quartz were found
to depend on agitation time (24 h or 48 h) and only the
data obtained at 24 h agitation time are presented in this
paper. Thus for a given agitation period various volumes
of HA aqueous solutions were equilibrated with a given
amount of quartz. In all instances the adsorption of HA
increased with an increase of HA initial concentration,
and depending on the experimental conditions the uptake
of HA may or not level out. The fact that HA adsorption
isotherms do not level out at low pH value (pH 3,
) or
at high temperatures (T = 40
C and T = 60 C,
may be explained by the polyelectrolyte nature of HA. In
these cases the adsorption may be determined not only
by the interaction between HA and quartz surface but also
by the lateral interaction that occur between the adsorbed
HA macromolecules themselves and the steric arrange-
ments of the macromolecules (i.e. association between
HA macromolecules at quartz surface, which is mainly
due to the decrease of their solubility in water) (
and Zech, 1997; Vermeer et al., 1998
).
4. Conclusion
In this work, the effects of various factors such as the
ionic strength, the nature of divalent cation, the pH, the
adsorbent content, and the temperature, on HA surface
charge and its adsorptive properties on quartz sand parti-
cles, were investigated. The HA surface charge reduction
results from surface complex formation and reduction of
the electrical double layer thickness. The adsorption of
HA on quartz sand involves two main steps, a first step,
which concerns the transport of HA polymer from bulk
water onto adsorbent surface followed by an adsorption
or retention step. The kinetics of these processes are under
control of the experimental conditions. Work is in progress
to determine the surface densities of the HA functional
groups and to investigate the effects of experimental condi-
tions on the adsorption kinetics of HA on quartz sand
particles.
References
Ait Akbour, R., Douch, J., Hamadani, M., Schmitz, Ph., 2002. Transport
of kaolinite colloids through quartz sand: Influence of humic acid,
Ca
2+
, and trace metals. J. Colloid Interf. Sci. 253, 1–8.
Alvarez-Puebla, R.A., Valenzuela-Calahoroo, C., Garrido, J.J., 2004.
Retention of Co(II), Ni(II) and Cu(II) on a purified brown humic acid
Modeling and characterisation of the sorption process. Langmuir 20,
3257–3264.
Baker, H., Khalili, F., 2005. A study of complexation thermodynamic of
humic acid with cadmium (II) and zinc (II) by Schubert’s ion-exchange
method. Anal. Chim. Acta 542, 240–248.
Daifullah, A.A.M., Girgis, B.S., Gad, H.M.H., 2004. A study of the
factors affecting the removal of humic acid by activated carbon
prepared from biomass material. Colloids Surfaces A: Physicochem.
Eng. Aspects 235, 1–10.
Dragan, S., Cristea, M., 2001. Influence of low-molecular-weight salts on
the formation of polyelectrolyte complexes based on polycations with
quaternary ammonium salt groups in the main chain and poly(sodium
acrylate). Eur. Polym. J. 37, 1571–1575.
Elimelech, M., Gregory, J., Jia, X., Williams, R.A., 1995. Particle
deposition and aggregation. Measurement, Modelling, and Simula-
tion. Butterworth-Heinemann, New York.
Elimelech, M., O’Melia, C.R., 1990a. Effect of particle size on collision
efficiency in the deposition of Brownian particles with electrostatic
energy barriers. Langmuir 6, 1153–1163.
Elimelech, M., O’Melia, C.R., 1990b. Kinetic of deposition of colloi-
dal particles in porous media. Environ. Sci. Technol. 24, 1528–
1536.
Fleer, G.J., Cohen Stuart, M.A., Scheutjens, J.M.H.M., Cosgrove, T.,
Vincent, B., 1993. Polymer at interfaces. Chapman and Hall, London.
Gill, R.I.S., Herrington, T.M., 1987. The flocculation of kaolin suspen-
sions using polyethylenimine and cationic polyacrylamides of the same
molar mass but different charge density. Colloids Surfaces 28, 41–
52.
1294
A. Jada et al. / Chemosphere 64 (2006) 1287–1295

Hiemenz, P.C., 1986. Principle of Colloid and Surface Chemistry. Marcel
Dekker, New York.
Hunter, R.J., 1986. Foundations of Colloid Science, vols. 1–2. Oxford
University Press, Oxford.
Israelachvili, J., 1992. Intermolecular and Surface Forces. Academic Press,
London.
Jada, A., Ait Chaou, A., 2003. Surface properties of petroleum oil polar
fraction as investigated by Zetametry and DRIFT spectroscopy. J.
Petrol. Sci. Eng. 39, 287–296.
Jada, A., Ait Chaou, A., 2002. Use of pyrogenic silicas for petroleum oil
polar fraction characterisation. Fourier transform infrared spectros-
copy and microelectrophoresis studies. Fuel 81, 1669–1678.
Juhna, T., Klavins, M., Eglite, L., 2003. Sorption of humic substances on
aquifer material at artificial recharge of groundwater. Chemosphere
51, 861–868.
Kaiser, K., Zech, W., 1997. Competitive sorption of dissolved organic
matter to soils and related mineral phases. Soil. Sci. Soc. Am. J. 61, 64–
69.
Khalil, L.B., Girgis, B.S., 1995. Adsorption of PNP on activated carbon
prepared from phosphoric acid treated apricot stone shells. Adv. Sci.
Technol. 12, 79–92.
Kihira, H., Ryde, N., Matijevic, E., 1992. Kinetics of heterocoagulation. 1.
A comparison of the theory and experiment. Colloids Surfaces 64,
317–324.
Kosmulski, M., 1997. Attempt to determine pristine points of zero charge
of Nb
2
O
5
, Ta
2
O
5
and HFO
2
. Langmuir 13, 6315–6320.
Kosmulski, M., Eriksson, P., Gustafsson, J., Rosenholm, J.B., 1999.
Specific adsorption of nickel and potential of silica at various solid-to-
liquid ratios. J. Colloid Interf. Sci. 220, 128–132.
Kretzschmar, R., Sticher, M., 1997. Transport of humic-coated iron oxide
colloids in sand soil: influence of Ca
2+
and trace metals. Environ. Sci.
Technol. 31, 3497–3504.
Litton, G.M., Olson, T.M., 1993. Colloid deposition rates on silica bed
media and artefacts related to collector surface preparation methods.
Environ. Sci. Technol. 27, 185–193.
MacCarthy, P., 2001. The principles of humic substances. Soil Sci. 166,
738–751.
Ochs, M., Cosovic, B., Stumm, W., 1994. Coordinative and hydrophobic
interaction of humic substances with hydrophilic Al
2
O
3
and hydro-
phobic mercury surfaces. Geochim. Cosmochim. Acta 58, 639–650.
O’Melia, C.R., 1990. Aquatic Chemical Kinetics: Reactions Rates of
Processes in Natural Waters. Werner Stumm, New York.
Prado, A.G.S., Miranda, B.S., Zara, L.F., 2005. Adsorption and
thermochemical data of divalent cations onto silica gel surface
modified with humic acid at solid/liquid interface. J. Hazard. Mater.
120, 243–247.
Ruckenstein, E., Prieve, D.C., 1976. Adsorption and desorption of
particles and their chromatographic separation. AICHE J. 22, 276–
283.
Senesi, N., 1999. Aggregation patterns and macromolecular morphology
of humic substances: a fractal approach. Soil Sci. 164, 841–856.
Shaw, D.J., 1980. Introduction to Colloid and Surface Chemistry.
Butterworths, London.
Sposito, G., 1984. The Surface Chemistry of Soil. Oxford University Press,
New York.
Stevenson, F.J., 1994. Humic Chemistry: Genesis, Composition and
Reactions. Wiley-Interscience, New York.
Tipping, E., Higgins, D.C., 1982. The effect of adsorbed humic substances
on the colloid stability of haematite particles. Colloids Surfaces 5, 85–
92.
Thurman, E.M., 1985. Organic Geochemistry of Natural Waters. Mar-
tinus Nijhoff/Junk Publishers, Dordrecht.
Vermeer, A.W.P., Riemsdijk, W.H., Koopal, L.K., 1998. Adsorption of
humic acid to mineral particles. 1. Specific and electrostatic interac-
tions. Langmuir 14, 2810–2819.
Zhang, F.S., Nriagu, J.O., Itoh, H., 2005. Mercury removal from water
using activated carbons derived from organic sewage sludge. Water
Res. 39, 389–395.
Zhou, P., Yan, H., Gu, B., 2005. Competitive complexation of metal ions
with humic substances. Chemosphere 58, 1327–1337.
A. Jada et al. / Chemosphere 64 (2006) 1287–1295
1295
Document Outline
- Surface charge and adsorption from water onto quartz sand of humic acid
Wyszukiwarka
Podobne podstrony:
Mechanisms of arsenic adsorption on
George Alec Effinger City On Sand
How can I minimize nonspecific adsorption on a spr
Characteristic and adsorption properties of iron coated sand
Dune Nighttime shadows on open sand
Adsorption of active ingredients of surface disinfectants depends on the type
Herbert, Brian & Anderson, Kevin Dune SS Coll Nightime Shadows On Open Sand
Characteristic and adsorption properties of iron coated sand
Herbert, Brian & Anderson, Kevin Dune SS Coll Nightime Shadows On Open Sand
The City on the Sand George Alec Effinger
More on hypothesis testing
ZPSBN T 24 ON poprawiony
KIM ON JEST2
Parzuchowski, Purek ON THE DYNAMIC
Foucault On Kant
Adsorpcyjne oczyszczanie wody i ścieków
G B Folland Lectures on Partial Differential Equations
więcej podobnych podstron