
Effect of clays, metal oxides, and organic matter
on rhamnolipid biosurfactant sorption by soil
Francisco J. Ochoa-Loza
a,1
, Wouter H. Noordman
b,2
, Dick B. Jannsen
b
,
Mark L. Brusseau
a
, Raina M. Maier
a,*
a
Department of Soil, Water and Environmental Science, University of Arizona, Tucson, AZ, 85721, United States
b
Department of Biochemistry, Groningen Biomolecular Sciences and Biotechnology Institute, University of Groningen,
Nijenborgh 4, 9747 AG Groningen, The Netherlands
Received 21 May 2005; received in revised form 22 July 2006; accepted 26 July 2006
Available online 11 September 2006
Abstract
Rhamnolipids produced by Pseudomonas aeruginosa have been proposed as soil washing agents for enhanced removal of metal and
organic contaminants from soil. A potential limitation for the application of rhamnolipids is sorption by soil matrix components. The
objective of this study is to empirically determine the contribution of representative soil constituents (clays, metal oxides, and organic
matter) to sorption of the rhamnolipid form most efficient at metal complexation (monorhamnolipid). Sorption studies show that
monorhamnolipid (R1) sorption is concentration dependent. At low R1 concentrations that are relevant for enhancing organic contam-
inant biodegradation, R1 sorption followed the order: hematite (Fe
2
O
3
) > kaolinite > MnO
2
illite Ca-montmorillonite > gibbsite
(Al(OH)
3
) > humic acid-coated silica. At high R1 concentrations, relevant for use in complexation/removal of metals or organics, R1
sorption followed the order: illite >> humic acid-coated silica > Ca-montmorillonite > hematite > MnO
2
> gibbsite
kaolinite. These
results allowed prediction of R1 sorption by a series of six soils. Finally, a comparison of R1 and R2 (dirhamnolipid) shows that the
R1 form sorbs more strongly alone than when in a mixture of both the R1 and R2 forms. The information presented can be used to
estimate, on an individual soil basis, the extent of rhamnolipid sorption. This is important for determining: (1) whether rhamnolipid
addition is a feasible remediation option and (2) the amount of rhamnolipid required to efficiently remove the contaminant.
Ó 2006 Elsevier Ltd. All rights reserved.
Keywords: Biosurfactant; Sorption; Bioremediation; Remediation; Soil washing; Surfactant; Rhamnolipid
1. Introduction
Biosurfactants have gained attention as environmentally
compatible agents that can be used to enhance the remedi-
ation process (e.g.,
Bodour and Maier, 2002; Mulligan,
). Rhamnolipids, produced by Pseudomonas aerugin-
osa, are one of the most widely studied biosurfactants.
Recent research has demonstrated that rhamnolipids or
rhamnolipid-producing isolates (
) have
several potential soil applications. They can increase degra-
dation of hydrophobic organic soil contaminants, enhance
removal of organics by soil flushing, facilitate removal of
soil-bound Cd
2+
, Zn
2+
, and Pb
2+
, and in addition, can
act as natural pesticides for zoosporic plant pathogens
(
Maier and Sobero´n-Cha´vez, 2000
). Pseudomonas sp. pro-
duce rhamnolipids either as the monorhamnolipid (R1)
form, or more frequently, as a mixture of the mono- and
dirhamnolipid (R2) forms. Due to their difference in struc-
ture, the R1 and R2 forms have differing efficacy in envi-
ronmental applications. For example, the R1 form is far
superior at metal complexation (
;
Ochoa-Loza and Maier, unpublished results).
0045-6535/$ - see front matter
Ó 2006 Elsevier Ltd. All rights reserved.
doi:10.1016/j.chemosphere.2006.07.068
*
Corresponding author. Tel.: +1 520 621 7231; fax: +1 520 626 6782.
E-mail address:
(R.M. Maier).
1
Present address: Civil Engineering School, University of Sinaloa,
Culiacan, Sinaloa, Mexico 80040.
2
Present address: NIZO Food Research, Ede, The Netherlands.
www.elsevier.com/locate/chemosphere
Chemosphere 66 (2007) 1634–1642

It is generally considered desirable that surfactants used
for soil remediation have minimal sorptive interactions
once applied to the soil system, i.e., most of the surfactant
should remain in the aqueous phase. While it can be argued
that some sorption might be desirable for enhancing
desorption kinetics of hydrophobic contaminants, several
studies suggest that rhamnolipid sorption by mineral sur-
faces can be of sufficient magnitude to cause a major con-
straint in their application for contaminant removal (
Dyke et al., 1993; Herman et al., 1995; Torrens et al.,
1998
). In fact, surfactant sorption in general is likely the
reason that high concentrations are often required for effec-
tive contaminant removal (
). Thus, sorption of biosurfactants
by the soil matrix is a serious limitation to successful bio-
remediation applications.
The objective of this research is to determine the extent to
which different soil constituents contribute to rhamnolipid,
in particular R1, sorption. Such information will have prac-
tical application for evaluating, on the basis of soil proper-
ties, the suitability and amounts of rhamnolipid required
for treatment. This paper describes a series of batch suspen-
sion experiments performed to determine sorption isotherms
for R1 in the presence of representative soil constituents
comprising the soil solid phase including a variety of clays,
metal oxides, and organic matter. In addition, sorption iso-
therms were measured for a series of soils to determine
whether clay, metal oxide, and organic matter content can
be used to predict R1 sorption. Finally a series of experi-
ments was performed with a R1/R2 mixture to determine
which rhamnolipid species is sorbed preferentially.
2. Materials and methods
2.1. Biosurfactant
Two types of rhamnolipids were used in this study.
Monorhamnolipid was produced by and purified from Pseu-
domonas aeruginosa ATCC 9027 as described earlier (
). This monorhamnolipid contains 80%
C20-R1 and 15% C18-R1 (CXX = number of carbon atoms
in the lipid moiety; RX = number of rhamnose units). A
mixture of R1 and R2 was produced by Pseudomonas aeru-
ginosa UG2 as described by
and puri-
fied by column chromatography over Sephadex LH20 with
methanol as the eluent (
). The R1/
R2 mixture contained 8% C18-R1, 25% C20-R1, 7% C18-
R2, 55% C20-R2, and 5% C22-R2. The average molecular
weights of these biosurfactants are 504 for the ATCC 9027
R1 and 588 for the UG2 R1/R2 mixture. For both biosurf-
actants the critical micelle concentration (CMC) is 0.1 mM
under the conditions used in this study.
2.2. Matrices
A well crystallized kaolinite (Georgia) and Ca-mont-
morillonite (Texas) were obtained from the Clay Mineral
Society reference collection, Department of Geology, Uni-
versity of Missouri and an illite (No. 35. Fithian, Illinois)
was obtained from Ward’s Natural Science (Rochester,
N.Y.). Hematite (Fe
2
O
3
, 99.6% purity), MnO
2
(99.8% pur-
ity), and Al(OH)
3
(100% purity) were purchased from J.T.
Baker (Phillipsburg, NJ). Iron oxide-coated silica (FeOx-
Si) with an Fe
2
O
3
content of 18.4 g kg
1
was obtained from
Sigma Labs (Tucson, AZ). The iron minerals used (hema-
tite and iron oxide-coated silica) may be very different;
no further analyses were performed to identify the iron
oxide minerals coating the silica. Humic acid-coated silica
(HA-Si) was prepared with Acros humic acid (Acros, NJ)
as described previously (
). The
organic carbon content was 22 g kg
1
, as determined using
elemental analysis. The silica (230–400 mesh) was obtained
from Merck (Darmstadt, Germany) and is characterized by
a particle size of 40–60 lm and a pore size of 60 A
˚ . Proper-
ties of these matrices are shown in
A set of six soils was selected in order to provide a wide
range of soil particle distribution, predominant clay min-
eral, total organic content (TOC), and iron oxide content.
Prior to the experiments, all six soils were air-dried and
sieved through a no. 10 standard sieve (2 mm openings).
Properties of these soils are shown in
2.2.1. Preparation of rhamnolipid solutions
To prepare a rhamnolipid solution, a known mass of
purified R1 or R1/R2 mixture was dissolved in a 5 mM
KNO
3
background electrolyte solution and the solutions
were adjusted to pH 6.8 by addition of 0.1 M KOH
(
). The rhamnolipid solutions were
filter-sterilized using a 0.22-lm cellulose acetate filter
(Falcon Easy-Flow filters, Benton Dickinson Labware,
Lincoln Park, NJ) and stored in autoclaved 100-ml glass
bottles.
2.2.2. Rhamnolipid sorption isotherms
Batch experiments were conducted to measure adsorp-
tion of the rhamnolipid by all solid matrices. R1 sorption
by clays (0.5 g), by Al(OH)
3
(0.2 g), and by hematite and
MnO
2
(0.1 g) was measured using solid:solution ratios of
1:10, 1:25, and 1:50, respectively. The R1 sorption experi-
ments for soils (2.5 g) were carried out using a solid:solu-
tion ratio of 1:2, except for the Molokai soil in which a
solid:solution ratio of 1:13 was used. Samples of known
mass of the solid matrices were placed into 40-ml polypro-
pylene centrifuge bottles and conditioned by washing with
5 ml of 5 mM KNO
3
(pH 6.8), prior to addition of the
rhamnolipid, for 2 d at room temperature on a shaker
(100 rpm). Next, the bottles were centrifuged (15 000 rpm,
20 min) and the supernatant discarded. The remaining pel-
lets were autoclaved to inhibit any biodegradation of R1,
and then pellets from triplicate bottles were suspended in
5 ml of 0, 0.62, 1.25, 2.5, 5.0, 6.5, 8.0, or 10 mM R1 pre-
pared as described earlier. After incubating the samples
for 3 d at room temperature at 100 rpm, the bottles were
centrifuged
and
the
rhamnolipid
concentration
was
F.J. Ochoa-Loza et al. / Chemosphere 66 (2007) 1634–1642
1635

Table 2
Chemical properties of the soils used
Soil
(g kg
1
)
Silt
(g kg
1
)
Clay
(g kg
1
)
Clay min.
pH
(g kg
1
)
(g kg
1
)
Al
(g kg
1
)
Exchangeable bases
(g kg
1
)
Sum of bases
(cmol
c
kg
1
)
Exchangeable
acidity
(cmol
c
kg
1
)
Sum of acidity
(cmol
c
kg
1
)
CEC
(cmol
c
kg
1
)
Surface area
(m
2
g
1
)
Na
+
K
+
Ca
2+
Mg
2+
Al
3+
H
+
Pierre
96
409
495
MT4,IL3,KK2,QZ2
7.5
14.6
21.4
1.9
0.1
1.5
65
14
81
–
–
–
81
161
Barnes
395
359
246
MT3,IL3,KK2
5.6
32.6
12.9
1.9
2.5
28
10
40
–
–
10
50
73.4
Bonify
912
55
33
KK2,GEl,GI1
5.4
3.2
2.9
1.9
0.1
0.1
1.4
0.2
1.8
–
1.8
1.8
3.6
10.5
Gaston
355
254
391
KK5,HE2,GE2,GI2
5.7
11.2
64.4
9.5
0.8
9.6
3.6
1.4
–
7.2
7.2
21
62.9
Molokai
125
306
569
KK4,GI3,1L2
6.2
7.9
230
3.2
0.1
1.3
4.8
1.2
7.4
4.2
0.3
4.5
12
167
Andisol
380
523
97
AL2,IM2
6.2
36.3
38.2
11.5
0.1
3.1
48
2.9
51
5.1
0.3
5.4
56
262
a
The pipet method was used for Pierre, Barnes, Bonify, and Gaston, the hydrometer method was used for Molokai and Andisol (
).
b
Clay mineralogy: AL = allophane; GE = goethite; GI = gibbsite; HE = hematite; IL = illite; IM = imogolite; KK = kaolinite; MT = montmorillonite; QZ = quartz. The number indicates the
amount of each mineral present; (5) very large, (4) large, (3) moderate, (2) small, (1) very small.
c
Soil:water ratio 1:1 (
d
Determined by Walkley–Black method (
e
As Fe
2
O
3
and Al
2
O
3
, respectively. Iron and aluminum extracted by the dithionate-citrate method (
).
f
Exchangeable bases determined by NH
4
/Na-acetate, pH 7.0 (
).
g
Exchangeable acidity determined by extraction with 1 M KC1 (
h
CEC = effective cation exchange capacity (
).
i
Determined by EGME (ethylene glycol monoethyl ether) method (
).
j
tr = trace.
Table 1
Chemical and physical properties of soil constituents used
Soil
constituent
Exchange bases
Sum of bases
(cmol
c
kg
1
)
Exchangeable acidity
Sum of acidity
(cmol
c
kg
1
)
(cmol
c
kg
1
)
Surface area
(m
2
g
1
)
Na
+
(cmol
c
kg
1
)
K
+
(cmol
c
kg
1
)
Ca
2+
(cmol
c
kg
1
)
Mg
2+
(cmol
c
kg
1
)
Al
3+
(cmol
c
kg
1
)
H
+
(cmol
c
kg
1
)
Kaolinite
4.52
0.05
0.6
0.3
0.1
1.1
1.5
0.6
2.1
4.6
11.0
Illite
7.57
0.06
1.9
79
1.3
83
–
–
–
2.4
157
Ca-Mont.
7.44
1.7
3.0
150
19
170
–
–
–
170
2.5
708
Hematite
6.75
–
–
–
–
–
–
0.04
0.04
8.3
8.2
MnO
2
4.22
–
–
–
–
–
–
0.06
0.06
7.2
2.4
Al(OH)
3
6.90
–
–
–
–
–
–
0.04
0.04
6.5
1.6
FeOx-Si
3.90
–
–
–
–
–
–
5.0
5.0
16
–
328
HA-Si
5.50
–
–
–
–
n.d.
n.d.
–
219
a
Soil:water ratio 1:4 (
b
Determined by NH
4
/Na-acetate, pH 6.8 (
).
c
Determined by extraction with 1 M KC1 (
).
d
CEC = effective cation exchange capacity (
).
e
Sum of exchangeable bases and exchangeable acidity.
f
PZC = point of zero charge. From
Schwarzenbach et al. (1993), Stumm and Morgan (1981) and Gebhardt and Fuerstneau (1984)
.
g
Determined by EGME (ethylene glycol monoethyl ether) method (
).
h
Not determined.
1636
F.J.
Ochoa-L
oza
et
al.
/
Chemosph
ere
66
(2007)
1634–1642

determined as described below. The amount of rhamnoli-
pid adsorbed was obtained from the difference between
rhamnolipid recovered from the supernatant and rhamnoli-
pid originally added. Biosurfactant loss due to sorption to
container surfaces was negligible.
The isotherms for R1 and the C20-R1 and C20-R2 com-
ponents from the R1/R2 mixture in untreated silica (0.2 or
0.5 g for R1 and R1/R2 mixture, respectively), FeOx-Si
(0.2 g), and HA-Si (0.2 g) were performed in a solid:solu-
tion ratio of 1:10. These isotherms were measured using
the procedure described above with some modifications.
The solid matrix was transferred in triplicate into 8-ml
pyrex tubes stoppered with aluminum coated septa, and
suspended in 2 ml of 5 mM KNO
3
(pH 6.8) containing 0,
0.2, 0.4, 0.6, 1.2, 1.8, and 2.4 mM R1 or R1/R2 mixture.
An additional R1 concentration of 4 mM was used for
the untreated silica isotherm. After incubation for 16 h in
an end-over-end shaker, the samples were centrifuged
(3000 rpm, 12 min) and the supernatant removed for direct
analysis by HPLC. Preliminary experiments showed that
Table 3
Monorhamnolipid (R1) isotherms and parameters for mineral constituents and soils used in this study
Mineral or soil
Ratio
Freundlich
Langmuir
Regression analysis
K
f
n
SE
K
1
SE
b
SE
r
2
F-test
a
Kaolinite
1:10
1790
597
0.33
0.04
0.97
150
0.01
Illite
1:10
7.2
4.5
1.67
0.12
0.99
396
0.01
Ca-Mont.
1:10
41.2
14.0
1.20
0.06
0.99
1010
0.01
Hematite
1:50
2100
995
0.50
0.06
0.97
163
0.01
MnO
2
1:50
434
261
0.62
0.08
0.96
129
0.01
Al(OH)
3
1:25
167
195
0.73
0.15
0.92
56.5
0.01
FeOx-Si
1:10
547
266
0.27
0.08
0.91
19.9
0.05
HA-Si
1:10
0.0063
0.04
2.69
1.19
0.83
14.3
0.05
Si
1:10
0.00104
0.0008
12006
5709
0.87
33.2
0.01
Pierre
1:2
5.84
7.32
1.61
0.28
0.96
105
0.01
Barnes
1:2
330
49.1
0.37
0.02
0.99
562
0.01
1:2
1.53
2.74
1.01
0.23
0.01
Gaston
1:2
0.0031
0.0005
14438
1159
0.99
741
0.01
Molokai
1:13
0.0308
0.0066
80706
7195
0.97
189
0.01
Andisol
1:2
152
23.2
0.51
0.02
0.99
1940
0.01
a
For each case, the data were analyzed using the Freundlich, Langmuir, and Linear isotherm equations. The coefficients are reported only for the
isotherm that provided the most robust fit.
b
Solid:solution.
c
SE = standard error.
d
Only C20-R1 concentration determined.
e
For the Bonifay soil the linear isotherm had an r
2
-value equivalent to the Freundlich isotherm.
Table 4
A comparison of the best isotherms and parameters for selected soil constituents and the C20-R1 and C20-R2 species of an R1/R2 mixture with the R1
species alone
Soil constituent
Ratio
Freundlich
Langmuir
Linear
Regression analysis
K
f
SE
n
SE
K
1
SE
b
SE
Coefficient
SE
r
2
F-test
a
Kaolinite
1:40
0.047
0.03
2669
562.7
0.76
12.9
0.05
1:40
0.120
0.08
1272
130.3
0.55
4.9
0.1
R1
1:40
0.033
0.02
7699
1537
0.79
11.6
0.05
FeOx-Si
C20-R1
1:10
0.054
0.02
290.8
44.9
0.89
30.9
0.01
C20-R2
1:10
0.088
0.03
308.5
21.1
0.91
38.6
0.01
R1
1:10
547
266
0.27
0.08
0.91
19.9
0.05
HA-Si
C20-R1
1:10
3.92
1.34
1.08
0.08
5.45
0.17
0.01
C20-R2
1:10
5.78
4.89
0.91
0.16
3.61
0.24
0.01
R1
1:10
0.0063
0.04
2.69
1.19
0.83
14.3
0.05
a
C20-R1 = R1 species from R1/R2 mixture.
b
C20-R2 = R2 species from R1/R2 mixture.
c
R1 = All of the R1 species in the R1.
d
For both models.
e
Only for Freundlich model.
F.J. Ochoa-Loza et al. / Chemosphere 66 (2007) 1634–1642
1637

rhamnolipid sorption reached equilibrium within 1 h on
the silica matrices.
2.2.2.1. Analytical procedures. The rhamnolipid concentra-
tions in stock solutions were measured using the 6-deoxyhex-
ose assay with L-rhamnose as a standard (
). For most experiments, aqueous rhamn-
olipid concentrations were determined by surface tension
analysis using a surface tensiomat (Model 21, Fisher Scien-
tific) that employs the Du Nouy ring method. All solutions
were diluted to below the CMC prior to surface tension mea-
surement. A calibration curve was prepared under identical
experimental conditions using rhamnolipid standards and
relating rhamnolipid concentration (mg l
1
) to surface ten-
sion (mN m
1
).
For experiments with the R1/R2 mixtures, in particular
for FeOx-Si, HA-Si and kaolinite, concentrations of spe-
cific rhamnolipids (C20-R1 and C20-R2) were determined
by HPLC (
). The detection limit
was 5 mg l
1
for each rhamnolipid. The relative concentra-
tions of the rhamnolipid species (C20-R1 and C20-R2)
were determined from their respective areas in the calibra-
tion sample at 1000 mg l
1
. Separate calibration curves
were determined for each species.
2.2.2.2. Sorption isotherm analysis. A nonlinear least
squares regression analysis program was used to fit sorp-
tion isotherm data to two of the more commonly used
adsorption models, the Freundlich equation and the Lang-
muir equation. If the isotherm data approximated a
straight line for either of these equations, then a regression
using a linear equation was also performed. Using the cri-
teria of r-squared, standard error, and F-value of the model
regression analysis, the equation that fit each particular iso-
therm best was chosen (
). The fitting param-
eters were used to define the relative importance among the
different solid matrix characteristics with regard to rham-
nolipid sorption.
3. Results and discussion
The results and discussion section is organized into three
parts. In the first part, sorption results of R1 by clays,
metal oxides, and humic acid is presented. In the second
part, the relative contribution of each soil constituent is
discussed and used to interpret sorption of R1 by the differ-
ent soils tested. Finally, the sorption of different rhamnoli-
pid species (R1 and R2) by a representative clay (kaolinite),
metal oxide (FeOx-Si), and organic matter (HA-Si) is
discussed.
3.1. Part 1 – sorption of monorhamnolipid to clays, metal
oxides, and humic acid
Three clay minerals were tested as sorbents; illite, mont-
morillonite, and kaolinite. Note that R1 was added in eight
concentrations: 0, 0.62, 1.25, 2.5, 5.0, 6.5, 8.0, or 10 mM,
all substantially above the CMC of 0.1 mM. Thus, these
solutions contain a mixture of surfactant monomers (equal
to the CMC concentration) and aggregates that will exhibit
complex behavior when added to a sorbent. Note that after
sorption equilibrium, the solution-phase rhamnolipid con-
centration may be less than CMC in which case, only
monomers would be present.
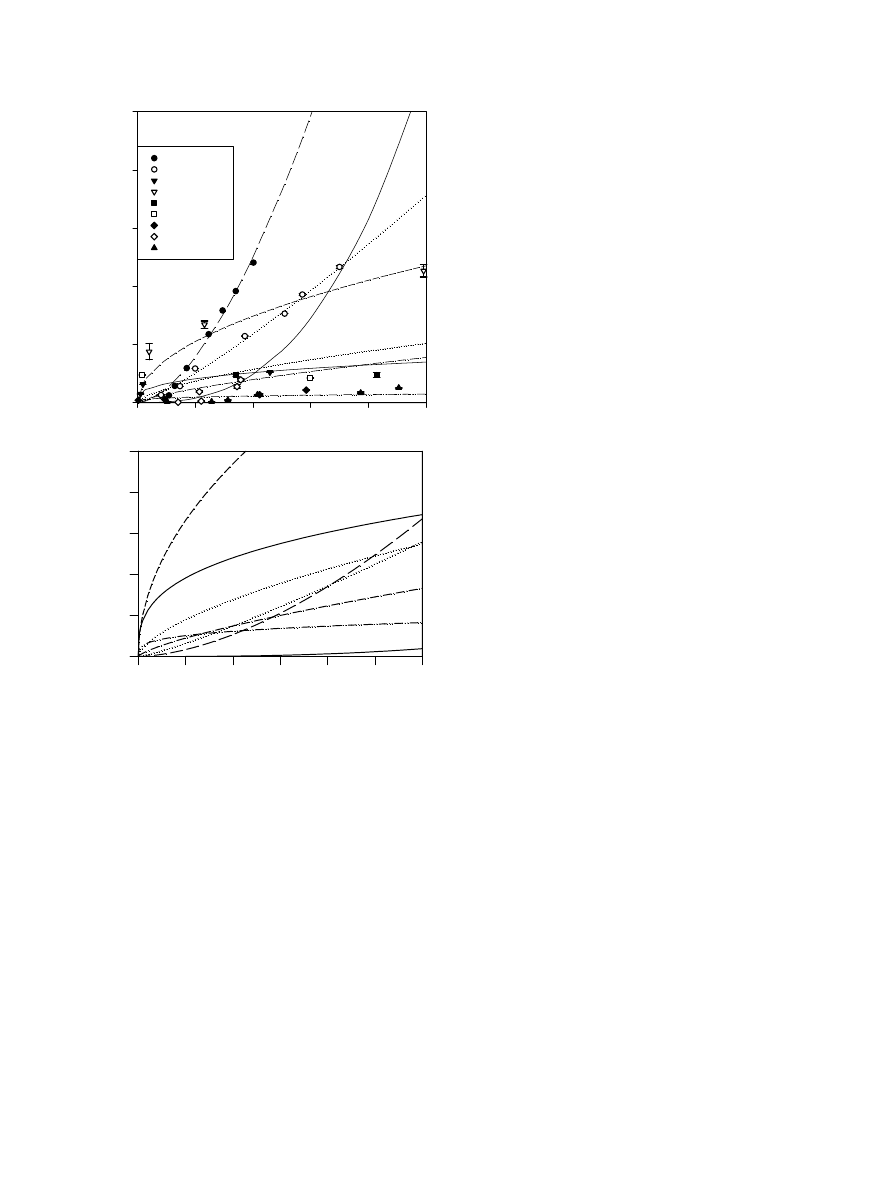
Sorption of R1 to the clay minerals was nonlinear and
the clay-R1 isotherms fitted well with the Freundlich equa-
tion (
). The R1 isotherms for kaolinite, illite, and
Ca-montmorillonite exhibit different shapes as well as mag-
nitudes of associated sorption (
A). The kaolinite
isotherm is concave (n = 0.33), whereas those for illite
and Ca-montmorillonite are convex (n = 1.67 and 1.22,
respectively). At low R1 concentrations kaolinite had the
strongest affinity for R1, however, as the R1 concentration
was increased, sorption increased greatly for illite and Ca-
montmorillonite in contrast to kaolinite. The behavior for
illite and Ca-montmorillonite is typical of two-step adsorp-
tion behavior that has been observed for synthetic anionic
surfactants. In this case, following sorption of a layer of
individual monomers, a significant increase in sorption
occurs as surfactant hemimicelles form on the surface
(e.g.,
Four different metal oxides were used in this study; hema-
tite (Fe
2
O
3
), MnO
2
, gibbsite (Al(OH)
3
), and iron-oxide
coated silica (FeOx-Si). The R1-metal oxide isotherms were
nonlinear and followed the order: hematite > MnO
2
> gibb-
site > FeOx-Si for the entire range of rhamnolipid concen-
trations tested (
A). They all fitted best with
the Freundlich model and have similar shapes (n-values < 1).
The fact that the iron oxide matrices occupy the first (hema-
tite) and the last (FeOx-Si) position of this sequence is due, in
part, to the difference in their Fe
2
O
3
content (995 and
18.4 g kg
1
, respectively). It should be noted that a lower
R1 concentration range was used for the FeOx-Si isotherm
(0–2.4 mM) and only the sorption of the C20-R1 fraction
was quantified.
Finally, R1 sorption by an untreated and humic acid-
coated silica (HA-Si) was evaluated. The R1-HA-Si iso-
therm was nonlinear and convex indicating a high affinity
of R1 for humic acid at high rhamnolipid concentrations
(
A). These data fitted best with the Freund-
lich equation (n-value = 2.69). For untreated silica, sorp-
tion was similar to HA-Si at low R1 concentrations, but
at high R1 concentrations was much lower. The R1-
untreated silica isotherm had an S-shape which fitted the
Langmuir equation best (
A). The sorption
behavior for these two types of silica is similar to a previ-
ously reported rhamnolipid sorption study that was carried
out under saturated flow conditions (
). In this study, the magnitude of sorption for R1
at 20 mg l
1
(0.04 mM) was similar for silica and HA-silica,
but at 500 mg l
1
(1 mM), sorption was much higher for
HA-silica. The untreated silica isotherm can also be com-
pared to a R1 isotherm using Accusand 40/50 mesh (0.3–
1638
F.J. Ochoa-Loza et al. / Chemosphere 66 (2007) 1634–1642
0.42 mm) that was reported by
. The
Accusand study reported 10-fold less R1 sorbed than for
the silica tested in this study. This difference can be
explained by the specific surface areas of these matrices
that differ by over two orders of magnitude (
).
A comparison of the rhamnolipid sorption isotherms for
all the soil parameters tested indicates that both aluminos-
ilicates and iron oxide minerals are critical to the sorption
of this anionic biosurfactant and that since sorption is non-
linear, there are large differences in sorption at low and high
concentrations of rhamnolipid. At low R1 concentrations,
the relative order of importance is: hematite > kaolinite >
MnO
2
illite Ca-montmorillonite > gibbsite > FeOx-
Si > HA-Si (
B). However, at rhamnolipid concentra-
tions greater than 400 mg kg
1
(0.8 mM), the order
changes to: illite >> HA-Si > Ca-montmorillonite > hema-
tite > MnO
2
> gibbsite
kaolinite (note that for the pur-
pose of this comparison we have extrapolated the illite,
HA-Si, and Ca-montmorillonite isotherms beyond the
experimental data points collected). The fact that the clay
fraction has a significant contribution to the sorption of
an anionic biosurfactant is at variance with what has been
previously reported in some early studies (
), but is similar to results reported
more recently by
). This sorption
may be considered to be analogous to sorption of humic
components to soil clay minerals. It has been demonstrated
that sorption of humic and fulvic acid to clays is enhanced
by the presence of di- and trivalent cations occupying the
exchange positions (
Greenland, 1971; Theng and Scharpen-
seel, 1975; Theng, 1976; Davis, 1982; Murphy et al., 1992
Of the iron oxides, hematite shows a significant contribu-
tion to sorption at all surfactant concentrations, which is
not surprising since electrostatic interactions are likely
involved. These are due to the high zero point of charge
which results in a net positive charge at the neutral pH that
these experiments were performed. Of the metal oxides,
gibbsite [Al(OH)
3
] has the lowest contribution to R1 sorp-
tion likely because it has the lowest point of zero charge
and the lowest surface area (
). The results with
HA-Si suggest that the humic acid content in soil, at least
up to a TOC content of 20 g kg
1
, is not critical for deter-
mining rhamnolipid sorption at low rhamnolipid concen-
trations. A similar conclusion was reached in a study of
rhamnolipid sorption to four sandy soils (
). In general, we conclude that hematite, illite,
kaolinite, and Ca-montmorillonite are the most important
soil constituents exerting the greatest effect on R1 sorption.
3.2. Part 2 – monorhamnolipid sorption by different soils
In light of the results obtained with the soil constituents
tested, it seems that R1 sorption in a natural system will
depend largely on the sorbent properties including: chemi-
cal (mineralogical and organic) composition, the relative
proportion of the constituents comprising the solid phase,
as well as the concentration of rhamnolipid in the aqueous
phase. Thus, it is reasonable to hypothesize that the magni-
tude of R1 sorption by soils may be predicted based on the
knowledge of their mineral and chemical composition. To
test this hypothesis, the sorption of R1 by six different soils
was measured (
). Based upon the data in
, in
particular the clay (amount and type) and iron content, we
predicted the following order of sorption: Molokai >
Gaston > Pierre > Barnes > Andisol > Bonify.
Each of the soil-R1 isotherms fitted either the Freund-
lich or Langmuir equation well (
). Rhamnolipid
sorption generally followed the order: Molokai > Pierre >
Gaston > Barnes
Andisol > Bonify which was similar
R1 in Solution (mg l
-1
)
0
10
20
30
40
50
60
R1 Sorbed (m
g kg
-1
)
0
2000
4000
6000
8000
10000
0
100
200
300
400
500
0
20000
40000
60000
80000
100000
Illite
Montmorillinite
Kaolinite
Hematite
MnO
2
Gibbsite
Fe-Ox-silica
HA-silica
Silica
HA-Si*
Montmorillonite*
Hematite
MnO
2
Gibbsite
Kaolinite
FeOx-Si
Hematite
MnO
2
HA-Si
Gibbsite
FeOx-Si
Illite
Kaolinite
Montmorillonite
R1 Sorbed (m
g kg
-1
)
A
B
Illite*
Fig. 1. A comparison of R1 sorption by all soil constituents tested. The
symbols indicate experimentally determined data points. The lines
represent isotherms that are based on the equation that best fitted each
experimentally determined soil constituent isotherm. (A) The experimental
data and fitted isotherms for the entire data set. The starred isotherms
(Illite
*
, HA-Si
*
, and Montmorillonite
*
) have been extrapolated beyond the
experimental data points collected. Note that not all experimental points
are represented because the abscissa is cut off at 500 mg l
1
. (B) The fitted
isotherm lines at low solution phase R1 concentrations (<60 mg l
1
). Note
that there are no experimental data points at these low concentrations.
F.J. Ochoa-Loza et al. / Chemosphere 66 (2007) 1634–1642
1639
to our prediction. The lowest sorption of R1 was observed
for the Bonify soil, the soil with the lowest clay (33 g kg
1
),
iron (2.9 g kg
1
) and TOC (3.2 g kg
1
) content (
). In
contrast, the greatest R1 sorption corresponded to the Mol-
okai and Pierre soils. The Molokai soil is characterized by a
high iron content (230 g kg
1
) and high clay content
(569 g kg
1
) dominated by gibbsite and kaolinite. The
Pierre soil is distinguished from the other soils by its rela-
tively high clay content (495 g kg
1
) and in particular, its
large component of layer silicate minerals predominated
by montmorillonite and illite (
). In fact, the Pierre
soil isotherm was very similar to that obtained for illite sug-
gesting that this aluminosilicate mineral dominated the
sorption process in this soil (
). The Gaston soil
sorbed R1 much less strongly than either Molokai or Pierre
despite its relatively high clay (391 g kg
1
, dominated by
kaolinite) and iron (64.4 g kg
1
) content. The Barnes and
Andisol soils exhibited moderate R1 sorption in compari-
son to the Molokai and Pierre soils due to their lower com-
bined iron and clay contents. These two soils have the
highest TOC content of the soils studied (
). This sug-
gests that soil organic matter is much less important than
clays and iron oxides in the sorption of R1 as noted above.
These results are in good agreement with previous work
from our lab demonstrating the ability of rhamnolipids to
remove soil-bound metals under saturated flow conditions
(
). Removal of Cd
2+
from soils ranged
from 44% to 102% using a 10 mM solution of an R1/R2
mixture produced by Pseudomonas aeruginosa IGB83.
The metal removal was most rapid and complete in the soil
with the lowest clay, iron oxide, and TOC content. The
poorest removal was in the soil with highest clay content.
3.3. Part 3 – sorption of specific rhamnolipid constituents
The R1 biosurfactant produced by Pseudomonas aeru-
ginosa ATCC 9027 has been characterized as a mixture
of four R1 forms that differ only in the length of the two
fatty acid tails (
). The predominant
species in this mixture (80%) contains two C10 fatty acids
and is referred to as the C20-R1 species. However, other
strains of Pseudomonas aeruginosa produce rhamnolipid
mixtures containing both R1 and R2 form. Recent research
in both our lab and other labs with R1/R2 combinations
suggests that it may be advantageous to use such mixtures
(
Torrens et al., 1998; Mata-Sandoval et al., 2002
). We pos-
tulated that a mixture of R1 and R2 might sorb less
R1 in Solution (mg l
-1
)
0
100
200
R1 Sorbed (mg k
g
-1
)
0
20000
40000
60000
Pierre
Bonify
Gaston
Molokai
Andisol, Barnes
R1 (mg l
-1
)
0
10
20
30
40
50
R1 (m
g K
g
-1
)
0
1000
2000
3000
Molokai
Bonify
Pierre
Gaston
Barnes
Andisol
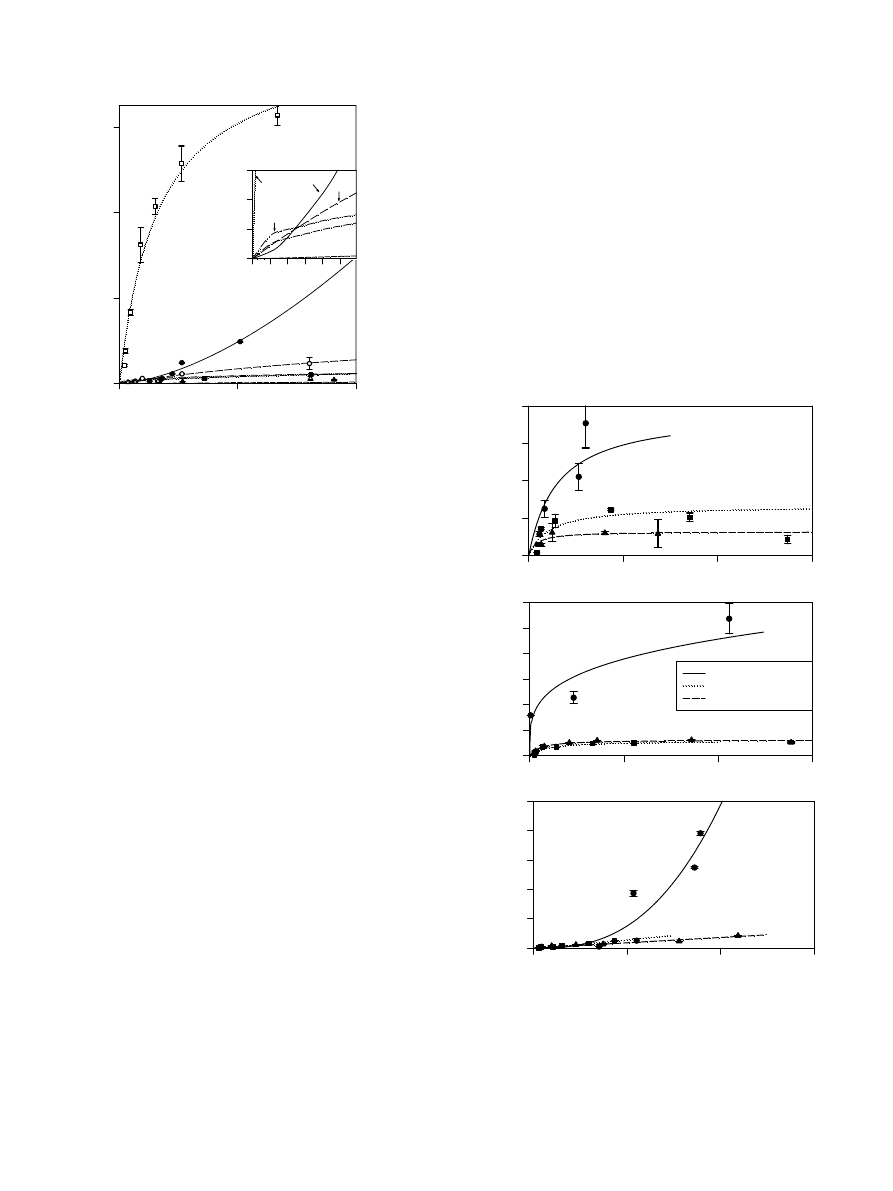
Fig. 2. A comparison of R1 sorption by the six soils tested. Symbols
represent experiment data points and lines represent isotherms based on
the equation that best fitted each experimentally determined soil isotherm.
Note that in the inset there are no experimental data points.
0
100
200
300
0
500
1000
1500
2000
2500
3000
0
100
200
300
0
2000
4000
6000
8000
C20-R1 (ATCC 9027)
C20-R1 (UG2 mix)
C20-R2 (UG2 mix)
Kaolinite
FeOx-Si
Rhamnolipid in Solution (mg l
-1
)
0
100
200
300
S
o
rbed Rhamnoli
pid (mg kg
-1
)
0
2000
4000
6000
8000
10000
HA-Si
Fig. 3. A comparison of the sorption of R1 alone (from ATCC 9027) with
R1 when it is in a R1/R2 mixture (from UG2) by kaolinite, iron oxide-
coated silica (FeOx-Si), and humic acid-coated silica (HA-Si). In each
case, only the C20-R1 and the C20-R2 forms were measured. For ATCC
9027, the C20-R1 form comprises 80% of the rhamnolipid. For UG2
mixture, the C20-R1 and C20-R2 forms comprise 25% and 55%,
respectively. The isotherms are based on the equation that best fitted
each experimentally determined isotherm.
1640
F.J. Ochoa-Loza et al. / Chemosphere 66 (2007) 1634–1642

strongly than R1 alone due to the more hydrophilic nature
of R2. In order to gain more insight into the behavior of
these rhamnolipid species, and the possible impact of spe-
cies mixtures on sorption, a series of sorption experiments
were performed using kaolinite, FeOx-Si, and HA-Si and
an R1/R2 mixture produced by Pseudomonas aeruginosa
UG2. The R1/R2 mixture consisted mainly of the C20-
R1 component (25%) and the C20-R2 component (55%)
(
).
An analysis of the sorption behavior of the R1 and R2
species by kaolinite, FeOx-Si and Ha-Si shows that the
R1 form alone sorbed more strongly to all materials than
the R1 or R2 components when added as a mixture (
,
). Specifically, for kaolinite the C20-R1 form
sorbed 3-fold more strongly alone than when in the pres-
ence of C20-R2. For FeOx-Si and HA-Si, the C20-R1 form
sorbed 10-fold and 30-fold more strongly alone than when
in the presence of C20-R2. Further, the sorption of the
R1reached a plateau at much lower aqueous concentra-
tions when the C20-R2 was present. These results show
that the sorption of the R1 and R2 components are not
independent of each other. These data clearly suggest that
despite the fact that the R1 form is more effective than the
R2 form for some applications such as metal removal,
application of rhamnolipids to soil may be most effective
as a mixed R1/R2 system. Use of a R1/R2 mixture should
decrease sorption of the R1 form by up to several orders of
magnitude depending on the predominant soil constituent
present.
4. Conclusions
The efficiency and success of biosurfactants in facilitat-
ing removal of organic and inorganic contaminants from
soil systems will depend largely on the amount of rhamn-
olipid present in the aqueous phase. These results show
that sorption of R1 by soil can be semi-quantitatively pre-
dicted by considering the iron oxide (Fe
2
O
3
) content as well
as the clay content and predominant clay type. Soils that
have a low content of aluminosilicate minerals and iron
oxides are likely to exhibit relatively low sorption of R1.
This is in good agreement with previous research reported
about the adsorption of organic anions by iron and alumi-
num hydrous oxides (
Evans and Russell, 1959; Greenland,
1971; Parfitt et al., 1977a,b,c
), and of an anionic synthetic
surfactant by soils (
The findings of this study suggest that there may be seri-
ous limitations in the application of R1 as an in situ tech-
nology for remediation of certain soils (e.g., those with
high iron and/or illite content). However, the results pre-
sented herein, concerning the impact of soil mineralogical
and chemical composition on R1 sorption, will allow
improved consideration of whether rhamnolipid may serve
as a good reagent option and what rhamnolipid dose will
be required to maximize the aqueous phase concentration
of rhamnolipid. It is also suggested that addition of R1
as an R1/R2 mixture will increase the aqueous phase con-
centration of the R1 component thus making it more avail-
able for remediation.
Acknowledgements
This work was supported in by grant CHE-0133237
from the National Science Foundation, grant E504940
from the Superfund Basic Research Program, National
Institute of Environmental Health Sciences, NIH, and by
grant SIR 14-1548 from the Dutch organization for scien-
tific research (NWO).
References
Bai, G., Brusseau, M.L., Miller, R.M., 1997. Biosurfactant-enhanced
removal of residual hydrocarbon from soil. J. Contam. Hydrol. 25,
157–170.
Bodour, A.A., Maier, R.M., 2002. Biosurfactants: types, screening
methods, and applications. In: Bitton, G. (Ed.), Encyclopedia of
Environmental Microbiology. John Wiley and Sons, pp. 750–770.
Chandrasekaran, E.V., BeMiller, J.N., 1980. Constituents analysis of
glycoaminoglycans. In: Whistler, R.L., BeMiller, J.N. (Eds.), Methods
in Carbohydrate Chemistry, vol. 8. Academic Press, Inc., New York,
pp. 89–96.
Davis, J.A., 1982. Adsorption of natural dissolved organic matter at the
oxide/water interface. Geochim. Comochim. Acta 46, 2381–2393.
Dean, S.M., Jin, Y., Cha, D.K., Wilson, S.V., Radosevich, M., 2001.
Phenanthrene degradation in soils co-inoculationed with phenan-
threne-degrading and biosurfactant-producing bacteria. J. Environ.
Qual. 30, 1126–1133.
Evans, L.T., Russell, E.W., 1959. The adsorption of humic acid and fulvic
acids by clays. J. Soil Sci. 10, 119–132.
Fink, D.H., Thomas, G.W., Meyer, W.J., 1970. Adsorption of anionic
detergents by soils. J. Water Pollut. Control Fed. 42, 265–271.
Gebhardt, J.E., Fuerstneau, D.W., 1984. The effect of preadsorbed
polymers on adsorption of sodium dodecylsulfonate on hematite. In:
Rosen, M.J. (Ed.), Structure/Performance Relationships in Surfac-
tants, Am. Chem. Soc. Symposium Series, 253. American Chemical
Society, Washington, DC, pp. 291–310.
Greenland, D.J., 1971. Interactions between humic and fulvic acids and
clays. Soil Sci. 111, 34–41.
Herman, D.C., Artiola, J.F., Miller, R.M., 1995. Removal of cadmium,
lead, and zinc from soil by a rhamnolipid biosurfactant. Environ. Sci.
Technol. 29, 2280–2285.
Kennedy, M.J., Pevear, D.R., Hill, R.J., 2002. Mineral surface control of
organic carbon in black shale. Sci. 295, 657–660.
Klute, A. (Ed.), 1986. Methods of Soil Analysis: Part 1 Physical and
Mineralogical Methods, second ed. ASA-SSSA, Madison, WI.
Law Jr., J.P., Kunze, G.W., 1966. Reactions of surfactants with
montmorillonite: adsorption mechanisms. Soil Sci. Soc. Am. Proc.
30, 321–327.
Law Jr., J.P., Bloodworth, M.E., Runkles, J.R., 1966. Reactions of
surfactants with montmorillonitic soils. Soil Sci. Soc. Am. Proc. 30,
327–332.
Maier, R.M., Sobero´n-Cha´vez, G., 2000. Pseudomonas aeruginosa rham-
nolipids: biosynthesis and potential environmental applications. Appl.
Microbiol. Biotechnol. 54, 625–633.
Mata-Sandoval, J.C., Karns, J., Torrents, A., 2002. Influence of rhamn-
olipids and Triton X-100 on the desorption of pesticides from soils.
Environ. Sci. Technol. 36, 4669–4675.
Mulligan, C.N., 2005. Environmental applications for biosurfactants.
Environ. Poll. 133, 183–198.
Murphy, E.M., Zachara, J.M., Smith, S.C., Phillips, J.L., 1992. The
sorption of humic acids to mineral surfaces and their role in
contaminant binding. Sci. Total Environ. (117/118), 413–423.
F.J. Ochoa-Loza et al. / Chemosphere 66 (2007) 1634–1642
1641

Noordman, W.H., Bruining, J.-W., Wietzes, P., Janssen, D.B., 2000a.
Facilitated transport of a PAH mixture by a rhamnolipid biosurfactant
in porous silica matrices. J. Contam. Hydrol. 44, 119–140.
Noordman, W.H., Brusseau, M.L., Janssen, D.B., 2000b. Adsorption of a
multicomponent rhamnolipid surfactant to soil. Environ. Sci. Technol.
34, 832–838.
Noordman, W.H., DeBoer, G.J., Volkering, F., Janssen, D.B., 2000c.
Assessment of the use of partitioning and interfacial tracers to
determine the content and mass removal rates of non-aqueous phase
liquids. Environ. Sci. Technol. 34, 4301–4306.
Ochoa-Loza, F.J., Artiola, J.F., Maier, R.M., 2001. Stability constants for
the complexation of various metals with a rhamnolipid biosurfactant.
J. Environ. Qual. 30, 479–485.
Parfitt, R.L., Farmer, V.C., Russell, J.D., 1977a. Adsorption on hydrous
oxides I. Oxalate and benzoate on goethite. J. Soil Sci. 28, 29–39.
Parfitt, R.L., Fraser, A.R., Russell, J.D., Farmer, V.C., 1977b. Adsorption
on hydrous oxides II. Oxalate, benzoate and phosphate on gibbsite. J.
Soil Sci. 28, 40–47.
Parfitt, R.L., Fraser, A.R., Farmer, V.C., 1977c. Adsorption on hydrous
oxides III. Fulvic acid and humic acid on goethite, gibbsite, and
imogolite. J. Soil Sci. 28, 289–296.
Schwarzenbach, R.P., Gschwend, P.M., Imboden, D.M., 1993. Environ-
mental Organic Chemistry. John Wiley and Sons, New York.
Sparks, D.L., Page, A.L., Helmke, P.A., Loeppert, R.H., Soltanpour,
P.N., Tabatabai, M.A., Johnston, C.T., Sumner, M.E. (Eds.), 1996.
Methods of Soil Analysis: Part 3 Chemical Methods. SSSA, Madison,
WI.
Stumm, W., Morgan, J.J., 1981. Aquatic Chemistry. John Wiley and Sons,
New York.
Theng, B.K.G., 1976. Interactions between montmorillonite and fulvic
acid. Geoderma 15, 245–251.
Theng, B.K.G., Scharpenseel, H.W., 1975. The adsorption of
14
C-labeled
humic acid by montmorillonite. In: Proc. Int. Clay Conf., Mexico City,
pp. 643–653.
Torrens, J.L., Herman, D.C., Miller, R.M., 1998. Biosurfactant (rhamn-
olipid) sorption and the impact on rhamnolipid-facilitated removal
of cadmium from various soils. Environ. Sci. Technol. 32, 776–
781.
Van Dyke, M.I., Couture, P., Brauer, M., Lee, H., Trevors, J.T., 1993.
Pseudomonas aeruginosa UG2 rhamnolipid biosurfactants: structural
characterization and their use in removing hydrophobic compounds
from soil. Can. J. Microbiol. 39, 1071–1078.
Zhang, Y., Miller, R.M., 1992. Enhanced octadecane dispersion and
biodegradation by a Pseudomonas rhamnolipid surfactant (biosurfac-
tant). Appl. Environ. Microbiol. 58, 3276–3282.
Zhang, Y., Miller, R.M., 1994. Effect of a Pseudomonas rhamnolipid
biosurfactant on cell hydrophobicity and biodegradation of octade-
cane. Appl. Environ. Microbiol. 60, 2101–2106.
Zhu, B.Y., Gu, T.R., 1991. Surfactant adsorption at solid liquid interfaces.
Adv. Colloid Interface Sci. 37, 1–32.
1642
F.J. Ochoa-Loza et al. / Chemosphere 66 (2007) 1634–1642
Document Outline
- Effect of clays, metal oxides, and organic matter on rhamnolipid biosurfactant sorption by soil
Wyszukiwarka
Podobne podstrony:
Ćw 3 wytwarzanie powłok metalicznych na podłożu metalicznym i niemetalicznym
Lab1 Badanie odpornosci metali na pekanie w plaskim stanie odksztalcenia
Sprawko?danie metali na zmęczenie
Lab2 Badanie odporności metali na pękanie przez wyznaczenie krytycznej wartości całki J
Metoda-badania-wytrzymalosci-metali-na-zginanie, pwr, Materiałoznawstwo
Ćw 3 wytwarzanie powłok metalicznych na podłożu metalicznym i niemetalicznym
Elektrochemia osadzanie stopów metali na metalach szlachetnych
pisanie na piachu b f
Decoupage technika serwetkowa efekt spękań na szkle(1)
Ćw 3 wytwarzanie powłok metalicznych na podłożu metalicznym i niemetalicznym
Efekt wyprzedaży polskich zakładów Stadiony na Euro 2012 budowane ze stali z Luksemburga
Pojęcia na egzamin z metali, Chemia Fizyczna, chemia fizyczna- laborki rozne, Rozne
MateriałoznawstwoII, pytania na egzamin z metali 2, Pytania na egzamin z materiałoznawstwa 2
WPŁYW PLACEBO NA EFEKT LECZENIA
EFEKT DZIAŁANIA CZYNNIKÓW EKOLOGICZNYCH NA ORGANIZM CZŁOWIEKA 1
ekologia, kwas, Efekt kwaśnych deszczy na populacje ptaków
TERMOGNIWA, Termopar˙, czyli termoogniwo stanowi˙, dwa kawa˙ki drut˙w albo pr˙t˙w z r˙˙nych metali,
Zagr Na st-Obróbka plastyczna metali, Ocena Ryzyka-mat. pomocnicze, Zagrożenia stanowiskowe-DOC
więcej podobnych podstron