
Ž
.
Fuel Processing Technology 54 1998 17–46
Combustion properties of biomass
B.M. Jenkins
a,)
, L.L. Baxter
b
, T.R. Miles Jr.
c
, T.R. Miles
c
a
Department of Biological and Agricultural Engineering, UniÕersity of California, DaÕis, CA, USA
b
Sandia National Laboratories, LiÕermore, CA, USA
c
Thomas R. Miles Consulting Engineers, Portland, OR, USA
Abstract
Properties of biomass relevant to combustion are briefly reviewed. The compositions of
biomass among fuel types are variable, especially with respect to inorganic constituents important
to the critical problems of fouling and slagging. Alkali and alkaline earth metals, in combination
with other fuel elements such as silica and sulfur, and facilitated by the presence of chlorine, are
responsible for many undesirable reactions in combustion furnaces and power boilers. Reductions
in the concentrations of alkali metals and chlorine, created by leaching the elements from the fuel
with water, yield remarkable improvements in ash fusion temperatures and confirm much of what
is suggested regarding the nature of fouling by biomass fuels. Other influences of biomass
composition are observed for the rates of combustion and pollutant emissions. Standardized
engineering practices setting out protocols of analysis and interpretation may prove useful in
reducing unfavorable impacts and industry costs, and further development is encouraged. q 1998
Elsevier Science B.V.
Keywords: Biomass; Alkali; Silica; Slagging; Fouling; Energy
1. Introduction
The conversion of solar energy by plant photosynthesis yields the food energy
supporting animal life on earth. Plant matter, or biomass, has also long served as one of
the primary energy forms utilized by humans for essential activities aside from nutrition.
It will continue to do so, in increasingly economic important ways, into the future. The
energy invested by nature in the production of photosynthates is enormous; incident on
the top of the atmosphere is a continuous radiant power of over 10
17
W. Of this, plants
collect and utilize 0.02%, producing a total annual energy storage of 10
21
J. Plant
)
Corresponding author.
0378-3820r98r$19.00 q 1998 Elsevier Science B.V. All rights reserved.
Ž
.
PII S 0 3 7 8 - 3 8 2 0 9 7 0 0 0 5 9 - 3

(
)
B.M. Jenkins et al.r Fuel Processing Technology 54 1998 17–46
18
photosynthesis also serves as the principal generator of atmospheric oxygen, critical to
the respiration of plants and animals, as well as for the all important combustion
reactions which drive modern human society. Prior to human industrialization, total
energy in biomass was well in excess of human needs. Currently, the total is only a little
better than three times the total human consumption of non-food commercial energy
including all forms—fossil, nuclear, geothermal, gravitational, as well as solar. Biomass
now contributes 6% of global non-food energy consumption, much of this through
primitive low efficiency and highly polluting combustion in poorly controlled heating
and cooking fires which support a major share of the world’s population. Technical
enhancements in the contribution of biomass to commercial energy needs are focused on
improving both the efficiency and environmental impacts of biomass conversion. To this
end, we seek a better understanding of the properties of biomass and their role in
conversion. In this regard, we also seek an understanding of not only how the
conversion technology can be adapted to fit the properties of the biomass fuel, but how
properties of the fuel might be varied to suit the conversion technology of choice.
Plants rely on certain fundamental processes for growth and reproduction, yet have
evolved to accommodate a great diversity of ecosystems and environmental conditions.
Accordingly, they exhibit certain gross similarities in properties, yet with substantial
specific variation. Many of these properties are critical for proper design and operation
of conversion facilities, although not all properties are equally important for all
conversion techniques. This paper attempts to briefly summarize some of the important
properties for combustion, especially with respect to the use of biomass for electricity
generation. As the biomass-fueled power generation industry has expanded in recent
decades, the diversity of fuel types utilized has expanded as well, often with unantici-
pated and undesirable impacts on facility operation. Although the fundamental combus-
tion behavior of biomass fuels has received increasing attention of late, there remains no
comprehensive compilation of combustion properties, nor even a general recognition of
the importance of certain properties for facility implementation and design. An objective
of this paper is to stimulate the larger development of industry standards in the analysis,
reporting, and interpretation of biomass properties.
2. Analytical methods
Combustion is a complex phenomenon involving simultaneous coupled heat and mass
transfer with chemical reaction and fluid flow. Its prediction for the purposes of design
and control requires knowledge of fuel properties and the manner in which these
properties influence the outcome of the combustion process. A global reaction for the
combustion of a biomass fuel in air might take the following form, where the first
reactant compound is a biomass fuel:
C H
O N S Cl
Si
K
Ca
Mg
Na
P
Fe
Al
Ti
q
n H O
x1
x 2
x 3
x 4
x 5
x 6
x 7
x 8
x 9
x10
x11 x12
x13
x14
x15
1
2
q
n
1 q e
O q 3.76N
s
n CO q n H O q n O q n N q n CO
Ž
. Ž
.
2
2
2
3
2
4
2
5
2
6
2
7
q
n CH q n NO q n NO q n SO
8
4
9
10
2
11
2
q
n HCl q n KCl q n K SO q n C q . . .
12
13
14
2
4
15

(
)
B.M. Jenkins et al.r Fuel Processing Technology 54 1998 17–46
19
Hybrid poplar
Rice straw
RicerPoplar
C
x
4.1916
3.2072
0.77
1
H
x
6.0322
5.1973
0.86
2
O
x
2.5828
2.8148
1.09
3
N
x
0.0430
0.0625
1.45
4
S
x
0.0006
0.0057
9.50
5
Cl
x
0.0003
0.0165
55.00
6
Si
x
0.0057
0.5000
87.72
7
K
x
0.0067
0.0592
8.84
8
Ca
x
0.0337
0.0141
0.42
9
Mg
x
0.0205
0.0135
0.66
10
Na
x
0.0002
0.0079
39.50
11
P
x
0.0012
0.0086
7.17
12
Fe
x
0.0007
0.0029
4.14
13
Al
x
0.0008
0.0073
9.13
14
Ti
x
0.0002
0.0004
2.00
15
The inclusion of 15 elements in the empirical formula for the fuel is incomplete.
There are many more, some of which are important to the issue of biomass combustion.
Heavy metals, for example, have a strong influence on ash disposal, but are not included
in the elemental structure above. The second reactant term expresses the moisture in the
fuel, which can be extremely variable, at least within limits. If too much moisture is
present, the fuel will not spontaneously react. The third term represents air, although this
again is a simplification, represented by the simple binary mixture of oxygen and
nitrogen in the volume ratio of 21% to 79%. Air, of course, includes many more
Ž
constituents, but these are not as important in a gross analysis although it should not
escape attention that the presence of certain gases at very low concentration, many
contributed by biomass burning, has marked impact on the radiative properties of the
.
atmosphere . The product side of the reaction is complex. The main products are those
appearing first, but there are a host of products important to the successful operation of a
commercial biomass combustion system, including criteria atmospheric pollutants such
Ž
.
as CO, hydrocarbons HC , oxides of nitrogen and sulfur, among others, as well as the
reactions among inorganic species leading to fouling and slagging, such as the alkali
chlorides, sulfates, carbonates and silicates. The detailed chemistry describing the simple
global reaction above is far from understood. Making generalizations and engineering
recommendations concerning the design of biomass combustion systems is made
difficult by the variable composition of biomass, as indicated by the element coefficients
for the wood from hybrid poplar and the herbaceous fuel, rice straw. Although there are
many similarities, there are also many differences.
Biomass is similar to other fuel types in the need for standardized methods of
analysis leading to accurate and consistent evaluations of fuel properties. Summarized in
Table 1 are several methods frequently used to assess major properties of biomass fuels.
w x
A number of methods are also described by Milne et al. 3 . Some of these methods
were developed for other fuels, such as coal, but are more generally applicable and have
been found to be adequate for biomass as well. Other methods are less successful in

(
)
B.M. Jenkins et al.r Fuel Processing Technology 54 1998 17–46
20
Table 1
Methods of biomass fuel analysis
Property
Analytical method
Heating value
ASTM ABBE
Particle size distribution
ASTM E828
Bulk density
ASTM E873
Proximate composition
Moisture
ASTM E871
Ž
.
Ash
ASTM E830 5758C
Ž
.
ASTM D1102 6008C
Volatiles
ASTM E872rE897
Fixed carbon
by difference
Ultimate elemental
C,H
ASTM E777
N
ASTM E778
S
ASTM E775
Cl
ASTM E776
Ash elemental
ASTM D3682
ASTM D2795
a
various unnumbered methods
wet ashing preferred
ASTM D4278
AOAC 14.7
microwave digest
b
Ash fusibility
ASTM E953rD1857
a
Ash sinter test
c
Fuel pellet test
a
Water soluble alkali
unnumbered method
a
Chemical fractionation
unnumbered method
Metals
ASTM E885
a
w x
See Ref. 1 .
b
Pyrometric cone test of questionable value.
c
w x
See Ref. 2 .
their application to biomass and further development work is desirable. In particular,
standard methods for evaluating the fouling and slagging behavior of biomass resulting
from transformations among inorganic constituents, one of the most critical problems in
biomass combustion, often fail in predicting such behavior in furnaces.
Many elementary properties of biomass have been determined for a wide range of
Ž
fuel types. Summaries of various types appear in the literature see, for example, Refs.
w
x
.
4–6,1,7 and references contained therein . These properties include moisture content,
heating value, elemental composition, bulk density, specific gravity, thermal conductiv-
ity, and mechanical, acoustic, and electrical properties. Many such properties have only
been determined for biomass in its original state at ambient temperature. The high
temperature properties relevant to the modeling of biomass combustion are only partly
developed. Difficulties arise in the determination of such properties because of the
decomposition of the biomass under heating and reaction.

(
)
B.M. Jenkins et al.r Fuel Processing Technology 54 1998 17–46
21
Rapid development in the biomass industry within the last decades has increased the
available information substantially, and efforts continue in this area. Of recent critical
concern, and serving as the focus of this discussion, are fuel composition and its effect
on fouling, corrosion, and pollutant emissions, and on the prediction of the rate of
reaction for scale-up and design.
3. Composition of biomass
Photosynthesis results in the production of structural and non-structural carbohydrates
comprising the plant tissues. The components of biomass include cellulose, hemicellu-
loses, lignin, lipids, proteins, simple sugars, starches, water, HC, ash, and other
compounds. The concentrations of each class of compound varies depending on species,
type of plant tissue, stage of growth, and growing conditions. Cellulose is a linear
Ž
.
polysaccharide of b-D glucopyranose units linked with 1–4 glycosidic bonds. Hemi-
celluloses are polysaccharides of variable composition including both five and six
carbon monosaccharide units. The lignin is an irregular polymer of phenylpropane units
w
x
8–12 . Plants producing large amounts of free sugars, such as sugar cane and sweet
sorghum, are attractive as feedstocks for fermentation, as are starch crops such as maize
Ž
.
corn and other grains. Lignins are not yet generally considered fermentable, and
thermochemical means are usually proposed for their conversion. Typically, 60–80% of
the feedstock mass is ultimately fermentable. Combustion can be applied either to the
direct conversion of the whole biomass, or to portions remaining following some sort of
biochemical separation such as fermentation. Combustion, unlike the biochemical and
some other thermochemical conversion strategies, is essentially non-selective in its use
of the biomass, and intends to reduce the whole fuel to simple products. This is not to
suggest that the complex structure of biomass does not have significant influences on its
combustion behavior.
Due to the carbohydrate structure, biomass is highly oxygenated with respect to
conventional fossil fuels including HC liquids and coals. Typically, 30 to 40 wt.% of the
dry matter in biomass is oxygen. The principal constituent of biomass is carbon, making
up from 30 to 60 wt.% of dry matter depending on ash content. Of the organic
component, hydrogen is the third major constituent, comprising typically 5 to 6% dry
matter. Nitrogen, sulfur, and chlorine can also be found in quantity, usually less than 1%
dry matter but occasionally well above this. The latter are important in the formation of
pollutant emissions and sulfur and chlorine in certain ash reactions leading to fouling
and slagging. Nitrogen is a macronutrient for plants, and critical to their growth. Certain
inorganic elements can be found in high concentration as well. In annual growth tissues,
concentrations of the macronutrient potassium frequently exceed 1% dry matter. In some
Ž
.
Ž
of the gramineae grasses and straws , silica is the third largest component in rice straw,
.
silica is 10–15% of dry matter .
The compositions of selected biomass materials are listed in Table 2, including
several fuel blends sampled from operating commercial biomass power plants. The
compositions of some coals are included for comparison. The biomass fuels can be
Ž .
Ž .
divided quite generally into four primary classes: 1 wood and woody materials, 2

()
B.M.
Jenkins
et
al.
r
Fuel
Processing
Technology
54
1998
17
–
4
6
22
Table 2
w x
Compositions, heating values, and alkali index for selected fuels 1
Alfalfa stems
Wheat straw
Rice hulls
Rice straw
Switch-
Sugar cane
Willow
Hybrid poplar
grass
bagasse
wood
(
)
Proximate analysis % dry fuel
Fixed carbon
15.81
17.71
16.22
15.86
14.34
11.95
16.07
12.49
Volatile matter
78.92
75.27
63.52
65.47
76.69
85.61
82.22
84.81
Ash
5.27
7.02
20.26
18.67
8.97
2.44
1.71
2.70
Total
100.00
100.00
100.00
100.00
100.00
100.00
100.00
100.00
(
)
Ultimate analysis % dry fuel
Carbon
47.17
44.92
38.83
38.24
46.68
48.64
49.90
50.18
Hydrogen
5.99
5.46
4.75
5.20
5.82
5.87
5.90
6.06
Ž
.
Oxygen diff.
38.19
41.77
35.47
36.26
37.38
42.82
41.80
40.43
Nitrogen
2.68
0.44
0.52
0.87
0.77
0.16
0.61
0.60
Sulfur
0.20
0.16
0.05
0.18
0.19
0.04
0.07
0.02
Chlorine
0.50
0.23
0.12
0.58
0.19
0.03
- 0.01
0.01
Ash
5.27
7.02
20.26
18.67
8.97
2.44
1.71
2.70
Total
100.00
100.00
100.00
100.00
100.00
100.00
100.00
100.00
( )
Elemental composition of ash %
SiO
5.79
55.32
91.42
74.67
65.18
46.61
2.35
5.90
2
Al O
0.07
1.88
0.78
1.04
4.51
17.69
1.41
0.84
2
3
TiO
0.02
0.08
0.02
0.09
0.24
2.63
0.05
0.30
2
Fe O
0.30
0.73
0.14
0.85
2.03
14.14
0.73
1.40
2
3
CaO
18.32
6.14
3.21
3.01
5.60
4.47
41.20
49.92
MgO
10.38
1.06
- 0.01
1.75
3.00
3.33
2.47
18.40
Na O
1.10
1.71
0.21
0.96
0.58
0.79
0.94
0.13
2
K O
28.10
25.60
3.71
12.30
11.60
0.15
15.00
9.64
2
SO
1.93
4.40
0.72
1.24
0.44
2.08
1.83
2.04
3
P O
7.64
1.26
0.43
1.41
4.50
2.72
7.40
1.34
2
5
CO rother
14.80
18.24
8.18
2
Total
100.00
100.00
100.64
100.00
100.00
100.00
100.00
100.00
Undetermined
11.55
1.82
y
0.64
2.68
2.32
1.39
8.38
1.91

()
B.M.
Jenkins
et
al.
r
Fuel
Processing
Technology
54
1998
17
–
4
6
23
(
)
Higher heating Õalue constant Õolume
MJrkg
18.67
17.94
15.84
15.09
18.06
18.99
19.59
19.02
Bturlb
8025
7714
6811
6486
7766
8166
8424
8178
(
)
Alkali index as oxide
Ž
.
kg alkalirGJ
0.82
1.07
0.50
1.64
0.60
0.06
0.14
0.14
Ž
.
lb alkalirMM Btu
1.92
2.49
1.17
3.82
1.41
0.15
0.32
0.32
Almond shells
Almond hulls
Pist. shells
Olive pitts
Demol. wood
Yard waste
Fir mill
Mixed paper
RDF
(
)
Proximate analysis % dry fuel
Fixed carbon
20.71
20.07
16.95
16.28
12.32
13.59
17.48
7.42
0.47
Volatile matter
76.00
73.80
81.64
82.00
74.56
66.04
82.11
84.25
73.40
Ash
3.29
6.13
1.41
1.72
13.12
20.37
0.41
8.33
26.13
Total
100.00
100.00
100.00
100.00
100.00
100.00
100.00
100.00
100.00
(
)
Ultimate analysis % dry fuel
Carbon
49.30
47.53
50.20
52.80
46.30
41.54
51.23
47.99
39.70
Hydrogen
5.97
5.97
6.32
6.69
5.39
4.79
5.98
6.63
5.78
Ž
.
Oxygen diff.
40.63
39.16
41.15
38.25
34.45
31.91
42.10
36.84
27.24
Nitrogen
0.76
1.13
0.69
0.45
0.57
0.85
0.06
0.14
0.80
Sulfur
0.04
0.06
0.22
0.05
0.12
0.24
0.03
0.07
0.35
Chlorine
- 0.01
0.02
- 0.01
0.04
0.05
0.30
0.19
Ash
3.29
6.13
1.41
1.72
13.12
20.37
0.41
8.33
26.13
Total
100.00
100.00
100.00
100.00
100.00
100.00
100.00
100.00
100.00
( )
Elemental composition of ash %
SiO
8.71
9.28
8.22
30.82
45.91
59.65
15.17
28.10
33.81
2
Al O
2.72
2.09
2.17
8.84
15.55
3.06
3.96
52.56
12.71
2
3
TiO
0.09
0.05
0.20
0.34
2.09
0.32
0.27
4.29
1.66
2
Fe O
2.30
0.76
35.37
6.58
12.02
1.97
6.58
0.81
5.47
2
3
CaO
10.50
8.07
10.01
14.66
13.51
23.75
11.90
7.49
23.44
MgO
3.19
3.31
3.26
4.24
2.55
2.15
4.59
2.36
5.64
Na O
1.60
0.87
4.50
27.80
1.13
1.00
23.50
0.53
1.19
2

()
B.M.
Jenkins
et
al.
r
Fuel
Processing
Technology
54
1998
17
–
4
6
24
Ž
.
Table 2 continued
Almond shells
Almond hulls
Pist. shells
Olive pitts
Demol. wood
Yard waste
Fir mill
Mixed paper
RDF
K O
48.70
52.90
18.20
4.40
2.14
2.96
7.00
0.16
0.20
2
SO
0.88
0.34
3.79
0.56
2.45
2.44
2.93
1.70
2.63
3
P O
4.46
5.10
11.80
2.46
0.94
1.97
2.87
0.20
0.67
2
5
CO rother
17.38
20.12
18.92
2
Total
100.00
100.00
100.00
100.00
100.00
100.00
100.00
100.00
100.00
Undetermined
y
0.53
y
2.89
2.48
y
0.70
1.71
0.73
2.31
1.80
12.58
(
)
Higher heating Õalue constant Õolume
MJrkg
19.49
18.89
18.22
21.59
18.41
16.30
20.42
20.78
15.54
Bturlb
8378
8119
7831
9282
7916
7009
8779
8934
6679
(
)
Alkali index as oxide
Ž
.
kg alkalirGJ
0.85
1.75
0.18
0.26
0.23
0.49
0.06
0.03
0.23
Ž
.
lb alkalirMMBtu
1.98
4.06
0.41
0.60
0.54
1.15
0.14
0.06
0.54
a
b
Ž
.
Biomass power plant fuel blends
Coal lvb
Lignite
Urbanr
Urbanr
Urbanr
Woodr
Woodr
Woodr
Ž .
Ž .
1 Ag wood
2 Ag wood
wood
pit
Al. hull
Wheat straw
(
)
Proximate analysis % dry fuel
Fixed carbon
19.79
16.93
15.23
18.10
15.94
16.67
77.00
43.44
Volatile matter
75.89
80.57
79.23
76.77
77.28
75.14
18.49
42.95
Ash
4.32
2.50
5.54
5.13
6.78
8.19
4.51
13.69
Total
100.00
100.00
100.00
100.00
100.00
100.00
100.00
100.08
(
)
Ultimate analysis % dry fuel
Carbon
51.44
49.69
48.77
48.62
47.45
47.48
87.52
60.97
Hydrogen
5.67
5.87
5.76
5.78
5.53
5.81
4.26
4.07
Ž
.
Oxygen diff.
38.12
41.52
39.53
39.73
39.54
37.92
1.55
18.50
Nitrogen
0.41
0.33
0.27
0.65
0.59
0.35
1.25
1.02
Sulfur
0.03
0.04
0.07
0.06
0.08
0.12
0.75
1.81
Chlorine
0.01
0.05
0.06
0.03
0.03
0.13
0.16
0.04
Ash
4.32
2.50
5.54
5.13
6.78
8.19
4.51
13.69
Total
100.00
100.00
100.00
100.00
100.00
100.00
100.00
100.10

()
B.M.
Jenkins
et
al.
r
Fuel
Processing
Technology
54
1998
17
–
4
6
25
( )
Elemental composition of ash %
SiO
39.96
28.81
55.12
52.55
45.60
55.50
37.24
20.93
2
Al O
12.03
8.47
12.49
13.15
10.75
9.37
23.73
13.78
2
3
TiO
0.87
0.83
0.72
0.43
0.54
0.50
1.12
0.41
2
Fe O
7.43
3.28
4.51
8.18
4.06
4.77
16.83
12.08
2
3
CaO
19.23
27.99
13.53
10.06
18.96
11.04
7.53
16.13
MgO
4.30
4.49
2.93
3.27
4.22
2.55
2.36
4.40
Na O
1.53
3.18
3.19
5.90
3.08
2.98
0.81
6.41
2
K O
5.36
8.86
4.78
5.04
6.26
6.40
1.81
0.22
2
SO
1.74
2.00
1.92
2.10
2.06
1.80
6.67
24.27
3
P O
1.50
2.57
0.88
1.90
1.47
1.04
0.10
0.00
2
5
CO rother
6.05
6.07
2
Total
100.00
100.00
100.07
100.00
100.00
100.00
98.20
98.63
Undetermined
0.00
3.45
y
0.07
y
2.58
3.00
4.05
1.80
1.37
(
)
Higher heating Õalue constant Õolume
MJrkg
20.50
19.49
19.45
19.66
15.89
18.80
35.01
23.35
Bturlb
8815
8379
8361
8450
6829
8083
15052
10040
(
)
Alkali index as oxide
Ž
.
kg alkalirGJ
0.15
0.15
0.23
0.29
0.40
0.41
0.03
0.39
Ž
.
lb alkalirMM Btu
0.34
0.36
0.53
0.66
0.93
0.95
0.08
0.90
a
Low volatile bituminous.
b
w
x
See Ref. 13 .
(
)
B.M. Jenkins et al.r Fuel Processing Technology 54 1998 17–46
26
Ž .
herbaceous and other annual growth materials such as straws, grasses, leaves,
3
agricultural by-products and residues including shells, hulls, pits, and animal manures
Ž .
Ž
.
and 4 refuse-derived fuels RDF and waste or non-recyclable papers, often mixed with
plastics. The latter class is often excluded from the category of biomass, but the origin,
with the exception of mixed plastics, is appropriate for inclusion as a biomass type. A
fifth class, that of energetic materials including decommissioned rocket fuels, is emerg-
ing as part of the fuel mix for biomass facilities. The properties of these materials can be
substantially different than those for conventional biomass materials. The distinctions
among the first three classes—woods, herbaceous materials, and by-products—are
largely based on the structural compositions for hemicellulose, cellulose, and lignin, and
on the concentration and composition of inorganic materials.
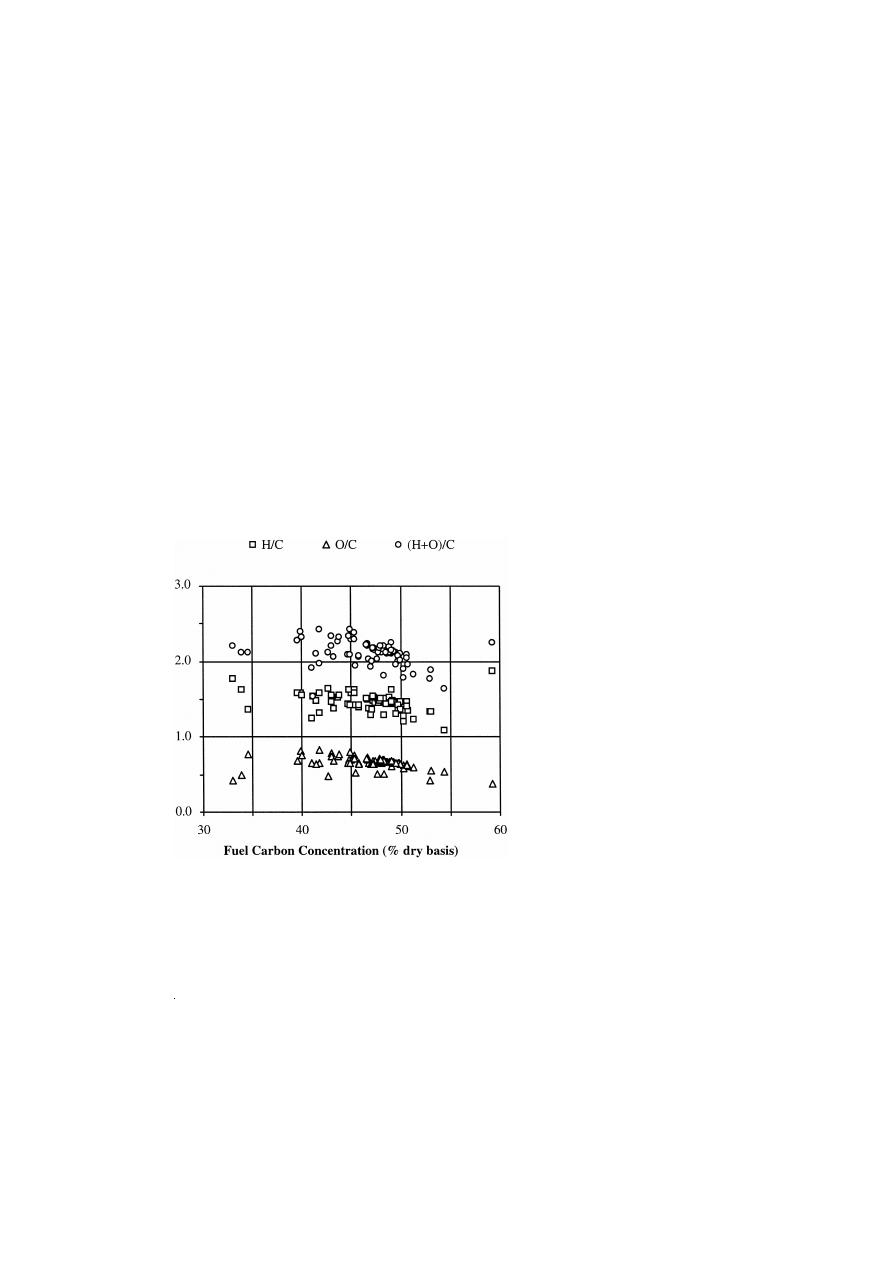
The molar ratios of oxygen and hydrogen to carbon for a wide range of biomass fuels
are shown in Fig. 1. The amount of variation is not particularly large considering the
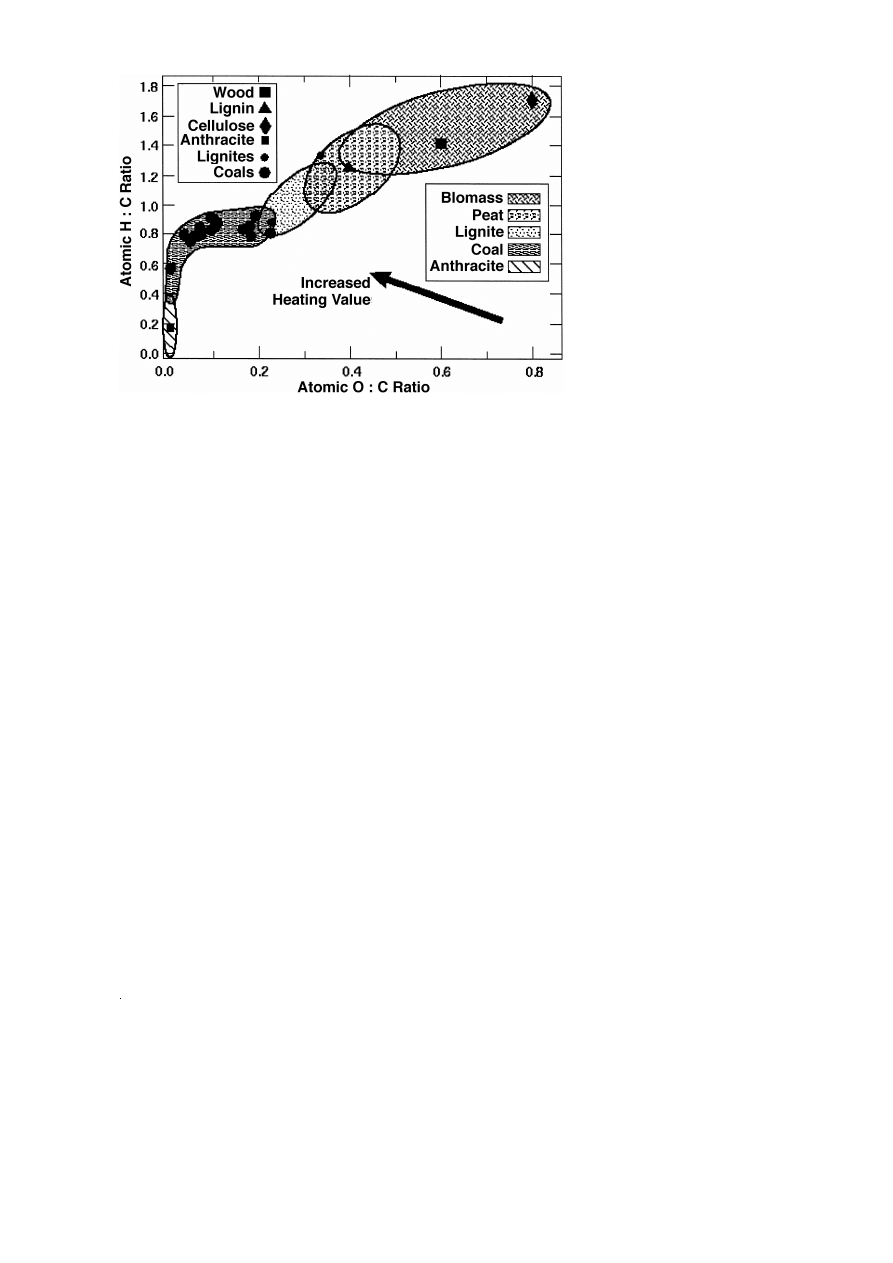
range of different materials examined. Biomass is compared with other fuels in the
w
x
so-called coalification diagram 14 of Fig. 2. Illustrated in the figure are approximate
boundaries between different classes of solid fuels. This type of diagram can be used to
w x
infer the chemical structure and some combustion and inorganic aspects of the fuels 7 .
Inorganic material in biomass can be divided into two fractions, one of which is inherent
in the fuel and the other of which is added to the fuel through processing steps. The
latter, adventitious material such as dirt, often makes up a major fraction of the ash
content of wood fuels used in power plants and originates from skidding and other
operations whereby soil is incorporated into the fuel. Its composition is typically
different from that of the inherent materials, as is the mode of occurrence of the
Ž
elements e.g., crystalline silicates and aluminum arising from the incorporation of
w x
Fig. 1. Molar ratios of hydrogen and oxygen to carbon in biomass 5 .
(
)
B.M. Jenkins et al.r Fuel Processing Technology 54 1998 17–46
27
w
x
Fig. 2. Coalification diagram showing compositional differences among coals and biomass 14 .
sands, clays and other soil particles, and potassium incorporated in feldspars with
relatively little contribution to alkali reactions leading to fouling other than by inertial
.
impaction and sticking of particles .
The inherent inorganic matter is more intimately distributed throughout the fuel, and
is sometimes referred to as atomically dispersed material. Elements including Si, K, Na,
S, Cl, P, Ca, Mg, Fe are involved in reactions leading to ash fouling and slagging, and
the principal mechanisms describing these phenomena in biomass combustors are now
w
x
reasonably well understood 14,15,1,7,16 . Descriptions of the detailed chemistry and
means to control or mitigate these processes other than by fuel selection are, however,
far from realization. More recent demonstrations of the impacts of removing certain
w
x
elements from biomass on the fouling and slagging behavior 17,2 confirm much of
what is perceived about the mechanisms involved.
The release of atomically dispersed inorganic material from a fuel particle is
influenced both by its inherent volatility and the reactions of the organic portions of the
fuel. Material that is inherently volatile at combustion temperatures includes derivatives
of some of the alkali and alkaline earth metals, most notably potassium and sodium.
Other, non-volatile material can be released by convective transport during rapid
pyrolysis. The amount of fuel lost during the pyrolysis stage of combustion increases
with increasing hydrogen to carbon ratio and, to a lesser extent, with increasing oxygen
to carbon ratio. Whereas anthracite coals typically lose less than 10% of their mass by
pyrolysis, and bituminous coals lose between 5 and 65% of their mass, lignites, peats,
and biomass can lose over 90% of their mass in this first stage of combustion. Typically,
the volatile loss during early pyrolysis of biomass is about 75%. The combination of
high oxygen content and high organic volatile matter in biomass indicates a potential for
(
)
B.M. Jenkins et al.r Fuel Processing Technology 54 1998 17–46
28
creating large amounts of inorganic vapors during combustion. Alkali elements are also
directly vaporized at normal furnace operating temperatures, as evidenced by differences
Ž
between standard ash content determinations conducted at 5758C as recommended for
.
Ž
.
RDF and at 7508C the standard temperature for coal . Upon heating, ash from wheat
w x
straw has been observed to lose up to 40% weight between 5758C and 10008C 2 .
Herbaceous fuels contain silicon and potassium as their principal ash-forming con-
stituents. They are also commonly high in chlorine relative to other biomass fuels. These
properties portend potentially severe ash deposition problems at high or moderate
Ž .
combustion temperatures. The primary sources of these problems are 1 the reaction of
Ž
alkali with silica to form alkali silicates that melt or soften at low temperatures can be
.
Ž .
lower than 7008C, depending on composition , and 2 the reaction of alkali with sulfur
to form alkali sulfates on combustor heat transfer surfaces. Alkali material plays a
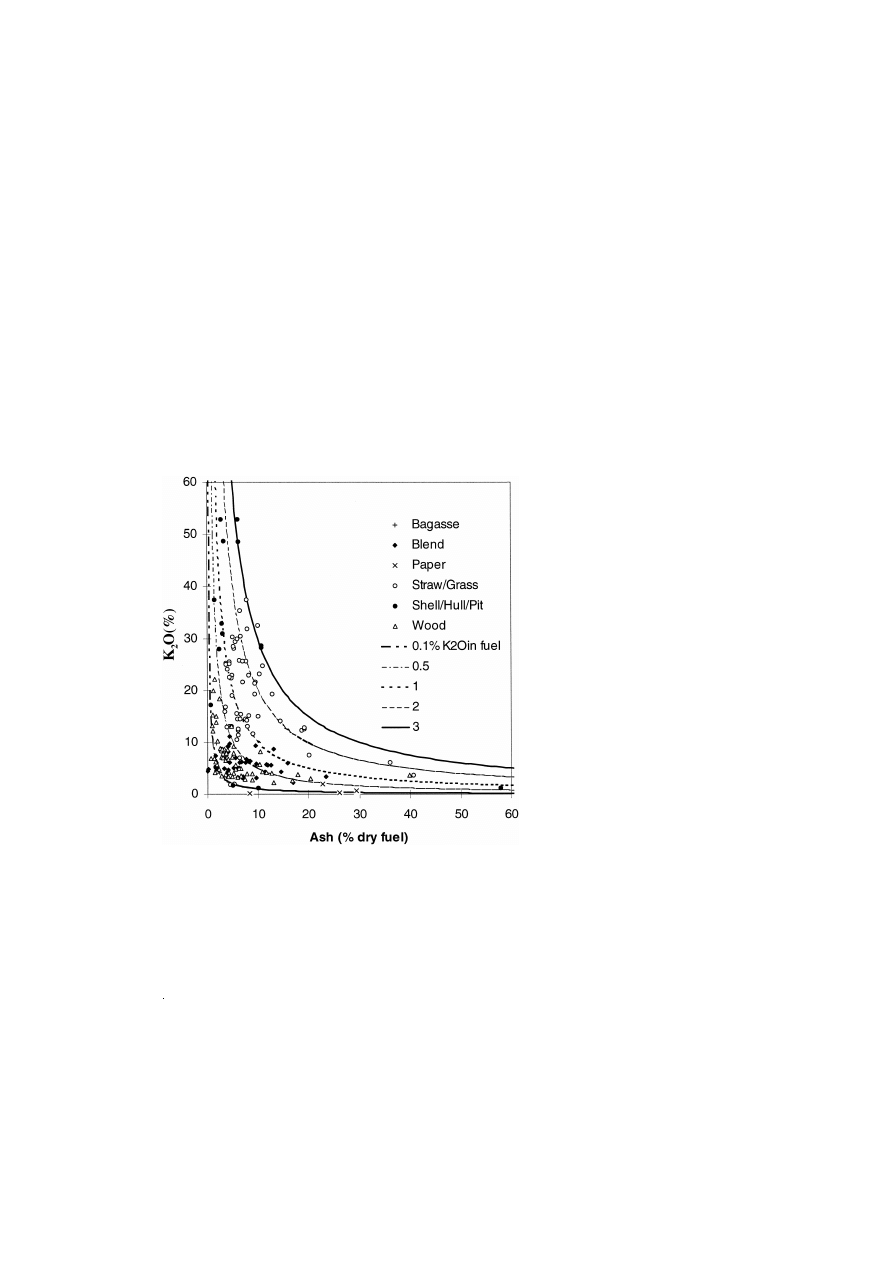
central role in both processes. Potassium is the dominant source of alkali in most
biomass fuels. Differences among fuel types are displayed in Fig. 3, which plots percent
K O in ash against the fuel ash content. The hyperbolic lines plotted in the figure are
2
lines of constant K O in the fuel. Wood fuels tend to reside in the region below 0.5%
2
K O in the fuel, whereas straws and grasses reside in the region between 1 and 3%. The
2
scatter suggests that as the ash content increases for woods, the fraction of potassium in
the ash decreases, consistent with soil derived matter accounting for the increasing ash.
For straws, an increasing potassium concentration in the fuel tends to accompany an
Fig. 3. Potassium oxide concentrations in relation to the ash content of biomass. The curves are isopleths of
concentration for potassium oxide in the fuel.
(
)
B.M. Jenkins et al.r Fuel Processing Technology 54 1998 17–46
29
increasing ash content, indicating an inherent source of potassium. Sugar cane bagasse is
substantially depleted in potassium relative to the parent material due to washing of the
cane during processing. Similar results have been obtained for wet extraction of straws
w x
2 . Non-biologically derived alkali is present as soil contaminants and additives to the
fuels, such as clay fillers used in paper production. This non-biogenic alkali exhibits far
lower mobility during combustion than the biological fraction as determined by chemi-
cal fractionation analyses. As a result, some traditional indicators of deposit behavior,
most notably ash fusion temperatures, poorly predict ash behavior.
Ž
Many of the agricultural by-products also contain high potassium concentrations see
.
Fig. 3, Table 2 with equally high potassium mobility. Some woods, on the other hand,
contain far less ash overall, differing by as much as a factor of 40 from high-ash straws,
for example. In addition, the ash-forming constituents contain greater amounts of
calcium with less silicon. Although the total amount of potassium in wood is typically
much lower than in straws, the fraction in the ash may be higher. Calcium reacts with
sulfur to form sulfates in ways somewhat analogous to potassium, but the mobility of
calcium and the properties of the deposits it forms are both more favorable to sustained
Ž .
Ž
. Ž .
Ž
.
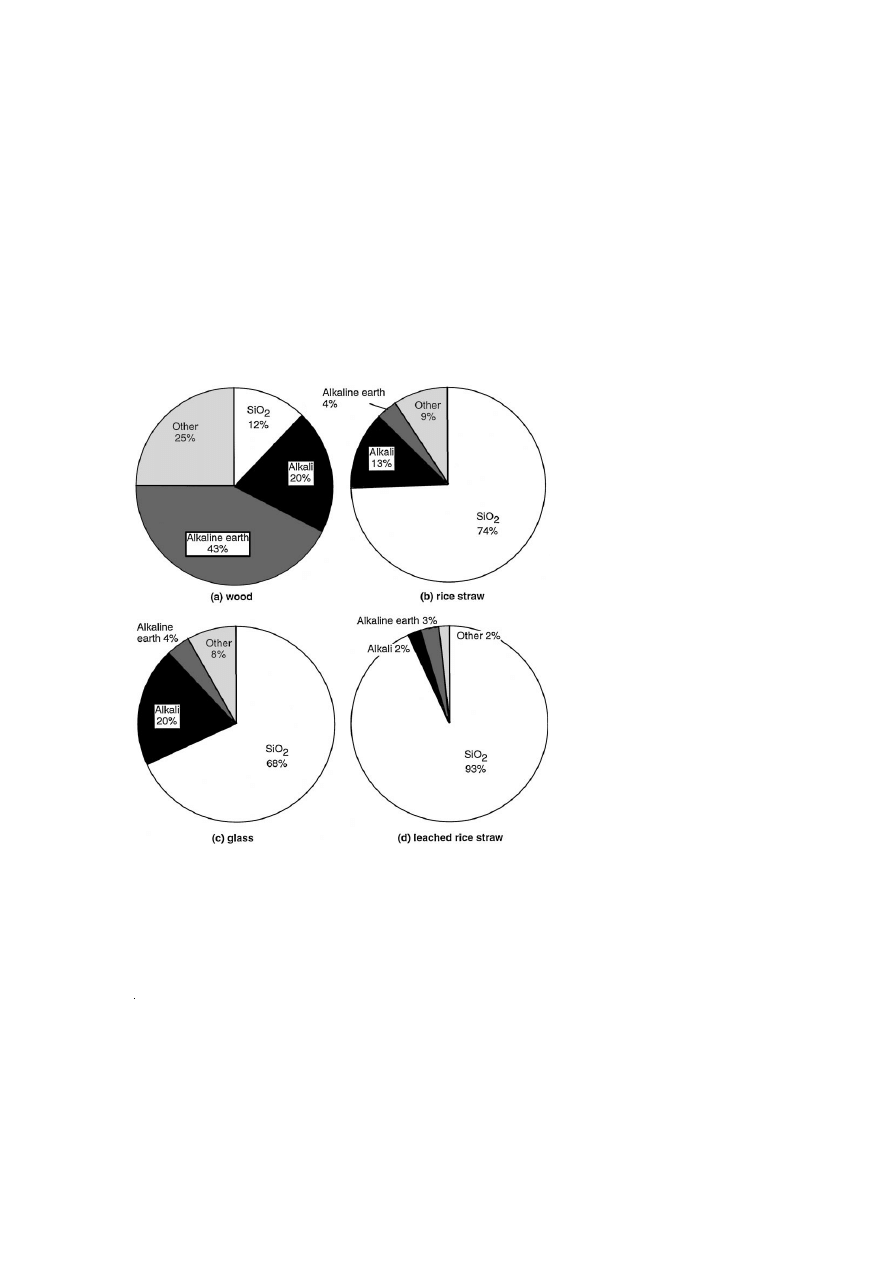
Fig. 4. Inorganic compositions for a Douglas fir wood California , b rice straw variety M202, California ,
Ž .
Ž .
Ž
Ž ..
c ordinary soda-lime glass, d water leached rice straw same original straw as in b .
(
)
B.M. Jenkins et al.r Fuel Processing Technology 54 1998 17–46
30
furnace operation than the ashes formed from straws and grasses. The composition of
rice straw ash is compared against that of Douglas fir wood in Fig. 4. The composition
Ž
.
of the straw ash is remarkably similar to that of an ordinary glass also shown in Fig. 4 ,
helping to explain the rapid sintering, slagging, and fouling observed when burning
straws in most power boilers designed for wood.
Chlorine is a major factor in ash formation. Chlorine facilitates the mobility of many
inorganic compounds, in particular potassium. Potassium chloride is among the most
stable high-temperature, gas-phase, alkali-containing species. Chlorine concentration
often dictates the amount of alkali vaporized during combustion as strongly as does the
alkali concentration. In most cases, the chlorine appears to play a shuttle role, facilitating
the transport of alkali from the fuel to surfaces, where the alkali often forms sulfates. In
the absence of chlorine, alkali hydroxides are the major stable gas-phase species in
w x
moist, oxidizing environments, i.e., combustion gases 7 .
The compositions of biomass are complex, involving six major elements in the
organic phase and at least 10 other elements, not including heavy metals, in the
inorganic phase important to ash characterization. Some of the trends described above
can be more formally elucidated through the application of multivariate statistical
techniques. Figs. 5–7 give results of PCA using 177 separate observations of complete
Ž
.
ultimate elemental analyses C, H, N, S, Cl, O, and Ash as % dry fuel and 230
Ž
.
complete observations of 10 ash elements Si, Al, Ti, Fe, Ca, Mg, Na, K, S, P as oxides
Ž
note sulfur accounted for as the element in the ultimate analysis and as sulfate in the
.
ash analysis . The chemical analyses were conducted using consistent methods and most
Ž
.
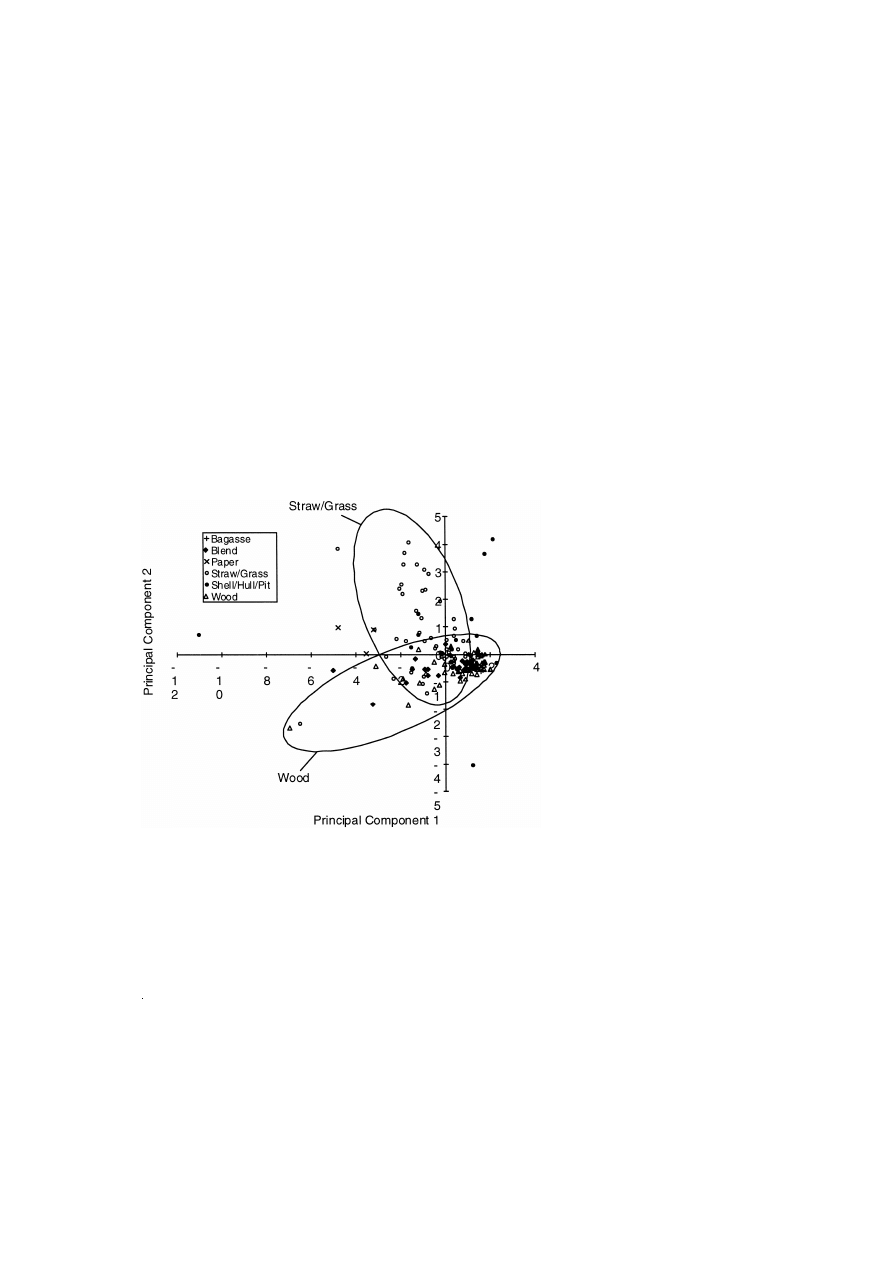
Fig. 5. Component plot for principal components 1 and 2 from a principal components analysis PCA on the
Ž
.
ultimate elemental composition of biomass. P1 is largely associated with the major organic elements C, H, O
of the fuel and P2 with N, S, and Cl.
(
)
B.M. Jenkins et al.r Fuel Processing Technology 54 1998 17–46
31
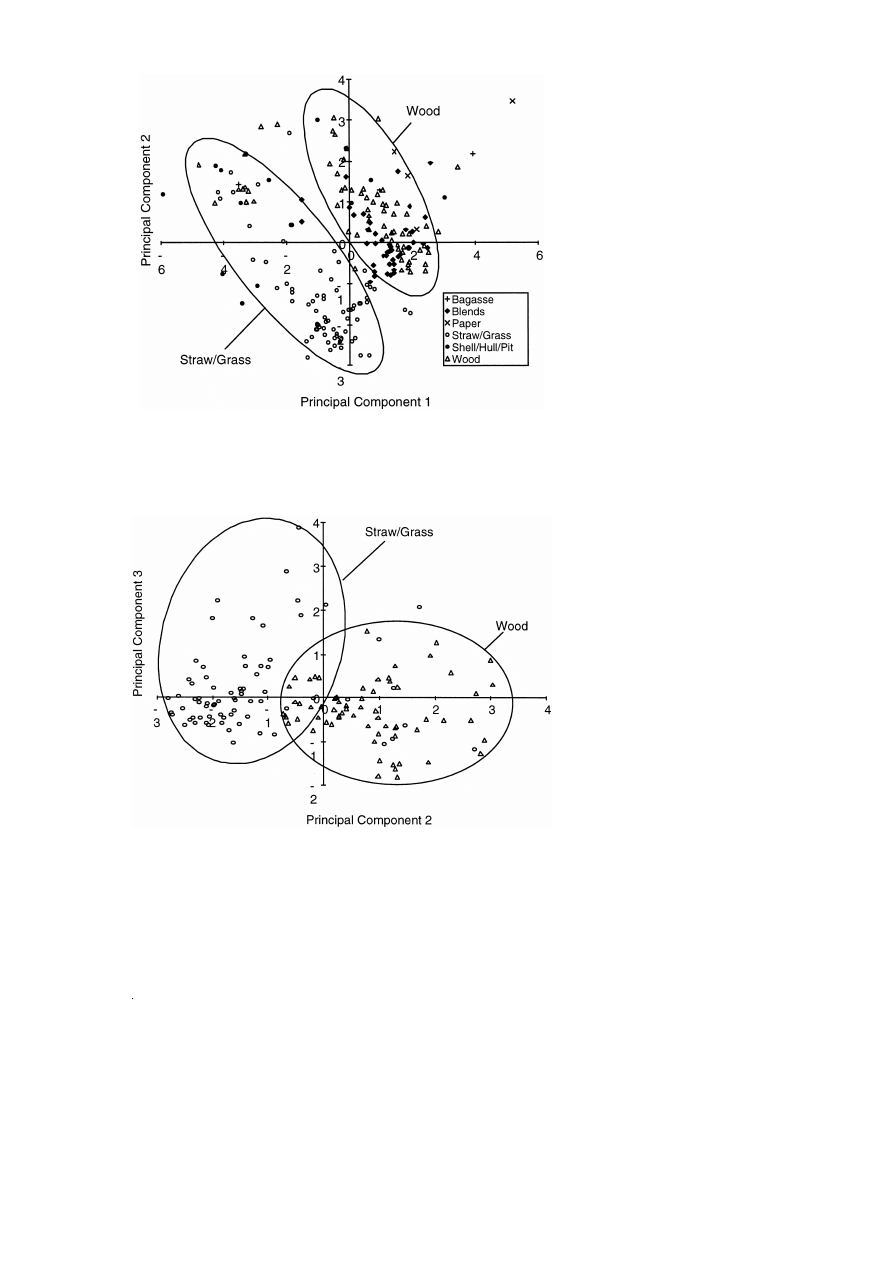
Fig. 6. Component plot for principal components 1 and 2 from a PCA on the elemental ash composition of
biomass. P1 is largely associated with the elements Si, Al, Ti, and Fe, P2 with the alkaline earth metals Ca and
Mg.
Fig. 7. Component plot for principal components 2 and 3 from a PCA on the elemental composition of
Ž
.
biomass. P2 is largely associated with the alkaline earth metals Ca and Mg same P2 as in Fig. 6 , P3 with the
elements Na and S. P2 is also negatively correlated with Si.

(
)
B.M. Jenkins et al.r Fuel Processing Technology 54 1998 17–46
32
were completed by a single laboratory as part of an alkali deposits investigation for
w x
biomass fuels 1 . The majority of the analyses are for straws, grasses, and woods, many
of the latter as urban wood fuels and blends obtained from operating power plants. Other
classes are represented as indicated in figures. Differences between the two main classes
Ž
.
have been highlighted in the figures. Fig. 5 is a plot of the first principal component P1
Ž
.
against the second principal component P2 . Together, these two components account
for 67% of the total variance in the data. P1 has a strong positive correlation to the
organic elements C, H, and O, with a strongly negative correlation to ash concentration
Ž
.
as is to be expected-as ash content increases, the organic fraction must decline . P2
shows a strongly positive correlation to N, S, and Cl. For straws, as P1 decreases, P2
increases, indicating that as ash content increases, the concentrations of N, S, and Cl
also increase, consistent with a predominantly inherent ash. The trend is reversed for
Ž
woods, consistent with an ash of increasing adventitious origin i.e., greater levels of
.
dirt .
For the ash PCA, the first three components, P1, P2, and P3, account for 68% of
variance. In this case, P1 has a strong positive correlation to the concentrations of Si, Al,
Ti, and Fe, suggesting it represents ash of soil origin. P2 has a strong negative
Ž
.
correlation to Si which immediately implies that as P1 increases, P2 should decrease ,
but a strong positive correlation to the alkaline earths, Ca and Mg. P3 is strongly
correlated with Na and S concentrations. Again, distinct differences appear between
woods and strawsrgrasses. Fig. 6 gives results for P1 against P2. Here, as P1 increases,
P2 decreases, indicating that as Si, Al, Ti, and Fe increase in concentration, they dilute
the concentrations of Ca and Mg. This is again consistent with an adventitious origin for
increasing levels of ash. The straws and grasses exhibit a similar trend in slope, but are
shifted in the component space, suggesting less adventitious material. The trend is
towards diminished amounts of alkaline earths with increasing silica concentrations. In
Fig. 7, P3 is plotted against P2. The woods show relatively little sensitivity in response
Ž
.
to increasing alkaline earth concentrations and decreasing soil borne ash for Na and S
concentrations. The straws and grasses, again shifted in component space towards lower
levels of alkaline earths and higher silica concentrations compared to woods, tend to add
more sodium and sulfur along with the alkaline earths. The trends observed in these data
are not necessarily general, as the nature of the sample set bears substantial influence on
the results.
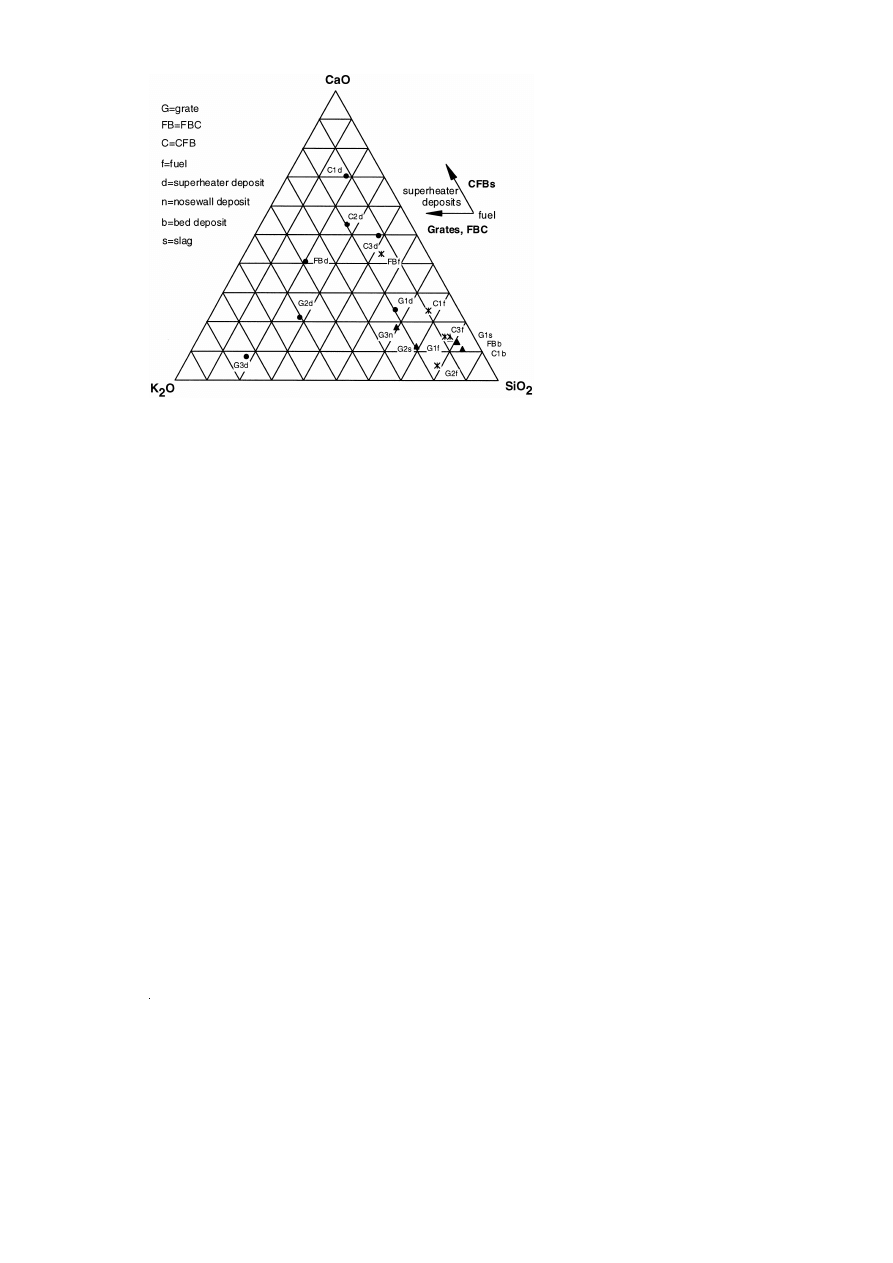
The fate of certain inorganic constituents in a combustion system can be traced
through an analysis of fuel, ash, and deposits. Fig. 8 displays the normalized composi-
tions for some fuels, slags, and deposit samples acquired from operating commercial
w x
biomass power plants. Full compositions are listed by Miles et al. 1 . Two main trends
Ž
.
are apparent. For the grate furnaces and the bubbling fluidized bed combustor FBC ,
superheater deposits were enriched in alkali relative to the fuel. For the circulating
Ž
.
fluidized bed combustors CFB examined, the deposits were enriched in both alkali and
Ž
.
alkaline earth metals. All deposits were also enriched not shown in sulfur, especially
Ž
.
for the units firing wood fuels, and chlorine for European units firing straw . To some
extent, the enrichment in calcium in the deposits from the CFB units is due to the
Ž
.
addition of limestone CaCO
to help control bed agglomeration and to control sulfur
3
emissions.
(
)
B.M. Jenkins et al.r Fuel Processing Technology 54 1998 17–46
33
Fig. 8. Normalized compositions of fuels and various deposits and slags from commercial biomass power
plants in the three component oxide system Si–K–Ca. Each corner of the diagram represents a composition
consisting entirely of the compound shown at that corner. Intermediate values are mass concentrations of the
oxides. The grid spacing is 10%. The first letter of the designation refers to the type of combustion unit, the
number following refers to individual units. The lower case letter refers to the type of material as shown in the
legend.
A number of indices have been developed for coal and other fuels relating composi-
tion to fouling and slagging behavior. These have proved for the most part to be of
limited value as predictors for biomass. One simple index, the alkali index, has become
popular in recent years as a threshold indicator for fouling and slagging, although all
biomass fuels exhibit fouling behavior, but at different rates depending on composition
Ž
and ash content woods tend not to foul at as high a rate as straws because at the same
fuel firing rate, there is less ash entering the combustor in the same time, and because
.
woods have more favorable ash compositions . The alkali index expresses the quantity
Ž
y
1
of alkali oxide in the fuel per unit of fuel energy
kg alkali GJ
or lb alkali
y
1
.
MMBtu
. It is computed as:
1rQ Y
a
Y
a
q
Y
a
1
Ž
.
Ž .
Ž
.
f
K O
N O
2
2
Ž
y
1
y
1
.
in which Q is the heating value either GJ kg
or MMBtu lb
as appropriate of the
Ž
fuel the value obtained from a bomb calorimeter, the higher heating value at constant
.
a
Ž
.
volume, dry basis, is commonly used , Y
is the mass fraction dimensionless of ash in
f
a
a
Ž
.
the fuel, Y
and Y
are the mass fractions dimensionless of K O and Na O in the
K O
N O
2
2
2
2
w x
y
1
Ž
ash. Miles et al. 1 have suggested that above 0.17 kg alkali GJ
0.4 lb alkali
y
1
.
y
1
Ž
y
1
.
MMBtu
fouling is probable, and above 0.34 kg GJ
0.8 lb MMBtu
, fouling is
virtually certain to occur. The threshold levels are determined principally on the basis of
Ž
y
1
.
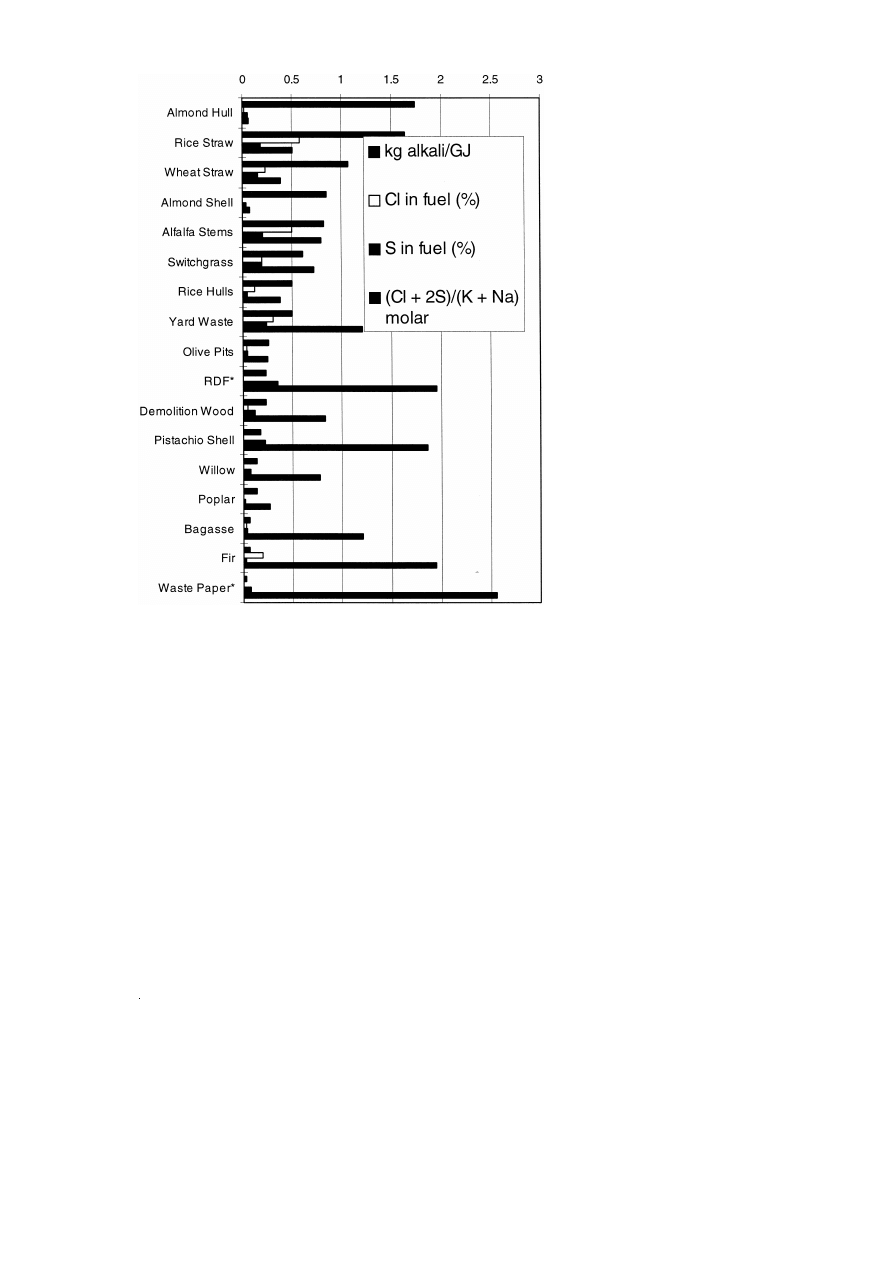
experience. Fig. 9 gives the alkali index kg GJ
in rank order for selected biomass
(
)
B.M. Jenkins et al.r Fuel Processing Technology 54 1998 17–46
34
Fig. 9. Alkali index, chlorine and sulfur concentrations, and chloride–sulfate ratios for biomass.
Ž
.
fuels see also Table 1 . The alkali index is incomplete as a descriptor of fouling
behavior, however, and is useful principally as a general guide. Also shown in Fig. 9 are
the Cl and S concentrations in the fuel, as well as an indicator expressing the
stoichiometric ratios of Cl and S to K and Na in the fuel. This latter value represents a
theoretical potential fraction of alkali that could be reacted as chloride and sulfate by Cl
Ž
and S originating with the fuel note that 2 mol of alkali metal are required for each
.
mole of sulfur in the formation of the sulfate . A value of 1 indicates that there is
sufficient Cl and S in the fuel to completely react the alkali, although this is not likely to
occur due to the complexity of the combustion reactions and variable mineral state of
the elements. Values in excess of unity are not meaningful, and serve only to indicate
that potentially more than enough Cl and S are present to completely react the alkali.
Values less than unity express an excess of alkali. Low alkali fuels tend to have high
(
)
B.M. Jenkins et al.r Fuel Processing Technology 54 1998 17–46
35
chloride and sulfate ratios, whereas high alkali fuels exhibit lower ratios, with Cl and S
concentrations limiting. The straws and grasses have relatively high alkali indexes as
well as higher chloride and sulfate ratios, consistent with the higher rates of fouling and
slagging observed for these fuels. Both almond hull and almond shell are regarded as
high fouling fuels. Although they contain large quantities of alkali, they have lower
chlorine and sulfur concentrations compared with many other fuels. Almond hulls and
shells are also known to contribute to rapid corrosion of boiler surfaces, but the role of
Cl and S in corrosion for these fuels has not been detailed.
The base-to-acid ratio has often been used as a measure of the fouling tendency of a
fuel ash, although its interpretation for biomass appears to be different from that for coal
w
x
18 . This ratio takes the form:
R
s
Fe O q CaO q MgO q K O q Na O r SiO q TiO q Al O
2
Ž
.
Ž
.
Ž .
b r a
2
3
2
2
2
2
2
3
where the label for each compound makes reference to its weight concentration in the
ash. The melting temperature of ash tends to be parabolic with respect to R
, reaching
bra
a minimum at intermediate values. For coal, a minimum is frequently located in the
vicinity of R
s
0.75, but for biomass the minimum tends to appear at lower values.
bra
Ž
w
x.
There are many similar empirical indices of ash behavior see, for example, Ref. 19 .
No single index has so far been developed that reliably describes the behavior of the ash
under all combustion conditions. A good knowledge of the combustion conditions as
well as the fuel and ash compositions is needed for any prediction of the fouling
characteristics of a biomass fuel.
Ž
.
Fig. 10. Binary phase diagram for the alkali oxides Na O and K O with silica SiO . Also shown are the
2
2
2
Ž
.
locations for the normalized compositions including only alkali and silica for three cereal straws: R is rice
straw, W is a high alkaline wheat straw, Y is a low alkaline wheat straw. Numbers following letter
w x
designations refer to treatments: 0 is untreated, 5 is laboratory water leached straw, 6 is rain washed straw 2 .

(
)
B.M. Jenkins et al.r Fuel Processing Technology 54 1998 17–46
36
Although the detailed chemistry of ash slagging and fouling is not yet fully
developed, removal of alkali and other elements is known to increase the fusion
temperature of the ash. Sugar cane bagasse is an example. In recent experiments, the
leaching of alkali metals plus chlorine by simple water washing has shown dramatic
w x
improvements in the fusion temperatures for straw ash 2 . This technique removes 80%
or more of the alkali, and better than 90% of the chlorine, an advantage in terms of
reducing corrosion and acid gas emissions as well as reducing the chlorine facilitation in
ash deposition. These rates exceed, in some cases, those measured by chemical
Ž
.
fractionation Table 1 , which suggests further development is needed in the standard
methods for evaluating such properties.
The impact of leaching is illustrated in Fig. 10 by means of a binary alkali–silica
phase diagram giving the liquidus temperatures for sodium-silicate and potassium-sili-
cate from 40 to 100% silica concentration. The points indicated on the graph represent
Ž .
treatments of three different straw materials: rice straw R , a high alkaline wheat straw
Ž
.
Ž
.
W , and a low alkaline wheat straw Y . The number following the letter is the
Ž
.
treatment: 0 is untreated as received from the field , 5 is laboratory washed, and 6 is
rain washed. Washing has in all cases increased the melting temperature of the ash. The
potential for decreasing the fusion temperature also exists. The fusion temperature for
Ž
.
the high alkaline wheat straw W0 can decrease if insufficient leaching occurs to shift
the composition above about 85% silica. The increase in fusion temperature is very steep
above 80% silica, indicating the substantial improvements available with even minor
amounts of leaching. There are other impacts of leaching on the combustion behavior, as
noted below.
4. The energy value of biomass
The standard measure of the energy content of a fuel is its heating value, sometimes
called the calorific value or heat of combustion. In fact, there are multiple values for the
heating value, depending on whether it measures the enthalpy of combustion, the
internal energy of combustion, and whether, for a fuel containing hydrogen, product
Ž
.
water is accounted for in the vapor phase or the condensed liquid phase. The enthalpy
of combustion is determined at constant pressure, and so includes flow work. With water
in the vapor phase, the lower heating value at constant pressure measures the enthalpy
change due to combustion. The higher heating value at constant pressure measures the
enthalpy change of combustion with water condensed. If the combustion is carried out at
constant volume, the internal energy change due to combustion with water in the
Ž
condensed state is the higher heating value at constant volume the standard value
.
measured with a bomb calorimeter , while the lower heating value at constant volume
measures the internal energy change with product water in the vapor phase. In addition,
moisture in the fuel reduces the heating value compared to a dry weight determination.
Determinations of thermal efficiency are often difficult to interpret because the basis for
the heating value determination is not reported. Thermal efficiencies must be reduced to
the same basis for direct comparison.
Fuel moisture is a limiting factor in biomass combustion due to its effect on heating
value. The combustion reaction is exothermic, the evaporation of water strongly

(
)
B.M. Jenkins et al.r Fuel Processing Technology 54 1998 17–46
37
Ž
.
endothermic. The autothermal limit self-supporting combustion for most biomass fuels
Ž
.
is around 65% moisture content wet basis mass of water per mass of moist fuel . Above
this point, insufficient energy is liberated by combustion to satisfy evaporation and
product heating. Practically, most combustors require a supplemental fuel, such as
natural gas, when burning biomass in excess of 50 to 55% moisture wet basis, and CO
and other products of incomplete combustion may be emitted in greater quantities
depending on combustor design.
There have been many attempts at correlating the heating value with the composition.
Formulas developed for coal, such as the Dulong equation, typically do not do well at
predicting for biomass. Some rough approximations can be made on single component
analyses. The heating value of biomass can be partially correlated with ash concentra-
tion, for example. Woods with less than 1% ash typically have heating values near 20
y
1
Ž
y
1
.
MJ kg
8600 Btu lb
. Each 1% increase in ash translates roughly into a decrease of
y
1
w x
0.2 MJ kg
4 , because the ash does not contribute substantially to the overall heat
released by combustion, although elements in the ash may be catalytic to the thermal
Ž
.
decomposition see later under kinetics .
Heating values can also be correlated with carbon concentration, with each 1%
y
1
w x
increase in carbon elevating the heating value by approximately 0.39 MJ kg
4 , a
w
x
result identical to that found by Shafizadeh 20 for woods and wood pyrolysis products.
The heating value relates to the amount of oxygen required for complete combustion,
Ž
.
w
x
with 14,022 J 13.3 Btu released for each g of oxygen consumed 20 . Cellulose has a
Ž
y
1
.
Ž
y
1
.
smaller heating value 17.3 MJ kg
than lignin 26.7 MJ kg
because of its higher
degree of oxidation. Other compounds, such as HC in the fuel with lower degrees of
oxidation, tend to raise the heating value of the biomass. Coals and HC liquids in
general have heating values greater than those for biomass because of the lower degree
of oxidation. Some lower rank coals have heating values nearly identical to biomass,
however.
There has been some confusion as to how the heating value of a fuel relates to the
‘quality’ of the fuel as an energy source. One misinterpretation is that the efficiency of a
power cycle can be interpreted solely on the basis of the heating value of the fuel. A
common mistake is to assume that because the heating value of biomass is lower than
most conventional fuels, the efficiency of a system using it will be lower by an equal
amount. Such is not the case. A standard measure of the energy value or ‘quality’ of fuel
is another thermodynamic property known as the availability of combustion. This
essentially measures the maximal work available from the fuel, and incorporates the
entropy effects of the second law as an ingredient of the measure, which the heating
values described above do not. This can also be viewed effectively from the standpoint
of the maximum temperature, the adiabatic flame temperature, attained under ideal
combustion. For a heat engine, the maximum possible efficiency is that of the Carnot
Ž
.
cycle although practical Carnot cycles cannot be built . The efficiency of the Carnot
cycle, h , is:
C
h s 1 y T T
3
Ž .
Ž
.
C
L
H
where T and T
are the low and high temperatures between which the cycle operates.
L
H
(
)
B.M. Jenkins et al.r Fuel Processing Technology 54 1998 17–46
38
The efficiency is increased with increased T . The higher the flame temperature, the
H
higher the theoretical maximum efficiency. Maximal efficiencies can therefore be
compared on the basis of the flame temperature, which depends not only on the heating
value, but on the composition as well, as the composition dictates the theoretical
quantity of air needed for combustion. The less air needed for reaction, the less diluent
in the form of atmospheric nitrogen must be heated along with combustion products to
Ž
achieve the adiabatic flame temperature since nitrogen does not participate in the
.
primary oxidation reactions, although it is important for the production of thermal NO .
x
Stoichiometric air fuel ratios for HC fuels are typically between 14 and 17, for biomass
they are 4 to 7, the lower values due largely to the higher oxygen contents of biomass.
Ž
.
Adiabatic flame temperatures for biomass dry basis lie typically in the range of 2000
Ž
. w
x
to 2700 K 3100 to 44008F
5,21 . For comparison, the adiabatic flame temperature of
Ž
.
methane, CH , in air, is approximately 2300 K 37008F . The higher heating value of
4
y
1
Ž
y
1
.
methane is 55.6 MJ kg
23,900 Btu lb
, or almost three times that of wood.
A simple computational procedure representing this idea is to normalize the heating
Ž
.
values by the total mass of products or reactants . This modified heating value is more
useful in evaluating fuel quality in the sense of potential conversion of thermal energy to
work in idealized heat engines. Fig. 11 illustrates both the traditional and modified
heating values for a variety of fuels with values all being normalized to those of one of
the bituminous coals. Pure compounds, coals, biomass fuels, biomass pyrolysis oils, and
energetic materials are all represented in the figure. The values designated HHV are
Ž
.
traditional higher heating values dry basis , and those designated EC are the modified
heating values, or energy contents. As illustrated, the relative values of these two
quantities can differ by factors of up to two within coal and biomass fuels and factors of
Ž
Fig. 11. Relative values of the standard heating value and the modified heating value heating value divided by
.
the mass of products, or equivalently the mass of air and fuel . The values shown are relative to a bituminous
Ž
.
coal Bituminous Coal 1 .

(
)
B.M. Jenkins et al.r Fuel Processing Technology 54 1998 17–46
39
Ž
over 20 when considering highly oxygenated fuels such as energetic materials e.g.,
.
nitrocellulose .
5. Rates of combustion
In addition to the energy released by combustion, the rate of combustion is also
important in the design of combustion systems. Occasionally, biomass combustion
power plants have been observed to be underdesigned in terms of boiler volume and
Ž
grate area for the rated capacity. Typical design heat release rates expressed per unit
.
grate area for a stoker fired travelling grate combustor are in the range of 2 to 4 MW
Ž
.
y
2
Ž
.
thermal m
. A whole tree combustion concept not yet built utilizes a design based
y
2
w
x
on a heat release rate of 6 MW m
, but this also uses a very deep fuel bed 22 . Some
circulating fluidized bed furnaces firing biomass have heat release rates approaching 10
MW m
y
2
. The rates at which biomass fuels burn depends on a number of physical
w
x
phenomena which have been set out in some detail by Kanury 23 . Two predominant
factors are the rates of heat transfer and the kinetic rates of reaction. Particle size
Ž
.
dominates the influence of heat transfer, with small, thin thermally thin particles
Ž
.
heating rapidly and coarser, thicker thermally thick particles heating more slowly.
Combustion occurs both in the gas phase with the burning of volatile materials released
through pyrolysis of the fuel upon heating, and heterogeneously in the solid phase as
char oxidation. The burning of volatiles is generally quite rapid and follows as fast as
volatiles are released, the oxidation of the char occurs much more slowly. The residence
time of the particle in the furnace and the environment of the particle are therefore
important to the total conversion attained through combustion, as well as the emissions
from the combustor.
Fundamental to the combustion rate are the rates of fuel pyrolysis and char oxidation.
The standard method of measuring these rates is via dynamic thermogravimetric analysis
Ž
.
Ž
.
TGA , whereby a small sample of the fuel 5–15 mg typically is heated at a controlled
rate in a controlled atmosphere while simultaneously recording weight, time, and
temperature. Other techniques are also employed. The resulting thermogram has a
characteristic shape for biomass.
Ž
Starting from room temperature, the sample is observed to dry if the sample contains
moisture which is normally the case, biomass being hygroscopic, and extreme care
.
needed in handling to achieve a bone dry sample in the TGA with a small weight loss
up to about 1508C. Between about 200 and 4008C there is a very rapid loss of weight
Ž
.
due to the evolution of volatile material, which in an oxidative environment e.g., air
will ignite and burn. Following the release of volatiles, there is a slow loss of weight as
Ž
.
the residual char decomposes. The conversion of a biomass fuel rice straw in an inert
Ž
.
Ž
atmosphere nitrogen is shown as a function of temperature in Fig. 12
refer to
.
1
experimental curve .
In this case, the weight loss has been converted to the dimension-
less conversion fraction by normalizing with respect to the total mass loss over the
1
A.S. Bining, A study of reaction kinetics for thermochemical conversion of rice straw, Unpublished PhD
dissertation, University of California, Davis, 1996.
(
)
B.M. Jenkins et al.r Fuel Processing Technology 54 1998 17–46
40
y
1
Ž
Fig. 12. Conversion of rice straw in nitrogen at 1.7 K s
by dynamic TGA. Experimental data thick dashed
.
Ž
.
Ž
.
line , three component model thick solid line , individual components narrow lines .
Ž
.
experiment. The shape of the thermogram or conversion curve is dependent on a
Ž
.
number of factors, including the type of fuel, the atmosphere oxidative, reducing, inert ,
Ž
y
1
and the heating rate for most apparatus this rate is rather low at 2 K s
or less,
y
1
.
whereas full scale combustors may heat fuel particles at 100–1000 K s
or more .
From the thermogram, kinetic parameters can be determined by which the overall rate of
Ž
.
reaction can be predicted along with appropriate models of heat transfer .
Also shown in Fig. 12 are the results of applying a multi-component kinetic model to
the prediction of the actual conversion. In this case, three simultaneous component
reaction models employing first order Arrhenius kinetics and based on the mass
fractions of hemicellulose, cellulose, and lignin, are superimposed to yield the total
conversion. Such multi-component models have proved useful in predicting the overall
kinetic behavior of a biomass fuel in oxidative, reducing, and inert atmospheres,
although the fitting technique is not entirely straightforward.
1
Metals in biomass are known to have an effect on reaction rates, and are thought to
be catalytic to pyrolysis. This has recently been observed with water leached straw, as in
w
x
Fig. 13 24 . Plotted in the figure is the rate of weight loss as a function of temperature.
There exists a definite kinetic shift for the leached material relative to the fresh,
Ž
untreated straw. Although the activation energy or energies, as two main components
.
are evolving in this region for the leached material is found to be lower than for the
untreated material in the main stage of pyrolysis, the frequency factor is also lower,
resulting in a slower overall rate of reaction. The result is consistent with what is known
about the effects of alkali-chlorides on the pyrolysis rates of biomass. However, under
(
)
B.M. Jenkins et al.r Fuel Processing Technology 54 1998 17–46
41
y
1
w
x
Fig. 13. Rate of weight loss under dynamic TGA for rice straw in air at 1.7 K s
24 . The leached straw was
soaked in distilled water for 24 h.
isothermal heating, the emission rate for volatiles has been observed to terminate earlier
with the leached material than for the untreated material. We have also observed that the
Ž
ignition requirements are lower for leached straw compared to untreated straw which
can be observed quite readily in the case of rice straw by suspending straws vertically
.
and igniting from below . Chlorine is known to retard flame propagation in polymeric
Ž
.
materials e.g., polyvinylchloride by terminating free radical chain reactions. Chlorine
w x
is leached from biomass by water 2 , and the burning phenomena observed may be
related to the role of chlorine in flame suppression. Much remains to be understood
about the chemistry of biomass combustion.
6. Pollutant emissions
Critically related to the properties of biomass are pollutant emissions generated by
Ž
.
combustion. Primary pollutants formed are particulate matter PM , CO, HC, oxides of
Ž
.
Ž
nitrogen NO , principally NO and NO , and oxides of sulfur SO , principally as
x
2
x
.
SO . Acid gases, such as HCl, may also be emitted, as may lead and other heavy
2
Ž
.
metals. CO and HC, including volatile organic compounds
VOC
and polycyclic
Ž
.
aromatic hydrocarbons PAH , are products of incomplete combustion. These species
are largely controlled by stoichiometry and proper fuel moisture control. Heavy metals
can be present in high concentration in certain urban wood fuels and RDF, especially if
w
x
treated or painted woods are present 25 .
Ž
.
PM includes soot, ash, condensed fumes tarsroils , and sorbed materials including
VOC and PAH. Most combustion generated particles are less than 1 mm aerodynamic
(
)
B.M. Jenkins et al.r Fuel Processing Technology 54 1998 17–46
42
Ž
.
particle size. Respirable particles 10 mm or smaller PM 10 are breathing hazards, as
they are retained deep in the alveoli of the lung. Mechanically generated particulate
matter including carry-over fuel fines and ash particles tend to be fairly large compared
to combustion aerosols. Biogenic silica in some materials, such as rice straw, is partly
released as fibrous particulate matter which has become of concern recently for lung
disease. Crystalline silica, including cristobalite, emitted from some power stations
Ž
.
burning high silica fuels such as rice husk hull , is also a breathing hazard and needs
careful control.
Emissions of oxides of nitrogen and sulfur arise predominantly from nitrogen and
sulfur in the fuel. Most commercial biomass combustors operate at temperatures low
enough that thermal NO
contributes only a small fraction of the total. NO
in
x
x
combination with HC photochemically leads to the formation of ozone, which is a lung
and eye irritant and a major problem in urban environments. Ozone is also damaging to
plants. Sulfur oxides are respiratory irritants, and their effects are enhanced in the
presence of PM due to transport deep within the lung. Both nitrogen and sulfur oxides
participate in reactions leading to acid rain.
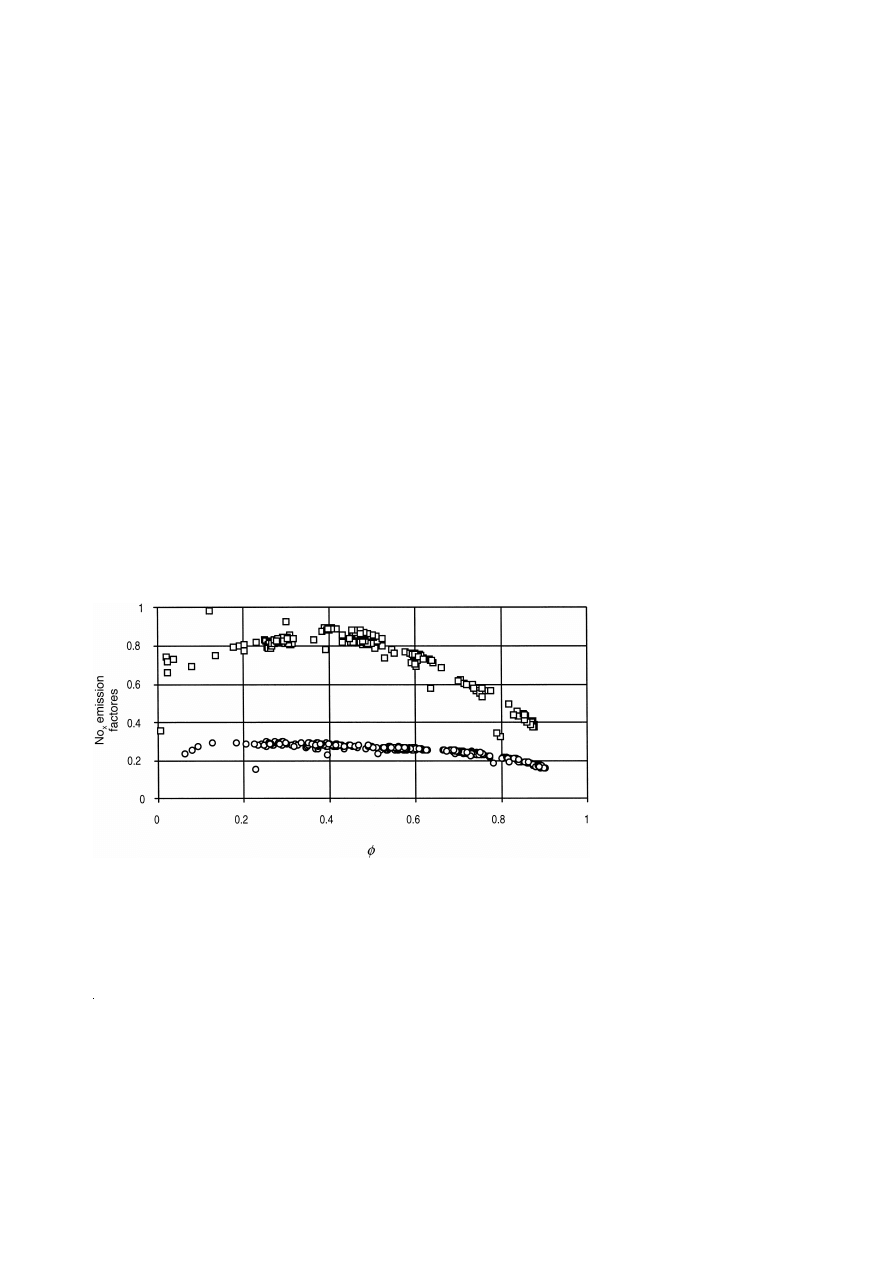
Uncontrolled NO
emissions also depend partly on stoichiometry. Examples are
x
w
x
shown in Fig. 14 for laboratory experiments burning wood and rice straw 26 at varying
Ž
equivalence ratio, f f s 1 represents the stoichiometric air–fuel ratio, values below 1
.
are fuel lean . The trend in NO emission with equivalence ratio is consistent with other
x
fuels and with much of the NO coming from fuel nitrogen. For HC fuels, NO formation
x
from fuel nitrogen occurs on time scales comparable to the HC oxidation, and is known
to be sensitive to equivalence ratio, with fuel lean conditions producing high yields and
w
x
fuel rich conditions producing low yields 27,28 . Under fuel rich conditions, the
relatively fast conversion of fuel carbon to CO competes for oxygen, leading to a
reduced availability of oxygen for NO production.
x
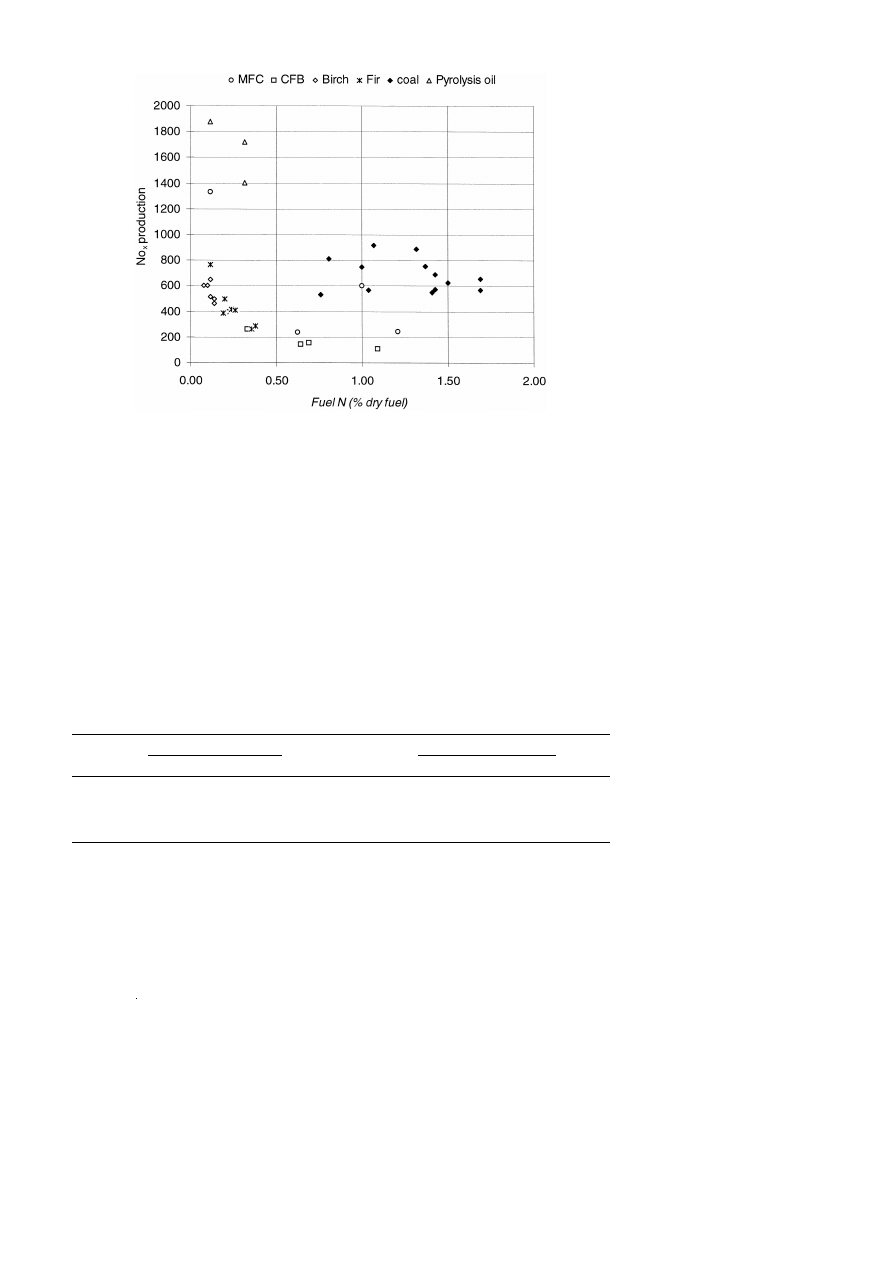
The fractional conversion of fuel nitrogen to NO has been shown to decrease with
x
w
x
increasing fuel N concentration for HC fuels and coal 27–29 . The declining N to NO
Ž
.
Ž
.
Fig. 14. NO emission factors at varying equivalence ratio, wood circles and rice straw squares .
x
(
)
B.M. Jenkins et al.r Fuel Processing Technology 54 1998 17–46
43
Fig. 15. Relative NO
production for biomass and biomass derived fuels and coal. MFC refers to biomass
x
w
x
w
x
fuels combusted in a laboratory multi-fuel combustor 26 . Pyrolysis oil is derived from wood 40 . Birch and
w
x
w
x
fir wood data are from Leckner and Karlsson 31 . Coal data adapted from Seinfeld 27 . Biomass power plant
w
x
data for CFB from Grass and Jenkins 30 .
conversion is postulated to be due to the formation of a nitrogen containing species
important to both the production and removal of NO. Data obtained from commercial
w
x
w
x
biomass-fueled FBC 30 and laboratory experiments with fir and birch wood 31 also
suggest declining fuel N conversion with increasing fuel N concentration, at least up to
1.1% N. Plotted in Fig. 15 is the relative production rate for a number of different fuels,
Ž
.
taken as the NO
concentration ppmv at 6% standard flue gas O
concentration
x
2
Ž
.
divided by the fuel N concentration % dry basis . A characteristic decline in relative
Table 3
Ž
.
Pollutant emission factors
% dry fuel
for open field burning, commercial biomass-fueled FBC, and
Ž
.
experiments using an entrained flow multi-fuel combustor MFC laboratory combustor without pollution
control
a
Field burn
CFB
MFC, f s 0.85
Wood
Rice straw
Wood
Rice straw
CO
5.54
3.22
0.002
0.45
0.30
NO
0.20
0.28
0.048
0.19
0.40
x
SO
0.01
0.06
0.01
0.005
0.035
2
HC
0.89
0.44
0.001
0.04
0.01
a
Includes ammonia and limestone injection. Fuels composed of urban and agricultural wood fuels with small
amounts of fruit pits and nut shells.

(
)
B.M. Jenkins et al.r Fuel Processing Technology 54 1998 17–46
44
NO production with increasing fuel N is observed for biomass. In addition, the relative
x
NO
production for biomass appears to be less than that for coal, although this
x
conclusion is only weakly supported by the limited results for biomass. Reduced furnace
temperatures for biomass compared to coal likely account for much of the difference.
The burning and control conditions can have substantial impact on the emission rates
Ž
of pollutant species. Table 3 lists pollutant emission factors mass of pollutant emitted
.
per unit mass of dry fuel consumed for three types of biomass burning: uncontrolled
w
x
open field burning 32 , controlled combustion in commercial circulating fluidized bed
w
x
power plants 30 , and laboratory experiments conducted in an entrained flow MFC
w
x
without post combustion emission control 26 . NO
and SO
emission levels are
x
2
roughly comparable between the open fires and MFC experiments. NO emissions from
x
the CFB units are reduced about four times compared to the uncontrolled emissions,
w
x
which is consistent with computed NO reduction efficiencies in commercial units 30 .
x
7. Engineering practice
This paper has briefly discussed only a few of the properties of biomass important to
the design and development of combustion and other types of energy conversion
systems. The literature is not entirely consistent in the reporting of properties, and there
are not standard engineering practices yet available to which the industry can refer. The
Ž
issue of standardizing biomass analysis methods has been addressed previously e.g.,
w
x.
Refs. 33–35 . Some protocols have been defined to provide a common basis for
Ž
w
x.
analysis e.g., Refs. 36–39 , but are still incomplete with respect to the suite of
property evaluations that can or should be recommended. There is a greater need for
standardized engineering practice in the sampling and analysis of, as well as the
interpretation of analytical data for biomass fuels. Further development in this regard is
encouraged.
References
w x
1 T.R. Miles, T.R. Miles, Jr., L.L. Baxter, R.W. Bryers, B.M. Jenkins, L.L. Oden, Alkali deposits found in
biomass power plants: a preliminary investigation of their extent and nature, National Renewable Energy
Laboratory, Golden, CO, 1995.
w x
Ž .
2 B.M. Jenkins, R.R. Bakker, J.B. Wei, On the properties of washed straw, Biomass and Bioenergy 10 4
Ž
.
1996 177–200.
w x
3 T.A. Milne, A.H. Brennan, B.H. Glenn, Sourcebook of Methods of Analysis for Biomass and Biomass
Conversion Processes, Elsevier, Amsterdam, 1990.
w x
Ž
.
4 B.M. Jenkins, Physical properties of biomass, in: O. Kitani, C.W. Hall Eds. , Biomass Handbook, Chap.
5.2, Gordon & Breach, New York, NY, 1989.
w x
5 B.M. Jenkins, Properties of biomass, Biomass Energy Fundamentals, EPRI TR-102107, Electric Power
Research Institute, Palo Alto, CA, 1993.
w x
6 E.S. Domalski, T.L. Jobe, Jr., T.A. Milne, Thermodynamic data for biomass materials and waste
components, American Society of Mechanical Engineers, New York, 1987.

(
)
B.M. Jenkins et al.r Fuel Processing Technology 54 1998 17–46
45
w x
7 L.L. Baxter, T.R. Miles, T.R. Miles, Jr., B.M. Jenkins, D. Dayton, T. Milne, R.W. Bryers, L.L. Oden,
The behavior of inorganic material in biomass-fired power boilers-field and laboratory experiences, Vol.
II, Alkali deposits found in biomass power plants, National Renewable Energy Laboratory, 1996.
w x
8 H.L. Chum, M.M., Baizer, The Electrochemistry of Biomass and Derived Materials, ACS Monograph
183, American Chemical Society, Washington, DC, 1985.
w x
Ž
.
9 T.P. Schultz, F.W. Taylor, Wood, in: O. Kitani, C.W. Hall Eds. , Biomass Handbook, Gordon & Breach,
New York, 1989, pp. 133–141.
w
x
Ž
.
10 S. Sudo, F. Takahashi, M. Takeuchi, Chemical properties of biomass, in: O. Kitani, C.W. Hall Eds. ,
Biomass Handbook, Gordon & Breach, New York, 1989, pp. 892–933.
w
x
Ž
.
11 L.R. Lynd, Large-scale fuel ethanol from lignocellulose, Appl. Biochem. Biotechnol. 24–25 1990
695–719.
w
x
12 C.E. Wyman, N.D. Hinman, Ethanol, fundamentals of production from renewable feedstocks and use as a
Ž
.
transportation fuel, Appl. Biochem. Biotechnol. 24–25 1990 735–753.
w
x
13 L.L. Baxter, The release of iron during coal combustion, Sandia report SAND95-8234PUC-1409, Sandia
National Laboratories, Livermore, CA 94551, 1995.
w
x
14 L.L. Baxter, Ash deposition during biomass and coal combustion: a mechanistic approach, Biomass
Ž . Ž
.
Bioenergy 4 2
1993 85–102.
w
x
15 B.M. Jenkins, L.L. Baxter, T.R. Miles, T.R. Miles, Jr., L.L. Oden, R.W. Bryers, E. Winther, Composition
of ash deposits in biomass fueled boilers: results of full-scale experiments and laboratory simulations,
ASAE Paper No. 946007, ASAE, St. Joseph, MI, 1994.
w
x
16 M.K. Misra, K.W. Ragland, A.J. Baker, Wood ash composition as a function of furnace temperature,
Ž . Ž
.
Biomass Bioenergy 4 2
1993 103–116.
w
x
17 B.M. Jenkins, R.R. Bakker, J.B. Wei, Removal of inorganic elements to improve biomass combustion
properties, Proceedings 2nd Biomass Conference of the Americas, National Renewable Energy Labora-
tory, Golden, CO, 1995.
w
x
18 D. Salour, B.M. Jenkins, M. Vafei, M. Kayhanian, Control of in-bed agglomeration by fuel blending in a
Ž . Ž
.
pilot scale straw and wood fueled AFBC, Biomass Bioenergy 4 2
1993 117–133.
w
x
Ž
.
19 E.C. Winegartner
Ed. , Coal fouling and slagging parameters, American Society of Mechanical
Engineers, New York, 1974.
w
x
Ž
.
20 F. Shafizadeh, Basic principles of direct combustion, in: S.S. Sofer, O.R. Zaborsky Eds. , Biomass
Conversion Processes for Energy and Fuels, Plenum, New York, 1981, pp. 103–124.
w
x
21 B.M. Jenkins, J.M. Ebeling, Correlation of physical and chemical properties of terrestrial biomass with
conversion, Proceedings Energy from Biomass and Wastes IX, Institute of Gas Technology, Chicago, IL,
1985.
w
x
22 G.A. Wiltsee, Biomass energy fundamentals, Vol. 1, EPRI TR-102107, Electric Power Research Institute,
Palo Alto, CA, 1993.
w
x
Ž
.
23 A.M. Kanury, Combustion characteristics of biomass fuels, Combustion Sci. Technol. 97
1994
469–491.
w
x
24 B.M. Jenkins, R.R. Bakker, J. Gilmer, J.B. Wei, Combustion characteristics of leached biomass,
Presented at Developments in Thermochemical Biomass Conversion, Banff, Canada, 1996.
w
x
25 C.T. Donovan Associates, Air emissions and ash disposal at wood-burning facilities: a sourcebook and
case studies for the Great Lakes region, Great Lakes Regional Biomass Energy Program, 1995.
w
x
26 B.M. Jenkins, L.L. Baxter, Uncontrolled pollutant emissions from biomass combustion under simulated
boiler furnace conditions, Proceedings AFRC-JFRC Pacific Rim International Conference on Environ-
mental Control of Combustion Processes, Maui, HI, 1994.
w
x
27 J.H. Seinfeld, Atmospheric Chemistry and Physics of Air Pollution, Wiley, New York, 1986.
w
x
28 C.T. Bowman, Chemistry of gaseous pollutant formation and destruction, in: W. Bartok, A.F. Sarofim
Ž
.
Eds. , Fossil Fuel Combustion, Chap. 4, Wiley, New York, 1991.
w
x
29 J.A. Miller, C.T. Bowman, Mechanism and modeling of nitrogen chemistry in combustion, Prog. Energy
Ž
.
Combust. Sci. 15 1989 287–338.
w
x
30 S.W. Grass, B.M. Jenkins, Biomass fueled fluidized bed combustion: atmospheric emissions, emission
Ž . Ž
.
control devices and environmental regulations, Biomass Bioenergy 6 4
1994 243–260.
w
x
31 B. Leckner, M. Karlsson, Gaseous emissions from circulating fluidized bed combustion of wood,
Ž . Ž
.
Biomass Bioenergy 4 5
1993 379–389.

(
)
B.M. Jenkins et al.r Fuel Processing Technology 54 1998 17–46
46
w
x
32 B.M. Jenkins, S.Q. Turn, Primary atmospheric pollutants from agricultural burning: emission rate
determinations from wind tunnel simulations, ASAE Paper 946008, ASAE, St. Joseph, MI, 1994.
w
x
33 T.A. Milne, H.L. Chum, F. Agblevor, D.K. Johnson, Standardized analytical methods, Biomass Bioen-
Ž . Ž
.
ergy 2 1
1992 341–366.
w
x
34 H.L. Chum, T.A. Milne, Feedstock characterization and recommended procedures, Proceedings First
Biomass Conference of the Americas, National Renewable Energy Laboratory, Golden, CO, 1993, pp.
1685–1703.
w
x
Ž
.
35 T.A. Milne, Voluntary standards for biomass for fuels and chemicals, Biomass 22 1990 343–351.
w
x
36 B. McBurney, Wood refuserbiomass fuel specification guidelines, Proceedings TAPPI Engineering
Conference, 1993.
w
x
37 M.W. Hope, Specification guidelines for tire derived fuel, Proceedings TAPPI Engineering Conference,
1993.
w
x
38 J. Clement, G. Elliott, B. McBurney, R.S. Skowyra, Biomass boiler performance test procedure,
Proceedings 1992 TAPPI Engineering Conference, 1992.
w
x
39 J. Alexander, Wood fuel standards, ETSU BrW3r00161rREP, Energy Technology Support Unit,
Department of Trade and Industry, Great Britain, 1994.
w
x
40 L. Baxter, B. Jenkins, Baseline NO
emissions during combustion of wood-derived pyrolysis oils,
x
Proceedings Specialists Workshop on Biomass Pyrolysis Oil Combustion, Estes Park, CO, 1994.
Wyszukiwarka
Podobne podstrony:
Comparative assessment of the energy effects of biomass combustion
Characteristic and adsorption properties of iron coated sand
20 255 268 Influence of Nitrogen Alloying on Galling Properties of PM Tool Steels
Physical Properties of Chemical Compounds
52 737 754 Relationship Between Microstructure and Mechanical Properts of a 5%Cr Hot Works
McNally & Boleda Relational adjectives as properties of kinds
32 425 436 Ifluence of Vacuum HT on Microstructure and Mechanical Properties of HSS
Cytotoxic Properties of Some Medicinal Plant Extracts
W Borek Mechanical properties of high manganese austenitic TWIP type steel
Mechanical Properties of Native and Cross linked Type I Collagen Fibrils Yang
L 1 Preliminaries Properties of number sets
Fibrillar Structure and Mechanical Properties of Collagen
Effect of heat treatment on microstructure and mechanical properties of cold rolled C Mn Si TRIP
95 1373 1389 A new Investigation on Mechanical Properties of Ferro Titanit
18 223 236 Comparison of Tribo Properties of Different Cold Works
Mid FIR Properties of ELAIS Sources
71 1021 1029 Effect of Electron Beam Treatment on the Structure and the Properties of Hard
MECHANICAL PROPERTIES OF METALS
ASTM D638â99 (1999) [Standard Test Method for Tensile Properties of Plastics] [13p]
więcej podobnych podstron