
1
Abstract
This paper will examine how DTrace, a kernel-
based dynamic scriptable tracer, can be
effectively used for reverse engineering tasks.
DTrace offers an unprecedented view of both
user and kernel space, which has many
interesting implications for security researchers.
In this paper we will introduce DTrace,
comparing it to existing debuggers and tracers.
We will then walk the reader through various
applications of DTrace. We will show how to
monitor for stack and heap overflows, generate
code coverage graphs, trace code paths visually
in target applications over the network with IDA
Pro, and discuss intrusion detection and evading
DTrace.
Introduction
DTrace was first introduced in Solaris 10 which
was released in 2004 by Sun Microsystems. Its
development began in 2001 with Sun kernel
engineer Bryan Cantrill as the sole developer.
The composition of the DTrace core
development team was later completed with the
addition of Adam Leventhal and Mike Shapiro.
Sun Microsystems describes Dtrace as a
“dynamic tracing framework for troubleshooting
systemic problems in real time on production
systems.” DTrace is made up of several
components in the OS kernel and user space and
tied together through the D scripting language.
DTrace dynamic tracing allows you to view
nearly all activity in the system on demand
through software embedded sensors called
“probes.” OS X Leopard and Solaris ship with
thousands of possible probes in places ranging
from deep inside the kernel to user-level
applications like web browsers and chat
programs. This extensive visibility provides the
data that an administrator, developer, or user
needs to understand the dynamic and complex
relationships between software components.
Questions can be asked and answered by
querying the data gathered by DTrace probes
through D scripts. D is a block-based
interpreted language that was created for use
with DTrace. D syntax is a described as a
subset of C, but is structured much like the
syntax of Awk. The dynamic aspect of DTrace
comes from the fact that probes can be enabled
when needed, and are removed once the
requested data has been gathered. This is a very
unobtrusive way of instrumenting a system or
process, and it is the relative safety of DTrace
probes that enables its use on production
systems.
DTrace was Sun’s first software component to
be released under their own open source
Common Development and Distribution License
(CDDL). The open sourcing of DTrace paved
the way for the framework to be included in
other operating systems. However, skepticism
about CDDL had slowed efforts to port DTrace
to FreeBSD. RedHat decided to compete with
their SystemTap product instead. DTrace was
DTrace: The Reverse Engineer’s
Unexpected Swiss Army Knife
Tiller Beauchamp
David Weston
Science Applications International Corporation
{Tiller.L.Beauchamp,David.G.Weston}@saic.com
2
ported to Apple’s OS X 10.5 “Leopard,”
released in October 2007. Two weeks later it
was announced that DTrace had been ported to
QNX. The DTrace community continues to be
very dynamic.
DTrace Vernacular
The processing and buffering of all probe data
takes place in the DTrace kernel module. Each
probe definition is composed of the four
elements separated by colons. The general
form is:
provider:module:function:name
Provider: A provider is a DTrace kernel module,
which logically groups together various probes
that are related. Examples of providers in
DTrace include: fbt which instruments kernel
functions, pid; which instruments user land
processes, and syscall which instruments system
calls.
Module: A module is the program location of
the group of probes. This could be the name of
a kernel module where the probes exist, or it
could be a user land library. Example modules
are the libc.so library or the ufs kernel module.
Function: Specifies the specific function for
which this probe should fire on. This could be
something like a particular function in a library
such as printf() or strcpy().
Name: This is usually the meaning of the probe.
Sample names are “entry“ or “return” for a
function or “start” for an I/O probe. For
instruction level tracing this field specifies the
offset within the function.
Understanding the DTrace vernacular allows
you to understand the purpose of a particular
probe. You can list all the probes on a DTrace
instrumented system by provider by running the
“dtrace –l” command. It will list the probes in
the format described above.
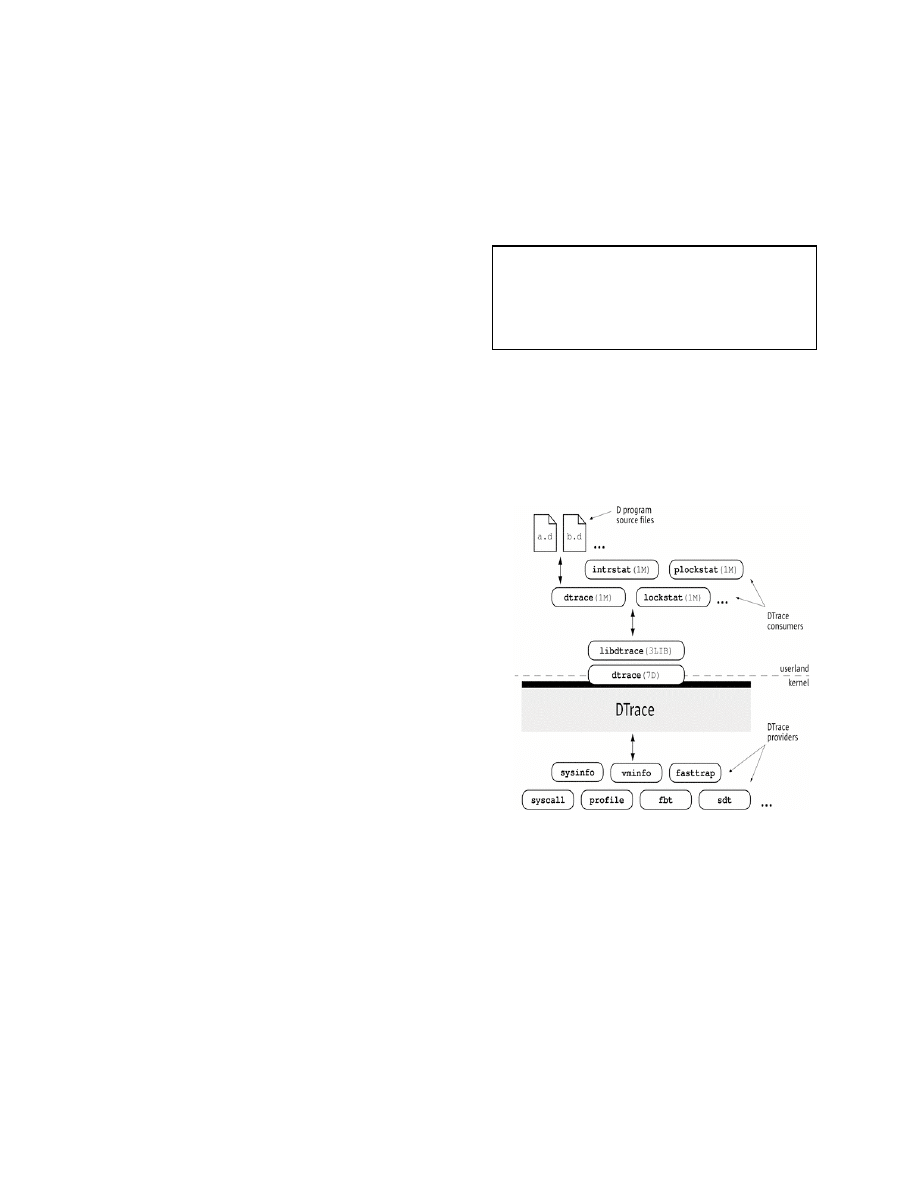
DTrace Architecture
The bulk of DTrace functionality resides within
the kernel. This means that probe data collected
in user land must be first copied into kernel
entry points before it can be processed. To
provide bi-directional communication between
user space and the kernel, DTrace provides a
conduit in the form of the shared library
libdtrace.
The DTrace user command depends on libtrace
to compile a D script into an intermediate form.
Once the program is compiled, it is sent into the
operating system kernel for execution by the
DTrace kernel modules. It is at this time that the
probes specified within your script are discretely
activated. After the script has completed its
execution, the activated probes are removed and
probe definition
/ optional predicate /
{
optional action statements;
}
Figure 1. Anatomy of D Program
Figure 2. DTrace Architectural Overview
source: [1]

3
the system is returned to its normal operating
state.
The D Language
As stated earlier the D language syntax is a
subset of C. Unlike C, the D language does not
use traditional conditionals such as “if … else.”
Instead D uses the concept of a “predicate” as a
conditional statement. A predicate expression is
evaluated as the probe is triggered. If the
predicate is evaluated as true, then any
statement or action associated with the clause
executes. If the predicate value is false then the
probe is not triggered and instrumentation
continues. Several predicates and probes can be
linked together to form a D program. DTrace
gives accessibility to an enormous amount of
data. Effective D scripts should only instrument
what is needed and choose the right action for
the job.
DTrace and Reverse Engineering
Reverse engineering in the context of security
research is essentially the search to understand
how a piece of software works. Reverse
engineering requires time-consuming careful
analysis, and DTrace can make that analysis
much easier and faster in a number of ways.
The greatest strength of DTrace is the scope and
precision of the data that can be gathered by
relatively simple D scripts. A reverse engineer
can learn a lot about a piece of software from
just one or two well place probes. This puts
DTrace in category of a ‘rapid development’
environment for reverse engineers.
The remainder of this paper will explore how
DTrace can be used for various common reverse
engineering tasks. First we explain how DTrace
can be used for detecting and pinpointing stack
based buffer overflow. Secondly we examine
detecting heap-based overflows and other heap
memory management issues. We then look at
how to use DTrace with IDA Pro to visualize
block level code coverage. Finally we discuss
intrusion detection possibilities with DTrace and
various ways to avoid DTrace’s monitoring.
Stack Overflow Monitoring
One interesting challenge is to use DTrace to
build a stack overflow detector. Such a monitor
has been written in Python based on PyDbg,
which is included with the PeiMei framework.
[3] PeiMei’s detector works by setting
breakpoints and single-stepping through the
application. We wish to build a similar monitor
using DTrace that does not require the use of
breakpoints.
The simplest approach is to monitor the EIP
register for a known bad value, such as
0x41414141, or a particular value you might
find in an exploit you want to analyze, for
instance 0xdeadbeef. This would require
activating only one probe for each function
entry. Still, this could be a significant number
of probes. The table below lists some common
applications and the number of entry probes
available on OS X for those applications. These
numbers include library functions.
Program
Probes
Firefox
202561
Quicktime
218404
Adium
223055
VMWare Fusion
205627
cupsd
91892
sshd
59308
ftp client
6370
However, we cannot accurately estimate in
advance
the
performance
impact
of
instrumenting every entry probe on an
application since probes will only have an
impact when they are hit. An application may
Figure 3. Number of entry probes in
common applications on OS X 10.5

4
import many libraries but only make a few
function calls. Conversely, an application may
call one function in a tight loop, creating a
heavy performance hit when traced.
To avoid dropping probes and hindering
application performance, we first ensure our
probes do not trace unimportant modules and
functions that are called too frequently. The
DTrace script shown in figure 4 can be used to
report the most frequently called functions.
When the above script is run against FireFox
and QuickTime Player it is obvious which
functions and libraries can be exclude from our
traces. In QuickTime Player, there are a large
number of calls to the __i686.get_pc_thunk.cx
function. Both applications are making the
majority of their calls to functions in the
libSystem.B.dylib module. By excluding these
frequently hit functions and libraries we will see
a significant performance improvement when
tracing these applications. Our experience with
DTrace has shown that it is much more effective
to build specific scripts that activate a limited
number of probes, rather than to try to build a
generic DTrace script that can apply to every
situation.
Once a reasonable subset of the application has
been selected for tracing, a simple DTrace
script, shown below in figure 4, can be used to
check the value of the next instruction at
function return time.
This probe will fire whenever the value of EIP
is 0x41414141. Typically this would cause the
application to crash. But with DTrace we can
stop the application before it attempts to execute
the instruction at 0x41414141. This allows us
to carry out data collection and analysis, such as
printing CPU register values and function
parameters, dumping memory, or attaching a
traditional debugger and examining the stack.
This example makes the limiting assumption
that when an overflow occurs, EIP will be
0x41414141. This may be reasonable for doing
basic fuzzing, but an effective stack overflow
detector should be able to detect overflows in a
much more generic fashion. This can be
achieved by recording the return address in the
stack frame created at function entry time. The
recorded return address can then be compared to
the return value at function return time. We do
not compare the value of EIP with the saved
return value because of the way DTrace handles
tail call optimizations ([2]). DTrace reports a
tail call as a return from the calling function,
and an entry to the function being called.
However, the EIP at function return time is the
first instruction of the function being called, not
the return value stored in the stack frame. This
will trip up an integrity monitor that compares
saved return values with the actual value of EIP.
Instead, we alert when the saved return address
is different from the current return address, and
EIP is equal to the current return address.
The above logic works well for most
applications. However, some peculiarities of
DTrace must be accounted for. In particular,
DTrace can not trace functions that use jump
#!/usr/sbin/dtrace -s
pid$target:::entry {
@a[probemod,probefunc] = count();
}
END { trunc(@a,10); }
Figure 4. Script to count function calls
#/usr/sbin/dtrace -s
pid$target:a.out::return
/ uregs[R_EIP] == 0x41414141 / {
printf("Don’t tase me bro!!!");
printf(“Module: %s Function %s”,
probemod, probefunc);
...
}
Figure 5. Checking EIP for a bad value

5
tables. [2] When DTrace cannot determine what
is happening in a function it chooses to not
allow instrumentation. For this reason, you may
end up with a function for which there is an
entry probe, but no exit probe. This is the case
when DTrace cannot fully instrument a function
due to its use of function jump tables. If this
type of function is called and accounted for in
our stack monitor, but never returns, then our
list of saved return addresses will become out of
sync with the real stack. These functions must
be ignored during tracing in order to properly
monitor the stack. DTrace’s “–l” command
parameter can be used to list matching probes
for a given probe definition. The list of entry
probes can be compared with the list of return
probes to determine which functions our
monitor should ignore.
With these considerations implemented, our
DTrace-based stack overflow monitor was able
to detect the recent RTSP overflow in
QuickTime Player. The initial output is shown
below. The full output of the program includes
the call trace.
The monitor will catch stack overflows that
depend on overwriting the return address. In
many cases overflows will modify more data on
the stack than just the return address. This can
result in invalid memory access attempts when
the function attempts to dereference overflowed
data before it returns. This situation is more
common when fuzzing applications, rather than
when detecting well crafted exploits that
properly control EIP. An additional DTrace
script can be used to pinpoint the exact
instruction that causes the overflow. This is
done by tracing each instruction in the
vulnerable function, and checking the stack
return value after each instruction. Once the
overflow is detected, we know that the last EIP
value is the instruction that caused the overflow.
It may be worth exploring other ways DTrace
can be used to monitor for overflow. Similar to
the heap overflow monitor discussed below,
function parameter sizes and addresses could be
recorded and later verified when bcopy,
memcpy or strcpy are used to copy data into
those locations. Another approach would be to
record the stack frame boundaries and when the
bcopy, memcpy or strcpy functions are called,
then verify that the parameter will not write past
a frame boundary. This is an area of future
work.
Heap Overflow Monitoring
One of the most powerful features of DTrace is
ability to ‘hook’ functions generically. As
shown above this functionality when combined
with Ruby or some other object-oriented
scripting language can make for a very powerful
reverse engineering platform. In recent years
many development teams have embraced secure
coding practices. The increased awareness
among software companies along with advances
in operating system protections such as non
executable stacks have made traditional “low
hanging fruit” like stack overflows increasingly
rare in widely used platforms. This has made
# ./eiptrace.d -q -p 4450
STACK OVERFLOW DETECTED
STACK OVERFLOW DETECTED
STACK OVERFLOW DETECTED
Module: QuickTimeStreaming
Function: _EngineNotificationProc
Expected return value: 0x1727bac4
Actual return value: 0xdeadbeef
Stack depth: 14
Registers:
EIP: 0xdeadbeef
EAX: 0xffffeae6
EBX: 0x11223344
ECX: 0x00000005
EDX: 0x00000000
EDI: 0x31337666
ESI: 0x41424142
EBP: 0xdefacedd
ESP: 0x183f6000
...
Figure 6. A Stack overflow detected
6
‘heap overflows’ an increasingly import attack
vector for exploit writers and security
researchers.
Nemo, of FelineMenace.or,g wrote the de facto
treatise on “Exploiting Mac OS X heap
overflows” in Phrack 63 [11]. His attack relies
on manipulating the size and frequency of
allocations to the heap (on OS X called
“zones”), combined with a heap overflow to
overwrite function pointers contained in the
initial heap struct called ”malloc_zone_t.” The
struct is loaded into process space and contains
function pointers to various dynamic allocation
routines such as malloc(), calloc(), realloc(),
etc… When the addresses to these functions are
overwritten the next call can result in arbitrary
code execution. This is just one of many heap
exploitation techniques that rely on tracking the
size, amount, and allocation patterns of the heap
structures.
The emergence of the heap as one of the main
exploit attack vectors has brought along with it
the need for an advance in tools to help the
reverse engineer understand how the heap
structure evolves.
There are a number of tools released recently
which focus on understanding the way the heap
evolves from a reverse engineering perspective.
On the Windows platform, the Immunity
Debugger has an extremely powerful API which
provides many tools for understanding the way
a heap evolves. On the Linux and Solaris
platforms, Core Security’s HeapTracer tool
written by Gerado Richarte uses truss or ltrace
to monitor system calls which allocate or de-
allocate dynamic memory. Building on this
same idea as a platform the heap overflow
monitor included with RE:Trace keeps track of
the “heap” state by hooking dynamic allocation
functions. RE:Trace’s Heap Smash detector
does more then just track allocations to the
heap, it goes one step further by also hooking
functions that attempt to allocate data to the
heap.
The RE:Trace Heap Smash Detector works by
creating a Ruby hash which keeps track of the
request size of malloc() calls as a value and the
valid return pointer as a key. Its also keeps
track of any calloc(), realloc(), or free() calls
accordingly. This running ‘tab’ or the state of
the heap is then used to check whether
operations using the space will overflow it. A
second hash keeps track of the stack frame
which allocated that original memory chunk.
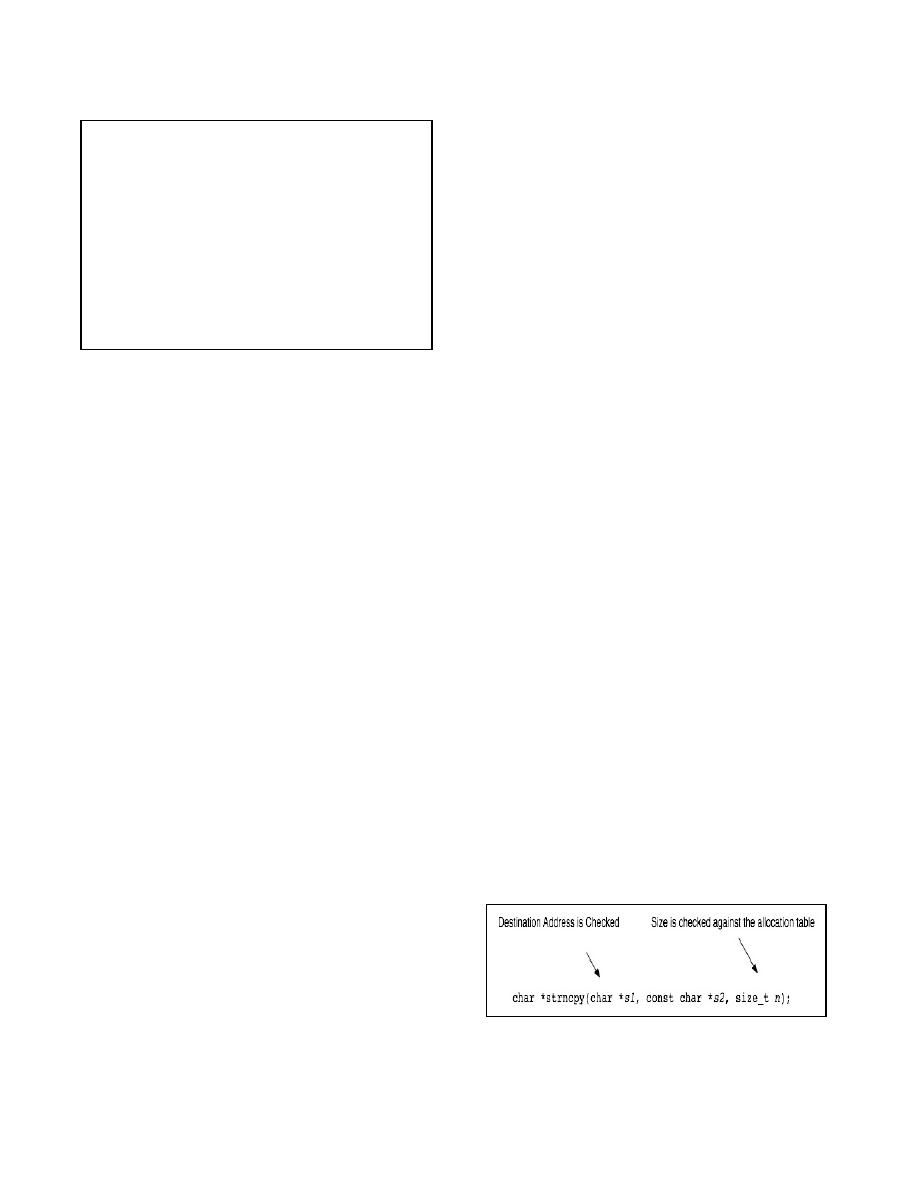
For example, in RE:Trace the standard C
strncpy() call is hooked and the destination
address and size parameters are checked against
the malloc() hash to see what the valid size of
allocated region is. If the size of the strncpy() is
larger then the allocated block we know that a
heap overflow has occurred. The heap smasher
has identified precisely where the overflow
occurred, how large it is, and what stack frame
made the original malloc() called. Not bad for a
relatively short script!
Figure 8. Strncpy() being hooked
pid$target::malloc:entry{
self->trace = 1;
self->size = arg0;
}
pid$target::malloc:return
/self->trace == 1/
{
ustack(1);
printf("mallocreturn:ptr=0x%p|size=%
d", arg1, self->size);
self->trace = 0;
self->size = 0;
}
Figure 7. Probe instrumenting malloc entry
size argument and return pointer
7
A similar vulnerability tracing technique has
been created using Microsoft’s Detours suite.
[14] The tool called “VulnTrace” uses a DLL
injected into process space which intercepts
functions imported in IAT table so it can inspect
function arguments for security flaws. This
method is much more laborious and time
consuming than the method used for RE:Trace,
and must be tailored to each application being
instrumented. Performance and memory
addressing may be affected because of the
additional DLL. DTrace is implemented as an
operating system component with very little
overhead and does not interfere with the
software under test.
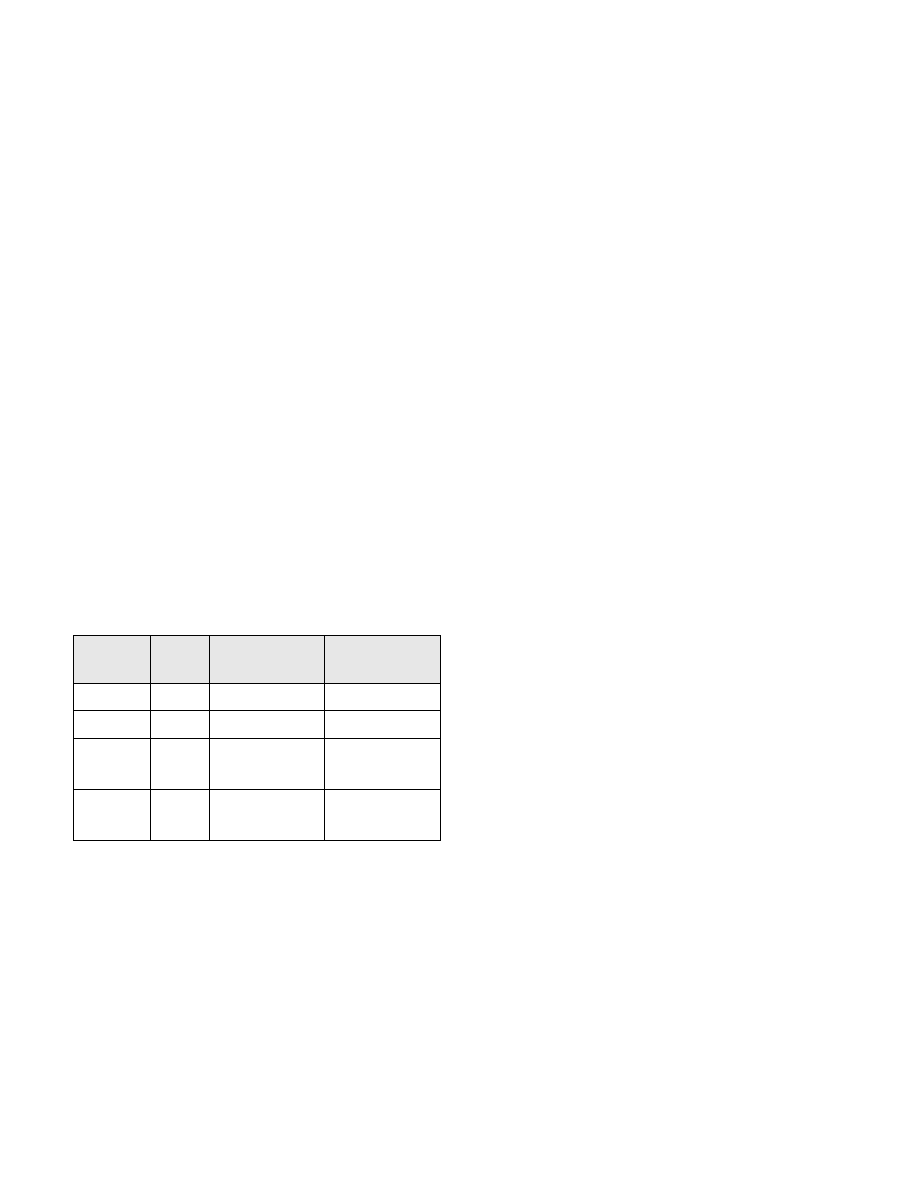
There are some caveats about the OS X zone
allocation algorithm which must be taken into
account when implementing the heap smash
detector. As noted by Nemo is his article
“Exploiting OS X heap overflows,” OS X keeps
separate “zones” or heaps for different sized
allocations. The following table from A.
Singh’s “Mac OS X internals” shows the
division of the ‘zones’ by allocation size.
Zone
Type
Zone
Size
Allocation
Size (bytes)
Allocation
Quantum
Tiny
2MB
< 1993
32 bytes
Small
8MB 1993-15,359
1024 bytes
Large
-
15,360 -
16,773,120
1 page
(4096 bytes)
Huge
-
> 16,773,120
1 page
(4096 bytes)
Figure 9. Scalable Zone Types on OS X
Leopard. Source: [6]
We can keep a running tally of each of the zones
by hooking the allocation sizes and using
separate hashes for each. One interesting aspect
about the tiny and small “zones” is that they are
fixed at 2mb and 8mb respectively making it
easier to calculate how much has been allocated
to each.
We can easily spot double free() and double
malloc() errors using the structure laid out
above. One interesting fact about OS X zones
noted by Nemo is the allocation algorithm in use
will not free() a zone located at the same
address twice in most cases. [11] Yet under the
right circumstances, (i.e. the attempted double
free() is the same size and free()’d pointer still
exists) the condition is exploitable and therefore
worth detecting. We are able to monitor for
precisely this condition with the RE:Trace Heap
Smash Detector. Future additions to the
framework may included integration with IDA
disassembled via IDARub for automatic probe
creation.
Code Coverage
Function level tracing can give us some hints as
to which parts of code have been executed
during a particular run of the software.
Combined with symbols resolution this can be
quite meaningful for someone wishing to gain
an understanding of the behavior of an
application. Function level tracing can be
particularly helpful if you wish to understand
how a certain vulnerable function can be
triggered. But in terms of code coverage,
function level measurements are fuzzy at best.
There is no real indication as to the complexity
of a function, or even as to how much of the
code inside a function was executed. At the
function level, we can learn about what the
application is doing, but we cannot obtain a
good measurement of how well we have tested
our software.
Block level tracing can provide us with much
more accurate measurements of code coverage.
A block of code is a set of instructions for which
if the first instruction is executed, then all
instructions in the block are executed.
Conditional jump instructions separate blocks of
instructions. This is represented in the IDA Pro
disassembler graph view as illustrated below.
8
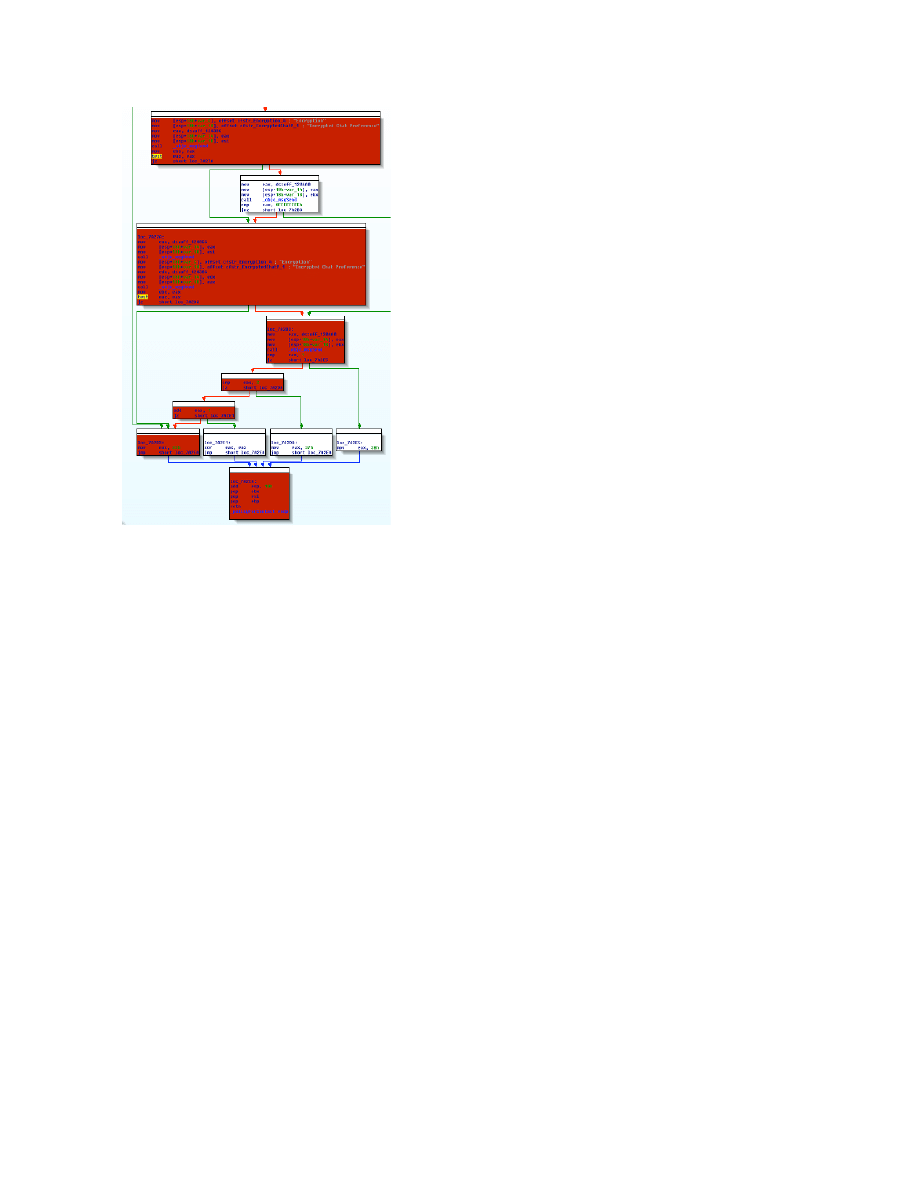
Figure 10. IDA Pro Disassembler graph
The arrows between each block represent the
possible code paths that may be taken during
execution. When auditing an application, we are
interested in how many blocks of code we can
execute. DTrace can provide us with this
measurement with its ability to do instruction
level tracing. This gives us the ability to see
which blocks in a function are being executed
and which are not. Combining run time
instruction traces with static binary analysis, we
can answer questions such as what percentage
of total instructions were executed, what
percentage of blocks were executed, how many
times a block executed, and which blocks were
never executed. This provides important
metrics to software testers, and can also be used
as feedback into a smart or evolutionary fuzzing
engine that changes its behavior depending on
the feedback it gets from its monitor.
Instrumenting probes at every instruction in a
large application can be very expensive in terms
of performance. It helps to narrow the scope to
a single library that the application imports, or
just the application code itself. Further
improvements can be made with the help of
static analysis. Only a single instruction needs
to be instrumented per block.
With DTrace’s instruction level tracing, specific
instruction probes are specified as an offset
within its function, rather than a memory
address relative to the start of the library or the
instructions global address in virtual memory.
For example, the following probe definition will
fire at the instruction that at the offset 3f in the
function getloginname of the /usr/bin/login
program:
pid4573:login:getloginname:3f {}
DTrace is strictly a runtime analysis tool and
has no notion of code blocks. Static analysis
with a disassembler must be used to determine
the addresses of the first instruction of every
block. Once a list of addresses to instrument has
been determined, they must be mapped from the
global address to the offset within their function
so that they can be used with DTrace probes.
We use a combination of technologies to
connect DTrace with IDA Pro to visualize our
code coverage in real time. Ruby-dtrace is used
to wrap libdtrace, allowing programmatic
responses to be coded in Ruby and executed
when particular probes fire [4]. IDArub is used
to allow a remote interface to the IDA Pro API
[5]. IDA Pro is run on a Windows system and
the Ruby environment sends commands to IDA
over the network. When a probe fires, indicating
that an instruction is executing in the traced
application, that instruction is colored in IDA
Pro. The comment field for that instruction can
also be updated to indicate the number of times
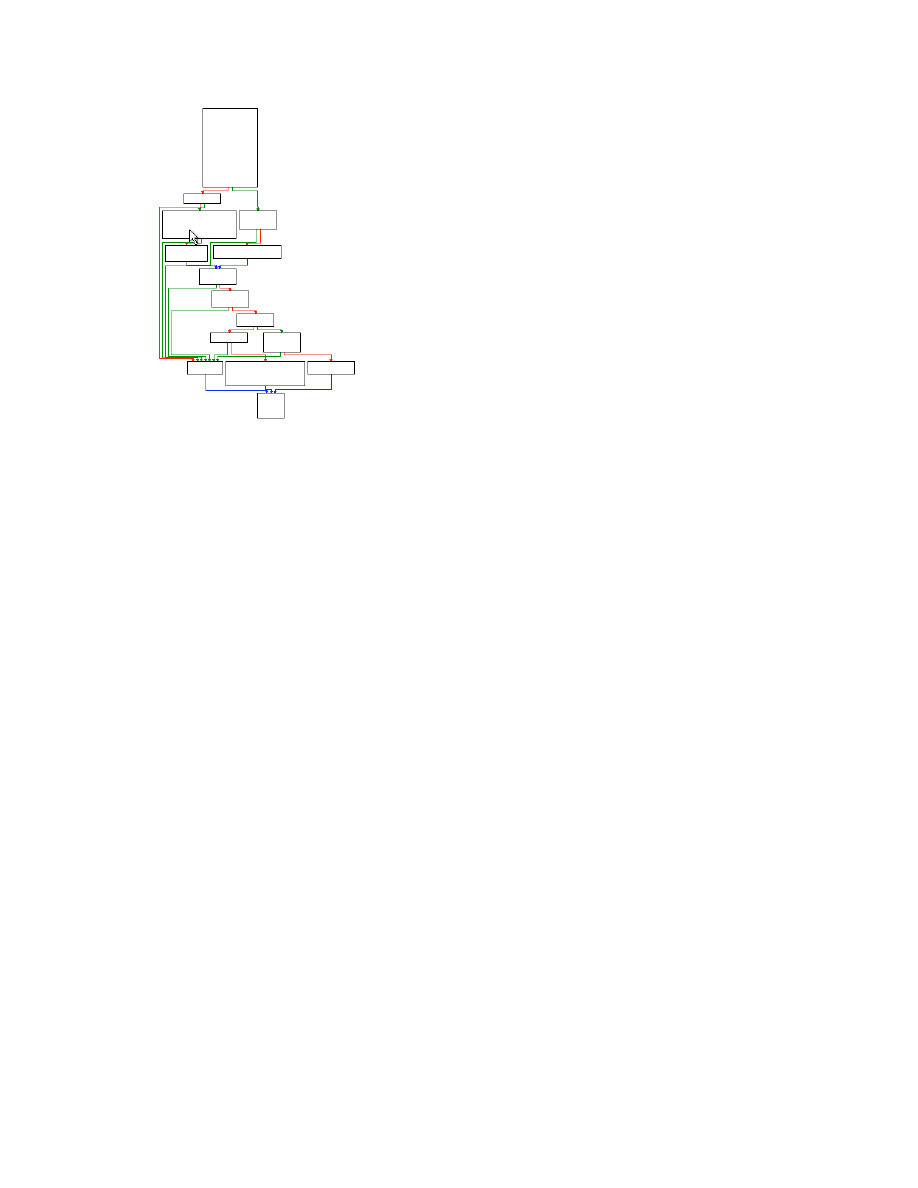
the instruction has executed. Figure 11 shows
how the code coverage is represented. Red
blocks indicate code that has been executed
while white block have not been executed.
9
Figure 11. Code coverage representation in
IDA
The code coverage visualization makes it easy
to see when large portions of code are not being
executed. Manual analysis can be carried out to
determine what conditions are necessary to
cause the missed code to be executed.
RE:Trace: DTrace/Ruby Framework
for Reverse Engineering
As noted earlier, Chris Andrew’s Ruby-DTrace
adds flexibility to the already powerful DTrace
framework enabling reverse engineer’s to write
scripts that would not be possible in the D
language alone. Yet there are indeed many
pieces of boiler plate functionality (i.e. CPU
Context, memory dump/search, etc..) that
normal reverse engineering activities require.
We have packaged together this functionality,
along with additional features into a framework
we call RE:Trace. Integrating the power of
Ruby and DTrace, RE:Trace is the framework
which powers the aforementioned Stack Pin
Point, Heap Smash, and Code Coverage scripts.
Bundling features reverse engineers need into an
object oriented framework with many helper
functions, allows RE:Trace to become the basis
for many powerful tools. RE:Trace is being
actively developed and will soon be released
with features such as command line interaction
via Ruby’s IRB, and the ability to enabled
probes without using D syntax.
Using DTrace Defensively
The fact that DTrace instruments nearly the
entire system makes DTrace extremely
extensible and applicable to a number of tasks.
While we have mainly looked at DTrace from a
reverse engineering perspective there are ways
to use DTrace’s feature set to defend a system.
Commercial HIDS (Host-Based Intrusion
Detection Systems) have become fairly common
place on win32 systems. Vendors have put out
products like McAfee’s “Entercept” and Cisco’s
“Security Agent”. According to McAfee’s
white paper “System Call Interception,” the
“Entercept” technology works by altering the
function pointers in the system call table within
the kernel. The function pointers are altered so
that the “Entercept” kernel driver can hook any
system call and apply its security method to
determine whether or not the call made by the
user land process is valid. Cisco’s “Security
Agent” has essentially the same architecture.
By design, DTrace allows a user to do
essentially the same type of system call
intercept as McAfee and Cisco’s commercial
offerings in an almost completely unobtrusive
way. A custom host-based intrusion detection
system based on system call introspection would
be simple to implement in the D Language.
Using Subreption’s publicly available exploit
for the QuickTime 7.3 RTSP stack based buffer-
overflow as an example we can see how a quick
custom HIDS can be created easily with a D
Script. [10]
The Subreption exploit for QuickTime 7.3 on

10
Leopard OS X 10.5.1 uses a classic ‘return-to-
libc’ attack to exploit the stack overflow. A
‘return-to-libc’ exploit leverages a buffer
overflow to setup arbitrary arguments on the
targets stack before returning into the System()
function to execute a system call. This is
probably the most popular exploit technique on
platforms that have non-executable stacks. The
payload of many of these attacks rely on a series
of system calls which usually involve a call to
“/bin/sh”, or “/bin/bash”. If we are looking at
protecting a vulnerable QuickTime 7.3 from a
“return-to-libc” exploit we would first profile
QuickTime’s normal operation through system
calls. DTrace can be used to do this profiling
with the script shown in figure 12.
Once we have established a profile or average
system calls made, we can begin to create
signatures for possible attacks that will not
create “false positives” Clearly blacklisting
known attacks based on or one two public
exploits will not suffice for an ‘Enterprise’
HIDS but it will serve to illustrate how a HIDS
could be built on DTrace. (for further details
take a look at Sun’s DTrace based HIDS patent
application #
20070107058)
By comparing the output of system calls from
the short D script shown during normal
operation and operation while being exploited,
we can determine which system calls can be
used as ‘signatures’ for our HIDS D script.
After analyzing the ‘return-to-libc’ attack
system calls, it is obvious that QuickTime
Player would not normally make a system call
to execute ‘/bin/sh’ during everyday operation
(of course this is a trivial example). Using the
DTrace predicate “/execname == "QuickTime
Player" & args[0] == "/bin/sh"/” would suffice
to create a generic D script which would detect
the default payload for the Subreption
QuickTime exploit and its variants. After
detecting the exploit with the syscall probe it is
trivial to trigger an action which logs, prints out,
or stop()’s the process under attack. The entire
script, shown in figure 13, is a just a few lines.
Although the above example is extremely basic,
it could certainly be improved upon with the
addition of attack signatures. There are several
advantages to implementing a ‘custom’ HIDS.
The first is that attacks cannot test the
effectiveness of a custom HIDS without
attacking the target. Commercial off-the-shelf
HIDS can be profiled in a controlled
environment to ensure that exploits evade
detection. The second, is that for a custom
application, the HIDS can be tailored to avoid
false positives. Generic system call monitoring
can often mislabel normal operation. Using
Ruby-DTrace to implement a HIDS could allow
a developer to create a much more advanced
database complete with signatures stored in a
relational database and a Ruby-On-Rails
interface.
#!/usr/sbin/dtrace -q -s
proc:::exec
/execname == "QuickTime Player"
&& args[0] == "/bin/sh"/
{
printf("\n%s Has been p0wned!
it spawned %s\n", execname,
args[0]);
}
Figure 13. Trivial QuickTime HIDS D script
#!/usr/sbin/dtrace -q –s
proc:::exec
/execname == "QuickTime
Player"/
{
printf("%s execs %s\n",
execname, args[0])
}
Figure 12. Profiling QuickTime System Calls

11
Hiding Applications From DTrace
In a
blog posting dated January 18,
2008, DTrace core developer Adam Leventhal
came across some surprising behavior while
using DTrace to monitor system-wide behavior:
“Apple is explicitly preventing DTrace from
examining or recording data for processes which
don't permit tracing. This is antithetical to the
notion of systemic tracing, antithetical to the
goals of DTrace, and antithetical to the spirit of
open source.” [11]
To accomplish this, Apple is using the same
method it uses to keep GDB from attaching to
certain software. As explained by Landon Fuller
“
PT_DENY_ATTACH is a non-standard
ptrace() request type that prevents a debugger
from attaching to the calling process.” [10]
Both Apple’s version of GDB and DTrace
check to see if this flag is set before a process
can be debugged or instrumented. Landon Fuller
is also the author of a kext or Kernel Extension
for XNU that allows any process to be
instrumented by DTrace. By altering the ptrace
function pointer in the sysent struct within the
XNU kernl with a pointer to a custom PTrace
wrapper, Fuller enables anyone to use DTrace in
its intended form.
In his presentation at the Chaos Computer
Congress entitled
“B.D.S.M The Solaris 10
way” Archim
reports significant work that gives
his rootkit “SInAR” the capability to hide from
DTrace on the Solaris platform.
The problem
from a rootkit writer’s perspective is that
DTrace’s fbt provider keeps a list of all modules
loaded in the kernel. So if even if you have
found a way to hide your process from mbd, ps,
etc., a clever admin with DTrace may still detect
a kernel-based rootkit. One problem Archim
came across is that even modules which have
mod_loaded and mod_installed set to 0 will still
be discovered by DTrace. Archim describes the
method he uses to hide from DTrace:
“When you combine a call to
dtrace_sync() and then
dtrace_condense(&fbt_provider), you will
be removed from the list of providing
modules in DTrace.”
This will force DTrace to remove the rootkit
from DTrace’s internal link list of providers and
have its probes set on inactive. At the present
time, the 0.3 version of SInAR on vulndev.org
only works on SPARC. There is currently no
known rootkit for OS X Leopard or Solaris 10
x86 capable of hiding from DTrace
Conclusion
DTrace is a powerful tool that allows us to
collect an enormous range of information about
a running program. Like any tool, it is important
to understand its strength and weakness. In
general, DTrace is very well suited for
collecting and reporting statistics or specific
values at a given point in time. This turns out to
be very useful for reverse engineers, who are
interested in pinpointing very specific
conditions, such as copy a large value into a
small space, as well as understanding general
behavior, such as the growth patterns of heaps.
The introduction of DTrace to the reverse
engineering world invites many opportunities
for improving related techniques. We have
shown how DTrace can be used to detect and
pinpoint stack and heap overflows, and visualize
code coverage. We have also discussed DTrace
as an intrusion detection tool, and issues related
to subverting DTrace. There are many more
interesting areas to explore for future work.
These include implementing automated fuzzer
feedback based on code coverage results or
parameter values; detection of rootkits using
DTrace timing calculations; and kernel bug
pinpointing.

12
References
[1] Bryan Cantrill, Mike Shapiro and Adam Leventhal,
Advanced DTrace – Tips, Tricks and Gotchas, slide 43.
[2] Sun Microssystems, Inc., Solaris Dynamic Tracing
Guide, pp.
[3] Pedram Amini, Pin Pointing Stack Smashes,
http://dvlabs.tippingpoint.com/blog/2007/05/02/pin-
pointing-stack-smashes
[4]
Chris
Andrews,
Ruby-DTrace,
http://rubyforge.org/projects/ruby-dtrace/
[5] spoonm, IdaRub, REcon 2006
[6] Amit Singh, Mac OS X Internals A Systems Approach,
Addison-Wesley, 2006
[7] Landon Fuller, Fixing ptrace(pt_deny_attach, ...) on
Mac
OS
X
10.5
Leopard,
http://landonf.bikemonkey.org/code/macosx/Leopard_PT
_DENY_ATTACH.20080122.html, 2008
[8]Adam Leventhal, Mac OS X and the missing probes,
http://blogs.sun.com/ahl/entry/mac_os_x_and_the, 2008
[9]Archim, “SUN – Bloody Daft Solaris Mechanisms.”,
Chaos Computer Congress, 2004
[10] Subreption, LLC., QuickTime RTSP Redux,
http://static.subreption.com/public/exploits/qtimertsp_red
ux.rb
[11]Nemo, “Exploiting OS X Heap Overflows”, Phrack
Magazine, Issue 63
[12]Richard McDougall,
Jim Mauro,
Brendan Greg,
“Solaris™ Performance and Tools: DTrace and MDB
Techniques for Solaris 10 and OpenSolaris” Prentice Hall,
2006
[13] Stefan Parvu, “DTrace & DTraceToolkit-0.96”,
http://www.nbl.fi/~nbl97/solaris/dtrace/dtt_present.pdf
[14] Various, “The Shellcoder's Handbook: Discovering
and Exploiting Security Holes”, Wiley and Sons, 2007
Wyszukiwarka
Podobne podstrony:
NET Reverse Engineering Tutorial Episode 1 by MaDMAn H3rCuL3s
A ZVS PWM Inverter With Active Voltage Clamping Using the Reverse Recovery Energy of the Diodes
NET Reverse Engineering Tutorial Episode 2 by MaDMAn H3rCuL3s
1 Java Reverse Engineering Tutorial
Niven, Larry RW 2 The Ringworld Engineers
Running head REVERSE ENGINEERING MALWARE
Special Features of the F4R Engine N T 3200A
The Unorthodox Engineers Colin Kapp
The Electrical Engineering Handbook 105 Man Machine Systems
Reverse Engineering & Memory patching
How does the car engine work
Dorum, The Sagas and the Reversed
Frankowski, Leo Conrad 1 The Crosstime Enginee
Reverse Engineering Malware
EDP Gnat Schematics ( Reverse Engineered )
Seinfeld 912 The Reverse Peephole (a k a The Man Fur)
The Hobbit An Unexpected Journey
3x13 The Fire Engine
więcej podobnych podstron