
Predicting heats of detonation using quantum
mechanical calculations
Betsy M. Rice
*
, Jennifer Hare
US Army Research Laboratory, AMSRL-WM-BD, Bldg. 4600, Aberdeen Proving Ground, MD 21005-5069, USA
Abstract
Heats of detonation of pure explosives and explosive formulations are predicted using quantum mechanical (QM)
information generated for isolated molecules. The methodology assumes that the heat of detonation of an explosive compound
of composition C
a
H
b
N
c
O
d
can be approximated as the difference between the heats of formation of the detonation products
and that of the explosive, divided by the formula weight of the explosive. Two sets of decomposition gases were assumed: the
first corresponds to the H
2
O–CO
2
arbitrary [J. Chem. Phys. 48 (1968) 23]. The second set assumes that the product
composition gases consist almost solely of H
2
, N
2
, H
2
O, CO, and CO
2
. The heats of formation used in this method are
predicted using equations that convert QM information for an isolated energetic molecule to condensed phase heats of
formation. Solid phase heats of formation predicted using the methods described herein have a root mean square (rms)
deviation of 13.7 kcal/mol from 72 measured values (corresponding to 30 molecules). For the calculations in which the first set
of decomposition gases is assumed, predicted heats of detonation of pure explosives with the product H
2
O in the gas phase
have a rms deviation of 0.138 kcal/g from experiment; results with the product H
2
O in the liquid state have a rms deviation of
0.116 kcal/g from experiment. Predicted heats of detonation assuming the second set of decomposition gases have a rms
deviation from experiment of 0.098 kcal/g. Heats of detonation for explosive formulations were also calculated, and have a
rms deviation from experiment of 0.058 kcal/g. Published by Elsevier Science B.V.
Keywords: Density functional theory; Quantum mechanical; GGA; Heat of detonation
1. Introduction
Methods for predicting the performance of new
energetic materials before synthesis or formulation
are recognized to be cost-effective, environmentally-
desirable and time-saving capabilities to use in the
early stages of the development process [1,2]. Theo-
retical screening of notional materials allows for
identification of promising candidates for additional
study and elimination of poor candidates from further
consideration, thus reducing costs associated with
synthesis, test and evaluation of the materials. Current
computational capabilities and advances in density
functional theory (DFT) [3] now allow quantum
mechanical (QM) molecular characterization to be
included in the variety of predictive methodologies
used in assessing energetic materials. The state of the
methods and computers allow for rapid and accurate
QM calculations of individual energetic molecules,
resulting in the capability to predict conformational
structures, stabilities and vibrational spectra of ener-
getic materials. Further, many macroscopic properties
of bulk energetic materials can be determined from QM
information calculated for isolated molecules [4–13].
Thermochimica Acta 384 (2002) 377–391
*
Corresponding author. Tel.:
þ1-410-306-1904;
fax:
þ1-410-306-1909.
E-mail address: betsyr@arl.army.mil (B.M. Rice).
0040-6031/02/$ – see front matter. Published by Elsevier Science B.V.
PII: S 0 0 4 0 - 6 0 3 1 ( 0 1 ) 0 0 7 9 6 - 1

In a series of studies, Politzer and co-workers have
established that correlations exist between many
condensed phase properties of a material and the QM-
determined electrostatic potential of the isolated mole-
cule. These properties include aqueous solvation free
energies, lattice energies in ionic crystals, diffusion
coefficients, solubilities, heats of vaporization, sub-
limation and fusion, boiling points, partition coeffi-
cients and critical constants, and impact sensitivities
[4–12]. We utilized these ideas in the area of energetic
materials, and have reported our successes in devel-
oping a computational method to predict heats of
formation of energetic materials in the gas, liquid
and solid state [13] from QM calculations of the
isolated molecules. The heats of formation can then
be used to assess potential performance of the material
under idealized gun firing conditions or to predict its
detonation properties.
In this report, we describe the use of the QM
predictions of the heats of formation of solid explo-
sives in calculating their heats of detonation. The heat
of detonation is a quantity used to assess a candidate’s
detonation performance. The heat of detonation, Q,
defined as the negative of the enthalpy change of the
detonation reaction [2], is the energy available to do
mechanical work [14] and has been used to estimate
potential damage to surroundings [15]. This quantity
can be determined from the heats of formation of the
reactants and the products of the detonation through
the relation [2]
Q
ffi
½DH
f
ðdetonation productsÞ DH
f
ðexplosiveÞ
formula weight of explosive
(1)
In order to evaluate the heat of formation of the
detonation products, the equilibrium composition of
the product gases must be determined. This determi-
nation can be made through experimental measure-
ment, thermochemical equilibrium calculations, or by
identifying an appropriate decomposition reaction.
Kamlet and Jacobs, in describing their simple method
for calculating detonation properties of C–H–N–O
explosives, assumed that C–H–N–O high explosives
generally have crystal densities ranging from 1.7 to
1.9 g/cm
3
and are used at high proportions of theore-
tical maximum density [2]. They argue that for explo-
sives at these densities, the product compositions can
be represented by the ‘‘H
2
O–CO
2
arbitrary’’, which
predicts N
2
, H
2
O and CO
2
(but not CO) as the impor-
tant detonation products [2,15]
C
a
H
b
N
c
O
d
!
1
2
cN
2
þ
1
2
bH
2
O
þ ð
1
2
d
1
4
b
ÞCO
2
þ ða
1
2
d
þ
1
4
b
ÞC
(2)
To demonstrate the method and test the validity of
their assumptions, Kamlet and Jacobs calculated the
heats of detonation for 28 pure explosives or explosive
formulations assuming the H
2
O–CO
2
arbitrary and
used the results to predict the detonation pressures.
Their results were in good agreement with values
obtained from thermochemical calculations [2]. The
Kamlet and Jacobs method is appealing because it
requires as input only the heats of formation of the
explosive and simple gas phase products (assuming
the H
2
O–CO
2
arbitrary) and it can be applied to
explosive mixtures as well as pure explosives. For
an explosive formulation, the heat of formation of the
mixture can be calculated from the heats of formation
of the individual components and knowledge of their
percent concentration in the mixture [15]
DH
mixture A
B
f
¼ ð% composition AÞDH
A
f
þ ð% composition BÞDH
B
f
(3)
In this paper, we will demonstrate the Kamlet and
Jacobs method of calculating the heat of detonation
[2], except we will use predicted heats of formation of
the reactants and products rather than measured
values. The method will be applied to both pure
explosives and explosive formulations, and compared
against results predicted using the thermochemical
code Cheetah 2.0 [14] with the JCZS-EOS library
[16] and against experimental values, where known.
We will also evaluate Eq. (1) using product composi-
tions obtained through thermochemical calculations
rather than those assuming the H
2
O–CO
2
arbitrary.
Additionally, predicted heats of formation of com-
pounds not previously calculated nor reported in our
earlier work [13] will be compared against experi-
ment, where known.
2. Computational details
Generalized gradient approximation (GGA) DFT
characterizations of all molecules reported in this
378
B.M. Rice, J. Hare / Thermochimica Acta 384 (2002) 377–391

study and in our previous work [13] were performed
using the 6–31G
basis set [17] and the hybrid
B3LYP [18,19] density functional. This modest level
of theory was selected due to the size of some of the
molecules chosen for study. An optimized geometry
was obtained for each molecule, and a normal mode
analysis performed to determine if it was a stable
structure. All calculations were performed using the
Gaussian 98 suite of quantum chemistry codes [20]
and the default settings therein. Since most of the
molecules reported herein are large, flexible, polya-
tomic molecules, we assume that each has more than a
single stable conformation. Due to time and computer
limitations, we did not perform an extensive search for
the global minimum energy conformation for each
molecule. Rather, we have assumed that the energy of
the local minima associated with the optimized struc-
tures reported herein are within a few kcal/mol of the
global minimum.
In this work, we are reporting heats of detonation of
solid explosives only; thus, we require the solid phase
heats of formation for the systems under considera-
tion. Condensed phase heats of formation can be
obtained from the gas phase heats of formation, using
Hess’ law of constant heat summation [21]
DH
f
ðsolidÞ ¼ DH
f
ðgasÞ DH ðsubÞ
(4)
DH
f
ðliquidÞ ¼ DH
f
ðgasÞ DH ðvapÞ
(5)
provided that the heats of sublimation [DH (sub)] and
vaporization [DH (vap)] are available. Politzer and co-
workers have shown that the following functional
relationships exist between these quantities and sta-
tistically-based quantities s
2
tot
and n associated with
the electrostatic potential of a molecule on the 0.001
electron/bohr
3
isosurface of the electron density
[8,10,12]
DH
ðvapÞ ¼ a
ffiffiffiffiffiffiffiffiffiffi
ðSAÞ
p
þ b
ffiffiffiffiffiffiffiffiffi
s
2
tot
n
q
þ c
(6)
and
DH
ðsubÞ ¼ a
0
ðSAÞ
2
þ b
0
ffiffiffiffiffiffiffiffiffi
s
2
tot
n
q
þ c
0
(7)
where SA denotes the molecular surface area on the
specified isosurface. These equations were parameter-
ized for a number of condensed phase molecular
systems pertinent to energetic materials; parameters
and details are given in [13]. In that work, the root
mean square (rms) deviation of the predicted heats of
vaporization from 27 experimental values is 1.7 kcal/
mol, and the rms deviation of the predicted heats of
sublimation from 36 experimental values is 3.6 kcal/
mol [13].
Also, as described in [13], gas phase heats of
formation of energetic materials can be predicted
using the method of atom equivalents, represented as
DH
i
¼ E
i
X
n
j
e
j
(8)
where E
i
is the B3LYP/6–31G
energy of molecule i at
its equilibrium conformation, the atom equivalents e
j
represent energies of the atomic components of mole-
cule i and n
j
denotes the number of j atoms in molecule
i. These atom equivalent energies include corrections
due to errors inherent in the B3LYP/6–31G
calcula-
tions, and were determined by parameterizing Eq. (8)
to experimental gas phase heats of formations for 35
molecules with functional groups common to ener-
getic materials. Details of the parameterization and
resulting atom equivalents are given in [13]. The
predicted results for the 35 molecules have a rms
deviation from experiment of 3.1 kcal/mol. Applica-
tion of Eqs. (6)–(8) in Eqs. (4) and (5) resulted in
predicted liquid and solid phase heats of formation for
24 and 44 energetic materials, respectively, that have
rms deviations from experiment of 3.3 and 9.0 kcal/
mol, respectively.
In this study, we have performed QM characteriza-
tions of other energetic molecules and predicted solid
phase heats of formation. These heats of formation and
those calculated in [13] are used to predict the heats of
detonation with the Kamlet and Jacobs prescription
given in Eq. (1). Also, we have used Eq. (3) to predict
heats of formation for a few explosive formulations,
and applied the results to predict their heats of detona-
tion. These results will be compared against experi-
ment, where known, and against values calculated
using the thermochemical code Cheetah 2.0 [14]
and the JCZS product library [16].
In order to use Eq. (1) assuming the H
2
O–CO
2
arbitrary, one must have the heats of formation of
the products, in this case, gas phase H
2
O and CO
2
.
Experimental values for these are
57.8 and
94.1 kcal/mol, respectively [22]. We also predicted
gas phase heats of formation for H
2
O and CO
2
using
the
atom
equivalents
method
and
parameters
described in [13]. Predicted values of heats of forma-
B.M. Rice, J. Hare / Thermochimica Acta 384 (2002) 377–391
379

tion for gas phase H
2
O and CO
2
using these atom
equivalents are
39.6 and 90.9 kcal/mol, respec-
tively. Clearly, the predicted heat of formation for
water is poorly-predicted, while the value for CO
2
is in better agreement with experiment. This reflects
the limitations of the use of this set of atom equivalents
for systems that are not representative of the set of
molecules used in parameterizing the atom equiva-
lents (i.e. molecules with functional groups common
to explosives). Since there is such a large discrepancy
between the predicted and measured values for the
heat of formation of gas phase H
2
O, we have generated
two sets of heats of detonation using Eq. (1) for the
explosives being studied. One set, denoted QM(g, t),
uses the B3LYP/6–31G
gas phase heats of formation
of water and CO
2
, whereas the other set, denoted,
QM(g, e) uses the experimental values for these
products. Many of the reported values of the heats
of detonation of the explosives described herein indi-
cate that the experiments were analyzed assuming the
H
2
O as being in either the vapor or liquid state. Those
results in which H
2
O is assumed to be in the vapor
state are typically denoted Q[H
2
O(g)], whereas the
results in which H
2
O is assumed to be in the liquid
state is denoted as Q[H
2
O(l)]. In order to compare our
results against these, we have also used predicted and
experimental values of heats of formation for liquid
phase H
2
O in Eq. (1) in order to compare with those
experimental results in which the product H
2
O is
assumed to be in the liquid state. Using the QM
information for H
2
O, Eq. (6) and parameters reported
in [13], we predicted a heat of vaporization of water
of 7 kcal/mol, which results in a liquid phase heat
of formation of
46.7 kcal/mol. This value is also
significantly different from the experimental value of
–68.3 kcal/mol [22]. Heats of detonation were calcu-
lated using Eq. (1) and heats of formation for water in
the liquid state, using both predicted and theoretical
values. Heats of detonation denoted QM(l, t) indicate
that the B3LYP/6–31G
liquid phase heat of formation
of water is used along with the B3LYP/6–31G
gas
phase heat of formation of CO
2
in the calculations.
The values denoted as QM(l, e) indicate that the
experimental value for the measured liquid phase
heat of formation (
68.3 kcal/mol) of water is
used with the experimental value for the gas phase
heat of formation for CO
2
to generate the heats of
detonation.
Heats of formation used in the Cheetah 2.0 calcula-
tions are included in the library of reactants in this suite
of programs and consist of values compiled from the
literature or passed along by oral tradition [14]. Esti-
mated errors in the heats of formation are given in the
User’s Manual. Heats of detonation predicted using
Cheetah 2.0 [14] and the JCZS-EOS library [16] are
performed by executing the ‘‘Standard Detonation
Run’’, in which the Chapman–Jouget (C–J) state is
calculated for the designated explosive, and the adia-
batic expansion of the product gases from the C–J state
to 1 atm is calculated. In these calculations, the heat of
detonation corresponds to the energy difference
between the reactants and all products at the end of
this expansion. Default values for the densities and
heats of formation for the explosives are used. In this
study, the heat of formation and density of the explo-
sive FOX-7 (1,1-diamino-2,2-dinitro-ethylene) is not
included in the Cheetah 2.0 reactant library, but these
values have been measured [23,24]. The experimental
values for the heats of formation and density for FOX-7
reported in [23] are
32.0 kcal/mol and 1.885 g/cm
3
,
respectively. A second study reports the heat of for-
mation and density of FOX-7 to be
30 kcal/mol and
1.88 g/cm
3
, respectively [24].
A final series of calculations were performed in
order to test the Kamlet and Jacobs assumption that the
equilibrium detonation products of C–H–N–O explo-
sives correspond to the H
2
O–CO
2
arbitrary (Eq. (2)).
Examination of the product concentrations for 34 C–
H–N–O explosives predicted by the Cheetah 2.0/JCZS
calculations indicate that 94% of the gaseous product
species consist of only five products: H
2
O, H
2
, N
2
,
CO
2
, and CO. For 30 of these explosives, more than
97% of the gaseous products consist of only these five
species. Since CO is predicted to be a major compo-
nent of the product gases by the thermochemical
calculations, we modified the Kamlet and Jacobs
method by assuming that the detonation products
are formed according to the following decomposition
equation:
C
a
H
b
N
c
O
d
! tN
2
þ uH
2
þ vH
2
O
þ wCO
2
þ xCO þ yC
þ zðother productsÞ
(9)
The product concentrations t, u, v, w, x, y and z are
given by the Cheetah 2.0/JCZS calculations. We cal-
culated the heat of detonation for the explosives using
380
B.M. Rice, J. Hare / Thermochimica Acta 384 (2002) 377–391
the QM predictions of the heats of formation of the
explosives and the experimental values of the heats
of formation for CO
2
, CO and H
2
O (standard heat
of formation of C
is assumed to be nil, as are H
2
and N
2
). We also assumed that the contribution of
the ‘‘other products’’ to the product heat of formation
is negligible. These calculations are referred to as
QM(modified K–J).
Heats of detonation assuming the other common
‘‘arbitrary’’ reactions in which CO is a major product,
known as the H
2
O–CO–CO
2
[25] and CO–H
2
O–CO
2
[26] arbitraries, were performed but the results were in
such poor agreement with experiment and thermo-
chemical calculations that we eliminated these decom-
position reactions as suitable for the prediction of the
heat of detonation using Eq. (1).
3. Results and discussion
There are 72 measured values for solid phase heats
of formation that correspond to 30 molecules, shown
in Table 1. Predicted solid phase heats of formation
using the method described in [13] and values con-
tained in the Cheetah reactant library are also given in
Table 1. The first 12 molecules listed in this table were
not included in the systems calculated in [13]; heats of
formation for the remaining molecules were reported
in [13] and are included for comparison with values
given in Cheetah and used in calculating the heats of
detonation, discussed hereafter.
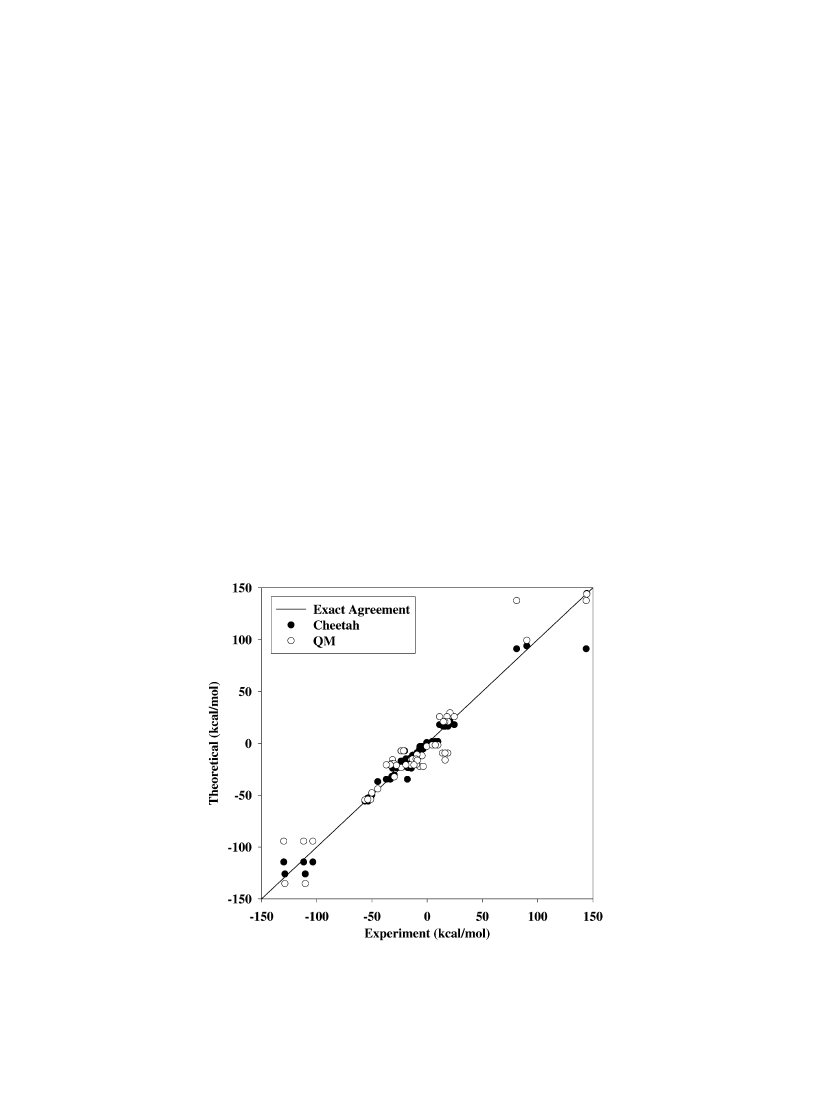
A visual comparison of QM and Cheetah values with
the experimental values is shown in Fig. 1. The rms
deviation of the QM predictions from experiment is
13.7 kcal/mol, and the rms deviation of the values in the
Cheetah reactant library from experiment is 7.9 kcal/
mol. The better agreement of the Cheetah values is not
surprising, since these values represent commonly
accepted values reported from the literature [14]. The
largest deviations of both the QM predictions and values
from the Cheetah reactant library from the experimental
values correspond to the values reported for octanitro-
cubane (81–144 kcal/mol) [28,29]. One of the values
reported for octanitrocubane (144 kcal/mol) [28,29]
is in reasonable agreement with the QM prediction
(137.6 kcal/mol), while the other is substantially lower
Fig. 1. Calculated solid phase heats of formation vs. experimental values for 30 energetic molecules. The solid line represents exact agreement
between predictions and experiment. Solid circles denote values contained in the Cheetah 2.0 reactant library [14] and hollow circles denote
values calculated using the quantum mechanically (QM)-based method described in this work.
B.M. Rice, J. Hare / Thermochimica Acta 384 (2002) 377–391
381

Table 1
Comparison of quantum mechanical (QM) heats of formation (kcal/mol) with experiment and Cheetah 2.0 values
Name
Acronym
Cheetah 2.0
a
Experiment
b
QM
c
Hexanitrobenzene
HNB
20.8
26.2
2,3,4,6-Tetranitroaniline
tetNA
11.7
7.4
2,2
0
,4,4
0
,6,6
0
-Hexanitrobiphenyl
HNBP, HNDB
16.3
16.3 [22]
16.2 (32.5)
4,4
0
-Diamino-2,2
0
,3,3
0
,5,5
0
,6,6
0
-octanitrobiphenyl
CL-12
81.0
7.7
5,7-Diamino-4,6-dinitrobenzofuroxan
CL-14
20.6
20.63 [15]
29.3 (
8.67)
3-Nitro-1,2,4-triazol-5-one
NTO
24.1
14.3 [15]
15.9 (1.6)
31.3 [15]
(
15.4)
1,1-Diamino-2,2-dinitro-ethylene
FOX-7
32.0
32.0 [23]
19.6 (12.4)
30 [24]
(
10.4)
1,3-Diamino-2,4,6-trinitrobenzene
DATB
17.2
23.6 [15,27]
23.6 (0.0)
23.4 [15]
(0.2)
3,3
0
-Diamino-2,2
0
,4,4
0
,6,6
0
-hexanitrobiphenyl
DIPAM
5.3
6.8 [15,27]
22.3 (15.5)
3.6 [15]
(18.7)
Benzotrifuroxan
BTF
144.4
144.5 [27]
143.9 (143.9)
2-Diazo-4,6-dinitrophenol
DDNP
14.3
19.6
Octanitrocubane
ONC
91.1
81–144 [28]
137.6 (
56.6–6.4)
144 [29]
(6.4)
2-Methoxy-1,3,5-trinitrobenzene
Methyl picrate
37.0
44.75 [22]
44.0 (0.75)
2,2
0
,4,4
0
,6,6
0
-Hexanitrostilbene
HNS
17.0
13.88 [15,22]
9.5 (23.38)
18.7 [15,27]
(28.2)
16.2 [15,22]
(25.7)
2,4,6-Trinitroresorcinol
Styphnic acid
114.5
111.74 [22]
94.4 (17.34)
103.5 [22]
(
9.1)
129.76 [22]
(
35.36)
Nitroguanidine
NQ
22.2
22.1 [15]
7.4 (14.7)
20.29 [15]
(
12.89)
22.11 [15]
(
14.71)
23.6 [27]
(
16.2)
20.7 [22]
(
13.3)
23.4 [22]
(
16)
21.3 [22]
(
13.9)
e-Hexaazaisowurtzitane
CL-20, HNIW
93.9
90.2 [30]
99.2 (
9.0)
Tetranitrate pentaerythritol
PETN
126.0
128.7 [15,22,27]
135.3 (6.6)
110.34 [15]
(24.96)
Octahydro-1,3,5,7-tetranitro-1,3,5,7-tetrazocine
HMX
17.9
17.93 [15,27]
25.6 (
7.67)
11.3 [15]
(
14.3)
18 [22]
(
7.6)
24.5 [22]
(
1.1)
Hexahydro-1,3,5-trinitrotriazine
RDX
16.5
14.71 [15,27]
20.8 (
6.09)
18.9 [22]
(
1.9)
15.9 [22]
(
4.9)
14.7 [22]
(
6.1)
2,4,6-Trinitro-1,3,5-benzenetriamine
TATB
34.7
36.85 [15,27]
20.8 (16.05)
33.4 [15]
(
12.6)
17.854 [22]
(2.946)
33.4 [22]
(
12.6)
36.9 [22]
(
16.1)
1,2-Dinitrobenzene
0.7
0.4 [22]
3.0 (2.6)
1,3-Dinitrobenzene
3.1
6.5 [22]
12.0 (5.5)
4.59 [22]
(7.41)
1,4-Dinitrobenzene
9.1
9.2 [22]
10.9 (1.7)
2,4-Dinitrophenol
55.7
56.29 [22]
54.7 (1.59)
53.31 [22]
(1.39)
382
B.M. Rice, J. Hare / Thermochimica Acta 384 (2002) 377–391

Table 1 (Continued )
Name
Acronym
Cheetah 2.0
a
Experiment
b
QM
c
2,6-Dinitrophenol
49.7
50.105 [22]
47.8 (2.305)
1-Methyl-2,4-dinitrobenzene
14.8
15.87 [22]
20.3 (4.43)
9.5 [22]
(10.8)
2-Methyl-1,3-dinitrobenzene
11.5
13.199 [22]
15.3 (2.101)
9.99 [22]
(5.31)
1,3,5-Trimethyl-2,4,6-trinitrobenzene
30.6
29.75 [22]
32.4 (2.65)
1,3,5-Trinitrobenzene
TNB
13.9
8.9 [22]
16.4 (7.5)
2,4,6-Trinitrophenol
Picric acid
52.8
51.3 [27]
54.2 (2.9)
52.075 [22]
(2.125)
51.14 [22]
(3.06)
53.76 [22]
(0.44)
2,4,6-Trinitroaniline
TNA
23.7
17.4 [22]
21.3 (3.9)
27.69 [22]
(
6.39)
2,4,6-Trinitrotoluene
TNT
15.1
16.01 [15]
20.9 (4.89)
16.1 [15]
(4.8)
15.38 [15]
(5.52)
15 [27]
(5.9)
15.1 [15,22]
(5.8)
19.25 [22]
(1.65)
11.94 [22]
(8.96)
N-methyl-N-2,4,6-tetranitroaniline
Tetryl
1.7
4.67 [15,27]
1.7 (6.37)
9.8 [22]
(11.5)
7.34 [22]
(9.04)
a
All values taken from reactant library of [14].
b
References for experimental values given in brackets.
c
Difference (in kcal/mol) between experimental and QM values.
Table 2
Predicted heats of formation (cal/g) for explosive formulations
Name
Formulation (wt.%)
DH
f
(cal/g)
TNT
RDX
HMX
PETN
Cheetah 2.0
QM
Other
Comp B
a
36.21
58.272
5.518
22.6
26.2
Comp B-3
40.5
59.5
17.3
18.6
12.23
b
8.4
c
Cyclotol 75/25
25
75
39.1
47.4
32.89
b
30.1
c
Cyclotol 50/50
50
50
4.0
0.99
Octol
a
26.42
73.58
26.9
39.2
Octol
25
75
28.7
41.8
28.62
b
25.7
c
Pentolite
50
50
232.4
259.9
237.1
b
243
c
a
Composition given in [31].
b
Heat of formation was calculated according to method described in [15].
c
See [27]; it is assumed that the reported values are measured.
B.M. Rice, J. Hare / Thermochimica Acta 384 (2002) 377–391
383

Table 3
Comparison of predicted and experimental heats of detonation (kcal/g)
Name
a
Q[H
2
O(g)]
Q[H
2
O(l)]
Experiment
b
Cheetah 2.0
c
QM
c
Experiment
b
QM
c
Eq. (9)
d
H
2
O–CO
2
arbitrary
e
H
2
O–CO
2
arbitrary
e
e
f
t
f
e
f
t
f
e
f
HNS
1.10 [15]
1.199 (
0.099)
1.374 (
0.274)
1.099 [31]
(
0.100)
(
0.275)
e-HNIW
1.490 [30]
1.480 (0.010)
1.660 (
0.170)
PETN
1.16 [15]
1.424 (
0.264)
1.373 (
0.213)
1.223 (
0.063)
1.493 (
0.333)
1.23 [15]
1.313 (
0.083)
1.626 (
0.396)
1.37 [25]
(
0.054)
(
0.003)
(0.147)
(
0.123)
1.49 [27,30]
(0.177)
(
0.136)
HMX
1.37 [15,25]
1.356 (
0.014)
1.343 (0.027)
1.235 (0.135)
1.502 (
0.132)
1.48 [15,27,30]
1.331 (0.149)
1.644 (
0.164)
1.479 [31]
(0.148)
(
0.165)
RDX
1.42 [15,25]
1.336 (0.084)
1.315 (0.105)
1.243 (0.177)
1.510 (
0.090)
1.51 [15,27]
1.338 (0.172)
1.652 (
0.142)
1.452 [31]
(0.114)
(
0.200)
HNB
1.650 [30]
1.642 (0.008)
1.696 (
0.046)
1.653 [31]
(0.011)
(
0.043)
Picric acid
1.032 [15]
1.160 (
0.128)
1.339 (
0.307)
DATB
0.91 [15,25]
1.086 (
0.176)
1.029 (
0.119)
0.964 (
0.054)
1.174 (
0.264)
0.98 [15,27]
1.037 (
0.057)
1.282 (
0.302)
TATB
1.02 [15]
0.990 (0.030)
1.260 (
0.240)
1.018 [31]
(0.028)
(
0.242)
BTF
1.41 [15]
1.373 (0.037)
1.353 (0.057)
1.653 (
0.243)
1.690 (
0.280)
1.41[26]
g
1.653 (
0.243)
1.690 (
0.280)
TNT
1.02 [15]
1.075 (
0.055)
1.018 (0.002)
1.044 (
0.024)
1.269 (
0.249)
1.09 [15,27,30]
1.122 (
0.032)
1.385 (
0.295)
Tetryl
1.09 [15,25]
1.174 (
0.084)
1.133 (
0.043)
1.210 (
0.120)
1.398 (
0.308)
1.14 [15,27]
1.271 (
0.131)
1.490 (
0.350)
rms deviation (kcal/g)
0.124
0.098
0.138
0.239
0.116
0.243
a
See Table 1 for the chemical names corresponding to each acronym.
b
References are given in brackets.
c
Difference of prediction from experiment (kcal/g) is given in parentheses.
d
Evaluated using Eq. (9). Concentration of products CO, CO
2
and H
2
O are predicted by Cheetah 2.0 [14] using the JCZS-EOS library [16].
e
Evaluated using products that correspond to the H
2
O–CO
2
arbitrary as given by Kamlet and Jacobs [2].
f
The t denotes that theoretical values were used and e indicates that experimental values were used.
g
As noted in [27], BTF contains little or no hydrogen, no water is formed, and thus values for H
2
O(l) and H
2
O(g) are the same.
384
B.M.
Rice,
J.
Har
e
/
Thermoc
himica
Acta
384
(2002)
377
–
391
[28]. It is not known whether these reported values are
theoretical estimates or actual measurements. Three
QM values differ from experimental values by more
than 30 kcal/mol; these corresponded to values for
2,2
0
,4,4
0
,6,6
0
-hexanitrobiphenyl (HNBP), PETN, and
2,4,6-trinitroresorcinol. However, as noted in [13],
the experimental values for PETN and 2,4,6-trinitror-
esorcinol range from
128.7 to 110.34 kcal/mol and
103.5 to 129.76 kcal/mol, respectively. The QM
calculations are within 6.6 kcal/mol for one of the
measured values of PETN and 9.1 kcal/mol for one
of the values reported for 2,4,6-trinitroresorcinol. The
difference in the predicted and experimental value for
HNBP (32.5 kcal/mol) is similar to the difference
observed for another polycyclic nitroaromatic system,
HNS (
26 kcal/mol). In both systems, the predicted
heat of formation is smaller than the reported values. We
also predicted the heat of formation for 4,4
0
-diamino-
2,2
0
,3,3
0
,5,5
0
,6,6
0
-octanitrobiphenyl (CL-12). The pre-
dicted value (7.7 kcal/mol) is in substantial disagree-
ment with the value contained in the Cheetah reactant
library (81 kcal/mol). We were unable to ascertain the
validity of the value reported in Cheetah, and no error
estimates of the value were given. The source of this
value was quoted as ‘‘the data is probably real but has
never been published and has been passed by oral
tradition’’ [14]. However, if our heats of formation
method predicts values that are uniformly lower than
measured values for polycyclic nitroaromatic com-
pounds, this suggests that representative polycyclic
nitroaromatic molecules be included in a future re-
parameterization of the equations associated with this
methodology.
Heats of formation for a few explosive formulations
have been predicted using the QM-based method
described in [13] and Eq. (3), and are reported in
Table 2. Table 2 also contains experimental results
[27] or predictions made using other methods [14,15].
The QM predictions for these formulations have a rms
deviation from the Cheetah 2.0 predictions of 12.9 cal/
g and a rms deviation from other calculated or mea-
sured values (see column labeled ‘‘other’’ in Table 2)
of 15.4 cal/g. The basis for the larger deviation of the
QM predictions from the values contained in the
Cheetah 2.0 reactant library or other estimates is
due to the deviations of the predicted heats of forma-
tion for the pure components from the experimental
values (Table 1).
Heats of detonation for pure explosives and explo-
sives formulations are calculated using the Kamlet and
Jacobs prescription given in Eqs. (1) and (3) and using
heats of formation predicted with the QM-based
method described in [13]. Heats of formation of pro-
duct gases are evaluated assuming the decomposition
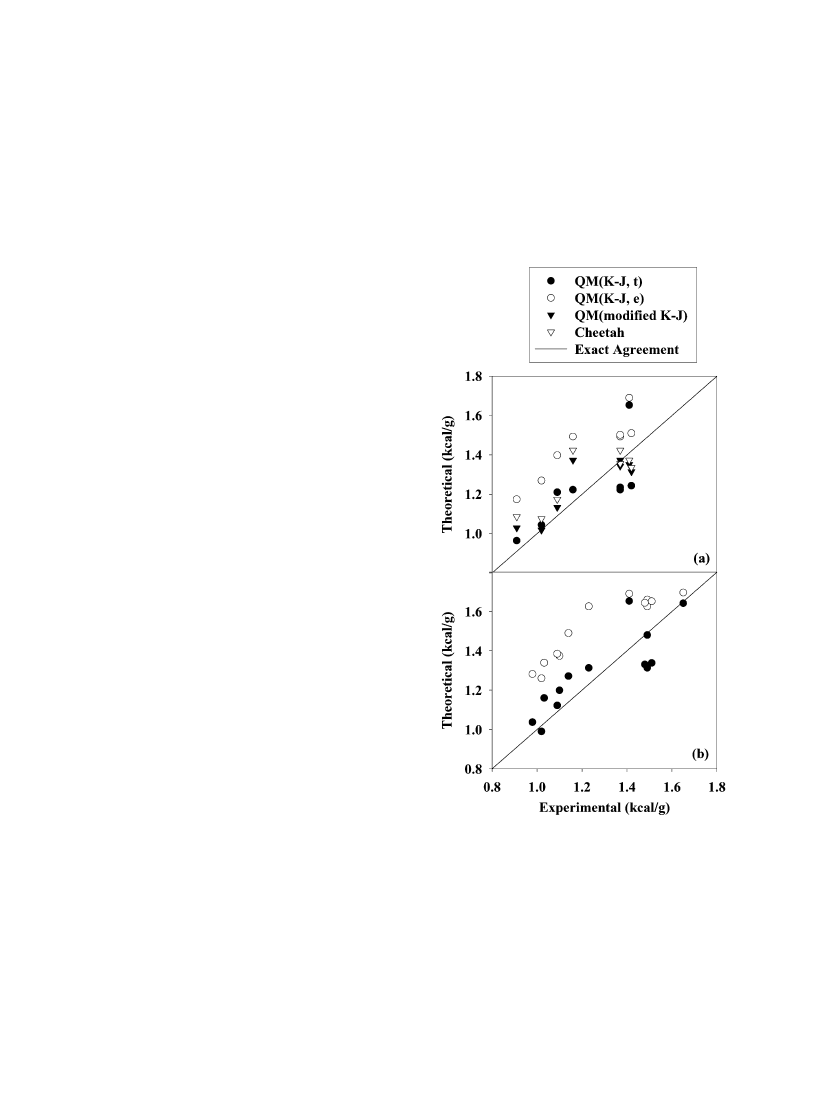
Fig. 2. (a) Calculated heats of detonation [H
2
O(g)] vs. experi-
mental values for explosives. (b) Calculated heats of detonation
[H
2
O(l)] vs. experimental values for explosives. The solid lines
represents exact agreement between predictions and experiment.
Solid circles denote QM values calculated using theoretical
information only; hollow circles denote QM values that use
experimental heats of formation for products H
2
O and CO
2
. Filled
triangles denote QM values using experimental information for the
product gases, which are assumed to correspond to Eq. (9). Hollow
triangles represent values calculated using Cheetah 2.0 [14] and the
JCZS product library [16].
B.M. Rice, J. Hare / Thermochimica Acta 384 (2002) 377–391
385

Table 4
Predicted and experimental heats of detonation (kcal/g) for explosive formulations
Name
Formulation (wt.%)
Q[H
2
O(g)] (kcal/g)
Q[H
2
O(l)] (kcal/g)
TNT
RDX
HMX
PETN
Experiment
a
Cheetah 2.0
b
QM
b
Experiment
a
QM
b
Eq. (9)
c
H
2
O–CO
2
arbitrary
d
H
2
O–CO
2
arbitrary
d
Comp B
36.21
58.272
5.518
1.240
1.207
1.171
1.321 [31]
1.260
(0.061)
1.422
1.555
(
0.234)
Comp B-3
40.5
59.5
1.12 [15]
1.227
(
0.107) 1.193
(
0.073)
1.161
(
0.041)
1.20 [15]
1.250
(
0.050)
1.411
(
0.291)
1.542
(
0.342)
Cyclotol 50/50
50
50
1.203
1.164
1.142
1.158 [15]
1.229
(
0.071)
1.388
1.517
(
0.359)
Octol
26.42
73.58
1.280
1.255
1.194
1.361 [31]
1.286
(0.075)
1.452
1.588
(
0.227)
Pentolite
50
50
1.178
1.117
1.149
1.23 [15,27]
1.233
(
0.003)
1.400
1.525
(
0.295)
a
References are given in brackets.
b
Difference from experiment in (kcal/g) given in parentheses.
c
Evaluated using Eq. (9). Concentration of products CO, CO
2
and H
2
O are predicted by Cheetah 2.0 [14] using the JCZS-EOS library [16].
d
First value calculated using QM prediction of heat of formation for H
2
O. Second value calculated using experimental value for the heat of formation for H
2
O. Products
assumed to correspond to H
2
O–CO
2
arbitrary as given by Kamlet and Jacobs [2].
386
B.M.
Rice,
J.
Har
e
/
Thermoc
himica
Acta
384
(2002)
377
–
391

reactions correspond to either the H
2
O–CO
2
arbitrary
[2] or Eq. (9). These predictions (denoted as QM) are
given in Table 3, along with the experimental values.
Values predicted using Cheetah 2.0 with the JCZS-
EOS library [14,16] are also included in Table 3. A
visual comparison of the predictions with experiment
is given in Fig. 2. Fig. 2(a) shows the comparison
between predictions and experiments in which the
H
2
O product is in the gas state; Fig. 2(b) provides a
comparison between experiment and predictions in
Table 5
QM and Cheetah predictions of heats of detonation (kcal/g)
Name or acronym
a
Cheetah
2.0
QM
H
2
O–CO
2
arbitrary (Kamlet and Jacobs assumption)
Eq. (9)
b
t
c
e
d
t
c
e
d
e
d
2-Methoxy-1,3,5-trinitrobenzene
1.064
1.068 (
0.004)
1.284 (
0.220)
1.140 (
0.076)
1.392 (
0.32)
1.003 (0.061)
HNS
1.107
1.151 (
0.044)
1.304 (
0.197)
1.199 (
0.092)
1.374 (
0.267)
1.024 (0.083)
2,4,6-Trinitroresorcinol
0.976
1.063 (
0.087)
1.216 (
0.240)
1.106 (
0.130)
1.280 (
0.304)
1.035 (
0.059)
Nitroguanidine
0.883
0.690 (0.193)
1.040 (
0.157)
0.826 (0.057)
1.242 (
0.359)
0.937 (
0.054)
e-HNIW
1.466
1.431 (0.015)
1.588 (
0.142)
1.480 (
0.034)
1.660 (
0.214)
1.455 (0.011)
PETN
1.424
1.223 (0.201)
1.493 (
0.069)
1.313 (0.111)
1.626 (
0.202)
1.373 (0.051)
HMX
1.356
1.235 (0.121)
1.502 (
0.146)
1.331 (0.025)
1.644 (
0.288)
1.343 (0.013)
RDX
1.336
1.243 (0.093)
1.510 (
0.174)
1.338 (
0.002)
1.652 (
0.316)
1.315 (0.021)
NTO
0.947
0.881 (0.066)
1.045 (
0.098)
0.936 (0.011)
1.126 (
0.179)
0.979 (
0.032)
Octanitrocubane
1.827
1.863 (
0.036)
1.917 (
0.090)
1.863 (
0.036)
1.917 (
0.090)
1.913 (
0.086)
1,2-Dinitrobenzene
1.024
0.994 (0.030)
1.229 (
0.205)
1.078 (
0.054)
1.354 (
0.330)
0.966 (0.058)
1,3-Dinitrobenzene
1.012
0.941 (0.071)
1.176 (
0.164)
1.025 (
0.013)
1.301 (
0.289)
0.925 (0.087)
1,4-Dinitrobenzene
1.005
0.947 (0.058)
1.182 (
0.177)
1.031 (
0.026)
1.307 (
0.302)
0.961 (0.044)
2,4-Dinitrophenol
0.942
0.874 (0.068)
1.097 (
0.155)
0.951 (
0.009)
1.211 (
0.269)
0.919 (0.023)
2,6-Dinitrophenol
0.953
0.911 (0.042)
1.135 (
0.182)
0.988 (
0.035)
1.249 (
0.296)
0.934 (0.019)
1-Methyl-2,4-dinitrobenzene
0.970
0.791 (0.179)
1.099 (
0.129)
0.907 (0.063)
1.272 (
0.302)
0.894 (0.076)
2-Methyl-1,3-dinitrobenzene
0.986
0.818 (0.168)
1.126 (
0.140)
0.934 (0.052)
1.299 (
0.313)
0.919 (0.067)
1,3,5-Trimethyl-1,3,5-
trinitrobenzene
0.997
0.838 (0.159)
1.168 (
0.171)
0.963 (0.034)
1.354 (
0.357)
0.940 (0.057)
Hexanitrobenzene
1.692
1.642 (0.050)
1.696 (
0.004)
1.642 (0.050)
1.696 (
0.004)
1.693 (
0.001)
1,3,5-Trinitrobenzene
1.177
1.162 (0.015)
1.323 (
0.146)
1.211 (
0.034)
1.397 (
0.220)
1.126 (0.051)
Picric acid
1.059
1.114 (
0.055)
1.271 (
0.212)
1.160 (
0.101)
1.339 (
0.280)
1.029 (0.030)
2,3,4,6-Tetranitroaniline
1.182
1.272 (
0.090)
1.410 (
0.228)
1.311 (
0.129)
1.467 (
0.285)
1.174 (0.008)
2,4,6-Trinitroaniline
1.061
1.051 (0.010)
1.238 (
0.177)
1.113 (
0.052)
1.330 (
0.269)
1.044 (0.017)
DATB
1.086
0.964 (0.122)
1.174 (
0.088)
1.037 (0.049)
1.282 (
0.196)
1.029 (0.057)
TATB
1.039
0.908 (0.131)
1.138 (
0.099)
0.990 (0.049)
1.260 (
0.221)
1.058 (
0.019)
HNBP
1.130
1.220 (
0.090)
1.343 (
0.213)
1.253 (
0.123)
1.393 (
0.263)
1.031 (0.099)
DIPAM
1.101
1.113 (
0.012)
1.264 (
0.163)
1.160 (
0.059)
1.334 (
0.233)
1.039 (0.062)
CL-12
1.345
1.329 (0.016)
1.436 (
0.091)
1.355 (
0.010)
1.475 (
0.130)
1.188 (0.157)
BTF
1.373
1.653 (
0.280)
1.690 (
0.317)
1.653 (
0.280)
1.690 (
0.317)
1.352 (0.021)
TNT
1.075
1.044 (0.031)
1.269 (
0.194)
1.122 (
0.047)
1.385 (
0.310)
1.018 (0.057)
DDNP
0.999
1.147 (
0.148)
1.264 (
0.265)
1.181 (
0.182)
1.314 (
0.315)
1.002 (
0.003)
Tetryl
1.174
1.210 (
0.036)
1.398 (
0.224)
1.271 (
0.097)
1.490 (
0.316)
1.133 (0.041)
FOX-7
1.136
1.016 (0.118)
1.285 (
0.149)
1.114 (0.022)
1.427 (
0.291)
1.180 (
0.044)
CL-14
1.153
1.133 (0.020)
1.300 (
0.147)
1.189 (
0.036)
1.382 (
0.229)
1.160 (
0.007)
rms deviation (kcal/g)
0.107
0.175
0.085
0.272
0.057
a
See Table 1 for chemical name.
b
Concentrations of major gas products CO, CO
2
and H
2
O obtained from Cheetah 2.0/JCZS calculations. See text.
c
The t denotes that the values used for the heats of formation for the products are predicted with the B3LYP/6–31G
-based atom equivalent
method as described in [13].
d
‘The e denotes that the values used for the heats of formation for the products are the experimental value.
B.M. Rice, J. Hare / Thermochimica Acta 384 (2002) 377–391
387
which the H
2
O product is in the liquid state. Predicted
heats of detonation for H
2
O(g) using QM(g, t) and
Cheetah have rms deviations from experiment of
0.138 and 0.124 kcal/g, respectively, whereas the
QM(g, e) results have a substantially larger deviation
from experiment (0.239 kcal/g). The QM(g, e) pre-
dictions are almost uniformly larger than the experi-
mental values by
0.3–0.4 kcal/g. The QM(modified
K–J) predictions have a rms deviation from experi-
ment of 0.098 kcal/g, indicating the importance of
the inclusion of CO as a major gaseous product.
The QM(l, t) predictions are in reasonable agreement
with measured heats of detonation for H
2
O(l), with a
rms deviation of 0.116 kcal/g from experiment. As for
heats of detonation for H
2
O(g), the QM(l, e) predic-
tions are consistently higher than experimental values
by
0.2–0.4 kcal/g. Cheetah predictions were not
compared against measured heats of detonation for
H
2
O(l), since the results of the thermochemical cal-
culations indicate that the product H
2
O is in the
gaseous state only.
Heats of detonation were calculated for a few
explosive formulations for which experimental data
were available; the results and experimental values are
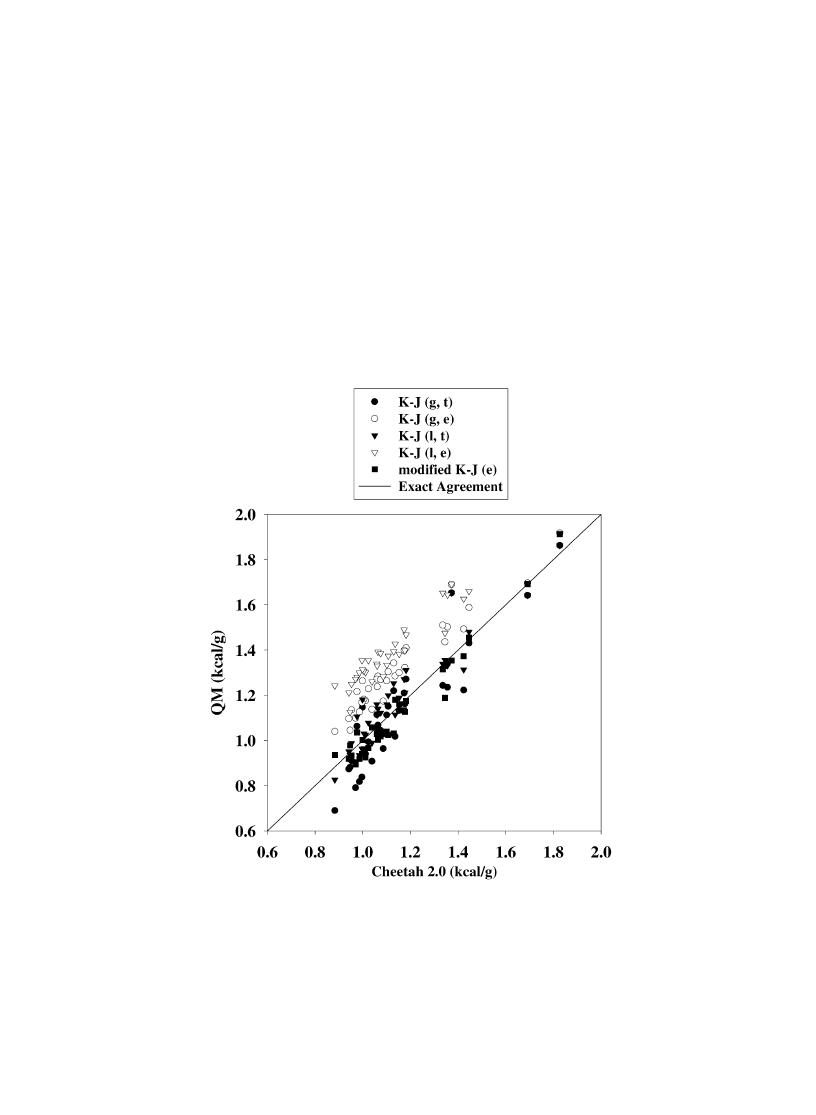
Fig. 3. Quantum mechanical (QM) predictions of heat of detonation vs. Cheetah 2.0 calculations. The solid line represents exact agreement
between the QM and Cheetah 2.0 predictions. The circular and triangular symbols denote QM results assuming that the decomposition product
gases correspond to the H
2
O–CO
2
arbitrary [2]. Solid circles denote QM calculations using predicted gas phase heats of formation for products
H
2
O and CO
2
; hollow circles denote QM calculations using experimental values for the gas phase heats of formation for the products; filled
triangles denote QM calculations using predicted heats of formation for H
2
O (liquid phase) and CO
2
(gas phase); hollow triangles denote QM
calculations using experimental values for the heats of formation for H
2
O (liquid phase) and CO
2
(gas phase). The solid squares denote QM
calculations using experimental heats of formation of the product gases, which are assumed to correspond to Eq. (9).
388
B.M. Rice, J. Hare / Thermochimica Acta 384 (2002) 377–391

shown in Table 4. For the single formulation that
reported a measured value assuming that H
2
O was
in the gas state, the QM(g, t) and QM(modified K–J)
predictions are better than those predicted by both
Cheetah and the QM(g, e) calculations. The remaining
experimental heats of detonation assume the H
2
O to be
in the liquid state. For all cases, the QM(l, t) calcula-
tions are in much closer agreement with experiment
than the QM(l, e) calculations. The QM(l, t) values
deviated from experiment not more than 0.075 kcal/g,
while the QM(l, e) values were consistently larger than
the experimental values by 0.23–0.36 kcal/g. For all
QM predictions, those that utilized experimental heats
of formation for the products H
2
O and CO
2
resulted in
heats of detonation that were too large by at least
0.2 kcal/g.
Table 5 provides a comparison between heats of
detonation calculated using the Cheetah 2.0 and the
various QM calculations; Fig. 3 provides a visual
comparison. As evident in Fig. 3, the best agreement
of the QM predictions with the Cheetah predictions
are for those in which the product concentrations
correspond to Eq. (9) and experimental values for
the heats of formation of the products are used to
evaluate Q. For that case, the rms deviation of the
QM(modified K–J) from the Cheetah 2.0 predictions
are 0.057 kcal/g. The largest disagreement between
the Cheetah and QM(modified K–J) calculations of Q
is for CL-12. The QM(modified K–J) value is
1.188 kcal/g, whereas the Cheetah prediction is
1.345 kcal/g. The large disagreement is due to the
extreme difference in the solid phase heats of forma-
tion for CL-12 used in the calculations, as discussed
earlier. The next best agreement between the QM and
Cheetah calculations are for those values in which the
predicted heat of formation for liquid H
2
O is used with
the Kamlet and Jacobs assumption (H
2
O–CO
2
arbi-
trary); these predictions have a rms deviation from the
Cheetah predictions of 0.085 kcal/g. The rms devia-
tion of the QM predictions using predicted heats of
formation for gas phase H
2
O from the Cheetah pre-
dictions is 0.107 kcal/g. The QM predictions using the
experimental values for either the gas phase or liquid
phase heats of formation for H
2
O and the H
2
O–CO
2
arbitrary are consistently larger than the Cheetah
predictions.
All of these calculations indicate that experimental
values for heats of formation for the products H
2
O and
CO
2
should not be used with the heats of formation of
the explosive predicted using the methodology
described in [13] if the H
2
O–CO
2
arbitrary is assumed
to describe the equilibrium composition of the product
gases of the detonation. Rather, the theoretical pre-
dictions of the gas phase heat of formation of water
should be used. The reasonable agreement of the
QM(g, t) predictions with experimental values when
utilizing the theoretical value of the heat of formation
of the gas phase water suggests that this poorly-pre-
dicted value compensates for the exclusion of CO
as a major component of the product decomposition
gases.
4. Conclusions
A computational methodology has been developed
that uses only QM information about isolated mole-
cules to predict the heats of detonation for pure and
explosive formulations. The methodology is based on
a simple scheme to calculate detonation properties as
proposed by Kamlet and Jacobs [2]. The Kamlet and
Jacobs method assumes that the heat of detonation of
an explosive compound of composition C
a
H
b
N
c
O
d
can
be approximated as the difference between the heats of
formation of the detonation products and that of the
explosive formulation, divided by the formula weight
of the explosive. The detonation products are assumed
to correspond to the H
2
O–CO
2
arbitrary, in which the
detonation products are N
2
, H
2
O, CO
2
and solid
carbon. The Kamlet and Jacobs method requires
knowledge of the heats of formation of the explosive.
In this study, we have used a previously-developed
computational tool to predict solid phase heats of
formation for explosives [13] using QM information
only, and used these with the Kamlet and Jacobs
method to predict heats of detonation. We have also
modified the Kamlet and Jacobs assumption by assum-
ing that CO is a major component of the decomposi-
tion gases in addition to N
2
, H
2
O, CO
2
and solid
carbon. Product concentrations under this assumption
are determined from thermochemical calculations
using Cheetah 2.0 [14] and the JCZS product library
[16]. The results are compared with experimental
values, where available, for both pure explosives
and explosive formulations. The QM results are also
compared against predictions using the thermochemi-
B.M. Rice, J. Hare / Thermochimica Acta 384 (2002) 377–391
389

cal code Cheetah 2.0 and the JCZS-EOS library
[14,16]. For pure explosives, the QM-based method
using the modified Kamlet and Jacobs method is in
better agreement with experiment than all other pre-
dictions. For explosive formulations, the QM predic-
tions are in reasonable agreement with experimental
values, with a rms deviation of 0.058 kcal/g. Although
the Cheetah calculations have a stronger theoretical
basis for prediction of detonation properties than that
proposed here, those calculations also require both
densities and heats of formation as input. This meth-
odology presented here has the advantage that neither
heats of formation nor densities need to be measured
or estimated to calculate the heat of detonation of an
explosive. All that is needed are the QM characteriza-
tions of the isolated molecules contained in the explo-
sive compound. The calculations presented herein
show that this methodology to predict heats of detona-
tion of pure and explosive formulations is a reasonable
computational tool to be used in the rapid assessment
and screening of notional energetic materials.
Acknowledgements
The authors would like to thank Dr. Anthony J.
Kotlar, US Army Research Laboratory, for valuable
discussions and Dr. Michael L. Hobbs, Sandia
National Laboratories, Albuquerque, NM for provid-
ing the JCZS library and helpful advice.
References
[1] M.S. Miller, B.M. Rice, A.J. Kotlar, R.J. Cramer, Clean
Products and Processes 2 (2000) 37.
[2] M.J. Kamlet, S.J. Jacobs, J. Chem. Phys. 48 (1968) 23.
[3] D.P. Chong, Recent advances in density functional methods,
Parts I and II, in: D.P. Chong (Ed.), Recent Advances in
Computational Chemistry, Vol. 1, World Scientific Publish-
ing, NJ, 1995.
[4] J.S. Murray, A. Fakhr, P. Politzer, J. Phys. Chem. A 103
(1999) 1853.
[5] P. Politzer, J.S. Murray, P. Flodmark, J. Phys. Chem. 100
(1996) 5538.
[6] P. Politzer, P. Lane, J.S. Murray, J. Phys. Chem. 96 (1992)
7938.
[7] P. Politzer, J.S. Murray, J. Phys. Chem. A 102 (1998) 1018.
[8] P. Politzer, J.S. Murray, T. Brinck, P. Lane, in: J.O. Nelson,
A.E. Karu, R.B. Wong (Eds.), Immunoanalysis of Agrochem-
icals, ACS Symp. Ser. 586, American Chemical Society,
Washington, DC, 1994 (Chapter 8).
[9] J.S. Murray, T. Brinck, P. Lane, K. Paulsen, P. Politzer, J.
Mol. Struct. Theochem. 307 (1994) 55.
[10] J.S. Murray, P. Politzer, in: P. Politzer, J.S. Murray (Eds.),
Quantitative Treatment of Solute/Solvent Interactions, Theo-
retical and Computational Chemistry, Vol. 1, Elsevier,
Amsterdam, 1994, pp. 243–289.
[11] P. Politzer, J.S. Murray, M.E. Grice, M. DeSalvo, E. Miller,
Mol. Phys. 93 (1998) 187.
[12] P. Politzer, J.S. Murray, M.E. Grice, M. DeSalvo, E. Miller,
Mol. Phys. 91 (1997) 923.
[13] B.M. Rice, S.V. Pai, J. Hare, Combustion and Flame 118
(1999) 445.
[14] L.E. Fried, W.M. Howard, P. Clark Souers, Cheetah 2.0
User’s Manual, 1998, UCRL-MA-117541 Rev. 5.
[15] T.N. Hall, J.R. Holden, NSWC MP-88-116 (1988).
[16] M.L. Hobbs, M.R. Baer, B.C. McGee, Propellants Explosives
Pyrotechnics 24 (1999) 269.
[17] W.J. Hehre, L. Radom, P.V.R. Schleyer, J.A. Pople, Ab Initio
Molecular Orbital Theory, Wiley, New York, 1986, p. 271,
298.
[18] A.D. Becke, J. Chem. Phys. 98 (1993) 5648.
[19] C. Lee, W. Yang, R.G. Parr, Phys. Rev. B 37 (1988) 785.
[20] M.J. Frisch, G.W. Trucks, H.B. Schlegel, G.E. Scuseria, M.A.
Robb, J.R. Cheeseman, V.G. Zakrzewski, J.A. Montgomery,
R.E. Stratmann, J.C. Burant, S. Dapprich, J.M. Millam, A.D.
Daniels, K.N. Kudin, M.C. Strain, O. Farkas, J. Tomasi, V.
Barone, M. Cossi, R. Cammi, B. Mennucci, C. Pomelli, C.
Adamo, S. Clifford, J. Ochterski, G.A. Petersson, P.Y. Ayala,
Q. Cui, K. Morokuma, D.K. Malick, A.D. Rabuck, K.
Raghavachari, J.B. Foresman, J. Cioslowski, J.V. Ortiz, B.B.
Stefanov, G. Liu, A. Liashenko, P. Piskorz, I. Komaromi, R.
Gomperts, R.L. Martin, D.J. Fox, T. Keith, M.A. Al-Laham,
C.Y. Peng, A. Nanayakkara, C. Gonzalez, M. Challacombe,
P.M.W. Gill, B.G. Johnson, W. Chen, M.W. Wong, J.L.
Andres, M. Head-Gordon, E.S. Replogle, J.A. Pople, Gaussian
98 (Revision A.7), Gaussian Inc., Pittsburgh PA, 1998.
[21] P.W. Atkins, Physical Chemistry, Oxford University Press,
Oxford, 1982.
[22] NIST Standard Reference Database Number 69, which can be
accessed electronically through the NIST Chemistry Web
Book (
http://webbook.nist.gov/chemistry/
); references for
individual molecules are given therein.
[23] H. Ostmark, A. Langlet, H. Bergman, N. Wingborg, U.
Wellmar, U. Beem, Fox-7: A New Explosive with Low
Sensitivity and High Performance FOA, Defence Research
Establishment, SE-172 90, Stockholm, Sweden.
[24] R.J. Cramer, C. Knott, C. Walsh, S. Peters, R. Simmons,
Advanced gun propellants formulations and technology, in:
Proceedings of the 29th JANNAF Propellant and Develop-
ment Subcommittee Meeting, 2000.
[25] S.R. Brinkley, E.B. Wilson Jr., OSRD Report 905, 1942.
[26] E.A. Christian, H.G. Snay, US Naval Ordnance Laboratory
Report NavOrd-1508, 1951.
[27] B.M. Dobratz, LLNL Explosives Handbook: Properties of
Chemical Explosives and Explosive Simulants, Lawrence
390
B.M. Rice, J. Hare / Thermochimica Acta 384 (2002) 377–391

Livermore National Laboratory Publication UCRL-52997,
1982.
[28] M. Zhang, P. Eaton, R. Gilardi, Angew. Chem. Int. Ed. 39
(2000) 401.
[29] A.M. Astakhov, R.S. Stepanov, A.Y. Babushkin, Combustion,
Explosion Shock Waves 34 (1998) 85.
[30] R.L. Simpson, P.A. Urtiew, D.L. Ornellas, G.L. Moody, K.J.
Scribner, D.M. Hoffman, Propellants Explosives Pyrotechnics
22 (1997) 249.
[31] D.L. Ornellas, Calorimetric Determinations of the Heat and
Products of Detonation for Explosives: October 1961–April
1982, LLNL Report UCRL-52821, 1982.
B.M. Rice, J. Hare / Thermochimica Acta 384 (2002) 377–391
391
Document Outline
Wyszukiwarka
Podobne podstrony:
Decoherence, the Measurement Problem, and Interpretations of Quantum Mechanics 0312059
Interpretation of quantum mechanics by the double solution theory by Louis de Broglie
Seahra The Classical and Quantum Mechanics of
53 755 765 Effect of Microstructural Homogenity on Mechanical and Thermal Fatique
8 95 111 Investigation of Friction and Wear Mechanism of Hot Forging Steels
53 755 765 Effect of Microstructural Homogenity on Mechanical and Thermal Fatique
Hameka H F Quantum mechanics a conceptual approach (Wiley, 2004) (204s)
Weiss Lie Groups & Quantum Mechanics [sharethefiles com]
An investigation of shock induced temperature rise and melting of bismuth using high speed optical p
Production of xylooligosaccharides using immobilized endo xylanase of Bacillus
Brain, Chaos, Quantum Mechanics
S Gudder Histories approach to quantum mechanics
Ortho Alkylation of Acetanilides Using Alkyl Halides
Griffiths D Errata Introduction to quantum mechanics, 1st ed (2000) (3s)
Tsitsika i in (2009) Internet use and misuse a multivariate regresion analysis of the predictice fa
Sukumar Supersymmetric quantum mechanics and its
Jagota, Dani 1982 A New Calorimetric Technique for the Estimation of Vitamin C Using Folin Phenol
Pratt S Quantum mechanics problem sets (lecture notes, 2001)(35s) PQmtb
więcej podobnych podstron