
1
CHAPTER
SEVEN
QUALITY CHANGES DURING DRYING OF FOOD MATERIALS
Magdalini Krokida and Zacharias Maroulis
1. INTRODUCTION
The commonly examined properties of dried products may be classified into two
major categories: the engineering properties of the drying products and properties,
which are related to product quality.
The engineering properties of dried food systems are essential in the design of
food processes and processing equipment, and in the efficient operation and control of
processing plants. The engineering properties of the dried food involve effective
moisture diffusivity, effective thermal conductivity, specific heat, equilibrium
moisture content, and viscosity.
The comprehensive term “quality” comprises of a number of parameters of the
drying material, either in a mid-state (at intermediate stages of the drying process) or
after the completion of the drying. Although these properties are not necessary for
prediction of drying time and process modeling, they are important for
characterization and prediction of the quality of dried product. They are also very
important for the development of new industrial products with desired properties or
for quality improvement of already existing ones. The quality related properties could
be grouped into the following:
•
Structural properties (density, porosity, pore size, specific volume)
•
Optical properties (color, appearance)
•
Textural properties (compression test, stress relaxation test, tensile test)
•
Thermal properties (state of product: glassy, crystalline, rubbery)
•
Sensory properties (aroma, taste, flavor)
•
Nutritional characteristics (vitamins, proteins)
•
Rehydration properties (rehydration rate, rehydration capacity)

2
Structural, optical and textural properties of dehydrated products are examined in
this chapter. The following topics are discussed for each property:
•
Definition
•
Methods of experimental measurement
•
Data compilation
•
Effect of various factors
•
Mathematical modeling
The industrial product quality aspects are usually to control product moisture
content at the dryer outlet, to minimize chemical degradation reactions, maintain
product structure and texture, obtain desired color, control product density and
porosity, and develop a flexible drying process that can yield products of different
structures for various uses.
Drying method and physicochemical changes that occur during drying seem to
affect the quality properties of the dehydrated product. More specifically, drying
method and process conditions affect significantly the color, texture, density and
porosity, and sorption characteristics of materials. So, the same raw material may end
up as a completely different product, depending on the type of drying method and
conditions applied.
The increasing need for producing efficient high quality and convenient products
at a competitive cost has led to the employment of several drying methods in practice
(Saravacos, 1967; 1993). Each drying method has some characteristic drying
parameters, which can be regulated, changing in this way the moisture transport
mechanism and the drying rate. It has been proved that the moisture transport
mechanism and the drying rate at which the material is dried are related to the quality
properties of the dried product. The most commonly used drying methods and
conditions are the following:
•
Conventional air drying is one of the most frequently used operation for food
dehydration. The drying parameters that are usually examined for food quality are
the following:
air temperature (50 - 90
o
C for food materials)
air relative humidity (10 – 40% for food materials)
air velocity (1-4m/sec)
•
Microwave drying is an alternative drying method, which is recently used in the
food industry. Dielectric heating with microwaves (MW) has been proven to
greatly reduce the drying time of many agricultural products and it is usually used
as pretreatment before conventional drying. The drying parameters that are
usually examined for food quality maters are the follows:
Dielectric power
Exposure time to MW radiation
•
Vacuum drying is a drying method in which drying is performed using low
pressure. It makes use of the fact that the boiling point of water is reduced as the

3
pressure is reduced. The drying parameters that are usually examined for food
quality are the follows:
Pressure (30-600 mbar)
Air temperature (50-100
o
C)
•
Osmotic dehydration is a process resulting in products of intermediate moisture
content, due to water flow from the product to a concentrated solution and solute
transfer from the solution into the product. It is a pretreatment technique, which
claims to achieve simultaneously dewatering and direct formulation of the product
(through impregnation plus leaching). The main drying parameters that are usually
examined are the following:
Solute concentration
Process temperature
Sample size
Speed of agitation
Time of immersion
•
Freeze drying is one of the most sophisticated methods. It makes use of the fact
that when the system pressure is kept so low that the boiling point is below 0
o
C,
the water in the material remains frozen and it sublimes away from the dry solids.
The freeze drying method provides dried products of porous structure with
advantageous quality properties, which are weighted against its high treatment
cost. The main parameter of drying method is the applied pressure, which
corresponds to a specific temperature that ice sublimes.
Blanching is a pretreatment process used before drying of most vegetables, in
order to prevent the development of off flavor in subsequent storage; it involves heat
treatment for a short time, usually by steam or hot water. The objective of blanching
is to produce certain favorable effects on processed materials, such as the inactivation
of enzymes present, the expulsion of air trapped intercellularly, the reduction of
possible initial infection, and the removal of undesirable flavors and aromas.
Although food quality is of major importance during last years, limited
information is available in the literature on the quality properties of foods, especially
the solid and semi solid food materials.
The present review is an effort to describe the effect of drying method and
conditions on some quality related properties of foods.

4
2. STRUCTURAL PROPERTIES (Density and porosity)
2.1 Definitions
Structural properties are important for the characterization of the quality of a
dehydrated product. Food structure has a profound effect on the transport properties
of foods (e.g. diffusivity, permeability and thermal conductivity), it is therefore
important to know the physical structure of a food material. Food structure is of
fundamental importance in the developing field of Food Materials Science. The
structure of a food material may be characterized by its apparent density, solids
density, bulk porosity, pore size distribution, specific volume, etc.
•
Apparent density (
ρρρρ
b
) concerns powdered and porous materials and it is
determined by the mass of the sample and its apparent volume. The terms bulk
density and bulk volume are also used for granular materials.
•
True density (
ρρρρ
p
) is the density excluding all pores and it is determined by the
mass of sample and its true volume. The terms particle density and particle
volume are used for granular materials.
•
Porosity (
εεεε
) characterizes the overall open structure of a dehydrated material. It is
the fraction of the empty volume (void fraction) and it is usually estimated from
the apparent density and the true density of the material according to the following
equation:
ε
= 1-
ρ
b
/
ρ
p
(1)
•
Specific volume (
υυυυ
) is determined by the mass of the dry solids and its bulk
volume.
2.2 Experimental Measurement
The determination of structural properties of a material is based on the mass,
apparent volume and true volume determination. Mass is determined measuring
sample’s weight, while there are several methods for apparent volume and true
volume measurement.
•
Apparent volume Several methods have been used in order to determine the
apparent volume of a solid material. The most commonly used can be summarized
as follows:
- volumetric displacement methods: the apparent volume is determined by
placing the sample in a container of known liquid volume and measuring
the volume displacement (Krokida et al. 1997).
- dimension methods: the apparent volume is determined by averaging a
number of dimension measurements with micrometers, assuming spherical
or slab shapes (Lozano et al. 1983; Ratti 1993; Karathanos & Saravacos
1993).
- stereopycnometer methods: the sample is covered with silicone grease in
order to make it impervious to gases and its apparent volume is measured
by a stereopycnometer (Bonazzi et al. 1992).
•
True volume is usually measured by means of a gas (helium) stereopycnometer,
which measures the true volume, excluding the interparticle volume (Moshenin
1980; Donsi et al. 1996; Zogzas et al. 1994).

5
2.3 Experimental data
Porosity is the most commonly reported in the literature structural property.
Bulk porosity of agricultural products has been usually estimated during and after
drying with various drying methods. Table 1 gives some literature values of the bulk
porosity in food materials. The corresponding moisture content is also mentioned.
Porosity is strongly affected by material moisture content, drying method and
conditions. In, general, comparison among structural properties reported in the
literature is difficult because of the variation of drying methods and conditions used
from the various investigators.
In order to examine the effect of experimental factors on structural properties,
materials for which sufficient experimental data are available have been chosen to be
presented for the needs of the present chapter.
Table 1.
Porosity values of some foodstuffs
Material
Drying method/conditions
Moisture
content
(kg/kgdb)
Porosity
Reference
1. Amioca Starch
Air drying, 60
o
C 0.1
0.4-0.6
Marousis et al. 1989
Extrusion, 180
o
C 0.3
0.502
Karathanos & Saravacos 1993
Extrusion, 180
o
C 0.4
0.314
Karathanos & Saravacos 1993
Extrusion, 100
o
C 0.5
0.168
Karathanos & Saravacos 1993
Air drying, 60
o
C, RH:10%
0.2
0.45
Marousis & Saravacos 1990
2. Apple
Natural air drying, 50
o
C
Forced air dr 50
o
C, RH:15%
Vacuum drying, 50
o
C
Freeze drying
0.1
0.1
0.1
0.1
0.2
0.1
0.4
0.8
Donsi et al. 1996
Air drying, 50-60
o
C, 0.1-2m/s
0.1
0.5-0.3
Ratti 1994
Osmotic deh. (15-45% sugars)
(10-40
o
C)
3-5 0.2-0.4
Reppa et al. 1999
Osmotic deh. (50% sucroce 20
o
C) 3 0.35
Mavroudis et al. 1998
Air drying 70
o
C, RH:20-60%
0.1
0.65
Zogzas et al. 1994
Air drying, 70
o
C
Lozano et al. 1980
Vacuum drying, 80
o
C 0.1
0.5
Torreggiani et al. 1995
Air drying, 60
o
C 3m/sec RH: 10%
0.1
0.6
Sjoholm & Gekas 1995
Air drying, 70
o
C, 10%
Vacuum drying, 30-900mbar
Osmotic dehydration glucose
Microwave drying
Freeze drying
0.1 0.6
0.75-0.6
0.5
0.6
0.92-0.75
Krokida et al. 1997
Krokida & Maroulis 1997
Krokida et al. 1998c
3. Banana
Air drying, 70
o
C, 10%
Vacuum drying, 30-900mbar
Osmotic dehydration glucose
Microwave drying
Freeze drying
0.1 0.2
0.2-0.7
0.15
0.25
0.9-0.84
Krokida et al. 1997
Krokida & Maroulis 1997
Krokida et al. 1998c

6
4. Blueberries
Air dried , 50
o
C
Microwave oven dried
Vacuum-oven dried, 40
o
C
Freeze dried
0.1
0.1
0.1
0.1
0.15
0.21
0.45
0.70
Yang & Atallah, 1985
Air dried , 45
o
C
Microwave oven dried
0.1
0.1
0.2
0.21-0.2
Raghavan & Venkatachalapathy, 1999
5. Carrot
Air drying, 50-60
o
C, 0.1-2m/s
0.1
0.1-0.3
Ratti , 1994
Air drying 70
o
C, RH:20-60%
0.1
0.10
Zogzas et al. 1994
Air drying, 70
o
C, 10%
Vacuum drying, 30-900mbar
Microwave drying
Freeze drying
0.1 0.1
0.1-0.5
0.7
0.94-0.88
Krokida et al. 1997
Krokida & Maroulis 1997
Krokida et al. 1998c
Air drying, 40
o
C, RH:30%
0.1
0.1
Suzuki et al. 1976
6. Cornmeal
Extrusion, 140
o
C
0.16 0.951
Karathanos & Saravacos 1993
7. Garlic
Air drying, 50-60
o
C, 0.09-1.2m/s
0.1
0.7-0.8
Madamba et al. 1993
Air drying, 70
o
C, RH: 14.5%
0.05
0.13
Madamba et al. 1994
8. Grapes
Air drying, 40-80
o
C
Pretr. 2% CaCO
3
3% ethyl oleate
0.1 0.1-0.2
Gabas et al. 1999
9. Hulls
Air drying
0.05
0.55
Teotia & Ramakrishna, 1989
10. Hylon 7
Air drying, 60
o
C, RH:10%
0.2
0.46
Marousis & Saravacos 1990
11. Kernel
Air drying
0.08
0.076
Teotia & Ramakrishna, 1989
12. Onion
Air drying, 70
o
C, RH: 14%
0.05
0.1-0.2
Rapusas et al. 1995
13. Potato
Natural air drying, 50
o
C
Forced air dr 50
o
C, RH:15%
Vacuum drying, 50
o
C
Freeze drying
0.1
0.1
0.1
0.1
0.1
0.1
0.7
Donsi et al. 1996
Air drying, 50-60
o
C, 0.1-2m/s
0.1
0.1-0.2
Ratti , 1994
Air drying 70
o
C, RH:20-60%
0.1
0.05
Zogzas et al. 1994
Vacuum drying, 70
o
C 0.05
0.25
Suarez & Viollaz, 1991
Air drying, 70
o
C, 10%
Vacuum drying, 30-900mbar
Microwave drying
Freeze drying
0.1 0.2
0.1-0.2
0.7
0.87-0.78
Krokida et al. 1997
Krokida & Maroulis 1997
Krokida et al. 1998c
Air drying, 40
o
C, RH:30%
0.1
0.05
Suzuki et al. 1976
14. Radish
Air drying, 40
o
C, RH:30%
0.1
0.12
Suzuki et al. 1976
15. Raisins
Air drying, 39-51
o
C, RH: 14%
0.14-0.80 0.47-0.37
Vagenas et al. 1990
16. Seeds
Air drying
0.19
0.5
Teotia & Ramakrishna 1989
17. Squid flesh
Air drying, 70
o
C, RH:15%
0.02-0.8
0.12-0
Rahman & Potluri 1990
18. Sweat Potatoes
Air drying, 40
o
C, RH:30%
0.1
0.04
Suzuki et al. 1976

7
2.4 Factors affecting structural properties
During drying, significant changes in structural properties can be observed as
water is removed from the moist material. The main aspect, as far as structural
properties are concerned, is to control the product apparent density and porosity and
to yield products of different physical structures for various uses, choosing an
appropriate drying method and conditions.
As an explanation of the observed changes of structural properties during drying,
it could be presumed that in the early stages of drying, the cellular tissues are elastic
enough to shrink into the space left by the evaporated moisture. As the drying process
proceeds, structural changes in the cellular tissues result in a more rigid network, thus
favouring the development of porosity. This behaviour clearly depends on various
factors, which specify the structural properties of the dried material. These factors are
analytically examined in the following paragraphs:
•
moisture content
•
drying method
•
drying conditions
Considering that most of dehydrated products will be rehydrated, a basic aspect
seems to be that the structural behaviour of rehydrated products should be close to
that of fresh materials. The effect of drying method on structural properties of
rehydrated products is also examined in this chapter
2.4.1 Effect of moisture content on structural properties
Structural properties of foods are strongly affected by material moisture content.
Diffusion of water molecules during drying forms cracks to the solid structure,
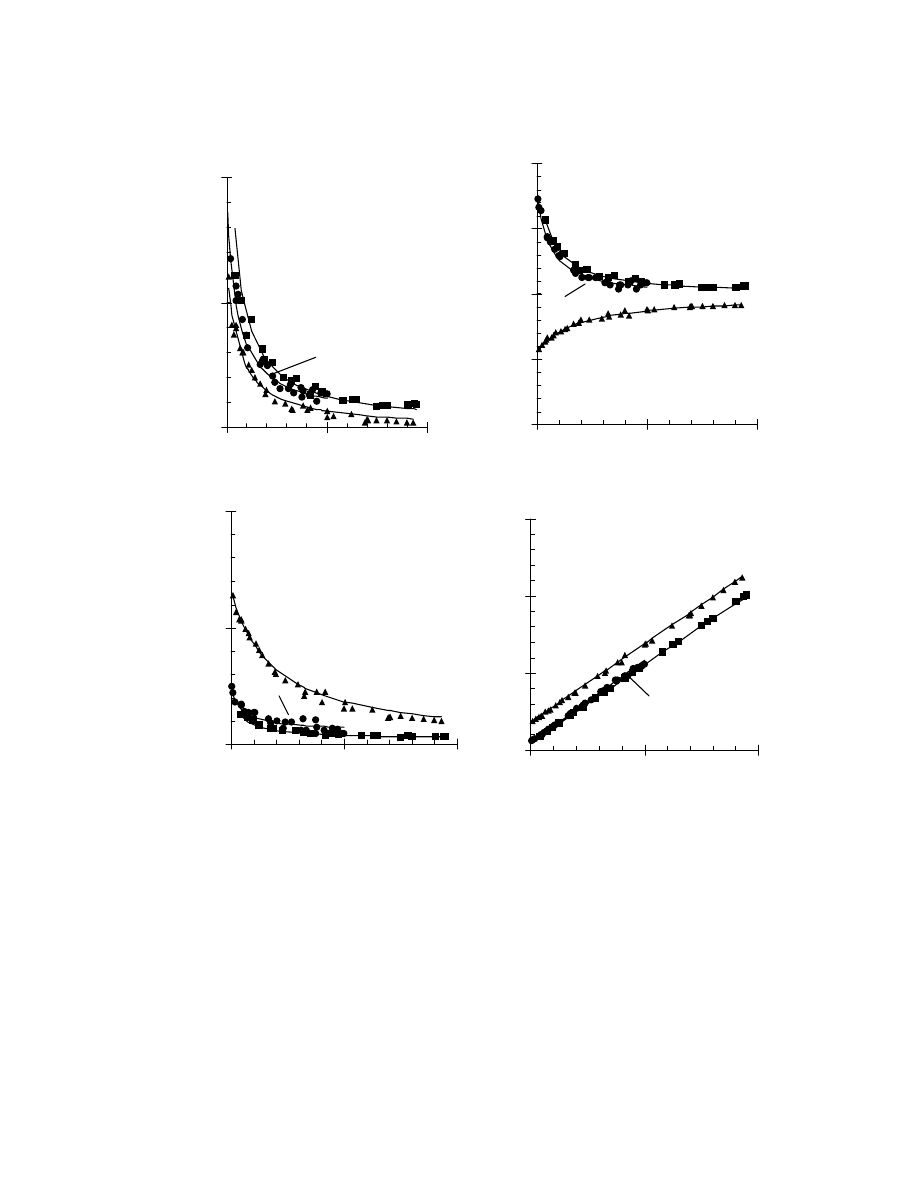
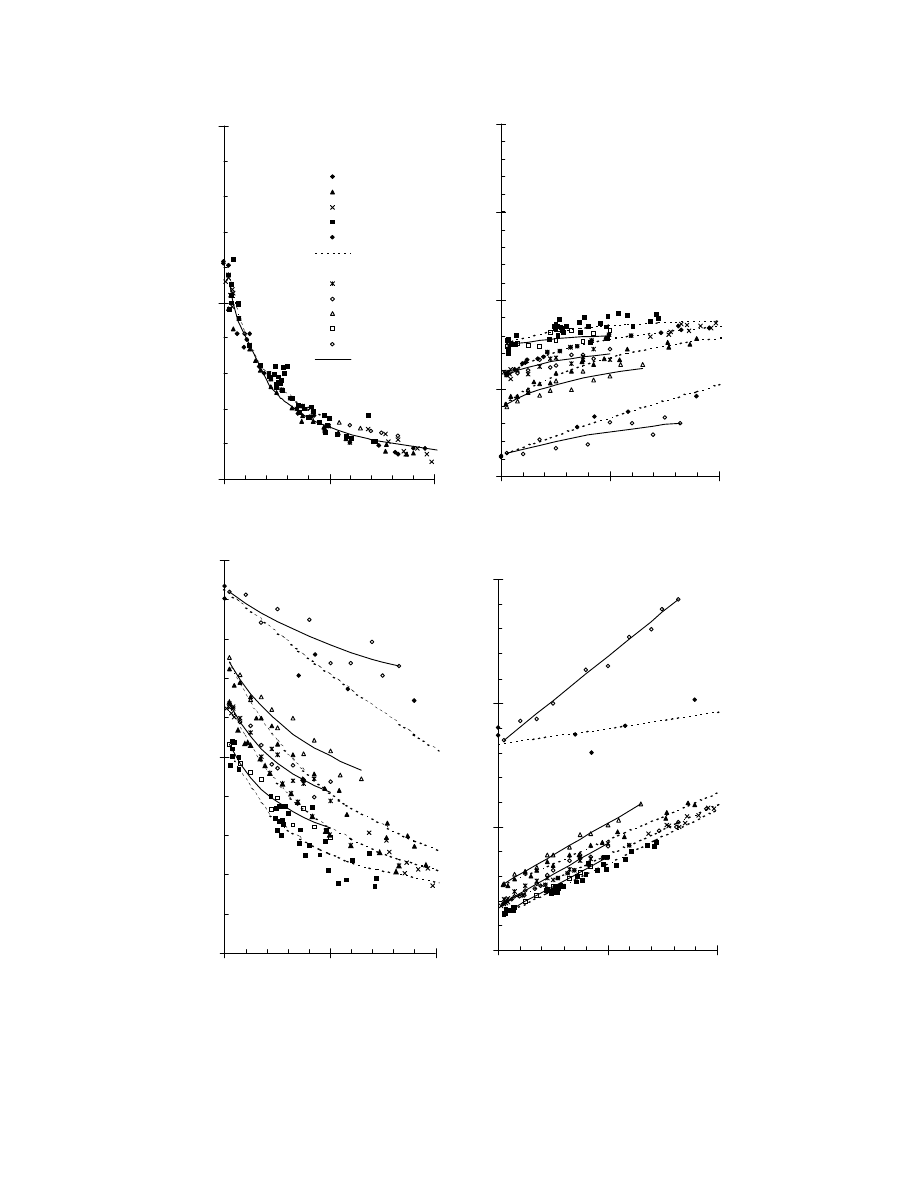
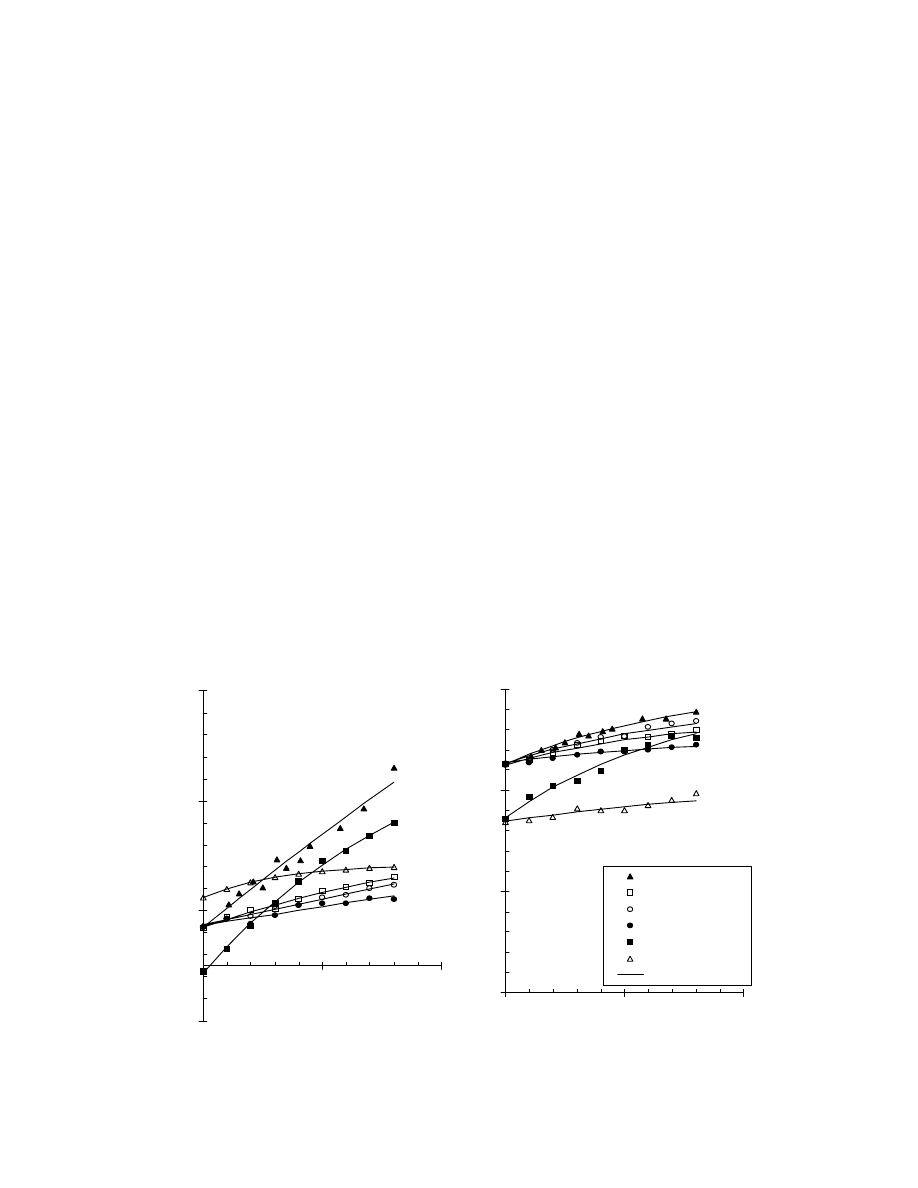
causing structural damage and significant changes to all structural properties. Figure 1
presents the variation of true density, apparent density, porosity and specific volume
for apple, banana and carrot during conventional drying (70
o
C, 15% relative
humidity).
True density increases as the water is removed, which should be expected since
true density ranges between the density of water and the dry solids density. Thus, as
the water is removed, the true density reaches the value of the material dry solid
density.
Apparent density ranges between the density of water and the density of the
completely dry material (
ρ
b0
). As a result, the value of apparent density at high
moisture content, approximates the density of water, while at low moisture content
values, it tends to the value of
ρ
b0
. Thus, apparent density of apples decreases with
moisture content, while it increases for carrot and banana, as water is removed during
conventional drying.
Porosity of food materials increases in general while moisture content is
decreased. The final porosity values of dehydrated products depend on the material
structure as well as the drying conditions. Dried apple (Fig. 1) develops the highest
porosity values, while the shrinkage phenomenon seems to be less intense. For the
specific drying conditions, banana and carrot seem to shrink intensely, developing
lower porosities.
8
Specific volume decreases linearly with moisture content during conventional
drying, showing similar values for all the materials.
Figure 1. Structural properties during conventional drying (70
o
C, 15% RH).
Apple
1.0
1.5
2.0
0
5
10
M ois ture conte nt (kg/kg db)
T
ru
e de
ns
it
y
(k
g/
lt
)
Banana
C arrot
0.0
0.5
1.0
1.5
2.0
0
5
10
M ois ture conte nt (kg/kg db)
A
p
pa
re
nt
de
ns
it
y
(
k
g/
lt
)
Apple
C arrot
Banana
0.0
0.5
1.0
0
5
10
M ois ture conte nt (kg/ kg db)
Po
ro
si
ty
Apple
Banana
C arrot
0
5
10
15
0
5
10
M ois ture conte nt (kg/kg db)
S
p
e
c.
V
o
lu
m
e
(l
t/k
g
d
b)
Apple
C arrot
Banana

9
2.4.2 Effect of drying method on structural properties
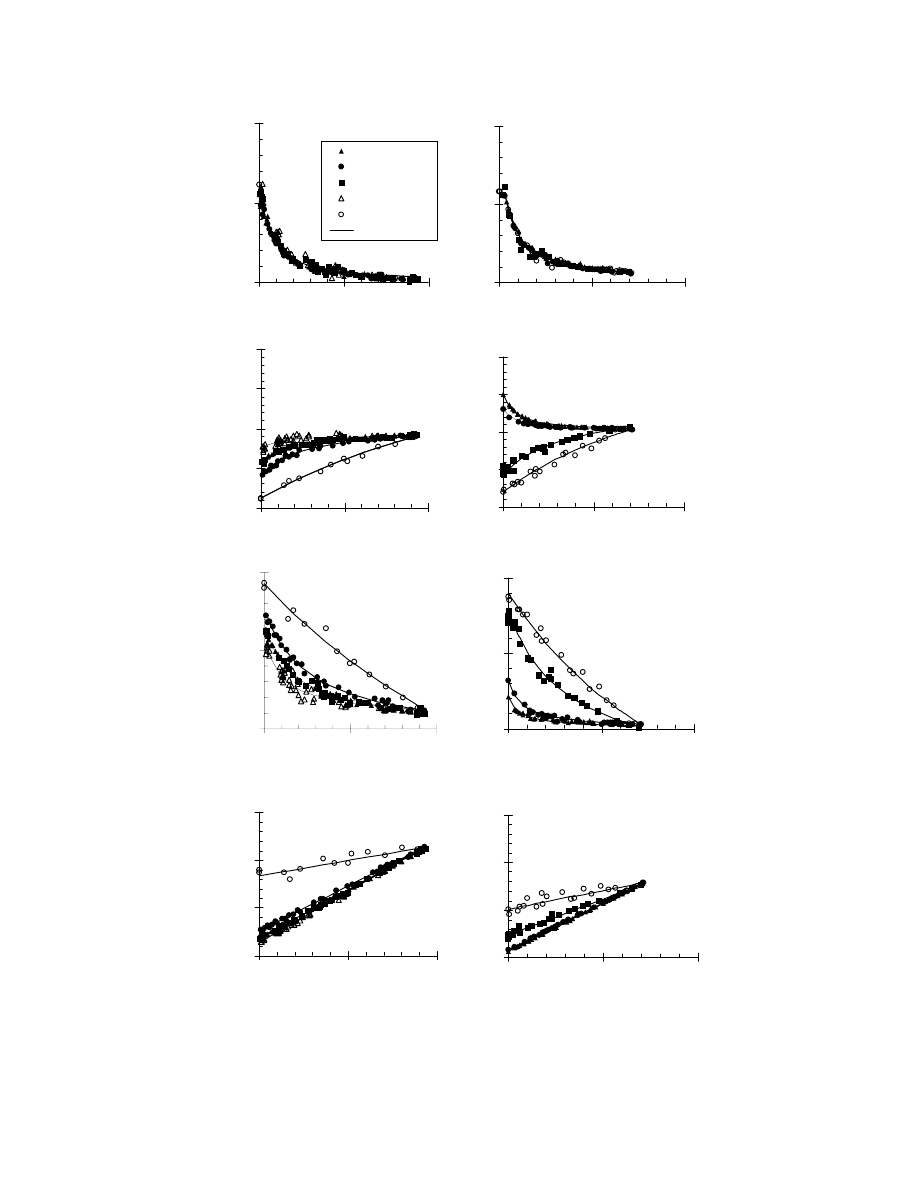
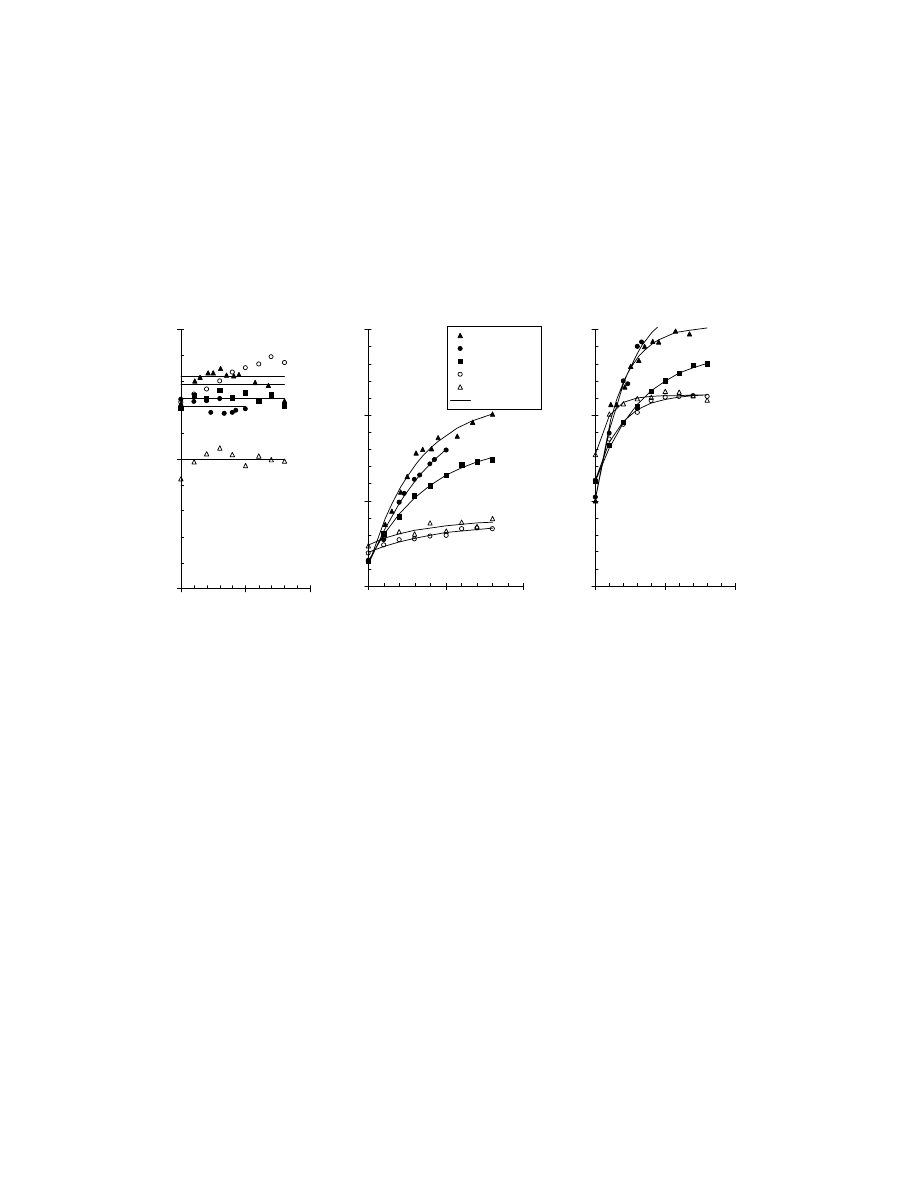
Structural properties are greatly affected by the drying method. Figure 2
presents the effect of drying method on the structural properties of two materials. It
was chosen to present one fruit and one vegetable, for which there are enough
experimental data.
True density is not affected by drying method. An exception seems to be the
case of osmotic dehydration. Osmotic dehydration influences true density values, as
mass transfer phenomena take place during osmotic treatment. Water loss and solids
gain of osmo-dehydrated fruits affect the dry solids density, which reaches the value
of sugar density. During all drying methods, true density increases as water is
removed. This should be expected, since true density ranges between the density of
water and the dry solids density. Thus, as water is removed, the true density reaches
the value of the dry solids density.
Apparent Density is strongly affected by dehydration process. More specifically,
the apparent density values during vacuum drying were significantly lower than those
of conventional drying for all materials. As far as freeze dried materials are
concerned, the values of apparent density are the lowest noticed. Also, the apparent
density of microwave - dried products seem to depend on the material structure.
Osmotic dehydration increases, in general, the apparent density of fruits. The apparent
density of apples decreases with moisture content for all dehydration methods. For
potato, the apparent density increases with moisture content for vacuum and
conventional drying, while it decreases during microwave and freeze drying.
Apparent density ranges between the density of water and the density of the
completely dry material (
ρ
b0
). As a result, the value of apparent density at high
moisture content, approximates the density of water, while at low moisture content
values, it tends to the value of ρ
b0
. Drying method conditions are expected to highly
affect ρ
b0
, which has also been noticed through the parameters estimation procedure.
Porosity of freeze dried materials is always higher in comparison to all other
dehydration processes (80-90%). Porosity of microwave dried potato follows (75%),
while microwave dried apple does not develop high porosity (25%). Vacuum dried
apple developed high porosity (70%), while for vacuum dried potato porosity values
were lower (25%).
Specific Volume reduction is almost absent in freeze dried materials. That
happens because a very limited shrinkage is detected in freeze dried samples, which
are characterised by a structure with minimum deformation in respect to fresh
samples. For all the other methods, specific volume does not vary significantly with
the drying method. So, for conventional and osmotically dehydrated materials, the
shrinkage phenomenon is very intensive, while this phenomenon is less intensive for
vacuum dried and microwave dried materials.
10
APPLE
0.0
0.5
1.0
1.5
2.0
0
5
10
M ois ture conte nt (kg/kg db)
A
ppa
re
nt
de
ns
it
y
(k
g/lt
)
APPLE
1.0
1.5
2.0
0
5
10
M ois ture conte nt (kg/kg db)
T
rue
de
n
sit
y (
k
g/
lt
)
conv. drying
vacuum drying
microwaves
osmotic deh.
freeze drying
Calculated
APPLE
0.0
0.5
1.0
0
5
10
M ois ture conte nt (kg/ kg db)
Po
ro
si
ty
APPLE
0
5
10
15
0
5
10
M ois ture conte nt (kg/kg db)
S
pe
c.
V
ol
um
e(l
t/
k
g d
b)
POTATO
1.0
1.5
2.0
0
5
10
M ois ture conte nt (kg/kg db)
T
rue
de
n
sit
y (
k
g/
lt
)
POTATO
0.0
0.5
1.0
1.5
2.0
0
5
10
M ois ture conte nt (kg/kg db)
A
ppa
re
nt
de
ns
it
y
(k
g/lt
)
POTATO
0.0
0.5
1.0
0
5
10
M ois ture conte nt (kg/ kg db)
Po
ro
si
ty
POTATO
0
5
10
15
0
5
10
M ois ture conte nt (kg/kg db)
S
pe
c.
V
ol
um
e(l
t/
k
g d
b)
Figure 2. Effect of drying method on structural properties of apple and potato.
11
2.4.2 Effect of drying conditions on structural properties
Drying conditions affect significantly the physical structure of a material. Thus,
the same raw material dried with the same drying method may end up to a completely
different material under different drying conditions. This suggests that the rate at
which the material is dried and its structural properties are interrelated. The effect of
some drying conditions, related to structural properties, which have been examined in
the literature, are presented in the next paragraphs. More specifically, the following
aspects are examined:
-
The effect of pressure during vacuum drying
-
The effect of temperature during freeze drying
2.4.2.1 Effect of pressure during vacuum drying
The effect of pressure on structural properties of dehydrated products was
examined. Pressure affects significantly the percentage of air pores developed in the
final dry product. Consequently, only apparent density and porosity are expected to be
affected by pressure during vacuum dehydration (Figure 3).
Apparent density of dried materials decreases as vacuum pressure decreases,
which mean that lower pressure during vacuum dehydration prevents structural
collapse of foods. This phenomenon seems to be more intense for carrot and banana
than for apple and potato.
Porosity of dehydrated products increases as vacuum pressure decreases, which
means that shrinkage can be prevented by controlling pressure, allowing high porosity
values in the final products.
Figure 3. Effect of pressure on structural properties of vacuum dried materials.
Banana
Apple
C arrot
Potato
0.0
0.5
1.0
1.5
2.0
0
500
1000
Pre s s ure (mbar)
A
ppa
re
nt
de
ns
it
y o
f d
ry
s
ol
ids
(
k
g
/l)
Banana
Apple
C arrot
Potato
0
0.5
1
0
500
1000
Pre s s ure (mbar)
P
o
ro
si
ty
of
d
ry s
o
lid
s
12
2.4.2.2 Effect of temperature during freeze drying
Freeze drying conditions affect significantly structural properties of dried
materials. Apparent density and porosity values of the final product depend on
whether on not the frozen product was kept below a critical temperature, the collapse
temperature during the sublimation of ice. The collapse temperature is related to the
glass transition temperature, which is the temperature above which the solute matrix
loses its shape. The effect of temperature on apparent density and porosity of freeze
dried materials is presented in Figure 4.
Apparent density of freeze dried plant materials, as determined experimentally,
was strongly affected by the freeze drying conditions (Fig. 4). More specifically, all
materials did not shrink significantly during freeze drying at low temperatures (lower
than the estimated glass transition temperature T
g
′
= - 45°C) and they resulted in low
apparent densities. The shrinkage was considerably more significant when freeze
drying occurred at reduced vacuums and, consequently, at higher temperatures. The
apparent density of freeze dried materials decreased as the temperature was increased
from (-50
°
C) to (-8
°
C). Apparent density of apple showed the greatest dependence on
temperature, the density of carrot followed, while banana and potato showed the
lowest dependence. Among the fresh samples, apple has the lowest bulk density,
which is due to its greater contained volume of air. Therefore, during sublimation of
the ice crystals, an additional volume (the empty pores) is available to shrink above
the shrinkage temperature.
Porosity of freeze dried materials is shown in Fig. 4. The porosity was greatly
affected by the freeze drying conditions. At low temperatures, the porosity for all
materials was the highest noticed (90%), while it decreased for drying at higher
temperatures. The reduction of the porosity varied from 30% for apple to 10% for the
other materials. During freeze drying, detrimental effects occurred due to the glass to
rubber transition of the CAS and the melting of ice which plasticized the matrix and
decreased the porosity, as the initial sample temperature was increased. Fresh apple
has the greatest porosity value, which means that the pore percentage is higher and
therefore a greater volume of pores is available to shrink.
Figure 4. Effect of temperature on structural properties of freeze dried materials.
0
0.1
0.2
0.3
0.4
0.5
220
240
260
280
Te mpe rature (K)
A
ppa
re
nt
D
e
ns
it
y
(
k
g
/lt)
0.7
0.8
0.9
1
220
240
260
280
Te mpe rature (K)
Po
ro
si
ty
Apple
Potato
C arrot
Banana
C alculated

13
2.4.2 Effect of drying method on structural properties of rehydrated products
Structural changes that take place during drying cannot be restored by a simple
addition of water. Examining structural properties of dehydrated products during
rehydration is a measure of the injury to the material caused by drying. The degree of
rehydration is depended also on the degree of structural disruption. The effect of
drying method on structural properties of apple is presented in figure 5.
True density is not affected by drying method and it is the same during
dehydration and rehydration for the same moisture content. That means that only
material and moisture content affect true density. Thus, as water is removed during
dehydration, true density reaches the value of the dry solid density, while as water is
gained during rehydration true density decreases again following the same route.
Apparent density during rehydration follows the same mode as during
dehydration, which means that apparent density of apple increases with moisture
content for the examined drying methods. It drops significantly during rehydration for
all the drying methods, having lower values than those during dehydration. That
means higher air pores proportion during rehydration, and that cellular and structural
disruption, which takes place during drying, results in reduced hydrophilic properties
and inability to imbibe sufficiently water, leaving pores uncovered. Moreover, the
inflation phenomenon, which takes place during rehydration, results in decrement of
apparent density during rehydration. As it may be seen, the hysteresis phenomenon
appears for apparent density during rehydration and the degree of that phenomenon
depends on the drying method.
Porosity of dehydrated products decreases during rehydration for all the
examined materials. The hysteresis phenomenon is noticed for all drying methods,
which appears as an increment of porosity values during rehydration in comparison to
those noticed during dehydration. The reduced hydrophilic properties and the inability
to imbibe sufficiently water, leaving pores uncovered, result in higher porosity values.
Shrinkage phenomena that take place during dehydration prevent rehydration and
develop products with higher porosity values. Freeze dried materials, seem to have the
highest rehydration ability, while air and microwave vacuum products show the
lowest noticed.
14
Figure 5 Effect of temperature on structural properties of freeze dried materials.
APPLE
0.0
0.5
1.0
1.5
2.0
0
2
4
M oisture conte nt (kg/kg db)
A
ppa
re
nt
de
ns
it
y
(k
g
/l
t)
APPLE
0.0
0.5
1.0
0
2
4
M oisture conte nt (kg/ kg db)
Po
ro
si
ty
APPLE
0
5
10
15
0
2
4
M oisture conte nt (kg/kg db)
S
p
e
c.
V
o
lu
m
e
(l
t/
k
g
d
b)
APPLE
1.0
1.5
2.0
0
2
4
M oisture conte nt (kg/kg db)
T
rue
de
n
si
ty
(
k
g
/l
t)
D e hydration
conv. drying
vacuum drying
microwaves
osmotic deh.
freeze drying
Calculated
R e hydration
microwaves
conv. Drying
vacuum drying
osmotic deh.
freeze drying
Calculated

15
2.5 Mathematical modeling
Many attempts have been made in the literature for the development of structural
models. The main purpose of a structural model is to describe the relation of porosity
development with moisture content. Most of these approaches require knowledge of
transport properties and are rather complicated.
Lozano et al. 1980 & 1983, developed a general model to correlate shrinkage
properties for fruits and vegetables. They suggested two alternative approaches; the
first considers porosity to depend on the shrinkage of the sample over all dimensions,
while the second takes into account the shrinkage of the cells of the cellular tissue of
the material. This approach requires knowledge of transport properties in general and
porosity in particular, which are not usually available.
Suzuki et al. 1976 developed three equations, which apply to three different
drying models: uniform drying, core drying and semicore drying. The first model
results in two alternative equations: one needs data for equilibrium moisture contents
and bulk density and the other requires the initial moisture content and bulk density of
the material. The second and the third model need the initial and equilibrium values
for moisture and bulk density.
A mathematical model, which predicts the porosity development during drying
and correlates it with the material moisture content, would be useful. It should be
simple, generalized and contain parameters with physical meaning.
A simple mathematical model is presented here to predict bulk density, particle
density, porosity and specific volume versus material moisture content ( Krokida et al.
1997, Zogzas et al. 1994). The proposed model is summarised in Table 2. It is a
simple model, generalized for all the materials.
This model involves four parameters with physical meaning: the density of
enclosed water
ρ
w
, the dry solids density
ρ
s
, the dry solids bulk density ρ
b0
and the
shrinkage coefficient
β
′
. Equation (1) is used for the determination of true density (
ρ
p
)
as function of moisture content (X), considering that particle density ranges between
the dry solid density (
ρ
s
) and the density of the water (
ρ
w
). It corresponds to a two-
phase serial mixing model. Similarly, in equation (2) bulk density ranges between the
bulk density of dry solids (
ρ
b0
) and the enclosed water density (
ρ
w
). Again, equation
(2) can be considered as a two-phase structural model. The total porosity is a function
of apparent density and particle density, equation (3). The definition of specific
volume involves three parameters: the bulk density of dry solids (
ρ
b0
), the enclosed
water density (
ρ
w
) and the shrinkage coefficient
β′
, equation (4).
The effect of factors such as material, drying method and drying conditions on
the examined structural properties is taken into account through their effect on the
four parameters incorporated in the structural model proposed (
ρ
s
,
ρ
w
,
β
′
,
ρ
b0
).
Five drying methods were examined: conventional (70
o
C, 15% RH), vacuum
(70
o
C, 30mbar), osmotic pre-treatment, microwave-conventional and freeze drying
.
The four parameters were estimated for each drying method during dehydration and
rehydration procedures and the results are presented in Table 2 for apple.
The effect of pressure on structural properties during vacuum drying, is expressed
through its effect on
ρ
b0
, using an exponential relation, while all other parameters
were not found to be affected by pressure changes. The estimated parameters are
presented in Table 2 again for apple.
The effect of temperature on structural properties during freeze drying, is
expressed through its effect on
ρ
b0
, using an exponential relation, while all other

16
parameters were not found to be affected by sublimation temperature during drying.
The estimated parameters are presented in Table 2, again for apple.
TABLE 2.
Mathematical Model
1. Properties
ρ
p
True density
(kg/m
3
)
ρ
b
Apparent density
(kg/m
3
)
ε
Porosity
(-)
υ
Specific volume
(m
3
/kg db)
2. Factors
Χ
Material moisture content
(kg/kg db)
3. Properties Equations
ρ
p
= (1+X)/(1/
ρ
s
+X/
ρ
w
)
(1)
ρ
b
= (1+X)/(1/
ρ
b0
+
β′⋅
X/
ρ
w
) (2)
ε
= 1 -
ρ
b
/
ρ
p
(3)
υ
= 1/
ρ
bo
+ β
′⋅
X /
ρ
w
(4)
4. Parameters
ρ
w
Enclosed water density
(kg/m
3
)
ρ
s
Dry solids density
(kg/m
3
)
ρ
b0
Dry solids bulk density
(kg/m
3
)
β′
volume-shrinkage
coefficient (-)
5. Factors affecting the parameters
•
Material
•
Drying method
Conventional (70
o
C, 15% RH)
Vacuum (70
o
C, 30mbar)
Osmotic pre-treatment
Microwave-conventional
Freeze
Application material: Apple
Material/Method
ρρρρ
s
ρρρρ
w
ββββ
΄
ρρρρ
bo
Convective
0,99
0,56
Vacuum
0,96
0,39
Microwave
1,01
0,56
Freeze
0,34
0,12
D
ryin
g
Osmotic
1,10
0,73
Convective
1,30
0,56
Vacuum
1,31
0,39
Microwave
1,30
0,56
Freeze
0,81
0,12
R
ehy
dra
t.
Osmotic
1,67
1,02
1,22
0,73
•
Drying conditions
- Effect of pressure during vacuum drying
ρ
b0
=
0.55
P
0.10
- Effect of temperature during freeze drying
ρ
b0
= 1.1
×
10
-6
exp(0.048 T)

17
3. OPTICAL PROPERTIES (Color)
3.1 Definition
Color is the sensation experienced by an individual when energy in the form of
radiation within the visible spectrum falls upon the retina of the eye. That color is a
sensation dependent upon what a person sees can not be overemphasized. Also there
are several factors, which influence the radiation and, subsequently, the exact color, or
sensation, which the individual perceives. These factors include:
1. The spectral energy distribution of the light
2. The conditions under which the color is being viewed
3. The spectral characteristics of the object, with respect to absorption, reflection
and transmission
4. The sensitivity of the eye
Thus, before measuring the color of any object, it is necessary to understand the
physical, physiological and psychological aspects of the stimulation, which ultimately
result in the visual perception of the color of an object.
For the determination of color solids the CIE system (International Commission
on Illumination) has been developed. The CIE has adopted methods for the
measurement and specification of color which include:
1. The use of standard light sources as prescribed by CIE definition
2. Exact conditions for the observation or measurement of sample color
3. The use of appropriate mathematical units in which to express the color of an
object
4. Definition of “standard observer” curves or tables relating objective
measurement to visual response, and thus, measuring what the eye sees.
The color of the material changes during dehydration not only due to evaporation
of the surface water but also due to certain reactions, such as enzymatic browning,
non-enzymatic browning and caramelization reactions (Kudra and Strumillo, 1998).
These reactions may be undesirable for many products, thus the regulation of color
during drying is the subject of various procedures, such as temperature deviation of
specified ranges, intermittent drying, use of color protective agents, (e.g. sulfur
dioxide) etc.
3.2 Experimental Measurement
There are certain methodologies for analyzing the color. The types of
colorimeters that have been employed widely in food applications in America, to date,
are the Hunterlab instruments, the Gardner series, the Color-Eye, the Colormaster and
the Tintometer.
The most common color measurement units are the RGB (Red, Green, Blue),
Lab (Lightness, Redness-greenness, Yellowness-blueness) and XYZ scales that

18
analyze the color into these parameters, so that each composite color can be easily
quantified by a set of three numbers.
Conversion of data from one type of instrument to another is usually via the CIE
XYZ system, and equations are provided with instructions from each manufacturer.
Clydesdale and Podlesny (1968) published a computer program for these
interconversions. The Agtron has also been used widely in food applications, but there
are no satisfactory methods to convert Agtron data to XYZ.
The measurement of color is done through colorimetric techniques by analysis
of the spectrum of light produced by an instrument and reflected on the product’s
surface. The color may be measured on line and lead to mechanical sorting of the
product, based on color evaluation. Other techniques involved in the browning of
foods make use of spectrophotometers to analyze the extend of browning. The
browning may be a very important qualitative parameter, since apart from the
desirable or undesirable appearance of food; it may also lead to significant nutrient
losses.
3.3 Experimental data
The color of foods is important to their acceptability. In a large-scale consumer
study product quality was related to color (Eagerman, 1978). Instrumental techniques
have been applied to obtain objective color evaluation.
The kinetics of browning has been studied by Bolin & Steele (1987) and Sapers
& Ziolkowski (1987). Bolin & Steele (1987) used low oxygen pressure or sulfur dioxide
processing to avoid the oxidative type of non enzymatic browning which, as they
showed, accounts for 60-70% of the total browning during storage. Sapers & Ziolkowski
(1967) added erythorbic or ascorbic acid to eliminate the enzymatic browning of cut
surfaces of fruits in order to eliminate the use of sulfur dioxide from treatment prior to
drying. Sulfur dioxide is a good color preservative of fresh fruits and vegetables, as it
retards both enzymatic and non-enzymatic browning reactions, but its extensive use in
foods has been questioned, as it might cause some health problems.
The color development has been studied by several researchers for a number of
products. The effect of various drying methods and conditions on color degradation
has been measured. Blanching is often used before drying of most vegetables, in order
to prevent the development of off flavours in subsequent storage. Many studies have
been conducted to determine whether steam or water blanching was the more efficient
when one considers the loss of nutrients as a result blanching (Voirol 1980). Steam
blanching is usually expected to conserve more soluble nutrients than water
blanching, but there is some indication that color of green vegetables is adversely
affected by steam (Odland & Eheart 1975).
Table 3 gives the most important references for color measurements of fruits
and vegetables. The values of color in Lab scale, as well as the method and conditions
are also reported.

19
Table 3
References of color measurements
Material
Drying method
Moisture
content
L a b
References
1. Apple
Air drying, 70
o
C, 10%
Vacuum drying, 30-900mbar
Osmotic dehydration glucose
Microwave drying
Freeze drying
0.1 64.8
50
35
55
76
6.69
7.73
1.12
4.73
0.97
20.2
22.1
16.2
18.7
12.8
Krokida et al. 1998b; 1999a
Heating 56-95
o
C
31
3
9.6
Lozano & Ibarz, 1997
Air drying 70
o
C, aw:0.5-0.7
0.1
50-70
0-10
0-4
Bolin & Steele, 1987
Air drying, 1-21
o
C 0.13-0.26
30-60
8-20
1-8
Sayaverda-Soto & Montgomery,
1988
2. Banana
Air drying, 90
o
C,
RH:25%
0.04-0.06 -10
-2 0.4-1 4-10
Chua et al., 1999
Osmotic deh 50-70
o
C sucrose
3
65
2
15
Waliszewski et al., 1999
Air drying, 70
o
C, 10%
Vacuum drying, 30-900mbar
Osmotic dehydration glucose
Microwave drying
Freeze drying
0.1 10
14
33
50
53
40.9
44.2
2.47
9.57
3.56
18.3
17.4
12.7
17.6
13.7
Krokida et al., 1998c; 1999b
3. Basil
Air drying 35-50
o
C
0.1 27-35
-1.5-5
10-16
Rocha et al., 1993
4. Blueberries
Air drying
Freeze drying
Osmo-convective 35-55
o
C
30
27.8
-2-3.5
1.43
1.95
27-32
-4.05
-3.31
1-3.9
Nsonzi & Ramaswamy, 1998
5. Carrots
Air drying, 70
o
C, 10%
Vacuum drying, 30-900mbar
Microwave drying
Freeze drying
0.1 45
43
76
30
15.7
20.2
19.8
13.8
22.0
20.1
21.7
18.9
Krokida et al., 1998c; 1999b
Water blanched
19-24
Eshtiaghi et al., 1994
Drying in batch tank (82
o
C) 0.1
42-50
-2
8
10-19
Howard et al., 1996
Air drying
33-37
32-24
16-19
Zhao & Chang, 1995
6. Corn
Fluidized bed drying,
150-170
o
C
0.19 40-50
8-10
18-23
Soponronnarit et al., 1999
7. Currant syrups
Drying, 100
o
C
56
50
39
Skrede, 1985
8. Green Alfalfa
Air drying 40-90
o
C
0.1
20-1
Sokhansanj & Patil, 1996
9. Green beams
Water blanching
Steam blanching
Microwave blanching
Convention oven blanching
51.2
51.6
55.2
52.6
-27.7
-29.4
-22.7
-23.6
22.6
21.3
22.2
21.2
Muftugil, 1986
Water blanched
2 36-42
Eshtiaghi et al., 1994

20
10. Guava
Air drying, 90
o
C, RH:25%
0.04-0.06 5-20 -1
1 5-20
Chua et al., 1999
11. Melon
Air drying, 90
o
C
0.9 55-44
10-12
19-22
Simandjuntak et al., 1996
12. Paprika
Natural drying
50
35
15
Guevara & Gonzalez, 1996
13. Pea Puree
Air drying, 110-125
o
C
0.1
23-51
Shin & Bhowmik, 1995
14. Peach pulp
Heating 56-95
o
C
29
8
14.9
Lozano & Ibarz, 1997
15. Pecan kernels
Steam treated 93
o
C
2.5 30-33
9-10
12-13
Senter et al., 1984
16. Plum pulp
Heating 56-95
o
C
25
4
8.8
Lozano & Ibarz, 1997
17. Potato
Air drying, 90
o
C, RH:25%
0.04-0.06
10-30
-0.1
8-18
Chua et al., 1999
Air drying, 70
o
C, 10%
Vacuum drying, 30-900mbar
Microwave drying
Freeze drying
0.1 45
46
40
40
29.9
35.3
35
5.07
16
13.1
15.1
12.8
Krokida et al., 1998c; 1999b
Water blanched
-2-4.5
Eshtiaghi et al., 1994
18. Rice
Extrusion
0.07 47-70
-0.9
4
8-13
Kapanidis & Lee, 1996
19. Rice brown
Air drying
0.06 78.9
0.4 12.3
Martinez-Bustos et al., 1996
20. Soy proteins
Heat treatment 25-55
o
C
0.8 70
-2 0.5
Dybowska & Fujio, 1998
21. Spinach
Freeze drying
Steam blanched
Water blanched
Microwave blanched
0.1 20
23.3
20.9
22.4
-4.2
-5.8
-7.1
-6.4
10.1
12.7
12.9
11.6
Quenzer & Burns, 1981
22. Strawberry suryp
Drying, 100
o
C
70
52
44
Skrede et al., 1992
23. Surimi gels
Air drying
0.7 0.8
78-80 -4 -3
7-4
Park, 1995
24. Tea
Air drying, 40
o
C
0.05 78 10 49
Toit & Joubert, 1998
25. Turmeric
Air drying 35-60
o
C 0.06
60
19
38
McGaw et al., 1998

21
3.4 Factors affecting optical properties
Colour changes, measured by tristimulus reflectance colorimetry, are related to
browning reactions that take place during drying of fruits and vegetables. As a result,
the kinetics of browning reactions defines color changes during drying. Color kinetics
are affected by many factors, the most important of which are analytically examined
at the following paragraphs.
•
drying method: the effect of five drying methods is examined (conventional,
vacuum, microwave, osmotic and freeze drying)
•
drying condition: the effect of some drying parameters that have been
experimentally proved that affect color kinetics is examined.
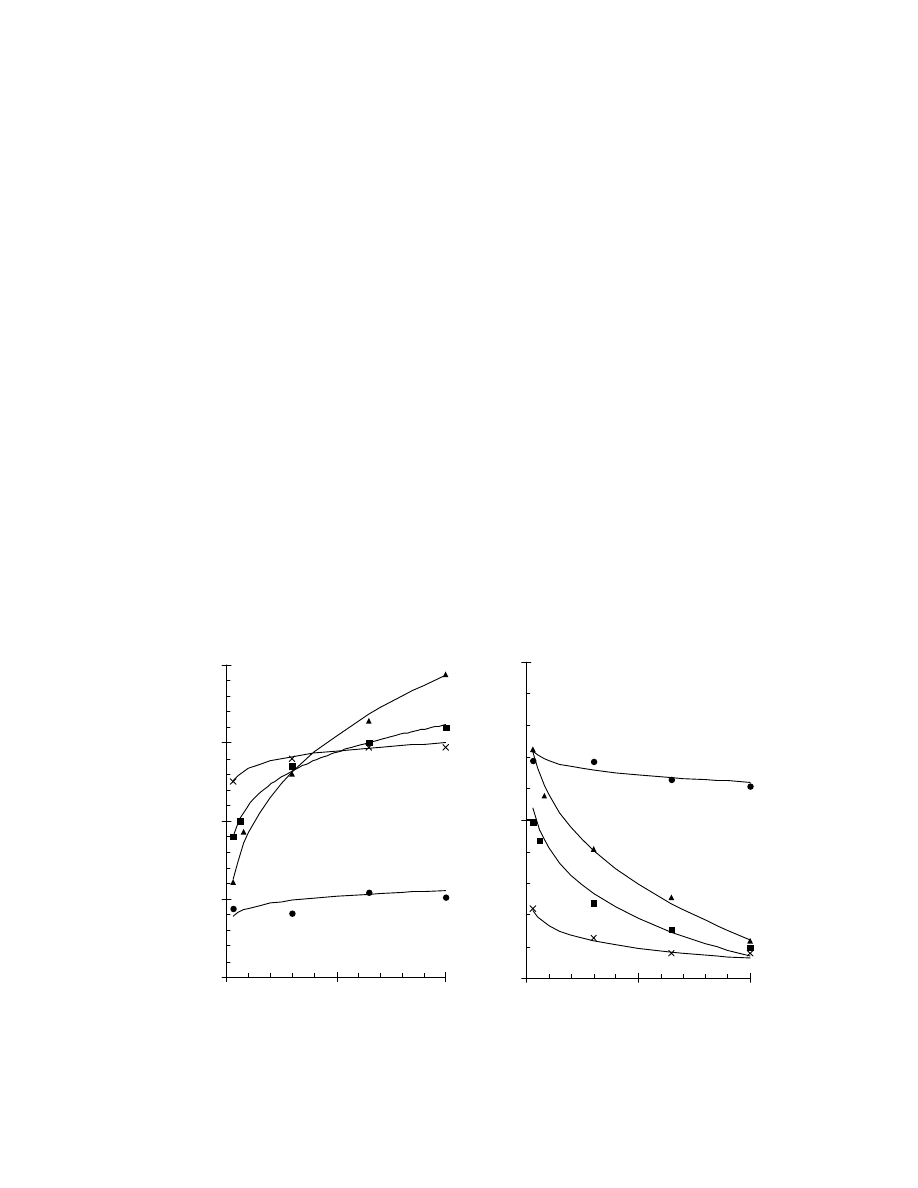
3.4.1 Effect of drying method on optical properties
The drying method affects significantly the color of dehydrated products.
The experimental and calculated values of lightness (L), redness (a) and
yellowness (b) of apple during the five drying methods are shown in Fig. 5.
The tendency of lightness parameter (L) during drying is not quite clear, due to
significant experimental error. However, there are some conclusions that result from
these data. As shown in Fig. 5, the lightness parameter (L) decreased significantly during
air, vacuum and microwave drying. Although the lightness parameter of the osmotically
pretreated samples was lower than that of fresh ones, it showed a remarkable stability
over the whole duration of drying (Fig. 5). The lightness of freeze dried materials was
slightly increased during drying.
The browning of fruits and vegetables during drying is due to both enzymatic and
non-enzymatic browning reactions. The infusion of sugars in fruits causes a relative
stability of color parameters (L, a, b), especially in comparison to air dried samples,
which experienced an extensive browning. This is possibly due to the existence of
sugars, which cause the relative inactivation of enzymes, which are responsible for the
enzymatic browning. Freeze drying removes water by sublimation of ice and prevents
enzymatic browning reactions, resulting in relative stability of the color parameters (L, a,
b).
The (a) value of dried materials increased significantly during air drying. The
increase of a-value denotes a more red chroma, which is indicative of the browning
reaction. Microwave and vacuum drying caused a smaller increment of redness (a),
which means that the final products are less brown than air dried ones. Freeze dried
materials showed the smaller increment of redness (a) than all the others. Thus, freeze
drying prevents browning during drying. On the other hand, the osmotically treated
samples keep their a-value relatively constant. The initial value of a-value is larger for
the osmotically pretreated samples. The relative increase, however, of a-value for all
osmotically pretreated samples is very small compared to the significant increase for
untreated samples.
Similar to the behavior of chroma parameter (a) is the increase of value of chroma
parameter b (yellowness). This value increased fast for air dried samples, as air drying at
70
°
C proceeded, followed by a smaller increment of microwave and vacuum dried ones.
Osmotically and freeze dried samples showed the smaller increment of yellowness (b).
The different behavior of dried samples under various drying methods shows that
the drying method affects significantly browning reactions that occur during drying. The
22
osmotically treated and freeze dried samples keep their color intact upon subsequent air
drying. Thus, a method for color preservation is the immersion of fruits in sugar solution.
The color preservation may be seen by the relative constant lightness parameter L
(almost constant or an insignificant decrease) and chroma parameters (a, b), which
experience only a small increase. Thus, osmotic and freeze drying seem to prevent color
deterioration during drying, resulting in products with superior color compared to that of
dried with other methods.
Figure 5. Effect of drying method on color parameters of apple
Apple
-2
2
6
10
0
300
600
Time (min)
Red
n
es
s (
a)
C onv. drying
Vacuum drying
M icrowaves
Freeze drying
O smotic deh.
C alculated
5
10
15
20
0
300
600
Time (min)
Ye
llo
wn
e
ss
(
b
)
0
40
80
0
300
600
Time (min)
L
ig
h
tne
ss
(L
)
23
3.4.2 Effect of drying conditions on optical properties
Drying conditions affect significantly the kinetics of color degradation during
drying. Thus, the color of a dried product from rapid and slow drying techniques is
very different. The effects of some drying conditions on optical properties, which
have been examined in the literature, are presented in the next paragraphs. More
specifically it is examined:
•
The effect of temperature and air humidity during conventional drying
•
The effect of temperature during vacuum drying
•
The effect of method of pre-treatment
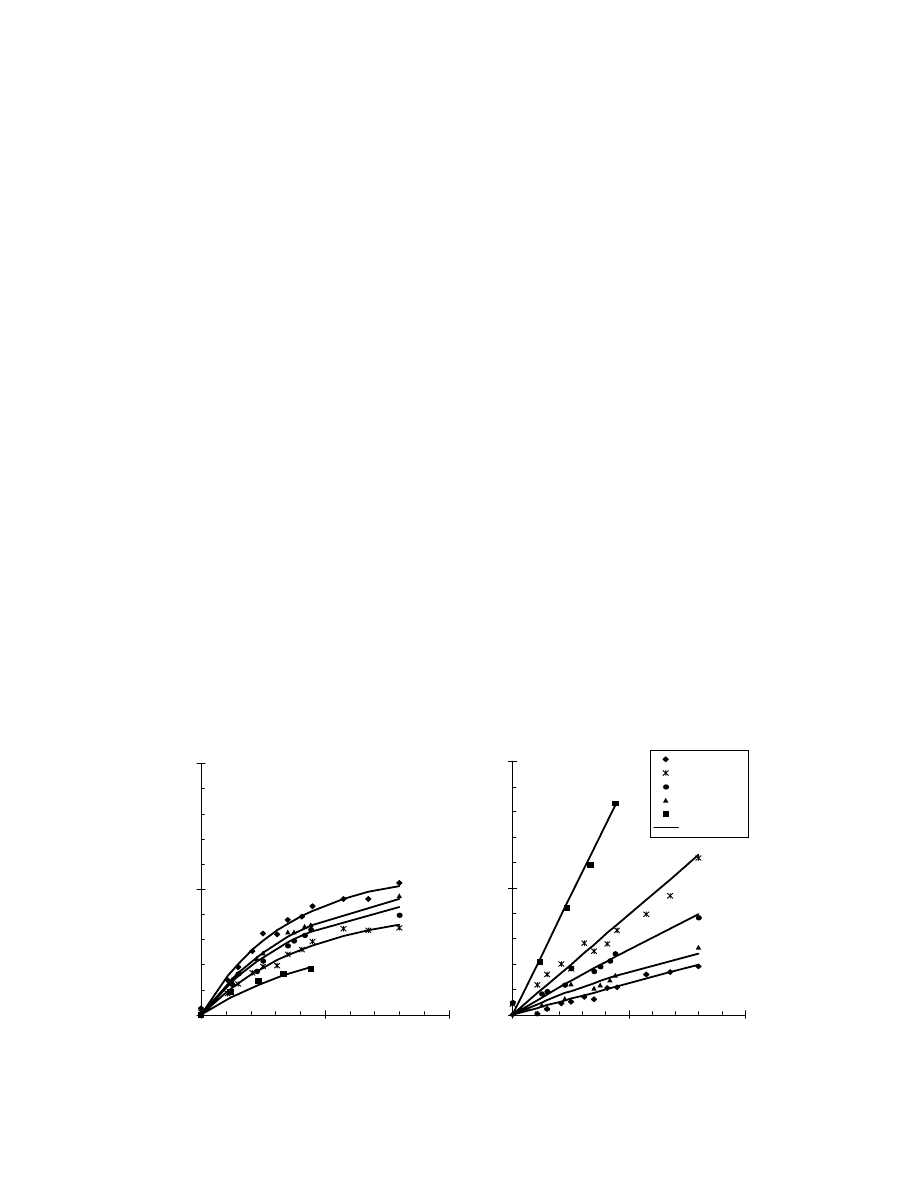
3.4.2.1 Effect of temperature and humidity during conventional drying
The lightness (L) of dehydrated materials is not affected by temperature and air
relative humidity for all the examined materials and drying methods.
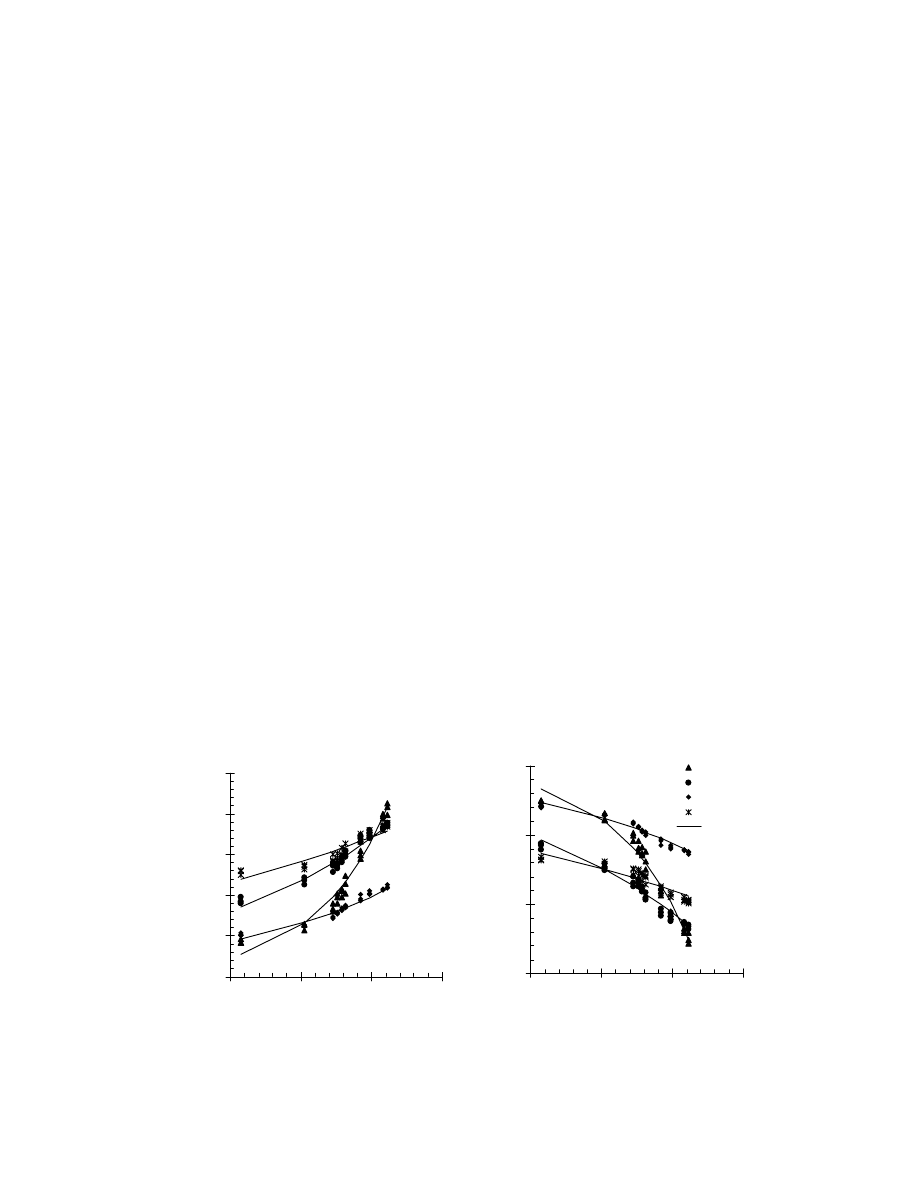
Color difference Δa during conventional drying at various temperatures and air
humidities is presented in Figure 6. It is evident that redness (a) of dehydrated
materials is strongly affected by temperature and air relative humidity. Redness
increases during drying for all the examined materials and all conditions. Redness of
dehydrated products increases as drying temperature increases and relative humidity
decreases for all yellow materials. The effect of temperature on changes of redness
during conventional drying seems to be more intense than the effect of air relative
humidity for all materials. Color changes may be associated to Maillard reactions
(Hodge, 1953).
Color difference Δb during conventional drying at various temperatures and air
relative humidities is presented in Figure 6. It is evident that yellowness (b) of
dehydrated materials is strongly affected by temperature and air relative humidity.
Yellowness (b) is increased during drying for all the examined materials and all
conditions. Yellowness of dehydrated products is increased as drying temperature
decreases and relative humidity increases, for all yellow materials (apple, potato,
banana). The effect of temperature on changes of yellowness (b) seems to be more
intense than the effect of air relative humidity, for all cases.
Figure 6 Effect of drying conditions on color parameters of air dried banana.
B a na na
0
5
1 0
0
3 0 0
6 0 0
T im e (m in)
Δ
b
B a na na
0
5
1 0
0
3 0 0
6 0 0
T im e (m in)
Δ
a
5 0 C - 1 5 %
7 0 C - 1 5 %
7 0 C - 3 0 %
7 0 C - 4 0 %
9 0 C - 1 5 %
C a lc ulated
24
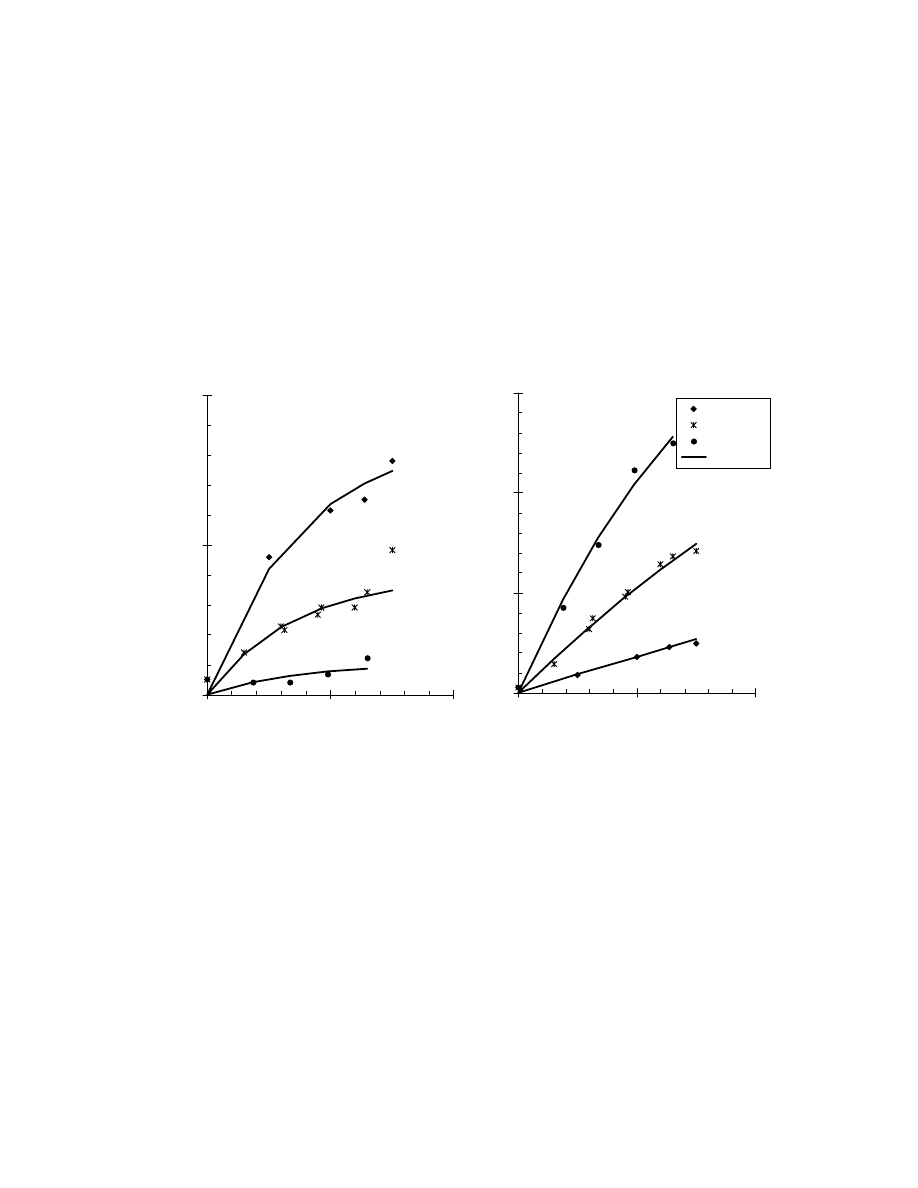
3.5.2.2 Effect of temperature during vacuum drying
Color difference Δa during vacuum drying at various temperatures is presented in
Figure 7. It is evident that redness (a) of dehydrated materials is strongly affected by
temperature. Redness of dehydrated products increases as drying temperature
increases.
Color difference Δb during vacuum drying at various temperatures is also
presented in Figure 7. It is evident that yellowness (b) of dehydrated materials is
strongly affected by temperature. Yellowness of dehydrated products is increased as
drying temperature decreases.
Figure 7. Effect of drying conditions on color parameters of vacuum dried banana.
3.4.2.3 Effect of pre-treatment on optical properties
The effect of pretreatment on color parameters of a fruit is shown in Figure 8.
Water and steam blanched materials as well as salt pretreated ones showed a
remarkable stability of lightness during drying, producing materials of high lightness
values.
Browning of fruits and vegetables during drying is typically related to both
enzymatic and non-enzymatic browning reactions. The infusion of sugars in fruits during
osmotic pretreatment causes a relative stability of color parameters (L, a, b), especially in
comparison to convective dried samples, that experienced extensive browning. This is
possibly due to the existence of sugars causing the relative inactivation of enzymes that
are responsible for the enzymatic browning. Salt, water and steam blanching also
B anana
0
4
8
12
0
200
400
Time (min)
Δ
a
50 C
70 C
90 C
C alculated
B anana
0
4
8
0
200
400
Time (min)
Δ
b
25
prevent enzymatic browning reactions, resulting in relative stability of the color
parameters (L, a, b).
The increase of "a" value denotes a deeper red chroma, which is indicative of the
browning reaction. An exception seems to be the one for carrot where redness is
relatively constant. Microwave pretreatment caused a smaller increase of "a" value,
which means that the final products are less brown than air dried ones. Salt pretreated
materials showed the smaller increase of "a" value than all others. Thus, salt
pretreatment prevents browning during drying. On the other hand, water and steam
blanched materials keep their a-value relatively constant. Steam blanching conserve
more soluble nutrients and keep the redness (a) more constant than that of water
blanching samples. Osmotic pretreatment also keep a-value relatively constant. The
initial value of "a" value is larger for the osmotically pretreated samples. The relative
increase, however, of "a" value for all osmotically pretreated samples is small indeed
compared to the significant increase for untreated samples.
Similar to the behavior of "a" value is the increase of value of chroma parameter
b value (yellowness). This value increased fast for air dried samples, as air drying at
70
°
C proceeded, followed by a smaller in of microwave dried ones. Osmotically and
water, steam, and finally salt - pretreated samples showed the smaller increment of
yellowness (b).
The different behavior of dried samples, under various types of pretreatment,
shows that the pretreatment procedure affects significantly browning reactions occurring
during drying. Osmotically treated and blanched samples keep their color intact upon
subsequent air drying. Thus, a method for color preservation is the immersion of fruits in
sugar solution or the blanching before drying. The color preservation may be seen by the
relative constant lightness parameter L (almost constant or an insignificant decrease) and
chroma parameters (a, b), experiencing only a small increase. Thus, osmotic, salt, water
and steam pretreatment seem to prevent color deterioration during drying, resulting in
products with superior color, compared to that of dried with no pretreatment.
Figure 8 Effect of pretreatment on color parameters of banana.
B a na na
- 2
2
6
1 0
0
3 0 0
6 0 0
T im e (m in)
R
e
dne
ss
(a
B a na na
0
6
1 2
1 8
0
3 0 0
6 0 0
T im e (m in)
Y
e
llo
w
n
e
ss
(
b
C o nv. d rying
W ate r b la nching
S te a m b la nching
S a lt b la nc hing
M ic ro w a ve s
O smo tic d eh.
C alc ula te d

26
2.5 Mathematical modeling
Color of dehydrated products is correlated with the drying time, considering that
color deterioration is caused by surface enzymatic reactions and is not related to the
material moisture content. In order to determine the rate of color changes during
drying, kinetics of the Hunter parameters, redness (a), yellowness (b) and lightness
(L) were investigated. It is assumed that each parameter follows first order kinetics.
The mathematical model is presented in Table 4.
Table 4
Color mathematical model
1. Color parameters
Lightness (L)
Red-Green (a)
Yellow-blue
(b)
2.Color kinetics.
t)
exp(-k
=
C
C
C
-
C
c
e
o
e
−
3. Parameters
C
o
initial
value
C
e
equilibrium
value
k
c
rate
constant
(min
-1
)
4. Factors affecting the parameters
•
Material
•
Drying method
Conventional (70
o
C, 15% RH)
Vacuum (70
o
C, 30mbar)
Osmotic pre-treatment
Microwave-conventional
Freeze
•
Drying conditions
- temperature (
o
C), air humidity (%) during conventional drying
H
T
n
n
eo
e
(H/30)
(T/70)
C
=
C
H
T
m
m
co
c
(H/30)
(T/70)
k
=
k
- temperature (
o
C) during vacuum drying
T
n
eo
e
(T/70)
C
=
C
T
m
co
c
(T/70)
k
=
k
•
Method of pre-treatment
- Water blanching
- Steam blanching
- Salt blanching
- Microwaves
- Osmotic dehydration

27
4. TEXTURAL PROPERTIES (Compression analysis)
4.1 Definition
Texture is one of the most important parameters connected to product quality.
Textural properties are usually related to mechanical tests, which examine the
viscoelastic behavior of the material.
Mechanical properties may be defined as those having to do with the behavior of
the material under applied forces. Following this broad definition, such properties as
stress - strain behavior of a material under static and dynamic loading as well as flow
characteristics of a material can be classified as mechanical properties.
The viscoelasticity is strongly related to complex quality characteristics
perceived by people as mouth feeling. Measurement techniques include the small
amplitude oscillatory compression tests, stress relaxation tests, creep tests and other
dynamic mechanical analysis tests.
A compression test is one of the most common techniques for the estimation of the
texture. The simplest approach is to measure the maximum applied force or stress at
fracture of the material. The quantification of difficult terms such as hardness and
chewiness, has been made by a methodology called Texture Profile Analysis.
The compression tests are performed applying constant deformation rate and
recording force and deformation. Stress-strain compression curves are constructed.
The compression test is usually continued until the fracture of specimens.
Textural behaviour is related to the structure of foods (Ramana & Taylor, 1994).
Textural characteristics depend on chemical and biophysical characteristics of the
products (Moshenin, 1986; Bourne, 1992; Thiagu et al., 1993). The rheological
behaviour of dehydrated products has been studied through both compression and
relaxation stresses (Bagley, 1987; Mohan Rao, 1984; Katz & Labuza, 1981). Both
tests examine the viscoelastic nature of the dehydrated materials, involving
parameters of elasticity such as the elastic modulus (E). Compression parameters,
such as maximum stress and corresponding strain, are usually investigated during
various drying methods by various researchers.
The references that are related to the textural properties of dehydrated fruits
and vegetables are presented in Table 6. The corresponding drying method and
textural parameters that each one measures is also mentioned.

28
Table 6.
References of textural properties
Material
Conditions
Textural Parameters
References
1. Agar gel
Fresh Stress
(kg/cm
2
):0.26-2.7 Peleg
1979
2. Alfalfa
Natural drying
Maximum stress (kPa): 1-7
Watts & Bilanski 1991
3. Apple
Fresh Stress
(kg/cm
2
): 0.8-2.2
Peleg 1979
Fresh
Failure force (N): 8
Peleg & Calzada 1976
Fresh
Fracturability (N): 30
Bourne & Comstock 1981
Air drying, 50
o
C
Maximum stress (kPa): 418-537
Al-Mashat & Zuritz 1993
Irradiation
Rupture force (N):230
Cathalin & McNulty 1996
Fresh
Failure stress (kPa): 360-480
Failure strain (%): 8-14
Failure energy (kPa): 17-31
Abbott & Lu 1996
Heat treated (40
o
C)
Firmness (N): 55
Strength (kPa):173
Brittleness:0.18
Stifness (kPa):1299
Lurie & Nussinovitch 1996
Fresh
Elastic modulus (MPa): 6.2-10
Intex of firmness (Hz
2
-g): 1.7-2.2 10
8
Internal fricton: 0.034-0.160
Absolute modulus (MPa): 6.7-12.6
Storage modulus (MPa): 11-16
Finney (1971; 1970)
Abbott et al. 1968
Morrow et al. 1971
Hamann & Diehl 1978
4. Banana
Air drying
Puncture force (N):0.3
Shear force (N): 1-0.3
Rupture force (N):1
Firmness (kN m-1):0.2-1
Elastic Modulus: 0.1
Ramaswamy & Tung 1989
Fresh
Stress at failure(kPa): 17
Kaletunc et al. 1991
Fresh
Elastic modulus (MPa): 0.85-2.72
Finney et al. 1967
5. Black pepper
Air drying
Failure force (N): 38-70
Failure strain (%): 16-29
Failure energy (J): 0.014-0.022
Murthy & Battacharya 1998
6. Blueberries
Osmoconv. drying
Freeze drying
Air drying
Hardness (N/mm
2
): 0.0034-0.0156
0.0013
0.0065
Nsonzi & Ramaswamy 1998
7. Bologna sausage
Fresh Stress
(kg/cm
2
): 1.9-4.6
Peleg 1979
8. Bread
Fresh
True strain: 0.94
Calzada & Peleg 1978
Fresh Stress
(kg/cm
2
): 0.3
Peleg 1979
9. Cake butter
Fresh
Shear stress (Dyne cm
-2
): ¼*10
3
Bourne
1992
10. Canola seeds
Air drying (25-55
o
C)
Total deformation (mm): 0.25-0.45
Modulus of elasticity (kPa): 5-12
Cenkowski et al. 1992

29
11. Carrot
Fresh
Fracturability (N): 200
Bourne & Comstock 1981
Irradiation
Rupture force (N): 140-180
Cathalin & McNulty 1996
Freeze drying
Maximum force (N): 4.6
Greaves et al. 1982
12. Cheese
Fresh
Stress at failure(kPa): 43
Kaletunc et al. 1991
Fresh
True strain: 0.40
Calzada & Peleg 1978
13. Cherries
Fresh
Maximum force (N): 6
Alonso et al. 1994
14. Chocolate spread
Fresh
Shear stress (Dyne cm
-2
): 1/3*10
3
Bourne
1992
15. Clay
Air drying
Maximum tensile stress (kPa): 600
Maximum comp. stress (kPa): 300
Itaya et al. 1999
Spray drying
Maximum tensile stress (kPa): 700
Maximum compres stress (kPa): 300
Gong & Mujumdar 1999
16. Condensed milk
Fresh
Shear stress (Dyne cm
-2
): 10
1
-10
4
Bourne
1992
17. Corn
Fresh
Absolute modulus (MPa): 213-675
Wen & Moshenin 1970
18. Corn kernels
Air drying (25-100
o
C)
Maximum stress (MPa):2-3
Relaxation modulus (MPa): 50-100
Waananen & Okos 1992
19. Corn meal
Extrusion
Fracture stress (kPa): 5.0-6.8
Barrett et al. 1994
Extrusion
Moisture cont: 3-31%
Compr.strength (N/mm2):5.2-15.8
Stiffness (N/mm
2
):15-257
Hakel et al. 1989
20. Cream cheese
Fresh
Fracturability (N): 0.5
Bourne & Comstock 1981
21. Cumin Seed
Air drying
Rupture force (N): 14.7
Singh & Goswami 1998
22. Frankfurter
Fresh
Stress at failure(kPa): 70
Kaletunc et al. 1991
Fresh
Fracturability (N): 10
Bourne & Comstock 1981
Fresh
Absolute modulus (MPa): 1.4-2.3
Webb et al. 1975
23. Glucose syrup
Fresh
Shear stress (Dyn cm-2):0.5*10
3
-10
5
Bourne
1992
24. Grains
Microwave drying
Max compr force (N): 60-100 N
Kudra et al. 1994
25. Grape skins
Air drying
Failure stress (MPa): 112-369
Strain energy (N cm): 0.16-0.66
Hankinson et al. 1977
26. Honey
Fresh
Shear stress (Dyne cm
-2
): 10
2
-10
4
Bourne
1992
27. Jelly candy
Fresh
Stress at failure(kPa): 190 Deform
at failure (%):50
Kaletunc et al. 1991
28. Kiwi
Osmotic dehydration
Compress force (kg): 1-10
Torreggiani et al. 1999
29. Lemon card
Fresh
Shear stress (Dyne cm
-2
): 10
2
-10
3
Bourne
1992
30. Marchmallow
Fresh
Stress at failure(kPa): 9
Kaletunc et al. 1991

30
31. Peaches
Fresh Firmness
(Hz
2
-g): 0.39-3.4x10
8
Stiffness coefficient: 0.54-1.6x10
5
Elastic modulus (MPa): 1.95-19.3
Internal friction: 0.090-0.143
Poisson’s ratio: 0.020-0.391
Absolute modulus (MPa): 4-10
Finney & Abbott 1972;
Shackford & Clark 1970;
Clark & Rao 1978
32. Peanut butter
Fresh
Shear stress (Dyn cm
-2
): 0.5*10
3
Bourne
1992
33. Pear
Fresh Stress
(kg/cm
2
): 2-3.3
Peleg 1979
Fresh
Failure force (N): 7
Peleg & Calzada 1976
Fresh
Stiffness coefficient: 9.0-10.7x10⁶
Elastic modulus (MPa):12-29
Internal friction:0.072-0.099
Shear modulus (MPa): 4.6-5.8
Poissons ratio:0.252-0.354
Amen et al. 1972
Finney 1967
34. Potato
Fresh
Stress at failure(kPa): 970
Deform at failure (%):34
Kaletunc et al. 1991
Fresh
True strain: 0.25
Calzada & Peleg 1978
Fresh Stress
(kg/cm
2
): 1-1.8
Peleg 1979
Fresh
Failure force (N): 40
Peleg & Calzada 1976
Irradiation
Rupture force (N): 20
Cathalin & McNulty 1996
Fresh
Absolute modulus (MPa): 5.9-13
Internal friction: 0.082-0.118
Elastic modulus (MPa): 5.9
Finney & Norris 1967; 1968
35. Raisins
Solar drying,
Stress (MPa) 0.1-0.3
Work (mJ): 4-8
Lewicki & Wolf 1995
Natural drying
Max Force (N): 19-98%
Lewicki & Spiess 1995
Air drying
Relaxation time (sec): 140-935
Karathanos et al. 1994
36. Rice
Fresh
Absolute modulus (MPa): 840-4200
Chattopadhyay et al. 1978
37. Soybean Cotyled
Air drying (25-55
o
C)
Compressive strength (MPa): 5-25
Tensile strength (MPa): 1-8
Liu et al. 1990
38. Squash
Fresh
True strain: 0.26
Calzada & Peleg 1978
39. Tobacco leaves
Solar drying
Elastic modulus (N/mm): 0.5-8.8
Foutz et al. 1993
40. Tomato ketchup
Fresh
Shear stress (Dyne cm
-2
): 10
1
-10
2
Bourne
1992
41. Turnips
Fresh
Absolute modulus (MPa): 7.69
Harmann & Diehl 1978
42. Water
Fresh
Shear stress (Dyne cm
-2
): 10
1
-10
2
Bourne
1992
43. Weat
Fresh, triaxial tests
Maximum stress (Mpa): 90-120
Zhang et al. 1989
Air drying
Microwave drying
Damage index 7
3
Kudra et al. 1994
Microwave drying
Compress σ
max
(Mpa): 22-27
ε (%): 5.5-6.5
Wozniak & al. 1999
44. Yogurt
Fresh
Shear stress (Dyne cm
-2
): 10
2
-10
3
Bourne
1992

31
4.2 Mathematical model of compression test
Solid and semi-solid materials behave usually as viscoelastic materials, with an
elastic and a viscous component (Peleg, 1987). The viscoelastic behavior can be
determined by compression (tension) tests. Hammerle and Mohsenin (1970)
suggested that the compression characteristics of a material could be determined from
constant deformation rate tests. Agricultural products exhibit characteristics of both
liquid and solid; and the time dependence behavior of such materials is referred to as
viscoelasticity (Mohsenin 1986). When agricultural materials and food products are
subjected to compression (or tension) tests, a fixed deformation rate (compression or
tension) is applied on a sample until there is a fracture of the sample. The force (or
stress) is measured as a function of deformation (strain), obtaining the stress - strain
curve, which provides useful information on the viscoelastic properties of the
material.
A mathematical model to describe the non-linear elastic behaviour of various
materials was proposed by Foutz et al. (1990, 1991):
σ
= Ε
ε
+ d
ε
p
Where
σ
= stress (kPa)
ε
= strain (Δl/l
o
)
Ε = elastic parameter(kPa)
d = viscoelastic parameter (kPa)
p = viscoelastic exponent
For small deformations (strains) many foods may be assumed to behave as linear
elastic materials. Thus, the first linear part of the stress-strain curve is described by
the elastic parameter (E). After that, the materials seem to follow viscoelastic
behaviour, which is described by the second viscoelastic term of the above equation.
The proposed equation does not specify the break point of the stress-strain curve,
which corresponds to the maximum stress and maximum strain observed.
.
Thus, it would be useful if the above equation included parameters such as the
maximum stress and maximum strain, which are very important for the viscoelastic
behavior of the materials. The mathematical model, which is presented in Table 7, to
describe compression behavior, involves four parameters: the maximum stress (
σ
max
),
the corresponding strain (
ε
max
), the elastic parameter (E) and the viscoelastic exponent
(p). The maximum stress and strain represent the break point of the compression test,
so they have major importance for the description of the rheological behavior of the
materials. The elastic parameter (E) represents the linear part of the stress-strain curve
and shows the elastic nature of the material. The viscoelastic exponent (p) represents
the exponential part of the curve. The greater the viscoelastic exponent is, the more
the behavior of the product deviates from linearity and becomes more viscous. All
four parameters are related to the material moisture content during drying, through
simple equations, which were extracted after data observation.

32
TABLE 17.
Compression test mathematical model
Compression Test
Viscoelastic Behavior (Stress-Strain Equation)
σ
= Ε
ε
+ (
σ
max
-E
ε
max
) (
ε
/
ε
max
)
p
Parameters
σ
max
maximum stress
(kPa)
ε
max
maximum strain
(-)
E
elastic
parameter
(kPa)
p viscoelastic
parameter
(-)
Parameter equations
σ
max
= a/X
n
+ b X
m
ε
max
=
exp
(-kX)
(1-q)+q
E=c X
r
p=g X
s
Where
σ
stress
(kPa)
ε
strain
(-)
X
moisture
content
(kg
/kg
db)
4.3 Effect of drying method on compression behavior
Some typical stress-strain curves for similar moisture contents, ranging from 0.02
to 8 kg/kg db, are presented in Fig. 9. The first part of stress strain curve is linear,
indicating the elastic behavior of the materials for small deformations. For larger
strains, stress increased sharply until the end point, indicating the viscous nature of
the material. The calculated stress - strain curve resulted from Eqn. 1. This equation
contains as parameters the maximum stress and the maximum strain, the values of
which were calculated for various moisture contents from Eqns. 2 and 3. The
maximum stress and maximum strain were denoted as the end points of the stress
strain curve (rupture point).
Figure 10 presents the compression behavior of apple during various drying
methods.
The maximum stress decreased as the moisture content was decreased during air
and vacuum drying. When the drying reached moisture contents lower than
approximately X=1.8 kg water/kg dry solids, the maximum stress in a compression
test increased considerably for both drying methods and for all the tested materials.
The osmotically treated and freeze dried samples did not attain moisture contents
higher than 1.8 kg/kg db. As a result, the shift in behaviour above this moisture
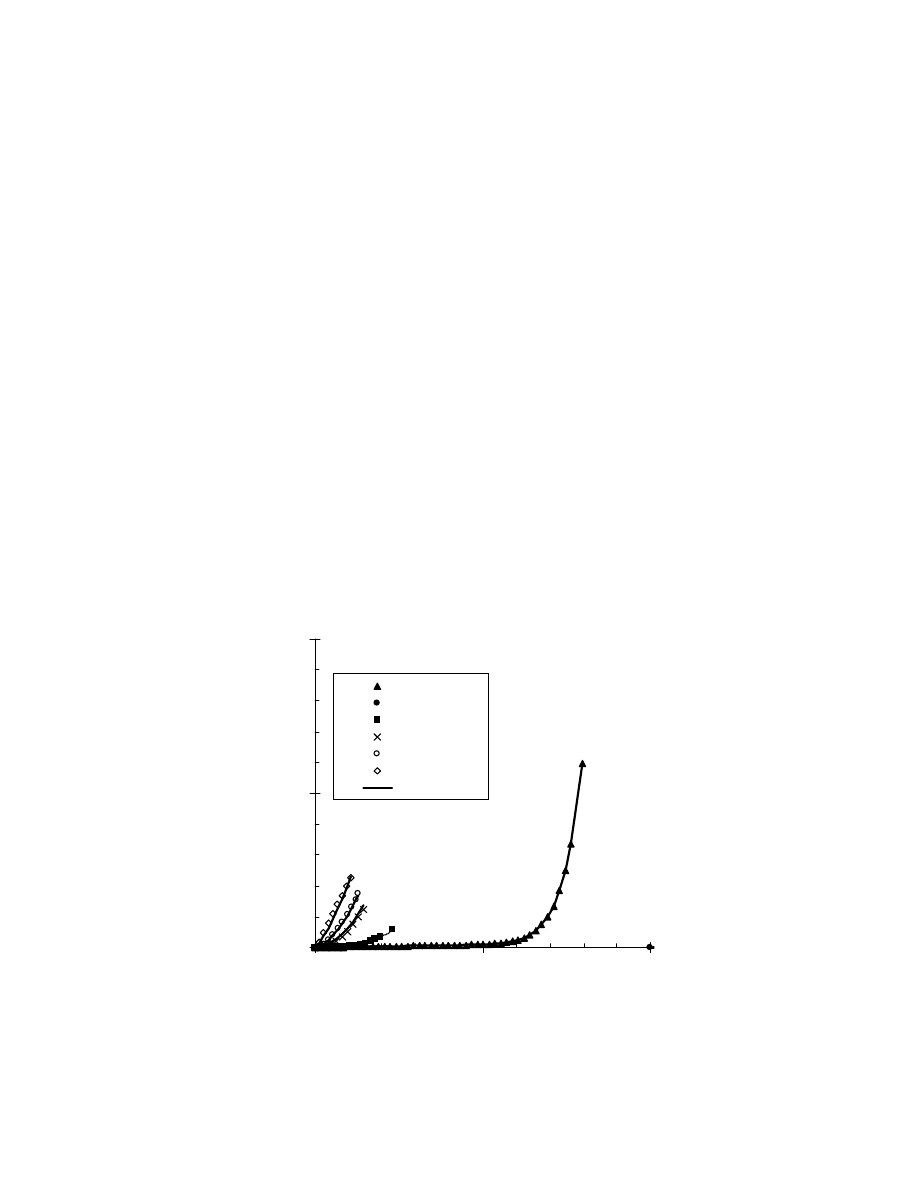
33
content was not found and the values of b and m became zero. The maximum stress
increased, as water content was decreased for both osmotic and freeze drying.
As it may be seen, the maximum strain is significantly affected by the drying
method. More specifically, maximum stress values during vacuum drying were lower
than those of conventional drying, after the critical moisture content of 1.8 kg/kg db
for all materials. On the contrary, for osmotically treated samples, maximum strain
was higher than that of air dried materials. As far as freeze dried materials are
concerned, the values of maximum stress were the lowest noticed.
The elasticity parameter was found to decrease significantly as the moisture
content of the fruits was decreased during drying, for all the drying methods and
materials (Fig. 10). The elasticity of air dried samples appears to have greater values
than the elasticity of osmotically treated samples for the same moisture content and it
gave lower values than the elasticity of vacuum dried materials. Freeze dried
materials had the highest values of elasticity parameter. Thus, it can be concluded that
osmotic dehydration reduced the elastic nature of products, while vacuum drying and
freeze drying increased their elasticity.
The parameter p of the model, which expresses the deviation from linearity and
thus the viscous nature of the material, was found to increase sharply as the moisture
content was decreased for all dehydration methods. As the parameter p becomes
larger during drying, the relative importance of the second term of stress-strain
equation is larger. Osmotic dehydration seems to increase the viscous nature of
materials, while vacuum drying decreases it, compared to conventional drying. Freeze
dried materials seem to have the lowest viscous component. This conclusion comes in
agreement with the plastisization of structure, resulting from sugars gain during
osmotic dehydration, and the fragility of structure, due to high porosity after freeze
drying.
Figure 9. Stress-stain curves of apple during drying, at various moisture contents
Apple
0
500
1000
0.00
0.50
1.00
Strain
S
tr
ess (
k
Pa
)
0.295
0.381
1.730
3.905
4.986
7.493
Calculated
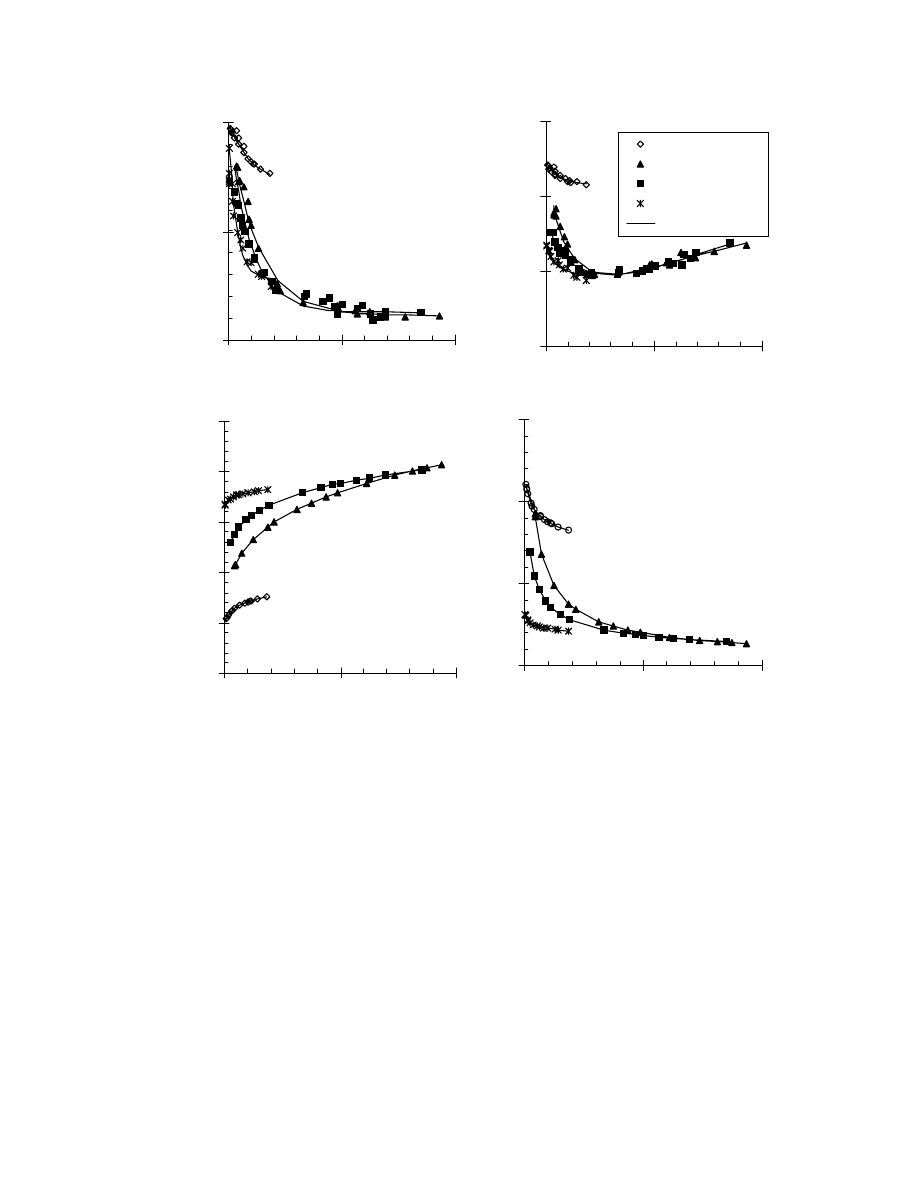
34
Figure 10 Effect of drying method on compression parameters of apple
Apple
0.0
0.5
1.0
0
4
8
M oisture Conte nt (kg/kg db)
M
a
x
imu
m S
tr
a
in
Apple
10
100
1000
10000
0
4
8
M oisture Conte nt (kg/kg db)
M
a
x
imu
m S
tr
e
ss
(
k
P
a
)
O smotic dehydr.
C onvent. drying
Vacuum drying
Freeze drying
C alculated
Apple
0
10
20
30
40
50
0
4
8
M oisture Conte nt (kg/kg db)
E
la
sti
c Pa
ra
m
e
te
r (k
Pa
)
Apple
0
5
10
15
0
4
8
M oisture Conte nt (kg/kg db)
V
is
co
e
la
st
ic
E
x
po
ne
nt

35
4.4 Compression behavior during rehydration
Considering that most of dehydrated products are rehydrated at their final use
(soups, corn flakes etc.), it is very important to know their compression behavior
during rehydration. The removal of moisture content during drying has detrimental
effects on their physical and mechanical attributes. The rehydration characteristics of
the material are influenced by processing conditions, sample composition, sample
preparation and extent of the structural and chemical disruptions induced by drying.
In Figure 11 the compression behavior of apple during rehydration is compared with
that during dehydration, using various drying methods.
Maximum stress increased as the moisture content was decreased for all drying
methods, during both dehydration and rehydration.
As it may be seen, the maximum stress is lower during rehydration than during
dehydration, depending on the drying method. More specifically, maximum stress
values during rehydration of freeze dried materials were the lowest noticed, while
osmo-freeze dried samples showed higher values of maximum stress. For air and
vacuum dried samples during rehydration, the maximum stress was a little lower than
that showed during drying.
Maximum strain increased as water was decreased for all the drying methods and
all materials during both procedures. Again, freeze dried samples showed the lowest
values during rehydration, while for air and vacuum dried ones, maximum strain was
close to that noticed during drying. Osmo-freeze dried samples had higher values of
maximum strain compared to freeze dried ones.
Thus, freeze drying seems to produce materials with fragile structure, due to loss
of elastisity of cellular structure and higher values of porosity. On the contrary,
vacuum and air drying, due to shrinkage that occurs during drying, produce more
strong materials. Osmotic dehydration seems to help freeze dried materials to keep
their structure during rehydration, due to solids gain that reinforce structure.
The elasticity parameter (E) was found to decrease significantly as the moisture
content of the samples was decreased during drying and rehydration for all the drying
methods and materials. An exemption seems to be freeze dried samples which lose
their elasticity as moisture content increases. For all cases during rehydration,
materials show lower values of elasticity than during dehydration. Freeze dried
materials have the higher values of elasticity parameter, but rehydrated products lose
their elasticity. Osmo-freeze dried products have higher elasticity. Thus it can be
concluded that during freeze drying, materials develop a structure with high porosity
values, which loses its elasticity during rehydration, due to structural disruption.
The parameter p of the model, which expresses the deviation from linearity and
thus the viscous nature of the material, was found to increase sharply as the moisture
content was decreased for all dehydration methods. Only freeze dried materials
showed an increment of viscous nature during rehydration. As it may be seen, the
rehydration process seems to increase the viscous nature of the materials. Osmotic
pretreatment seems to prevent that phenomenon due to solids gain that changes the
structure of the material. Although freeze dried materials have the best quality
characteristics, they seem to have a mushy behaviour during rehydration, by losing
their elasticity and becoming more viscous. Shrinkage that occurs during air and
vacuum drying prevents rehydration and develops products with viscoelasic behavior
comparable to that of fresh products.
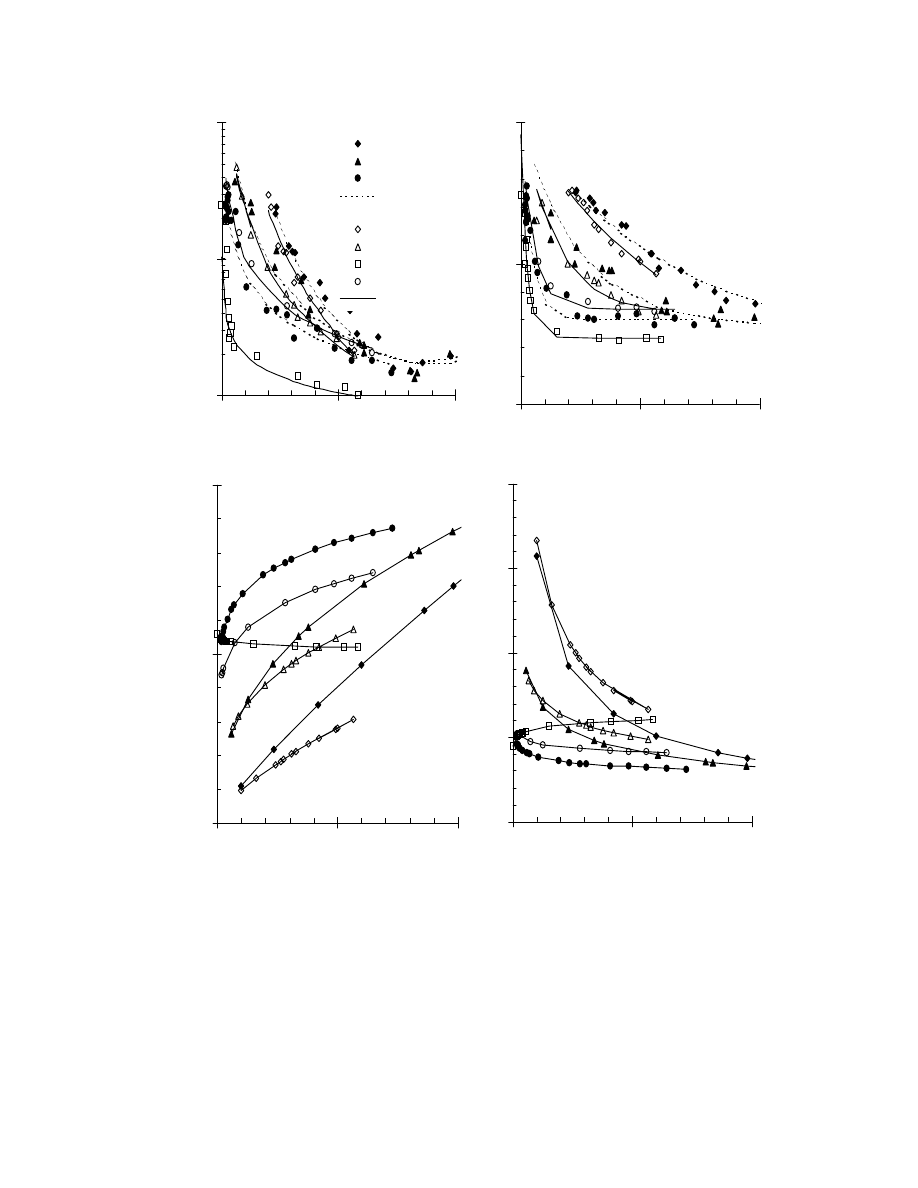
36
Figure 11. Effect of drying method on compression behavior of banana during
rehydration.
ACKNOWLEDGMENT
The authors are grateful to Professor G.D. Saravacos for his valuable suggestions.
Banana
10
100
1000
0.0
1.0
2.0
Moisture Content (kg/kg db)
M
ax
imu
m S
tr
es
s
(k
Pa
)
Dehydrated
convenentional
vacuum
freeze
calculated
Rehydrated
conventional
vacuum
freeze
osmo-freeze
calculated
Banana
0.0
0.5
1.0
0.0
1.0
2.0
Moisture Content (kg/kg db)
Maxi
m
um
St
ra
in
Banana
0
50
100
0
1
2
Moisture Content (kg/kg db)
El
as
tic P
ar
am
ete
r (k
Pa
)
Banana
0
10
20
30
40
0.0
1.0
2.0
Moisture Content (kg/kg db)
V
is
co
ela
st
ic
E
xp
on
en
t

37
REFERENCES
Abbott, J.A. & Lu, R., 1996. Anisotropic Mechanical Properties of Apples,
Transactions of the ASAE, 39(4): 1451-1459.
Abbott, J.A., Bachman, G.S., Childers, R.F., Fitzgerald, J.V. & Matusik, D., 1968.
Sonic Techniques for Measuring Texture of Fruits and Vegetables, Food Technology,
22: 101.
Al-Mashat, Zuritz, C.A., 1993. Stress Relaxation Behavior of Apple Pomace and
Effect of Temperature, Pressing Aid and Compaction Rate on Juice Yield, Journal of
Food Engineering, 20: 247-266.
Alonso, J., Canet, W. & Rodrigues, M.T., 1994. Mechanical Assessment of Texture of
Sweet Cherries: Effects of Freezing, J Sci Agric, 66: 1-7.
Amen, R.J., Ivannou, J. & Haard, N.F., 1972. Comparison of Acoustic Spectrometry,
Compression and Shear Force Measurements in Ripening Pear Fruit, Can. Inst. Food
Sci. Technol. J. 5(2):97.
Bagley, E.B., 1987, Mechanical properties of solid foods - deformation fracture and
stress relaxation, In Physical Properties of Foods - 2, ed. R. Jowitt, F. Escher, M.
Kent, B.McKenna & M. Roques. Elsevier Applied Science, London.
Barrett, A.H., Rosenberg, S. & Ross, E.W., 1994. Fracture Intensity Distributions
During Compression of Puffed Corn Meal Extrudates: Method for Quantifying
Fracturability, Journal of Food Science, 59(3): 617-620.
Bolin, H.R. & Steele, R.J. (1987). Nonenzymatic browning in dried apples during
storage. Journal of Food Science, 52(6): 1654-1657.
Bonazzi, C.L., Wolff, E. & Gilbert, H., 1992. Quality of Dehydrated Cultivated
Mushrooms (Agaricus bisporus): A Comparison between different Drying and Freeze
Drying Processes, Lebensm.-Wiss. u.-Technol., 25: 334-339.
Bourne, M.C. & Comstock, S.H., 1981. Effect of Degree of Compression on Texture
Profile Parameters. J. Texture Studies, 12: 201-216.
Bourne, M.C., 1992, Calibration of rheological techniques used for foods, Journal of
Food Engineering, 16: 151-63.
Calzada, J.F. & Peleg, M., 1978. Mechanical Interpretation of Compressive Stress-
Strain Relationships of Solid Foods, 43: 1087-1091.
Cathalin, J. & McNulty, P., 1996. Textural Gain and Subsequent Loss in Irradiated
Apples, Carrots and Potatoes with Increase in Dose from 0.03 to 1.0 kGy, Journal of
Food Process and Preservation, 20: 403-415.

38
Cenkowski, S., Zhang, Q., Bielewicz, J. & Britton, M.G., 1992, Effects of maturity
stage on mechanical properties of canola Seeds, Transactions of ASAE, 35(4): 1243-
1248.
Chattopadhyay, P.K., Hamann, D.L. & Hammerle, J.R., 1978. Dynamic Stiffness of
Rice Grain, Transactions of the ASAE, 21: 786.
Chua, K.J., Mujumdar, A.S., Chou, S.K., Hawlader, M.N.A. & Ho, J.C., 1999. Heat
Pump Drying of Banana, Guava and Potato Pieces: Effect of Cyclical Variations of
Air Temperature on Convective Drying Kinetics and Color Changes, Drying
Technology, In print.
Clark, R.C. & Rao, V.N.M., 1978. Dynamic Testing of Fresh Peach Texture,
Transactions of the ASAE, 21: 777.
Clydesdale, F.M. & Podlesney, Jr., 1968. A computer program for the interconversion
of color data. Color Engin: 55-56.
Donsi, G., Ferrari, G. & Nigro, R., 1996, The Effect of Process Conditions on the
Physical Structure of Dehydrated Foods, Food and Bioproducts Processing, Vol. 74,
No C2,: 73-80.
Du Toit, J. & Joubert, E., 1998. Effect of Drying Conditions on the Quality of
Honeybush Tea (Cyclopia), Journal of Food Processing Preservation, 22: 493-507.
Dybowska, B.E. & Fujio, Y., 1998. Optical Properties of the Pre-gel and Gel State of
Soy Proteins Gelled by GDL Under Different Physical Conditions, 35: 471-482.
Eagerman, B.A. 1978. Orange juice color measurement using general purpose
tristimulus colorimeters. J. Food Science, 43(2): 428-431.
Eshtiaghi, M.N., Stute, R. & Knorr, D., 1994. High-Pressure and Freezing
Pretreatment Effects on Drying, Rehydration, Texture and Color of Green Beans,
Carrots and Potatoes, Journal of Food Science, 59(6): 1168-1170.
Finney, E.E. Jr., & Norris, K.H., 1967. Sonic Resonant Methods for Measuring
Properties Associated with Texture of Irish and Sweet Potatoes, J. Am. Soc. Hort.
Sci., 90: 275.
Finney, E.E. Jr., & Norris, K.H., 1968. Instrumentation for Investigating Dynamic
Mechanical Properties of Fruits and Vegetables, Transactions of the ASAE, 11: 94.
Finney, E.E. Jr., 1967. Dynamic Elastic Properties of Some Fruits During Growth and
Development, J. Agric. Eng. Res., 12: 249.
Finney, E.E. Jr., 1970. Mechanical Resonance within Red Delicious Apples and
relation to fruit texture, Transactions of the ASAE, 13: 177.
Finney, E.E. Jr., 1972. Vibration technique for testing fruit firmness, J. Texture
Studies, 3: 263.

39
Foutz, T.L., Abrams, C.F. Jr., Suggs, C.W., 1993. A Proposed Phenomenological
Model to Characterize Mechanical Properties of Flue-Cured Tobacco Leaves,
Transactions of the ASAE, 36(4): 1203-1206.
Gong, Z.X. & Mujumdar, A.S., 1999. Drying of Clay and Nonclay Media: Heat and
Mass Transfer and Quality Aspects, Drying Technology, 16(6): 1119-1151.
Greaves, D.W., Rahman, A.R. & Burns, E.E., 1982. Effect of Selected Plasticization
Treatments and Storage on Freeze-Dried and Compressed Carrots Bars, Journal of
Food Science, 47: 1749-1750.
Gross, M.O., 1979. Chemical Sensory and Rheological Characterization of Low-
Methoxyl Pectin gels, Ph.D. dissertation, Univ. of Georgia, Athens.
Halek, G.W., Paik, S.W. & Chang, K.L.B., 1989. The Effect of Moisture Content on
Mechanical Properties and Texture Profile Parameters of Corn Meal Extrudates,
Journal of Texture Studies, 20: 43-55.
Hamann, D.D. 1969. Dynamic Mechanical Properties of Apple Fruit Flesh,
Transactions of the ASAE, 12: 170.
Hamann, D.D., Diehl, K.C., 1978. Equation for the Dynamic Complex Uniaxial
Compression Modulus of Spheroidal Shaped Foods, Transactions of the ASAE, 21:
1009.
Hankinson, B., Rao, V.N.M. & Smith, C.J.B., 1977. Viscoelastic and Histological
Properties of Grape Skins, Journal of Food Science, 42: 632-625.
Howard, L.R., Braswell, D.D. & Aselage, J., 1996. Chemical Composition and Color
of Strained Carrots as Affected by Processing, 61(2): 327-330.
Jasper, R.F. & Blanshard, J.M.V., 1973. A Simple Instrument for the Measurement of
the Dynamic Elastic Properties of Foodstuffs, J. Texture Studies, 4: 269.
Kaletung, G., Normand, M.D., Johnson, E.A. & Peleg, M., 1991. “Degree of
Elasticity” Determination in Solid Foods, Journal of Food Science, 56(4): 950-954.
Karanidis, A.N., & Lee, T.C., 1996, Novel Method for the Production of Color-
Compatible Ferrous Sulfate-Fortified Simulated Rice through Extrusion, J. Agric.
Food Chem, 44: 522-525.
Karathanos, V.T. & Saravacos, G.D., 1993, Porosity and pore size distribution of
starch materials, J. Food Engin. 18, 259-280.
Karathanos, V.T., Kostaropoulos, A.E. & Saravacos, G.D., 1994, Viscoelastic
Properties of Raisins, J. Food Engng., 23: 481-90.

40
Katz E.E. & Labuza T.P., 1981. Effect of water activity on the sensory crispness and
mechanical deformation of snack food products, Journal of Food Science, 46, 403-
409.
Krokida, M.K. & Maroulis Z.B., 1997. Effect of Drying Method on Shrinkage and
Porosity, Drying Technology, 10(15): 1145-1155.
Krokida, M.K., Karathanos V.T. & Maroulis Z.B., 1998a. Viscoelastic Behavior of
Dehydrated Carrot and Potato, Drying Technology, 16(3-5): 687-703.
Krokida, M.K., Maroulis, Z.B. & Saravacos, GD, 1999a, Effect of Drying Method on
Color of Dehydrated Products, Int. Journal of Food Science and Technology, in print.
Krokida, M.K., Tsami, E., & Maroulis, Z.B., 1998b. Kinetics on Color Changes
During Drying of Some Fruits and Vegetables, Drying Technology, 16(3-5): 667-685.
Krokida, M.K., Zogzas, N.P., & Maroulis, Z.B., 1997, Shrinkage and Porosity During
Drying. Modeling the Effect of Vacuum. , International Journal of Food Science and
Technology, 32: 445-458.
Κrokida, M.K., Karathanos, V.T. & Maroulis, Z.B., 1998c Effect of Freeze Drying
Conditions on Shrinkage and Porosity of Dehydrated Agricaltural Products, Journal of
Food Engineering, 38, 381-392.
Kudra, T. and Strumillo, C. (eds.), 1998. Thermal Processing of Bio-materials,
Gordon and Breach Sci Publ., Amsterdam, The Netherlands, 669p.
Kudra, T., Niewczas, J., Raghavan, G.S.V. & Scot, B., 1994. Quality Aspects in
Microwave dried Grain, NABEC Conference.
Lewicki, P.P. & Spiess, W.E.L., 1995. Reological Properties of Raisins: Part I
Compression Test, Journal of Food Engineering, 24: 321-338.
Lewicki, P.P., & Wolf, W., Rheological Properties of Raisins: Part II. Effect of Water
Activity, Journal of Food Engineering, 26: 29-43.
Li, Y., Zhang, Q., Puri, V.M. & Manbeck, H.B., 1989. Physical Properties Effect on
Stress-Strain Behavior of Wheat en Masse-Part I. Load Dependence on Initial Bulk
Density and Moisture Content, Transactions of the ASAE, 32(1): 194-201.
Liu, M., Haghighi, K., Stroshine, R.L., & Ting, E.C., 1990. Mechanical Properties of
the Soybean Cotyledon and Failure Strength of Soybean Kernels, Transactions of the
ASAE, 33(2): 559-566.
Lozano, J.E. & Ibarz, A., 1997. Colour Changes in Concentrated Fruit Pulp During
Heating at High Temperatures, Journal of Food Engineering, 31: 365-373.
Lozano, J.E., Rotstein, E. & Urbicain, M.J., 1980, Total Porosity and Open-Pore
Porosity in the Drying of Fruits, Journal of Food Science, 45 pp. 1403-1407.

41
Lozano, L.E., Rotstein, E. & Urbicain, M.J., 1983, Shrinkage, Porosity and Bulk
Density of Foodstuffs at Changing Moisture Contents, Journal of Food Science, 48
pp. 1497-1502.
Lurie, S., & Nussinovitch, A., 1996. Compression Characteristics, Firmness and
Texture Perception of Heat Treated and Unheated Apples, Int. J. Food Sci. and
Technology, 31: 1-5.
Madamba, P.S., Driscoll, R.H. & Buckle, K.A., 1993, Bulk Density, Porosity and
Resistance to Airflow of Garlic Slices, Drying Technology, 11(7) pp. 1837-1854.
Madamba, P.S., Driscoll, R.H. & Buckle, K.A., 1994, Shrinkage, Density and
Porosity of Garlic during Drying, Journal of Food Engineering, 23 pp. 309-319.
Marinos, G., 1983. Texture Evaluation of Fresh and Canned Pears by Sensory
Chemical and Rheological Characterization, M.S. thesis, Univ. of Georgia, Athens.
Marousis, S.N. & Saravacos, G.D., 1990. Density and Porosity in Drying Starch
Materials, Journal of Food Science, 55(5), 1367-1372.
Marousis, S.N., Karathanos, V.T. & Saravacos, G.D., 1989, Effect of Sugar on the
Water Diffusivity in Hydrated Granular Starches, Journal of Food Science, 54(6) pp.
1496-1552.
Martinez-Bustos, F., Delgado, L.L. & Victorio, M.G., 1996. Characterization of
Brown and Milled Yellow Rice and Development of an Expanded Snack, J. Sci Food
Agric. 72: 148-154.
Mavroudis, N.E., Gekas, V. & Sjoholm, I., 1998. Osmotic Dehydration of Apples.
Shrinkage Phenomena and the Significance of Initial Structure on Mass Transfer
Rates, 38: 101-123.
McGaw, D.R., Maharaj, L. & Comissiong, E., 1998, The Effect of Drying Conditions
on the Quality of Turmeric (Curcuma longa L.), International Drying Symposium ’98,
proceddings??
Mohan Rao N., 1984. Dynamic force-deformation properties of foods, Food
Technology, 103-109.
Mohsenin, N., 1986, Physical Properties of Plant and Animal Materials, 2
th
edn
Gordon and Breach, London pp.650-700.
Morrow, C.T. & Hamann, D.D., Moshenin, N.N. & Finney, E.E. Jr., 1971,
Mechanical Characterization of Red Delicious Apples. Paper presented at ann.
Meeting, Am. Soc. Agric. Eng., Pullman, WA.
Muftugil, N, 1986. Effect of Different Types of Blanching on the Color and the
Adsorbic Acid and Chlorophyll Contents of Green Beams, Journal of Food Processing
and Preservation, 10: 69-76.

42
Murthy, C.T. & Bhattacharya, S., 1998. Moisture Dependent and Uniaxial
Compression Properties of Black Pepper, Journal of Food Engineering, 37, 193-205.
Nsonzi, F. & Ramaswamy, H.S., 1998. Quality of Osmo-Convective Dried
Blueberries, Drying Technology, 16(3-5): 705-723.
Odland, D. and Eheart, M.S., 1975. Ascorbic acid, mineral and quality retention in
frozen broccoli blanched in water, steam and amonia stream, J. Food Sci. 40:1004-
1007.
Park, J.W., 1995. Surimi Gel Colors as Affected by Moisture Content and Physical
Conditions, 60(1): 15-18.
Peleg, M. & Calzada, J.F., 1976. Stress Relaxation of Deformed Fruits and
Vegetables, Journal of Food Science, 41: 1325-1329.
Peleg, M., 1979, The basics of solid foods rheology, In Food Texture: Instrumental
and Sensory Measurement, ed. H.R. Moskowitz, Marcel Dekker, New York, pp. 3-33.
Peterson, C.L. & Hall, C.W., 1974. Thermorheological Simple Theory Applied to the
Russet Burbank Potato, Transactions of the ASAE, 17: 546.
Quenzer, N.M. & Burns, E.E., 1981. Effects of Microwave, Steam and Water
Blanching on Freeze-Dried Spinach, Journal of Food Science, 46: 410-413.
Raghavan, G.S.V. & Venkatachalapathy, K., 1999. Shrinkage of Strawberries during
Microwave Drying, Drying Technology, 17(10): 2309-2321.
Rahman, M.S. & Potluri, P.L, 1990, Shrinkage and Density of Squid Flesh during Air
Drying, Journal of Food Engineering, 12 pp. 133-143.
Ramana S.V. & Taylor A.J., 1994. Effect of various agents on rheological properties
of carrot cells and protoplasts, Journal of Science of Food Agriculture, 64, 519-525.
Ramaswamy, H.S. & Tung, M.A., 1989. Technical note: Textural Changes as Related
to Colour of Ripening Bananas, Int. J. of Food Science and Technology, 24: 217-221.
Rao, V.N.M., Hamann, D.D., & Purcell, A.E., 1976. Dynamic Structural Properties of
Sweet Potato, Transactions of the ASAE, 19: 771.
Rapusas, R.S., Driscoll, R.H. & Srzednicki, G.S., 1995, Bulk Density and Resistance
to Airflow of Sliced Onions, Journal of Food Engineering, 26 pp. 67-80.
Ratti, C., 1994, Shrinkage During Drying of Foodstuffs, Journal of Food Engineering,
23 pp. 91-105.
Reppa, A., Mandala, J., Kostaropoulos, A.E., Saravacos, G.D., 1999. Influence of
Solute Temperature and Concentration on the Combined Osmotic and Air Drying,
Drying Technology, 17(7&8): 1449-1458.

43
Rocha, T., Lebert, A. & Marty-Audouin, C., 1993. Effect of Pretreatments and Drying
Conditions on Drying Rate and Colour Retention of Basil (Ocimum basilicum),
Lebensm.-Wiss. u.-Technol., 26: 456-463.
Sapers, G.M. and Ziolkowski, M.A. 1987. Comparison of erythorbic and ascorbic
acids as inhibitors of enzymatic browning in apple. J. Food Science, 52(6): 1732-
1733, 1747.
Saravacos G.D., 1993. Technological Developments in Fruit and Vegetable
Dehydration, in Food Flavor, Ingredients and composition, G. Charalambous (Ed.),
Elsevier Science Publ., 389-404.
Saravacos, G.D., 1967. Effect of the Drying Method on the Water Sorption of
Dehydrated Apple and Potato, J. Food Sci., 32(1): 81-84.
Sayavedra-Soto, L.A. & Montgomery, M.W., 1988. Response Contour Diagrams to
Describe Effects of Moisture, Storage Temperature and Sulfur Dioxide on Color of
Dried Apples, Journal ??? 53(2), 643-644.
Senter, S.D., Forbus JR., W.R., Nelson, S.O. & Horvat, R.J., 1984. Effects of
Dielectric and Steam Heating Treatments on the Pre-Storage Color Characteristics of
Pecan Kernels, Journal ??? 49: 1532-1534.
Shackelford, P.S.Jr. & Clark, R.L., 1970. Evaluation of Peach Maturity by
Mechanical Resonance. Paper presented at Ann. Meeting, Am. Soc. Agric. Eng.,
Chicago.
Shin, S. & Bhowmik, S.R., 1995. Thermal Kinetics of Color Changes in Pea Puree,
Journal of Food Engineering, 24: 77-86.
Singh, K.K. & Goswami, T.K., 1998. Mechanical Properties of Cumin Seed
(Cuminum cyminum Linn.) under Compressive Loading, Journal of Food
Engineering 36: 311-321.
Sjoholm, I., & Gekas, V., 1995. Apple Shrinkage upon Drying, Journal of Food
Engineering, 25: 123-130.
Skrede, G., 1985. Color Quality of Blackcurrant Syrups During Storage Evaluated by
Hunter L’, a’, b’ Values, Journal of Food Science, 50: 514-517.
Skrede, G., Wrolstad, R.E., Lea, P. & Enersen, G., 1992. Color Stability of
Strawberry and Blackcurrant Syrups, Journal of Food Science, 57: 172-177.
Sokhansanj, S. & Patil, R.T., 1996. Kinetics of Dehydration of Green Alfalfa, Drying
Technology, 14(5): 1197-1234.
Soponronnarit, S., Wetchacama, S., Swasdisevi, T. & Chotijukdikuld, P., 1999.
Effects of Drying, Tempering and Ambient Air Ventilation on Quality and Moisture
Reduction of Corn, Drying Technology, 17(6): 1227-1238.

44
Suarez, C. & Viollaz, P.E., 1991. Shrinkage Effect on Drying Behavior of Potato
Slabs, Journal of Food Engineering, 13: 103-114.
Suzuki, K., Kubota, K. Hasegawa, T. & Hosaka, H., 1976, Shrinkage in Dehydration
of Root Vegetables Journal of Food Science, 41 pp. 1189-1193.
Teotia, M.S., Ramakrishna, P., 1989, Densities of Melon Seeds, Kernels and Hulls,
Journal of Food Engineering, 9 pp. 231-236.
Thiagu R., Chand N. & Ramana K.V.R., 1993. Evolution of mechanical
characteristics of tomatoes of two varieties during ripening, Journal of Science of
Food Agriculture, 62, 175-183.
Torreggiani, D., Forni, E., Maestrelli, A. & Quadri, F., 1999. Influence of Osmotic
Dehydration on Texture and Pectic Composition of Kiwifruit Slices, Drying
Technology 17(7&8): 1387-1397.
Vagenas, G.K., Marinos-Kouris, D., Saravacos,G.D., 1990, Thermal Properties of
Raisins, Journal of Food Engineering, 11 pp. 147-158.
Voirol, F. 1980. The blanching of vegetables and fruits. A study of the literature and
some practical applications. Roche Information Service
Waananen, K.M. & Okos, M.R., 1992. Stress-Relaxation Properties of Yellow-Dent
Corn Kernels under Uniaxial Loading, Transactions of the ASAE, 35(4): 1249-1257.
Waliszewski, K.N., Cortes, H.D., Pardio, V.T. & Garcia, M.A., 1999. Color
Parameters Chenges in Banana Slices During Osmotic Dehydration, 17(4&5): 955-
960.
Watts, K.C., & Bilanski, W.K., 1991, Stress relaxation of alfalfa under constant
displacement, Trans. ASAE, 34(6) : 2491-98.
Webb, N.B., Rao, V.N.M., Civille, G.V., & Hamann, D.D., 1975. Texture evaluation
of Frankfurters by Dynamic Testing, J. Texture Studies, 6: 329.
Wen, P.R. & Moshenin, N.N., 1970. Measurement of Dynamic Viscoelastic
Properties of Corn Horny Endosperm, J. Materials 5(4): 856.
Wozniak, W., Niewczas, J. & Kudra, T., 1999. Internal Damage vs. Mechanical
Properties of Microwave-Dried Wheat Grain, International Agrophysics, 13(2): in
Print.
Zhao, Y.P. & Chang, K.C.,1995. Sulfite and Starch Affect Color and Catotenoids of
Dehydrated Carrots (Daucus Carota) During Storage, Journal of Food Science, 60(2):
324-326.
Wyszukiwarka
Podobne podstrony:
033 Drying of Fibrous Materials
Modeling with shrinkage during the vacuum drying of carrot (daucus carota) (Arévalo Pinedo, Xidieh M
Simulation of convection microwave drying for a shrinking material
Microwave vacuum drying of porous media experimental study and qualitative considerations of interna
the Placement tests for Speakout Speakout Overview of Testing Materials
Influence of drying methods on drying of bell pepper (Tunde Akintunde, Afolabi, Akintunde)
Change the look of your?ckground
Far infrared and microwave drying of peach (Jun Wang, Kuichuan Sheng)
Changes in Levels of Phosphorus Metabolites in Temporal Lobes of Drug Naive Schizophrenic Patients
Microwave Application in Vacuum Drying of Fruits (Drouzaf, H SchuberP)
Investigations of White Layer Formation During Machining of Powder Metallurgical Ni Based ME 16 S
Microwave vacuum drying of model fruit gels (Drouzas, Tsami, Saravacos)
A Review of Energetic Materials Synthesis
63 907 917 Chemical Depth Profiling of Tool Materials Using Glow Discharge Optical Emission
Increased diversity of food in the first year of life may help protect against allergies (EUFIC)
041 Drying of Polymers
039 Drying of Biotechnological Products
1960 Security During War of the Great Day of God the Almighty (Bezpieczeństwo podczas wojny wielkieg
więcej podobnych podstron